In an eCommerce business, there is a lot to keep tabs on, like; how are sales this week? How much profit did you make this week? How much traffic and sales are your marketing campaigns generating?
Which marketing strategy is bringing in the most revenue? And so on.
To boost marketing efforts and make an intelligent business move, you need data on how your eCommerce platform is doing.
But all these can be so hard to keep up with. And that’s where an eCommerce dashboard comes in.
An eCommerce dashboard will unite all the most critical metrics and critical analytics data into one place and help keep all teams on the same page.
While giving you a quick, concise overview of your business’s bottom line with just one look.
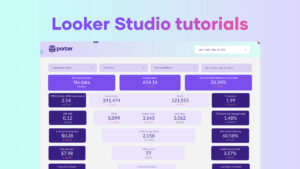
In this post, I will give a step-by-step guide on creating your own Looker Studio eCommerce dashboard and the benefits of building one.
What are the Benefits of a Google Data Studio eCommerce Dashboard?
1. Overview Performance
You can visualize your business performance with just one look at the dashboard.
From a glance, you will be able to know the amount of revenue being generated, which marketing campaign drives the most traffic to the site, how you are selling products, your conversion rate, and your target customer.
2. Visitor behavior analysis
A visitor sees an Ad online, follows the Ad to your eCommerce store, and makes purchases. Simple! But it is not always like that. In reality, a purchase isn’t always linear.
A prospective customer may often check out the store, check different products, add them to the cart, and leave.
It might be long before such customers revisit you and then make purchases. This is where the Visitor behavior analysis comes in.
With it, you will understand how your customers are moving along the conversion funnel and what page is the most popular on your eCommerce store.
Understanding this process will influence your decision to create a campaign that will be helpful and appealing to a prospective customer.
3. Order details
Tracking sales or order data with this page is so easy. With one glance, you will have all the information about where your sales are coming from. This page will also give you insight into new vs. old customers.
4. Marketing performance
There are so many ad channels out there, but as a business owner, buying ads blindly is not a smart move. You should find the marketing channels that work best for your brand and customer and stick to them.
By using the ‘Marketing Performance,’ you can find the channel that drives the most traffic and customers for your brand.

How to Create an eCommerce Dashboard on Data Studio
One of the features of Google Data Studio is that it allows you to pull data from various data sources like Google Analytics, Google Ads, Google sheets, Facebook Ads, and others using an in-built connecter.
There is also a marketplace on Google Data Studio where you can buy third-party connectors to even more data sources like Shopify, Facebook, Youtube Ads, Mailchimp, etc.
To create an eCommerce dashboard on Google Data Studio, you need to use connectors to pull data from data sources and connect it to the data studio.
Porter Metrics is a third-party connector that allows you to connect easily to your data sources and pull all data needed to create your eCommerce dashboard in google.
And in this section, we will show you how to create a simple eCommerce dashboard and share it with others.
1. Creating a new report
The first thing is to open Google Data Studio and see an overview of its user interface. In the illustration below, you can see the option to create a blank report or use built-in templates.
But in this case, let’s use the blank report for easy understanding.

If you are not new to Data Studio and have already created some reports, you will see the report in the middle of the page.
To start, click on the blank report.

2. Connect Google Data Studio to Data Source
After clicking on the blank report, you will be redirected to a page where you will be asked to ‘Add Data Source.’ You can pull data to add to your dashboard.
N:B: You can only use a partner connector to import your eCommerce data into your dashboard.
Portermertics lets you connect your eCommerce Shopify and Woocommerce data to Google Data Studio.


Next is to connect your dashboard to a data source. Choose the data source you want to use for the eCommerce dashboard and then ‘Authorise’ access to the account and click ‘Add.’

3. Basic Settings
You can proceed to rename the report before setting basic things.

After you rename, you click on ‘Theme and Layout,’ then click on ‘Layout’ to change the header visibility.
Change the header visibility to ‘Initially hidden’; the navigation type should also be set to ‘Hidden.’ For the Display mode, set it to ‘Fit to width’ and the Canva Size to ‘US letter (4:3) – Landscape’.

Then we go back to click on ‘Theme’ to choose what theme to use for your dashboard; we can choose the default theme or a predefined one. You can customize the dashboard as you prefer.

You can use the Text button to add text to your dashboard and customize the font, size, background color, and so on.

You can change the basic settings to your preference.
4. Add Scorecards
You can add scorecards to show metrics and KPIs critical to your eCommerce store. Click on ‘Add a chart’ and then click on ‘Scorecard.’

The scorecard can be customized to your preference using the ‘Style’ sector on the left side of the report by changing the font, size, background color, etc.

The scorecard can also be duplicated to create scorecards for other metrics, like Product Detail Views, Revenue, Average Order Value, and Ecommerce Conversion Rate, that you want to include in your eCommerce dashboard.
To make duplicates of the scorecards, right-click and click on duplicate or copy and paste the already created scorecard.
Only the metrics of the new card will need changing; the styling and configuration remain intact.
5. Create a Table showing various eCommerce metrics by Source/Medium
To create the table, click on ‘Add Chart’ in the toolbar above the report, then select any preferable table of your choice from the dashboard.

Once the table has been created, you can customize it by including as many metrics as you want to keep track of, just as shown in the diagram below.

To choose possible dimensions and metrics for your table, click on the ‘Setup’ sector on the left sidebar.

6. Add Timeline Charts to Show Trends
The timeline chart or time chart is mainly used to see the performance of a KPI or metrics over a chosen period.
Add a timeline chart to your report to show some trends. Click on ‘Add a Chart’ and click on a time chart.

The appearance of the time chart can be customized to your preference. Click on the ‘Style’ tab on the left toolbar and personalize the color, grid, border, and others to your preference.
7. Add a Bar Chart showing eCommerce metrics by Channel Grouping.
You can also add a bar chart showing various key eCommerce metrics. To add a bar chart, click on ‘Add a chart’ and choose ‘Bar chart.

Drag the bar chart to where you want to place it on the dashboard and drop it. Next, customize the bar chart to your preference by using the ‘Style’ sector on the right side of the dashboard.
Change the bar chart to a vertical bar in the ‘Bar chart’ section under ‘Style.’

8. Add Line Chart
Line charts are mainly used when you want to examine how your data changes or fluctuates, either over a specific time or when measured against a non-time dimension.
To add a line chart, click on ‘Add a Chart’ and select ‘line chart.’


Customize the chart’s appearance using the ‘Style’ tab on the right side of the dashboard.
9. Add Treemap with multiple Optional Metrics.
Treemap is also another way used to display data. Your data is organized into dimension hierarchies in a treemap. It uses color and size to display the value of the dimension.
To add a treemap to your dashboard, click on ‘Add a Chart,’ scroll down and select ‘Treemap.’


10. Add Scatter Chart with multiple Dimensions.
When building an eCommerce dashboard, you should add a scatter chart to the dashboard. To find associations between variables, use scatter and bubble charts.
A trendline that shows the relationship between the chart’s variables can also be used in scatter charts. Click ‘Add a Chart’ on the toolbar above the dashboard and select ‘Scatter chart.’


11. Add a Pie Chart to Show Gender Distribution
You can use a Pie chart to show the gender distribution. Click on ‘Add a Chart’ to create a pie chart.


12. Add Geo Map showing Countries, Regions, and Cities
A Geo chart makes it simple to see how a metric changes in a region. To create a geo map, click on ‘Add a Chart,’ then select ‘Geo chart.’


Next, use the ‘Setup’ tab to set the geographic dimensions and choose your preferred optional metrics.

13. Add a Dynamic Date Range Selector
You can add a date range selector to the report so that the viewer can change the report’s time period.
To add a date selector, click on the `Add a control’ icon at the top of the dashboard, then click on ‘date range control.’
Drag the date selector and place it anywhere in your dashboard, then customize it to your preference using the ‘Date range control Properties’ tabs.

This will make it easy for the viewer to choose the date range of the report they would like to view.

14. Add Filter Controls
Interactive filters let users explore and find answers on their own.
Your reports and dashboards can be considerably more dynamic and valuable with filters than by developing separate pages and charts for each possible combination.
For virtually every dimension in your data source, you can add interactive filter controls in Data Studio.
To add a filter control widget to the report, click on the Add a control’ icon, and select from the list. Data studio has a drop-down list, fixed-size list, input box, advanced filter, and so on.

15. Download and Share the Report with Others
Once the report is ready, the next step is to share it with end-users. There are different options for sharing the report.
First, you can download it as a PDF file and share it with others. You can protect the report with a password if you feel like it.


Another way is by sharing the report directly through their email like a regular google drive document.

You can also copy the report’s link and share it with others. The report can also be shared by setting up automatic delivery via email.
Enter the recipient’s email, fill in every necessary column, and schedule. And that’s it. You can now create a functional eCommerce dashboard on your Data Studio.
You can create by connecting to your Google Analytics or using partner connectors to pull data from your data source.
What to include in a Google Data Studio eCommerce Dashboard?
There’s no “one size fits all” response to what an eCommerce dashboard should include because there are many important metrics and KPIs that eCommerce businesses can and should keep track of in their eCommerce dashboards.
Luckily, since the dashboard is customizable, you can add or delete any metrics to make your report pertinent.
Below are essential areas on an eCommerce dashboard that needs to be focused on with meaningful metrics that should be tracked.
1. Performance Overview
The Performance Overview page should include and track the following metrics.
- Clicks: This metric gives insight into the number of times people have clicked on your ads.
- Transactions: It answers how many complete orders are processed by your eCommerce store daily, weekly, or monthly.
- Transaction revenue: This could mean the total revenue generated from your eCommerce store or the breakdown of revenue generated by customers or products.
- Unique purchases: The number of times a product was purchased. This metric helps you understand your customers’ shopping preferences. With this metric, you get to know your bestselling product. You can increase the sales of this product by offering discounts on orders for a given period.
- Average order value (AOV): Average amount spent per customer in a transaction. Knowing your AOV and profit margin helps you to make good advertising choices.
- eCommerce conversion rate: This is one of the most important metrics that must be included on an eCommerce dashboard. It keeps track of the percentage of people that visit your eCommerce store and end up as a customer.
- Cost: The amount spent on running Ads.
- Return on ad spend (ROAS): This helps to assess the amount you spend on Ads. If you making more sales compared to what you are spending on Ads, then the Ads are effective. But if the reverse is the case, then paid Ads are not profitable.
- Revenue per Country: Gives insight into how much revenue businesses make from a particular country at a given period of time.
- Top Cities by Revenue: This tracks the cities that generate the most revenue for the business.
2. Visitor behavior analysis
On the Visitor behavior analysis page, the following are some of the metrics that should be found to ensure an efficient eCommerce dashboard.
- Users: The people who find themselves on your online store.
- Exit rate: This gives the percentage of visits that lasts till the end of the session.
- Unique pageviews: This is used by Google to record pageview when a special visitor views or visits your eCommerce site.
- Product list views: This shows the number of times a product is viewed whenever a visitor on the site comes across it in the product list.
- Product details views: The number of times that the page of a particular product is been viewed by someone.
- Product adds to cart: The number of times a person adds a product to their shopping cart.
- Product checkouts: The number of times a product gets to the checkout stage.
3. Order details
This page comes in handy if you are running a Shopify. It is easy to track sales and order data with this page.
With just one look, you will know where all your sales are coming from. Examples of metrics found on this page include;
- Country: This gives detail of the country where the order or sales is coming from.
- Source/Marketing channel: This shows which channel drives the order/sales, maybe it was traffic from Facebook that converted to the sale or traffic from another channel.
- Product: The details of the products for sale.

What are the Limitations of Google Data Studio eCommerce Dashboard?
Google Data Studio is a vital tool that helps to convert raw analytics data into enlightening dashboards that are easy to read and modify.
You even are able to build an insightful dashboard for your online business with Google Data Studio. But despite all these capabilities, it has a few limitations.
When building an eCommerce dashboard on Data Studio and you need to pull data from your eCommerce store, you may encounter a bit of a challenge there.
This is because Google Data Studio is restricted in terms of connectors that can be used to pull in data from most data sources.
And this is a big challenge, especially if you don’t have access to any third-party connector that you can use to pull in your data to Data Studio.
Introducing our eCommerce performance report template in Google Data Studio
I know creating a Google Data Studio dashboard is quite straightforward, but it can be challenging too, especially when it comes to knowing the right metrics and dimensions to choose for the dashboard, which is why we are happy to provide you with free templates just for you. Yes! they are free.
Our team of Google Analytics experts at Porter Metric have built an eCommerce performance report template that’s just specific to your need.
This template will do all the difficult tasks of creating an eCommerce dashboard leaving you with a well-understood and insightful report about your online store.
Conclusion
And yes, we have come to the end of this article. With all the step-by-step guides on how to create an eCommerce dashboard on Google data Studio mentioned in this article, you will be able to create a beautiful, interactive, and fully-functional Ecommerce report for your business.
And if you ever face any challenges while trying to create an eCommerce dashboard, don’t hesitate to reach out to us for help. Also, free feel to try out our eCommerce performance report template.
Frequently Asked Questions
Is Shopify compatible with Google Data Studio?
You can display and analyze your customer, order, cost, and other important variables in a completely configurable and adaptable report using Google Data Studio and a Shopify link.
What is an eCommerce dashboard?
An eCommerce dashboard is a user interface that shows a number of metrics and key performance indicators (KPIs) pertaining to an eCommerce company’s sales, revenue, products, and clients.
What information should be on an eCommerce dashboard?
Key Performance Indicators (KPIs) should be displayed over time on an eCommerce dashboard. Users should be able to identify issues and possibilities quickly. A dashboard should highlight the meaning of the information and quantify what is good or bad using colors and graphic elements.
What common mistakes are made when developing eCommerce dashboards?
Some of the mistakes you should avoid when developing an eCommerce dashboard are:
There are too many different types of information, an Absence of context, a Busy Design, poor pairing of data and visualization, Data With Insufficient Labels, and so on.
Are there free templates to use for eCommerce?
Yes. Portermetrics has more than 80+ free templates for you to use in your eCommerce.