


Tracking the right Facebook KPIs is absolutely necessary for any business that intends to utilize Facebook to its full potential. Facebook is arguably the biggest social media platform in the world right now.
According to Statista, Facebook had roughly 2.93 billion users as of the first quarter of 2022. That’s a staggering figure considering that the total world’s population is about 7 billion.
With almost ⅓ of the world’s population on Facebook, marketers must track metrics relevant to their businesses. In this post, you would learn the top 10 Facebook KPIs you should be tracking irrespective of the kind of business you own.
What are KPIs?
KPIs are quantifiable values showing performance for a specific objective over-time. They are trackable measures in place to help you measure targets and objectives.
Why are KPIs important?
KPIs are an important part of measuring the successes and failures of your campaign or business. With KPIs, you can quickly save time, measure and set targets for teams to shoot for, milestones to gauge progress, and insights that help people or businesses stay on track.
- Why is it important to analyze Facebook KPIs?
Analyzing Facebook KPIs help you ensure that you are not wasting time, resources and energy on FB strategies that are not converting or directly linked to your corporate/ business goals.
Most importantly, you want to be able to clearly show how your Facebook advertising or organic page activity is adding value to your whole marketing campaign in terms of growth, engagement, and revenue overtime.
What is a Facebook KPI?
Investopedia defines Key performance indicators (KPIs) as a set of quantifiable measurements used to gauge a company’s overall long-term performance. A Facebook KPI would be a set of quantifiable measurements used to determine a business’s marketing effort in the short term or even the long term.
Businesses that use Facebook as part of their marketing strategy have to keep track of defined metrics to determine if their marketing efforts on Facebook are worth their time and efforts.
Why track Facebook KPIs?
Keeping track of the right KPIs is necessary for the growth of a business. It also helps in refining your social media strategy. This is true if your business depends on Facebook for leads or customers. Tracking the right Facebook KPIs allows you to:
1. Make necessary adjustments to your Facebook marketing campaigns and stay on track
Every Facebook marketing campaign has an end goal. This could be sales, leads, or even engagement or brand awareness. The end goal determines the kind of KPIs you would track. If your campaigns aren’t going as planned, you can go back to the drawing board and make the needed adjustments.
2. Identify patterns over time
When you constantly analyze data, trends and patterns start to emerge. With the right Facebook insights, you see a consistent path leading to your marketing goal. The reverse is also true. When you track the right KPIs, you can easily spot bottlenecks that may prevent you from hitting your goals.
3. Measure your progress
Without a KPI, it’s impossible to know whether your business is growing. Business growth is a direct result of consistently hitting KPIs.
4. Plan predicted growth
When your KPIs are specific, measurable, achievable, reliable, and timely, you can easily project your growth in 6 months or even 12 months and plan for ways to accommodate that growth.
Track your Facebook KPIs with Porter:
Benefits of using Porter to track your Facebook KPIs
Porter Metrics Facebook Reporting tool is the fastest and reigning no-code data reporting tool marketers use to generate beautiful conversion-focused reports.
With Porter Metrics Facebook reporting tool, you’ll be able to set up immediately without any need for developers or data analysts.
This FB reporting tool makes data visualization fast and smooth, so you can generate and view your reports within the tools you are using already. Tools such as Google Studio, Google Sheets, Analytic, and the like.
Porter Metric grants you access to an entire bank of beautiful templates you’ll use to create convincing reports for your clients and investors. Get a free custom report, or Schedule a call here if you want us to generate your first few amazing reports.
Interestingly, the Porter Metrics team has made it very easy to quickly generate reports yourself once you land on the website or get us to help you whip up your report. It’s easy as ABC.
Features
- Porter Metrics FB reporting tool features 80+ customizable report templates to help you quickly whip up your reports for presentation.
- It has more than 600+ metrics and dimensions you’ll use to access and make sense of your business data.
- Interestingly, you’ll be able to do all of this without having to write a single code or have an analyst or a developer looking over your shoulder.
- To further sweeten the deal, If you schedule a call with us here, we will quickly generate your reports for you – in line with core business needs and details you want to understand or extract from your business data.
Porter Metric’s FB reports have been known to help marketers and businesses understand the performance of their Facebook business pages and advertising campaigns.
Each page on the report is designed to provide a comprehensive analysis to help you identify and visualize important aspects of your business to scale for growth.
Pricing
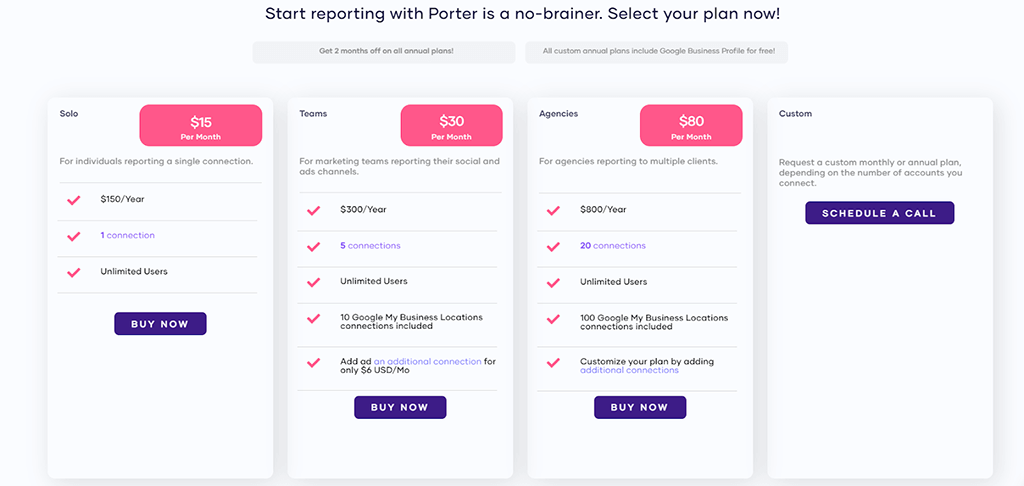
Porter Metric’s Facebook reporting tool pricing is pocket friendly and absolutely unbelievable. From a $15 monthly subscription plan you can get a handful of value that no competitor provides in the reporting tool space.
As always, experts recommend mid to top-tier packages that offer much more value for money. By the mid-tier package, I mean the $30-$80 per month plan, which will give you access to a lot more than is available in the basic solo plan.
Below is a visual depiction of Porter Metric’s Pricing Plan.
Now that you’ve seen how cheap our pricing is – let’s get you started on a 14 days free trial
Facebook KPIs to track in 2024
1. Impressions:
Impressions refer to how many times your content was seen on Facebook at any given instance. Assuming a user sees your content on a mobile device and also sees your content when a desktop is used, both instances would be counted as two impressions.
Tracking impressions is very important because marketing ensures that many people see your offerings, products, and services. The fewer that see them, the lesser the chance the business acquires leads or customers.
Low impressions are an indicator that the Facebook algorithm isn’t serving your ads to people. This could be due to a number of factors, most notably a low-quality score.
If your business focus is on the organic side of marketing on Facebook, tracking impressions is necessary as it helps you determine if your organic marketing efforts are effective. Keeping track of content impressions on Facebook is pretty straightforward.
Open Facebook creator studio and click on ‘content library’ on the left-hand menu. This gives you access to the impressions metric on all your posts.
2. Reach
Reach refers to the number of unique users on Facebook who have seen your content. Facebook defines it as the number of people who saw your ads at least once. This definition is similar to impressions but there’s a difference.
While reach is defined as the number of unique users that have seen your content, impressions refer to the number of times your content is displayed to an audience.
Just like impressions, the higher your reach, the higher the chances of generating more leads and customers for your business. On Facebook, there are two types of reach that can be tracked:
- Post reach
- Page reach
Post reach is the total number of people who saw a particular Facebook post from your page while page reach refers to the number of people who see or view your page as a whole.
You can easily track Facebook reach by checking insights on any post on your Facebook page or by using Porter metrics. Facebook counts reach data in daily, weekly, and 28-day intervals.
This means if a user sees your post today, it counts as a daily reach. If that same user sees the same post another day, it counts as a daily reach for that day.
But when analyzing data after the 28-day interval, Facebook counts that user’s reach as once instead of twice. This way the algorithm tracks and gives an accurate result for this metric.
3. Number of followers
There’s a general consensus that paying attention to the number of followers on your Facebook page or any other social media page is a waste of time. Some describe follower count as a vanity metric.
Well, this could be wrong and right. It being right or wrong has more to do with the current state of your business and your social media marketing strategy. Facebook followers are worth tracking; it shows how known your brand is.
Individuals with a good number of followers on Facebook are usually seen as authorities or experts in their chosen fields. The same applies to businesses.
A business with lots of followers is usually perceived as a credible business, hence, this is one important KPI you must track. How your brand is being perceived by the public directly impacts your revenue.
The more people love your brand, the more you gain followers. This leads to a higher chance of sales of products or services in your business.
How to get more Facebook page followers
Getting more Facebook page followers isn’t rocket science. There are two main ways to go about it.
Organic route
Growing your Facebook page organically is a long-term game. To achieve this, you will have to have a solid organic content marketing plan in place.
Paid route
This is probably the fastest way to grow your page followers. All you need to do is set up a page like a campaign inside the Facebook ad manager.
4. Engagement rate
Engagement rate tells you well your content resonates with your target audience. To measure this Facebook KPI, the following metrics have to be tracked:
- Likes
- Shares
- Comments
Your Facebook average engagement rate goes a long way in building your Facebook page in the long run. A bad average engagement rate (low likes, shares and comments) would mean your page followers won’t grow, fewer people see your products and service offerings, and less revenue generated.
You need to work on your content strategy to boost engagement rates on your page. This means getting your customer avatar clearly spelt out. Only when you truly know the ideal customer can you create content that resonates with them.
How to track the engagement rates of your posts
You can easily track engagements on Facebook posts. Engagement icons such as likes, shares and comments are visible for all to see.
To get a full overview of your engagement metrics of all your posts, open creator studio, on the left-hand menu, click “published”. This gives a table displaying various engagement metrics for all your posts within a specified time frame.
5. Video engagement
If you haven’t noticed, video content has risen to be one of the most accepted means of sharing information on social media. The top social media platforms in the world are all prioritizing video content over still photos or designs.
But this isn’t just about social media algorithms, 96% of people have watched an explainer video to learn more about a product or service.
While a staggering 88% of people say that they’ve been convinced to buy a product or service by watching a brand video. The engagement rates on videos published on social media are an indicator of how well your content resonates with your audience.
To view engagement metrics on your Facebook videos, open Facebook creator studio, on the left-hand menu, Under “Insights” click “videos”. This gives a full report on your video metrics within a given period of time.
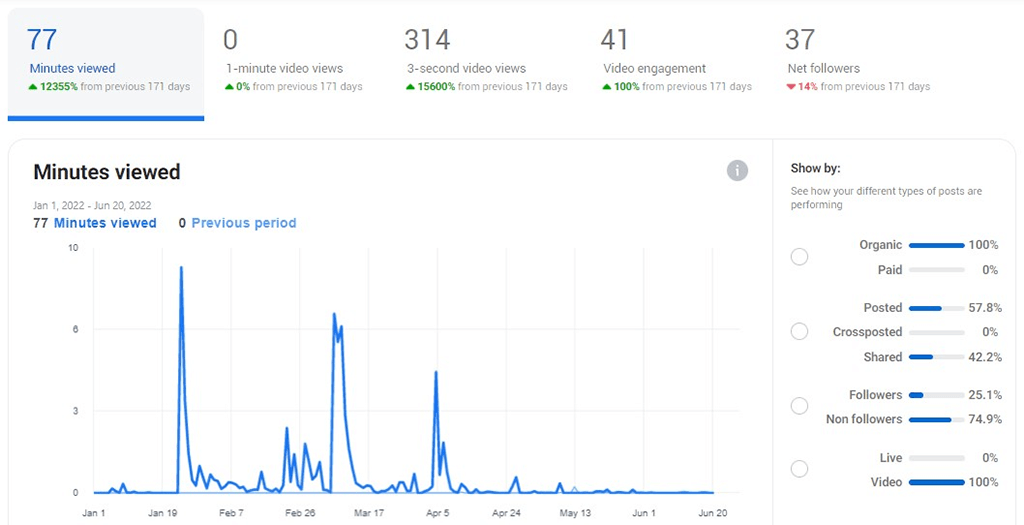
Key metrics you should look out for are:
- Minutes viewed
- Reach
- Average video watch time
6. Link clicks
If you run paid ad campaigns on Facebook, then link clicks is a key metric you should track. Facebook defines it as the number of clicks on links within an ad that leads to advertiser-specified destinations, on or off Facebook.
Link clicks give an idea of how engaging or compelling your ad is. Keeping track of this metric allows you to track other important PPC metrics like click-through rate (CTR) hence, tracking it is paramount.
7. Click-through-rate (CTR)
Click-through rate refers to the number of clicks an advertiser receives divided by the number of impressions. CTR = Total link clicks ÷ Total impressions.
A high click-through rate is vital to your PPC success since it directly affects both your Quality Score and how much you pay every time someone clicks on your ad. A low click-through rate is an indicator to the algorithm that your ads aren’t of good quality.
Facebook doesn’t intend for users to have a negative feeling when using the platform, hence, they ensure ads that don’t receive good feedback (high click-through rates) are less prioritized. In most cases, the ad accounts running those ads are banned.
How to know a good click-through rate
The Click-through rate across industries differs. According to Industry thought leaders, the average click-through rate across all industries is 0.90%
8. Cost-per-click (CPC)
This is the average cost per link click. As described earlier, link clicks are important Facebook metrics you must track. Knowing the cost for each link click is also essential in scaling your Facebook ads campaigns.
Your campaign’s efficiency can be determined by looking at this metric. The cost-per-click represents how much it costs to get a user to your website/landing/app download page.
The higher this metric, the higher your ad spend, hence, the need to track it and make necessary adjustments to your ad campaigns.
How to know your cost per click
Mathematically, the average cost per click = total cost ÷ total link clicks. This metric can also be easily accessed on your Facebook Ads Manager dashboard.
9. Cost per action (CPA)
As the name implies, CPA is the cost per action as determined by an advertiser. This can also be called cost per result. The action or result could be clicks, messages, downloads, sign-ups, leads or customers, etc.
This metric says a whole lot about your campaign performance. A high CPA indicates that your ad campaigns need to be optimized for better conversions.
A low CPA shows that your ad and your product/service offer resonate with your audience. This metric can easily be identified on the dashboard of the Facebook ad manager.
Depending on the goal of your Facebook ad campaign, on the dashboard, the CPA could be displayed as cost per purchase, cost per lead, etc. The average cost-per-action differs by industry.
You should always optimize your ad campaigns to ensure you keep costs low.
10. Cost per thousand impressions
The cost per thousand impressions (CPM) is the amount you pay for your ad to reach a thousand people. A CPM of $2 for example, means that for every 1,000 views, you pay $2.
While this metric isn’t important for conversion-based campaigns, it is highly important if the goal of your Facebook ad campaigns is brand awareness. Using CPM as your Facebook KPI when running brand awareness ads, allows you to budget appropriately.
This means for every 1,000 views, you pay roughly $7.19. You pay double the amount if you need your ad to be seen 2,000 times.
Conclusion
Tracking the right Facebook KPIs is necessary for ensuring your marketing efforts are successful. Porter Metrics Facebook reporting tool has done all the work and gathered all the metrics and dimensions on just a few simple sheets to see what works for your business.
In summary, here are the 10 Facebook KPIs you should always track for your organic and paid ad campaigns. These metrics are also available on your free facebook insights and ads report.
- Impressions
- Reach
- Number of followers
- Engagement rate
- Video engagement
- Link clicks
- Click-through-rate (CTR)
- Cost-per-click (CPC)
- Cost-per-action (CPA)
- Cost per 1000 impressions (CPM)