


Social media is a powerful tool for marketing, but you need to know what’s working and what needs to be improved. As we move into a new year, it’s important to be aware of the latest trends in social media.
This includes not only the platforms themselves but also the metrics that you should be tracking. This article will provide you with 10 KPIs that every social media manager should be tracking in 2024.
What are KPIs?
Key performance indicator (KPI) is a term that means an indicator that shows how well a business or campaign is performing.
It can be used with financial or marketing data to give you a basic idea of whether your company is performing well overall in terms of revenue, cost and profit.
Also known as business performance indicators, KPIs are designed to measure how effectively a company is performing in terms of meeting its objectives and vision.
In simple terms, KPIs are commonly used by businesses to gauge their overall performance or efficiency internally, or against competitors through the use of statistics.
Why are KPIs important?
Let’s address the question straight from the beginning. Why are key performance indicators important? The answer is pretty simple – I need to know how my actions affect my success.
KPIs play vital roles in helping you track, analyze and improve your business. The benefits of using KPIs are literally uncountable, including that without them, you cannot identify a business or campaign’s weaknesses, track its growth and decide on new strategies for improvement.
The primary purpose of any performance measurement system is to provide feedback about individual or group performance and to guide ongoing decision-making. This is why key performance indicators are essential in a nutshell.
Setting Up To Track Social Media KPIs
There is no one-size-fits-all answer to this question, as the best social media KPIs for your business will vary depending on your specific goals and objectives.
However, some common KPIs businesses use to measure their social media performance include engagement rate, reach, impressions, website traffic, and generated leads.
How do you choose KPIs?
The first step in choosing social media KPIs is to identify what you’re trying to measure.
Are you trying to track the number of followers on your business’s LinkedIn account? Or are you looking for a metric that shows engagement levels with fans?
Once you’ve identified what metrics will help you answer your question, it’s time to start collecting data. The next step is figuring out how often you’ll collect data and how long it will take.
For example, if your goal is to gauge how many followers your business has on Instagram and how many posts they’re engaging with, then it would make sense to collect this data every month or every quarter.
If your goal is to get a snapshot of how many people are following your brand right now, then collecting this information once or twice a week should suffice.
Once you’ve decided on the frequency at which you’ll be collecting information and when you’ll collect it, decide who will be gathering the data.
You could have someone in-house who logs into the platform and checks each post for engagement; or you could use a data reporting service provider like Porter Metrics, the fastest, no-code data reporting or business intelligence tool provider in the world.
Either way, make sure that whoever performs these tasks has access to the data source and understands all the metrics and dimensions as well as visualization formats to pick so they’ll be able to present essential data to your team’s understanding properly.
Why You Should Be Tracking Social Media KPIs
As more and more businesses are turning to social media as a way to connect with their customers, it’s important to track KPIs (key performance indicators) for your social media accounts.
Why? There are a number of reasons, but here are the top three:
- To see where you’re succeeding on social media and where you’re falling short. Tracking KPIs will help you identify where your business can improve its performance.
- Ensure that your social media posts are being seen by the right audience and generating leads for your business. This is especially true when working with influencers who have large followings or brand ambassadors who have their own large followings. It’s important that you know how many people are seeing each post so that you can make changes accordingly.
- To understand how people interact with your brand on social media so that they can better understand what they want from their experience with your company or product offering. This information helps you create content that will resonate with potential customers and encourage them to engage with you further.
Top 10 Social Media KPIs You Should Be Tracking in 2024
In 2024, tracking your social media KPIs is more important than ever. Here are 10 you should be measuring in the new year:
1. Likes
Likes have a significant role in social media and can affect how people think of your brand. They represent a form of validation, which is why it is important to monitor this metric.
While there are a number of ways you can increase your likes – for instance via the use of hashtags, posting images with relevant captions, and tagging people who might be interested in your content, you need to ensure that you keep tabs on your post and page likes because this largely influences how much credibility audiences assign to your brand.
2. Engagement Rate/Metrics
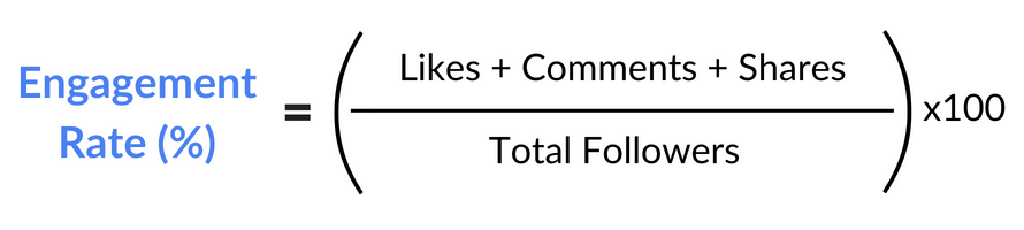
The social media engagement rate is a metric that measures the number of interactions on a post. It is the ratio of likes, shares, and comments to the total number of followers on a given platform.
Social media engagement rate tracking can be done manually or by using automated tools such as Porter Metric’s ready-made social media KPIs reporting template which you can get here.
Our platform gives you as much freedom as you’d like to track the social media engagement rates for multiple accounts and publish them to different dashboards or reports as you like.
3. Followers/ Audience Growth Rate
The social media followers metric is a popular way to measure the popularity of a social media account. It is also used to measure the effectiveness of social media campaigns.
To calculate your audience growth rate or followers, track your total new followers (on each platform) over a reporting period. Then divide that number by your total audience (on each platform) and multiply by 100 to get your audience growth rate percentage.
4. Click-through rate (CTR)
Click-through rate is an essential metric you want on your social media report because it shows you the number of people who clicked on a link in your post to access additional content either on your website or on another web platform your brand owns.
It can be anything from a blog post to your online store or Youtube channel. CTR lets you in on how many people have viewed your social content and want to know more about what they’ve just seen.
This metric is a good indicator of how well you promote your social content. To calculate CTR, divide the total number of clicks for a post by the total number of impressions. Then multiply that by 100 to get your CTR as a percentage
5. Comments
Comments are a great way to engage with your followers and generate more traffic to your page. Comments can be used for customer service, responding to questions, or just starting conversations.
When monitoring for growth, you want to be really sure that you have included the comment field for analysis in your report. This is because this largely explains your audience’s perception of your content, brand, product, and services.
Although its contents are largely qualitative, keeping tabs on its quantitative nature helps you understand if you are gaining more comments or less and offers you a basis for making informed decisions on how you can improve on that to grow your brand.
6. Social shares
Shares in social media parlance refer to a situation where users broadcast web content to connections, groups, or specific individuals on social networks. One of the main goals of a company’s social media marketing strategy is to leverage its existing audience to share content and increase brand awareness.
When you track social shares as an important social media KPI, you are assigning value to the extra effort your paid or organic strategies are returning. This metric can help you understand how much positive impact your content or advert is having on your audience.
Additionally, it can help you quickly identify a content pattern that resonates with your audience so you can consistently churn those types of formats.
7. Profile Visits
A profile visit metric presents the sum total of views a social media profile has gotten from unique accounts over a specific period of time. For every time an individual account views a profile, the profile visit count increases by 1.
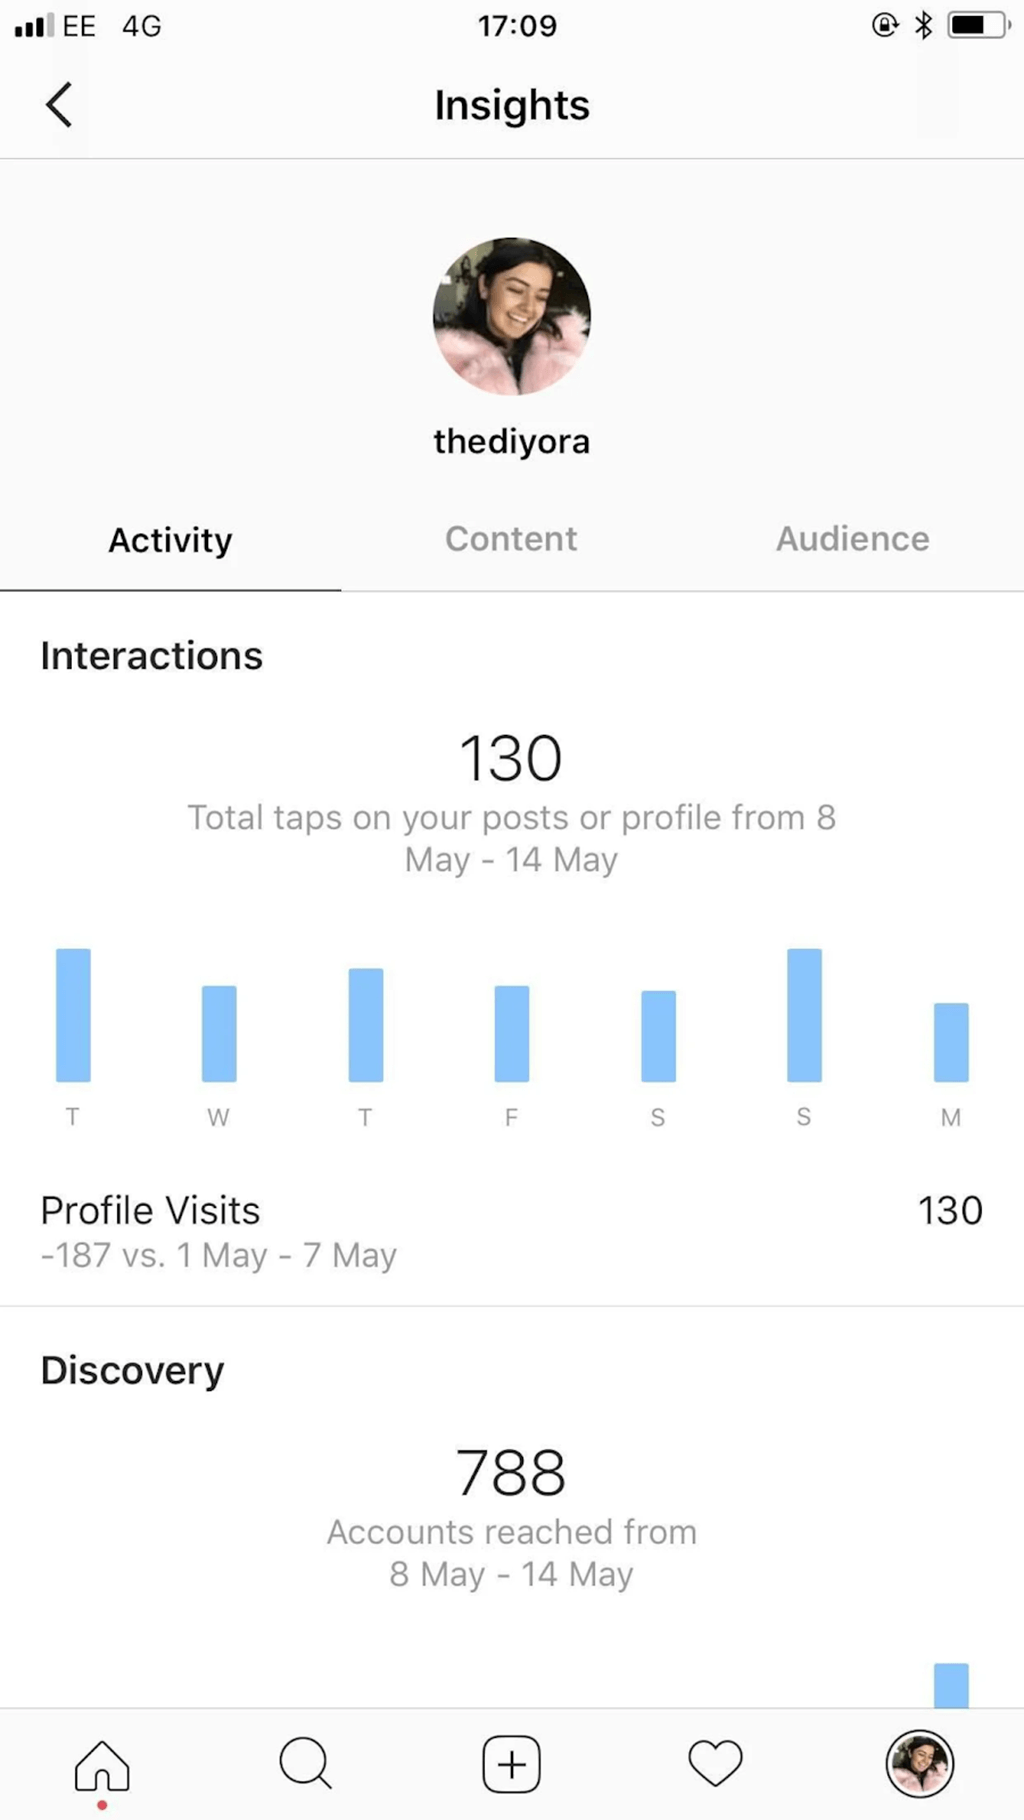
If you want to get a sense of how impactful and probably viral your contents are performing out there, a metric to keep an eye on is the profile visit metric because it counts the total number of unique profiles who have arrived on your page via a link from some of your interesting contents, ads or backlinks if you will.
8. Reach
Reach metrics on social media captures the total number of unique people who see your content. Because social media reach measures, unique visitors rather than counting how many times an ad was displayed, it is often preferred over a similar metric like Impression.
Experts explain that the reach metric is there to help social media managers track and monitor the growth of their brand awareness over a period of time.
Being that it has a direct impact on conversion rate, we deem it fit to be included as one of the key social media KPIs a social media manager must track in 2024.
9. Impressions
The social media impression counts how many times an ad or a post was displayed or served. It doesn’t directly consider the consumer’s uniqueness or how many times a person must have seen the same advert.
Tracking your impression can help you measure how conversant your audience is with your brand and might offer you insights to restrategize so you can grow this metric.
Growing this metric means that your content is constantly in the faces of your audience and whilst that can quickly become annoying.
It is a core need in the marketing and advertising space as people need to consistently see and be engaged by certain content to spur patronage.
10. Conversion or Conversion rate
While this metric is largely in the sphere of paid social media advertising KPIs to track, it is essential to state that as a social media or campaign manager, you must try your best not to leave this metric out of your report; especially where and if your social media strategies are geared towards getting your audience to take action towards a desired goal.
This metric is largely important because it helps you understand from a broader perspective which of your most consistent and prolific social media platforms is churning acceptable results.
At a glance, you’ll be able to point to the paid source that is ideally hitting targets. Targets here could be a page visit, download, form fills, purchase or whichever goal a business objective deems fit to be a suitable business objective.
With this information on your report, you’ll know the exact channel to scale for more return on ad spend quickly.
Track your Social Media KPIs with Porter:
Tracking social media KPIs and generating useful reports are some of the toughest tasks most marketing agencies like yours have come to see as a challenge.
This is because the processes attached to successfully generating and analyzing marketing data are often long-winded and exhausting.
In some cases, there’s always a need to employ the services of a developer/ coder or some data engineer and analyst which then makes the process even more tiring.
With Porter Metrics’ social media reporting tool, you won’t need to hire the services of a developer to help you generate a report.
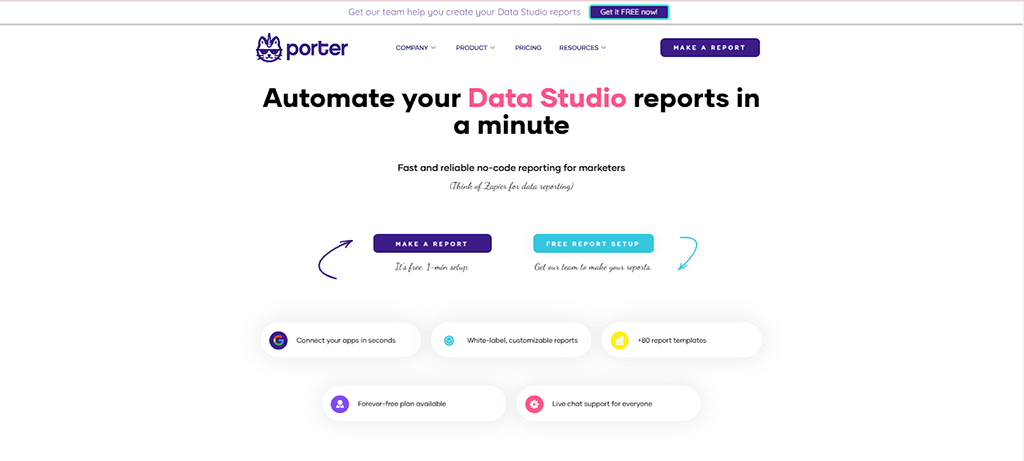
This social media KPI reporting tool whips up reports in under 60 seconds to help you make informed decisions. This makes data visualization a lot more interesting – doesn’t it?
This way, you can save time generating reports while using that valuable time to be engaged in activities that will generate revenue for your business.
While you’ll be able to access an entire bank of 80+ beautiful templates you can use to create convincing and irresistible reports for your clients from Porter Metrics’s homepage, we’d like to emphasize that you’ll be able to get all of this on the fastest possible time so you can jump on that meeting and secure that deal.
No other reporting tool on planet earth can help you quickly achieve this in the shortest possible time. To experience our awesome support service, please schedule a call here so that we can help you generate your first few amazing reports.
Interestingly, if you are the DIY type of person, the team at Porter Metrics has made it so that you can do it yourself once you land on the website. It’s really easy – just like a walk in the park.
Features
Porter Metrics Social Media KPIs reporting tool features 80+ customizable report templates to help you quickly whip up your reports for presentation.
You can go from no report to a properly formatted and visually appealing report without having to write a single code or have an analyst or a developer looking over your shoulder.
To sweeten the deal further, If you schedule a call with us here, we will quickly generate your reports for you – in line with your core business needs and the details you want to understand or extract from your business data.
Our Social Media reports have been known to help marketers and businesses understand the performance of various Facebook, TikTok, LinkedIn, Instagram, and other social media pages and advertising campaigns.
With this report, you will be able to see important details clearly while understanding important aspects of your business to scale on for growth.
Pricing
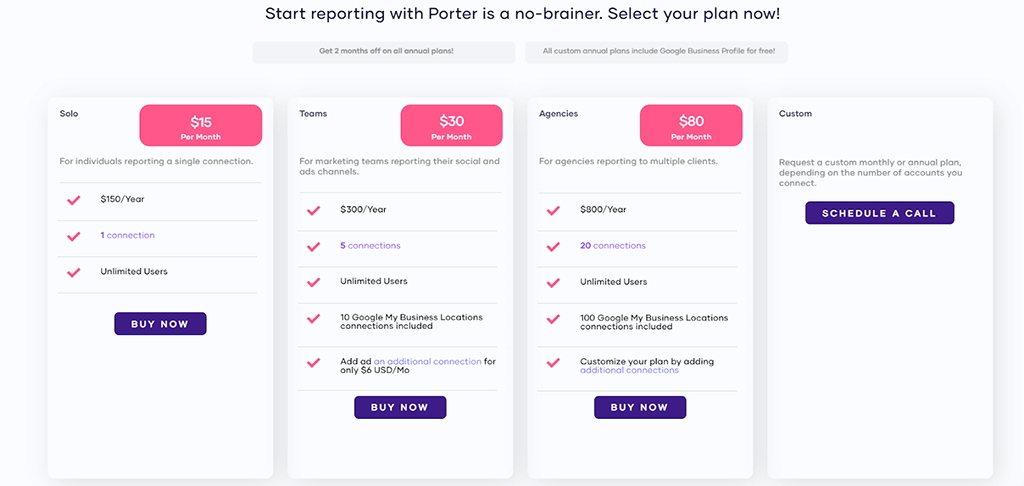
Porter Metric’s Social Media reporting tool is pocket friendly and absolutely unbelievable. You can get a handful of value from a $15 monthly subscription plan that no competitor provides in the reporting tool space.
As always, experts recommend the mid or top-tier packages known to offer great value for money. By the mid-tier, we mean the $30-$80 per month plan which will give you access to a lot more than is available in the basic solo plan.
Below is a visual depiction of Porter Metric’s Pricing Plan.
Using Social Media KPIs to Identify Patterns in Your Audience Behavior
Analysis is often concerned with studying data and audiences’ feedback within data to understand and find new ways to grow your business quickly. To understand audience behavior, a social media manager will need an enabling environment powered by the data analytics software to
1. Look at the overall engagement levels on social media channels.
2. Identify patterns in the type of content that gets the most engagement.
3. Look at the times of day when your audience is most active on social media.
4. Use social media listening tools to identify user trends and hot topics.
5. Find patterns and opportunities to close leads and prospects as soon as possible
Conclusion
Social media runs in a web of interactions – often without a clear beginning or end. That’s what makes social media so unique, but it can make measuring results difficult.
As marketers and social media managers, we should also be keeping an eye on the competition (keeping tabs on what your competitors are doing can help you better understand their value proposition and market share), their content quality (if something resonates with people and prompts them to share it, you should know about it) and their audience growth.
These insights should indicate where to invest your time, money, and resources towards building relationships within the network.
As marketers and social media managers, we should also be keeping an eye on the competition (keeping tabs on what your competitors are doing can help you better understand their value proposition and market share), their content quality (if something resonates with people and prompts them to share it, you should know about it) and their audience growth.
Measuring success by the likes and the retweets is great but it doesn’t necessarily mean your social media efforts are successful. These insights should give you an indication of where to invest your time, money, and resources towards building and optimizing for performance.
The already outlined 10 KPIs make your social media analytics more valuable and a goldmine waiting to be explored.
FAQs
How many dashboards can I create?
We charge by connections, so you can create as many dashboards as you want as long as you keep the slots available on your plan.
Can I create Facebook and Google ads information in one dashboard?
Yes, We have a lot of templates ready for that here.
What does a connection mean?
A connection is how we link a data source to a data reporting analyzing and reporting software solution. You pay for connections, not for data sources. A connection corresponds to every single Facebook Ad account, Facebook page, or Instagram Business page you would like to connect to Google Data Studio.
If you want to create reports for four (4) Facebook Ads accounts, those would be 1 data source and 4 connections, for instance.
I was added as a user, but I still have emailed about my trials?
We run different campaigns when you create a trial, so if you still get those emails after you are part of a license ignore them.
What should I do if I see an inconsistency with my data?
You may see that the custom and standard conversions reported on Google Data Studio are different from what is shown on Facebook Ads. Chances are the conversion window reported is different. We will encourage you to review this article.