LinkedIn Pages integration for Google Sheets

Trusted by +1,400 marketers

Import all your LinkedIn Pages data

All the fields from LinkedIn Analytics hourly, daily, weekly.

Visibility

Impressions, Reach, Followers

Page

Website clicks, Page views

Audience

Geo, Gender, Age, Seniority, Industry, Role

Engagement

Engagements, Comments, Reactions

Posts

Post image, Copy, Link

Career page

Career page clicks, views

Visualize +200 fields

+ 90 metrics

+ 90 dimensions

Includes custom fields

How to connect LinkedIn Pages data to Google Sheets

Set up once, and let your data be refreshed everyday

To integrate LinkedIn Pages data into Google Sheets, follow these steps: 

  • Step 1: Install the Google Sheets add-on.
  • Step 2: Connect your LinkedIn profiles with access to your Facebook Pages. 
  • Step 3: Set up a query defining pages, date range, metrics, and dimensions. 
  • Step 4: save your queries and schedule data refreshes hourly, weekly, or daily.
    Complete tutorial: Import Facebook Ads data on Google Sheets.

Blend your cross-channel data

to get accurate marketing KPIs and a single source of truth.

Blend LinkedIn Pages with GA4

Measure conversions coming from LinkedIn Pages by combining traffic data and UTMs

Tag or group by topic or hashtag

Categorize performance by content pillars, topics or hashtags to spot best-performing content and prioritize what resonates the most with your audience

Cross-channel social media reports

Blend reach, impressions, followers, and engagements across all your Social Media channels to have a holistic view of your performance

Compare vs a Goal

Blend your social media performance data with a Google Sheets with goals data to compare actual vs target

Monitor your LinkedIn Pages performance

To reach your goals, align your team, and tell when things are working or not.

Set alerts and notifications

connect with Zapier or Make.com to send email or Slack alerts

Visualize your funnel

Blend PPC, CRM, OR GA4 data togehter

Filter and segment

by ad account, client, campaign, audience

Set and visualize goals

By adding columns to track progress towards objectives

Share and present reports and unlock AI

to influence your team or clients

Connect to Google Slides, Canva, or Graphy

For beautiful presentations with real-time data

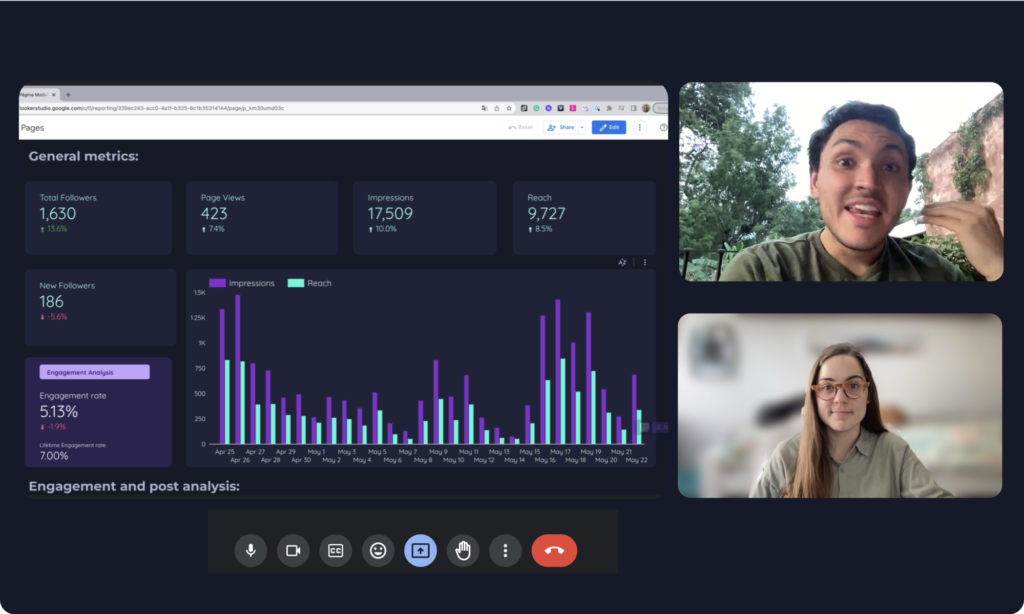
Sync with Google Looker Studio or Power BI

and present your data on interactive dashboards, without the stability/speed limitations of connectors

Let AI give insights from your data

Use Open AI or Bard to give you analysis summaries

How Porter is different

Unlimited, free support via chat, email, and calls

We hire marketers to do customer support or book calls with our founders to personally:

  • Set up or fix reports
  • Train you (and your team) on Looker Studio
  • Give you recommendations

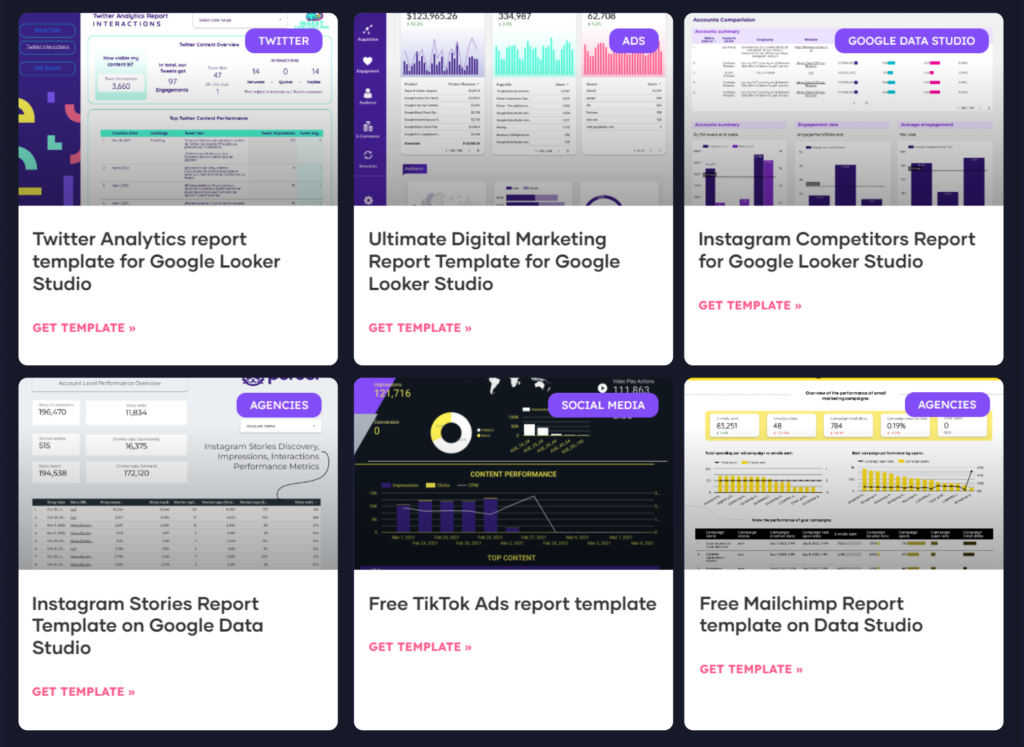
+100 free templates and tutorials

Learn everything about marketing reporting and how to win with your marketing data—or nothing, with templates.

Simple, fair pricing

  • Only pay for accounts connected to your reports 
  • 14-day 100% refund + keep the service free*  
  • Free custom reporting service, training, and premium templates for annual plans

Unsolicited, actual customers’ words

Porter makes your marketing team faster

Speed is doing the right things fast. Make it your competitive advantage with no-code data.