
The best Supermetrics alternatives in 2026 are Porter Metrics, Funnel.io, Windsor.ai, Improvado, Whatagraph, AgencyAnalytics, Dataslayer, Coupler.io, Power My Analytics, and Databox. Teams switch from Supermetrics mainly because of rising prices, complex per-destination pricing, and slow customer support. Most alternatives on this list offer simpler pricing and start between $15–$50/month, compared to Supermetrics’ $37–$499/month range.
Quick answer — Best Supermetrics alternatives in 2026
- Porter Metrics — Best overall for marketing teams and agencies (from $15/mo)
- Funnel.io — Best for enterprise data normalization (from ~$200/mo)
- Windsor.ai — Best free plan with multi-touch attribution
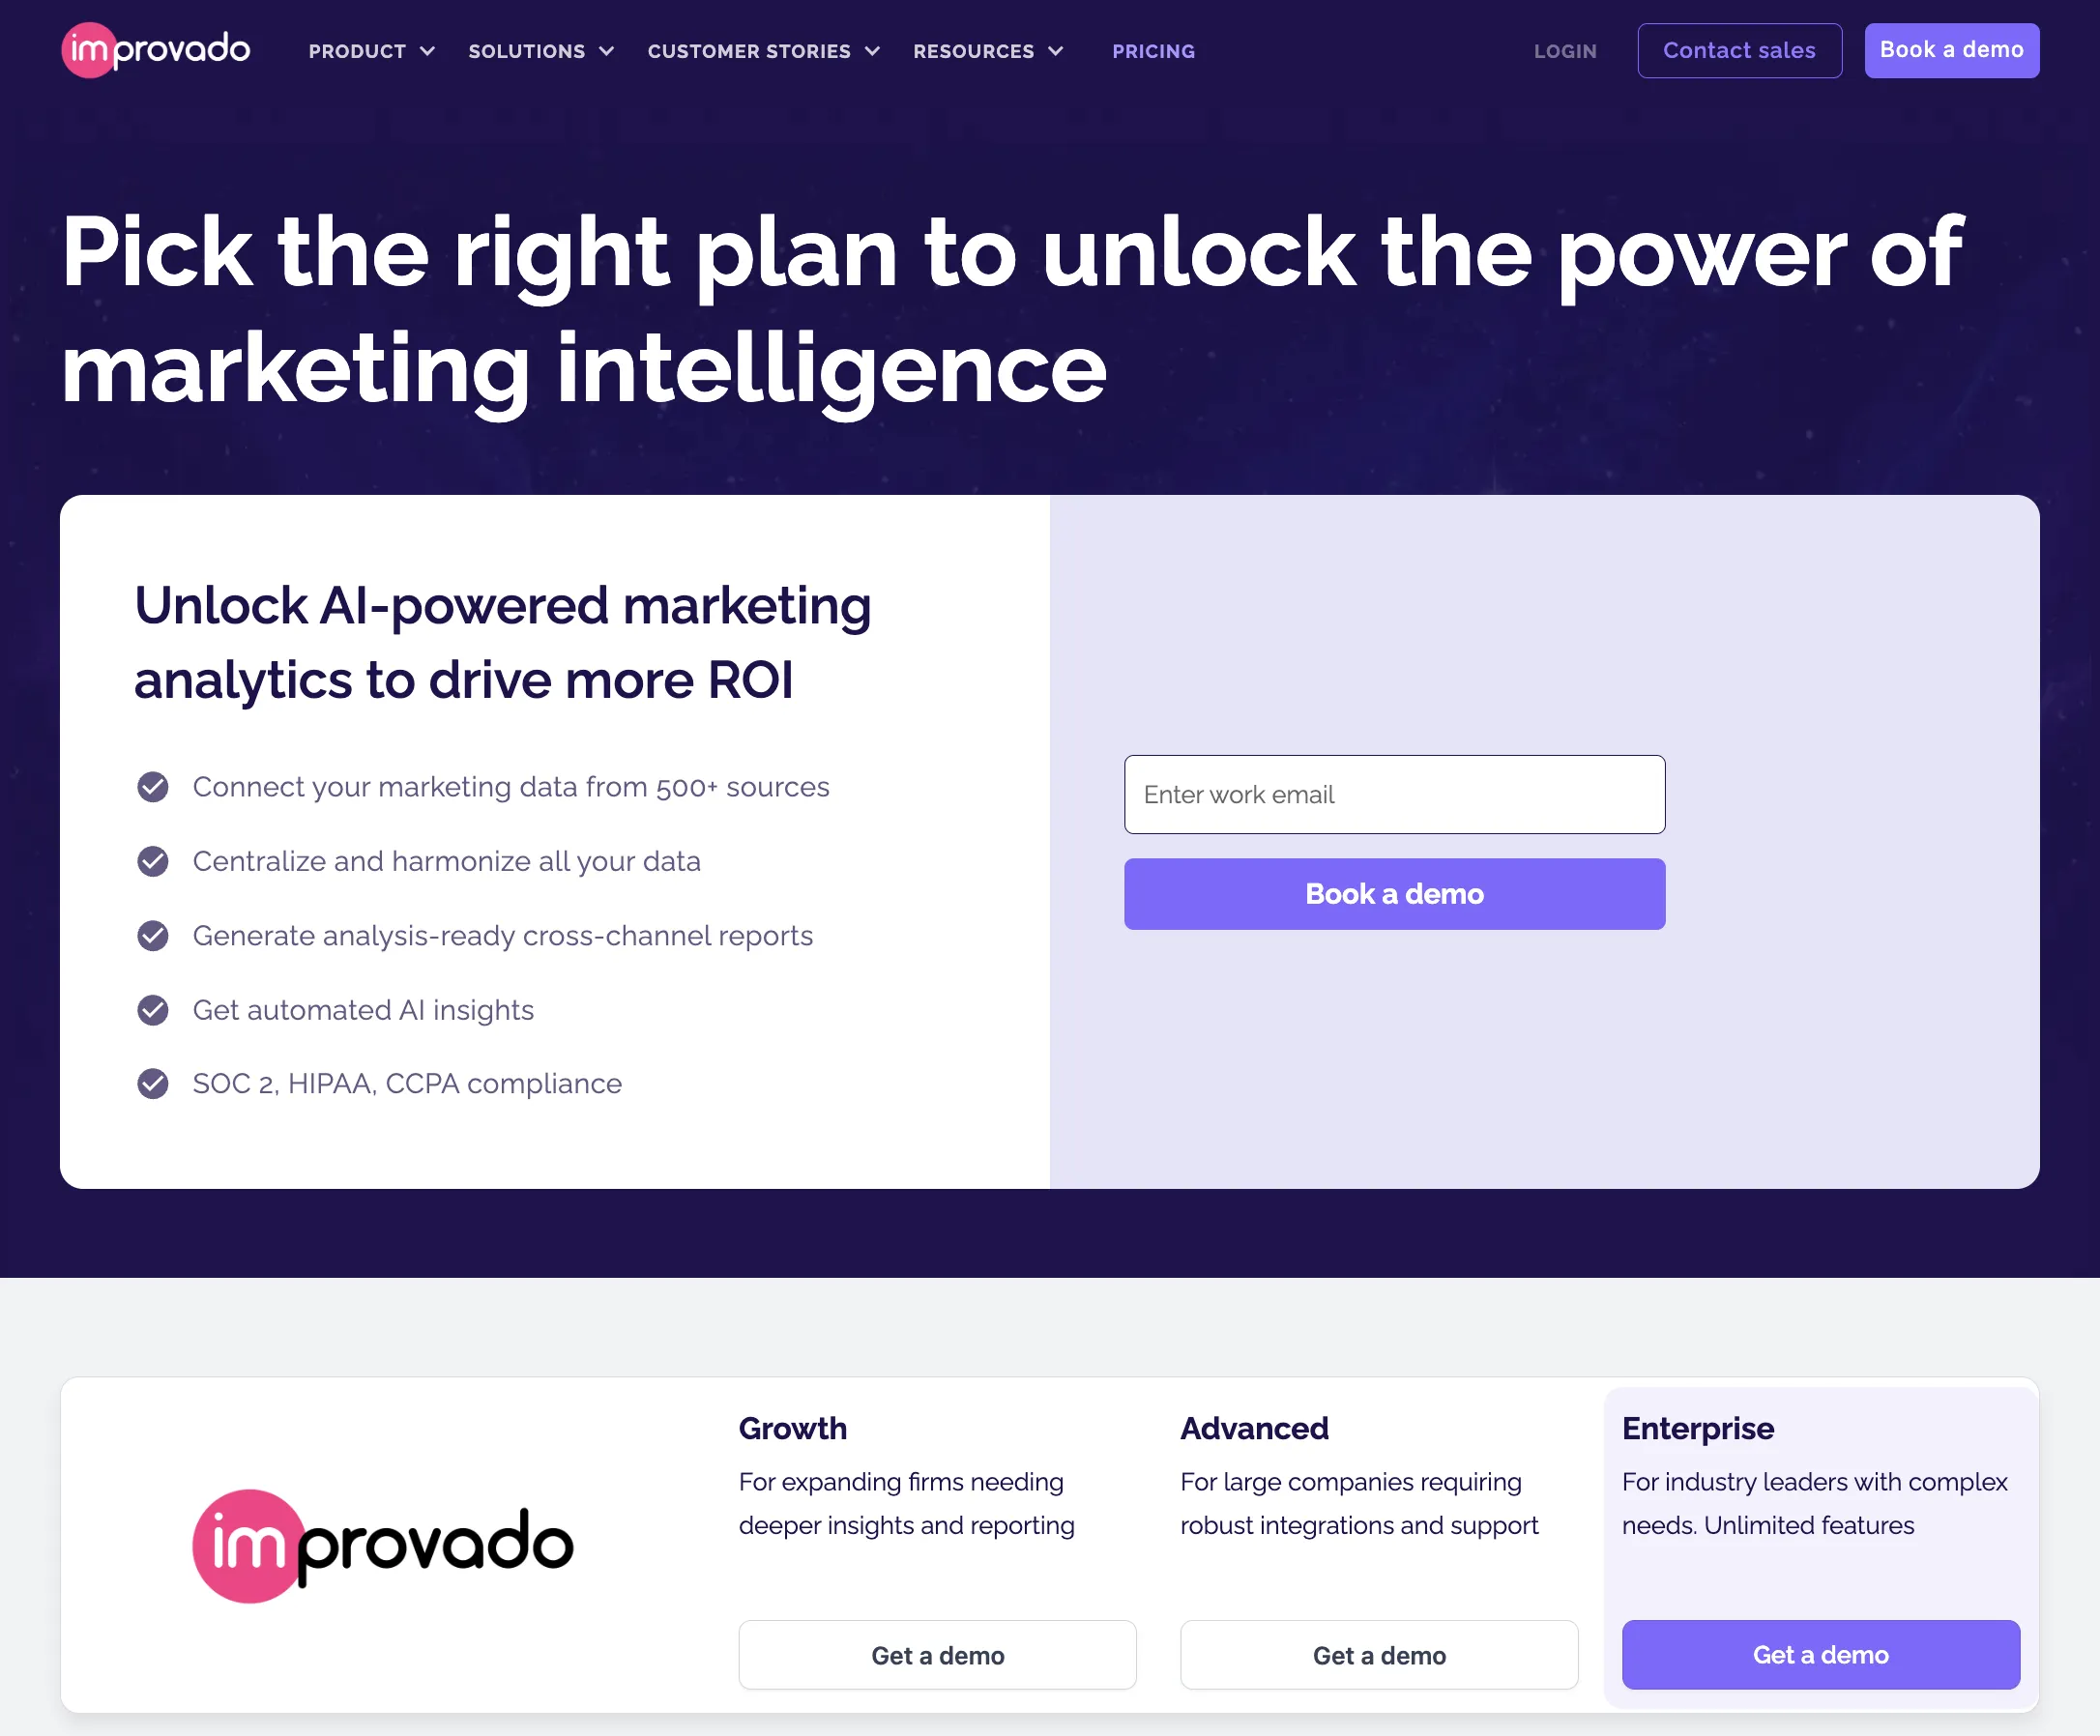
- Improvado — Best for large enterprises with big ad budgets (from ~$3,400/mo)
- Whatagraph — Best all-in-one reporting with built-in dashboards (from ~$270/mo)
- AgencyAnalytics — Best white-label client reporting for agencies (from $59/mo)
- Dataslayer — Most similar to Supermetrics, lower price (from $39/mo)
- Coupler.io — Best for ETL to Google Sheets and spreadsheets (from $32/mo)
- Power My Analytics — Best for US PPC agencies using Data Studio (formerly Looker Studio) (from $49.95/mo)
- Databox — Best for KPI dashboards with AI insights (from $199/mo)
All tools tested hands-on. Pricing verified March 2026. Jump to full comparison →
Disclosure: I’m Juan, founder of Porter Metrics, a Supermetrics alternative with 6+ years in the market. Every claim in this article is based on public data and verifiable facts so you can make an objective comparison.
Why look for a Supermetrics alternative
Marketing teams look for Supermetrics alternatives because:
due to their market leadership, not an improved service
repeatedly reported on G2 Crowd and Trustpilot
that take too long to resolve
Supermetrics has added over 150 connectors and more destinations: data visualization tools, data warehouses, API, MCP to connect to AI chats, and uniquely, project management tools like Monday.com as a data destination (a feature only shared by Coupler.io on this list).
Their prices increase over time and aren’t obvious with Google Sheets or Data Studio when you buy a few connections. You’ll notice them when you need other destinations like data warehouses, or when the number of data sources and accounts scales, especially for larger brands and agencies.
1. Higher, complex pricing
Supermetrics’ pricing depends on several variables at once. Here’s what each plan includes and what each add-on costs (source: supermetrics.com/pricing, verified March 2026):
| What’s included | Starter ($37/mo) | Growth ($199/mo) | Pro ($499/mo) |
|---|---|---|---|
| Annual price (20% off) | $348/year | $1,908/year | $4,788/year |
| Destinations | 1 | 1 | 1 |
| Data sources | 3 | 7 | 10 |
| Accounts per source | 3 | 7 | 10 |
| Users | 1 | 2 | 3 |
| Refresh frequency | Weekly | Daily | Hourly |
| Data transformations (custom metrics, custom dimensions) | Not included | Not included | Not included |
| Storage | Not available | Not available | +$499/mo ($399/mo annual) |
| API / MCP rows | 50,000 rows/mo | 250,000 rows/mo | 500,000 rows/mo |
| Workspace access | Not included | Not included | Not included |
On top of the base plan, Supermetrics charges for add-ons:
| Add-on | Cost per unit | Limit |
|---|---|---|
| Additional destination | $37/mo (Starter), $187/mo (Growth/Pro) | Up to 3 on Starter, 2 on Growth, 4 on Pro |
| Additional data source | $37/mo | Up to 5 on Starter, 12 on Growth, 15 on Pro |
| Additional accounts per source | $13/mo per account | Up to 10 on Starter, 15 on Growth, 20 on Pro |
| Additional user | $37/mo (Starter), $124/mo (Growth), $99/mo (Pro) | Up to 3 on Starter, 5 on Growth, 5 on Pro |
Note: Supermetrics shows annual prices by default on their pricing page.
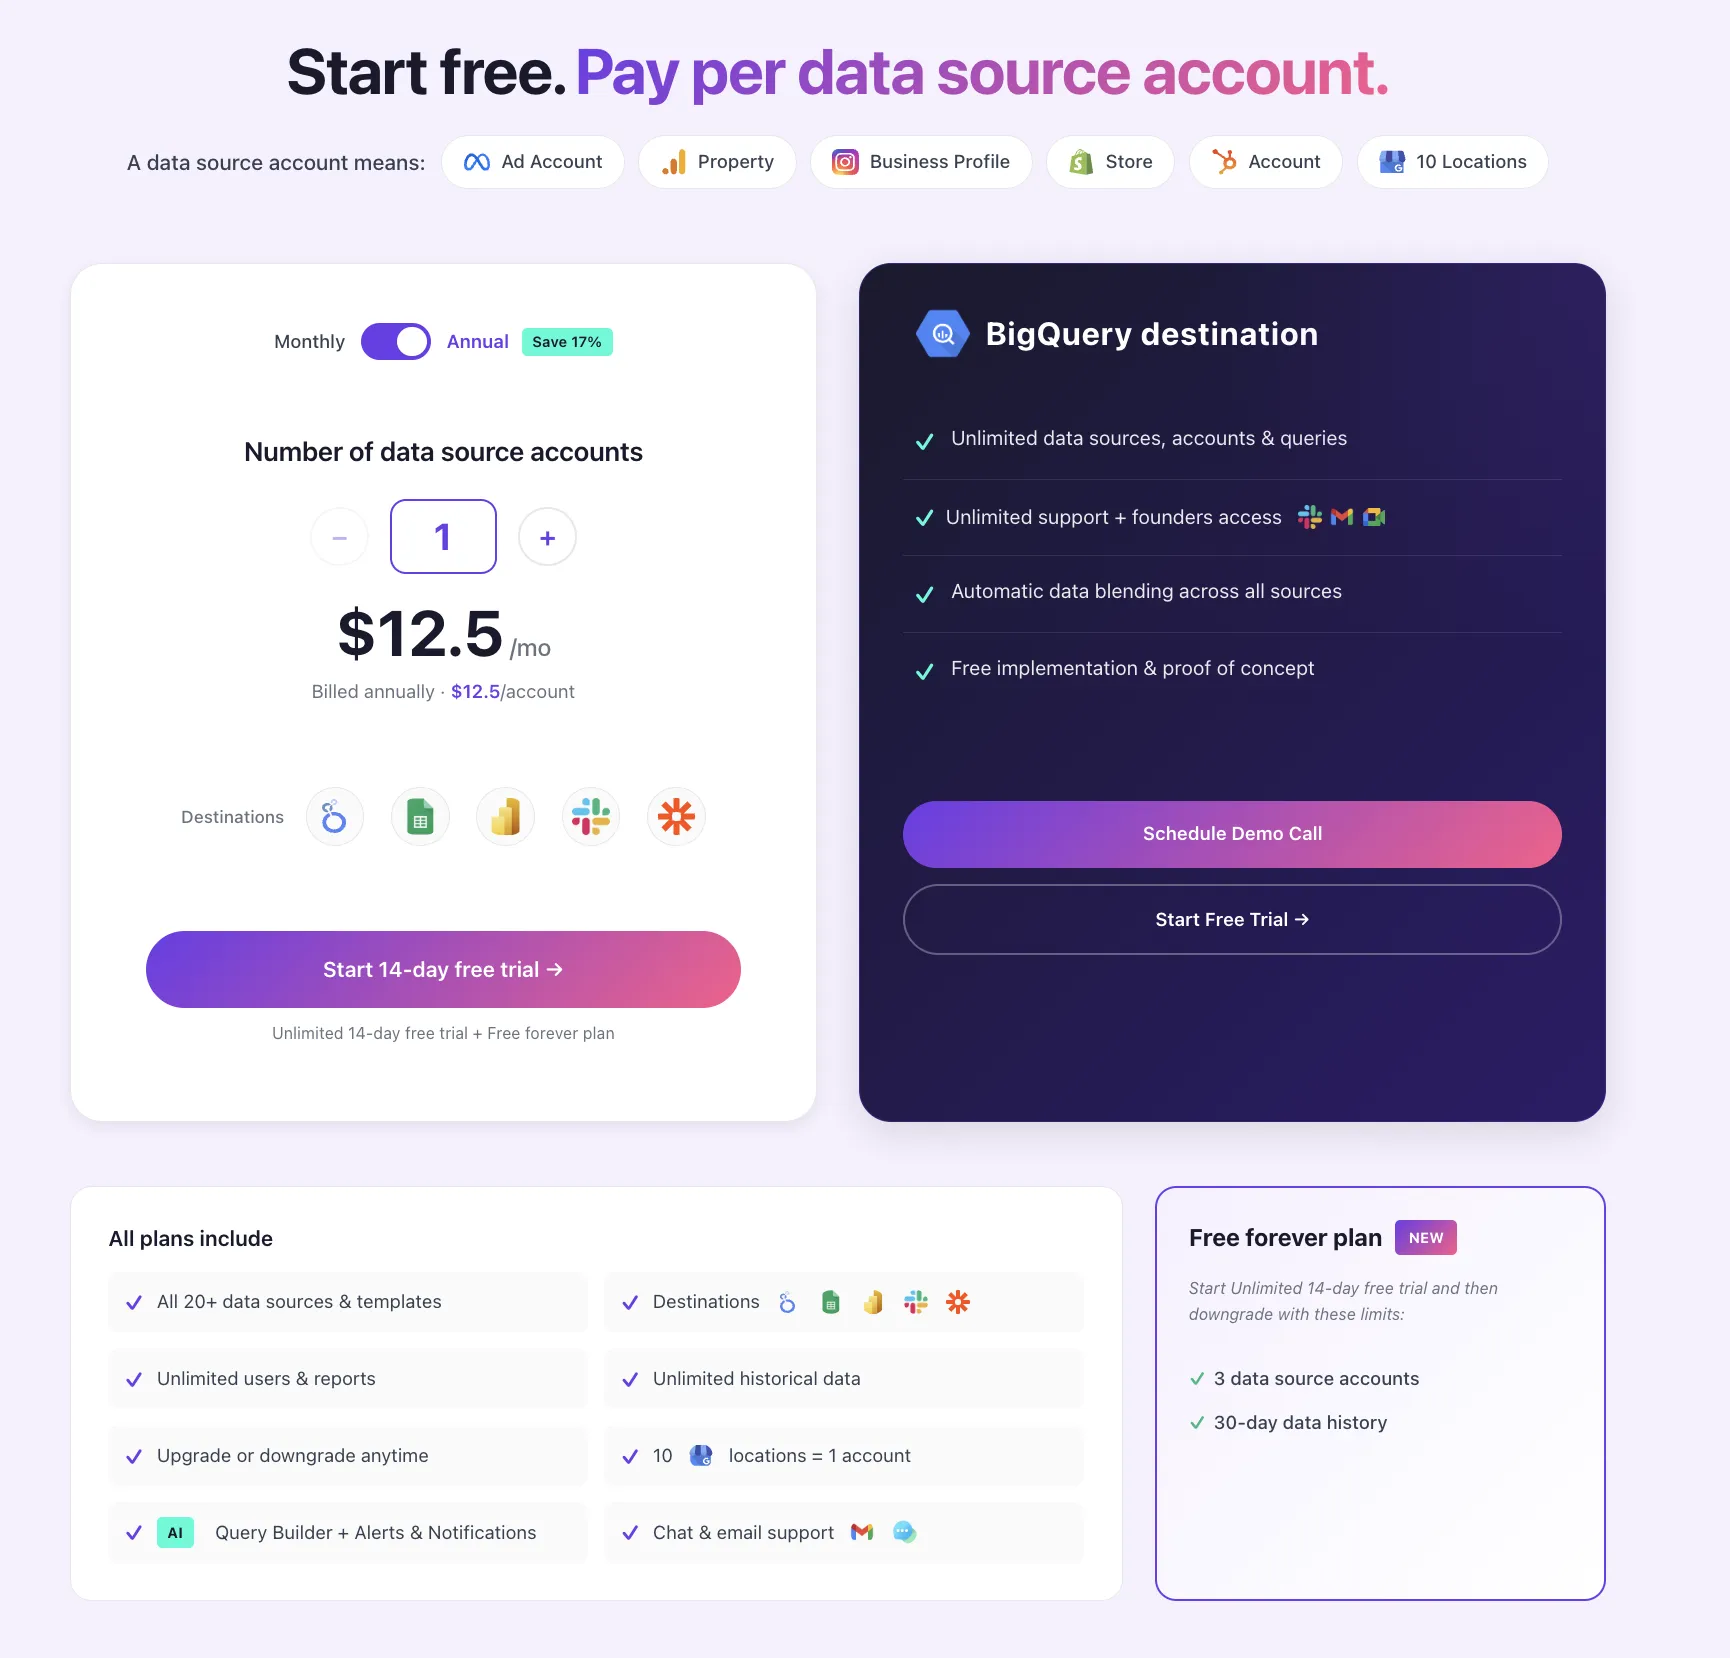
In comparison: Porter Metrics has one pricing variable: data source accounts, starting at $15/month per account. All destinations, data transformations, storage, unlimited API rows, and unlimited users included in every plan.
2. Customer support
What Supermetrics has done well: they’ve invested in hiring. Based on their LinkedIn page (497 associated members), around 43% of the company is in support or customer-facing roles:
- Support: 69 members (13.9%)
- Customer Success: 146 members (29.4%)
- Other roles: 282 members (56.7%)
Estimated from LinkedIn keyword filters. Not exact, but directional.
What users report: on Trustpilot, Supermetrics scores 1.8/5. On G2, support is one of the top negative themes:
- Email or chat only, with response times from days to weeks
- Users report being ghosted after reporting bugs
- No video call support, even on higher-tier plans
At Porter Metrics: customers get a dedicated Slack channel with direct access to founders and developers. Bugs go straight to engineering, not a ticket queue.
3. Data quality and connector reliability
All connectors have speed and stability risks:
- APIs change without notice
- Tokens expire
- Platforms update permissions
Destinations have their own risks too:
- Data Studio can go slow
- Google Sheets has row limits and API scan timeouts
- These issues stack on top of the connector’s own API limitations
Many of these factors are outside of the control of any connector tool, including Supermetrics or Porter.
Supermetrics has a critical limitation because of their pricing: storage, data warehouse destinations, and data transformations to build custom metrics and dimensions are only available on the Enterprise plan.
- CRM and e-commerce connectors are unusable on lower plans: connectors like Shopify, HubSpot, and Klaviyo have APIs that are slow and hit rate limits as soon as you run a few queries. You need to run them on top of a data warehouse and backfill their data in a tool like Google BigQuery to make them work.
- No data transformations: any data cleaning, custom metrics, or blending must be done manually in the destination (Data Studio, Google Sheets). Less reliable and harder to automate than connector-level transformations. On Starter, Growth, or Pro plans, there is no other option.
Porter Metrics includes data blending, storage, and custom metrics and dimensions on all plans, so you can clean your data, calculate new metrics, and troubleshoot these issues yourself.
Here are specific examples of these limitations:
| Connector | The issue | Supermetrics | Porter Metrics |
|---|---|---|---|
 Shopify Shopify |
Shopify’s GraphQL API is limited to 100 points/second on standard plans. A query like products or customers this month can break or take over 1 minute. The REST API (legacy) is even slower at 2 requests/second with a 40-request bucket. | Connector cannot handle slow queries. Requires external storage (Enterprise only) to work around API limits. | Built-in storage in BigQuery. You can run Shopify directly on Data Studio without hitting API limits. |
 HubSpot HubSpot |
HubSpot’s API is limited to 100 requests per 10 seconds on Free/Starter plans (190 on Pro/Enterprise). The Search API is even stricter. CRMs with many contacts or deals hit these limits fast and data doesn’t return. | Without storage (Enterprise only), data is incomplete for large CRMs. | Automatically stores and backfills deals, contacts, and company data, so you don’t run into these limits. |
 Klaviyo Klaviyo |
Klaviyo’s API uses a tiered rate limit system. Heavy endpoints are limited to 1 request/second burst and 15 requests/minute sustained (XS tier). Even lighter endpoints cap at 75 requests/second burst. | Without storage (Enterprise only), data is limited and slow for accounts with many profiles or events. | Storage included. Complete data access without hitting API rate limits. |
 Meta Ads Meta Ads |
Multiple conversion attribution windows exist for the same campaign (7-day click, 28-day click, 1-day view, 7-day view, etc.). You need all of them to compare performance accurately. | Only one attribution window per connection. You need to create multiple connections to see different windows. | Only tool that includes all conversion attribution windows in the same connection. |
 Instagram Stories Instagram Stories |
Stories data expires after 24 hours in the API. If you don’t store it immediately, it’s gone forever. | Data deleted after 24h, not recoverable. | Stores Stories data from day one, nothing is lost. |
Supermetrics versus alternatives: quick comparison
Here’s how every alternative compares to Supermetrics across the dimensions that matter most: pricing, connectors, free plan, and overall ratings.
| Tool | Best for | Starting price | Connectors | Free plan | G2 Rating |
|---|---|---|---|---|---|
 Supermetrics Supermetrics |
High-volume ETL to warehouses and spreadsheets | $37/mo | 150+ | No | 4.3/5 |
 Porter Metrics Top Pick Porter Metrics Top Pick |
Marketing teams and agencies on Data Studio, Sheets, or BigQuery | $15/mo | 25+ | Yes | 4.7/5 |
 Funnel.io Funnel.io |
Enterprise data normalization and governance | ~$200/mo | 590 | No | 4.5/5 |
 Windsor.ai Windsor.ai |
Multi-touch attribution on a budget | $23/mo | 325+ | Yes | 4.5/5 |
 Improvado Improvado |
Large enterprises with complex marketing data | ~$3,400/mo | 500+ | No | 4.5/5 |
 Whatagraph Whatagraph |
All-in-one reporting with built-in dashboards | ~$270/mo | 62 | Yes | 4.5/5 |
 AgencyAnalytics AgencyAnalytics |
White-label client reporting for agencies | $59/mo | 85+ | No | 4.7/5 |
 Dataslayer Dataslayer |
Supermetrics-like experience at a lower price | $39/mo | 51 | Yes | 4.6/5 |
 Coupler.io Coupler.io |
ETL workflows to Google Sheets and spreadsheets | $32/mo | 400+ | Yes | 4.9/5 |
 Power My Analytics Power My Analytics |
US PPC agencies on Data Studio | $49.95/mo | 75+ | Sample only | 4.6/5 |
 Databox Databox |
KPI dashboards with AI insights and goals | $199/mo | 130+ | Yes | 4.4/5 |
G2 ratings as of March 2026. Pricing is monthly, billed monthly. Annual billing saves 15–20% on most tools.
Pricing comparison
Free forever plans
Several data connector platforms offer permanent free plans, not just trials. Here’s how they compare:
| Platform | Connectors | Accounts | Users | Destinations | Key Limitation |
|---|---|---|---|---|---|
| Porter Metrics |
Any | 3 | Unlimited | All | 30-day data history |
| Windsor.ai |
Any | 1 | 1 | All | 1 source · 5M MAR · 1 user |
| Dataslayer |
Any | 1 | 1 | 1 | Manual daily refresh · 1 user |
| Databox |
Selected | — | 3 | 1 dashboard | Daily refresh · 11-mo history · No API/Zapier/spreadsheets |
| Coupler.io |
Any | 1 | 1 | 1 | No auto-refresh · 100 rows/run · 1 active data flow |
| Whatagraph |
Selected | 5 | Unlimited | Reports only (no BigQuery/Data Studio) | Essential integrations only · No white-label · No automated emails |
* “Users” in ETL tools (Porter, Windsor, Dataslayer) means who connects sources; in reporting tools (Whatagraph, Databox, AgencyAnalytics) it includes report viewers. Whatagraph “source credits” = connected accounts.
All plans and pricing models
Each tool charges differently. This table lists the entry, mid, and top plan as shown on each tool’s public pricing page. Prices are monthly (billed monthly) unless noted.
| Tool | Pricing model | Entry | Mid | Top / Enterprise | Free plan | Trial |
|---|---|---|---|---|---|---|
| Supermetrics |
Per destination + per source + per account + per user | $37/mo Starter: 3 sources, 1 dest, weekly refresh |
$199/mo Growth: 7 sources, 1 dest, daily refresh |
$499/mo+ Pro/Enterprise: 10+ sources, BigQuery, custom metrics |
No | 14 days |
| Porter Metrics |
Per data source account. All destinations, users, and features included | $15/mo 1 account, all destinations, all features |
$40/mo 5 accounts, all destinations |
Custom BigQuery, unlimited sources |
Yes | 14 days |
| Funnel.io |
Per connector tier. Annual contracts | ~$200/mo Starter: 121 connectors |
~$800/mo Business: 579 connectors |
Custom Enterprise: 590 connectors, dedicated support |
No | 14 days |
| Windsor.ai |
Per data sources + accounts + destination tasks | $23/mo Basic: 3 sources, 75 accounts, 5 dest. tasks |
$118/mo Standard: 7 sources, 75 accounts, unlimited tasks |
$299/mo Plus: 10 sources, 200 accounts, unlimited tasks |
Yes | 30 days |
| Whatagraph |
Per source credits (1 credit = 1 connected account). Integrations tiered by plan | ~$270/mo Start: 20 credits, Essential integrations only |
~$675/mo Boost: 50 credits, Advanced integrations, white-label |
Custom Max: 100+ credits, Premium integrations |
Yes | No |
| Databox |
Per source ($7/ea extra). 1 source = 1 account/property. Own platform only | $199/mo Pro: 3 sources (=3 accounts), hourly sync, Genie AI, goals |
$499/mo Growth: + datasets, data blending, anomaly detection, forecasts |
$999/mo Premium: 50 sources, 15-min sync, OKRs, white-label, specialist |
Yes | 14 days |
| AgencyAnalytics |
Per client campaign. Own platform only | $59/mo Freelancer: 5 clients |
$179/mo Agency: 10 clients |
$349/mo Agency Pro: 15 clients |
No | 14 days |
| Dataslayer |
Per source + per account + per destination (mirrors Supermetrics) | $39/mo Starter: 3 sources, 3 accounts, 1 dest, daily |
$139/mo Advanced: 7 sources, 50 accounts, hourly, AI + blending |
$419/mo Pro: 10 sources, 100 accounts, hourly + custom |
Yes | 15 days |
| Coupler.io |
Per account ($5.99/ea extra). Workflow-based ETL. Raw tables, user builds joins/appends | $32/mo Starter: 3 accounts, 1 dest, daily, 5K rows/query |
$132/mo Active: 15 accounts, 3 dests, daily, unlimited rows, transformations |
$259/mo Pro: 50 accounts, unlimited dests, hourly, workspaces |
Yes | 7 days |
| Power My Analytics |
Per account (across all sources). Extra: $14.95/ea (Business), $4.95/ea (Pro) | $49.95/mo Business: 5 sources, 5 accounts, Data Studio only |
$199.95/mo Pro: unlimited sources, 10 accounts, Data Studio + Sheets + Excel |
From $295/mo Enterprise: all destinations, 100+ accounts, Sovereign DWH |
Sample data only | 14 days |
| Improvado |
Per data volume (rows/year). Annual contracts only. Unlimited connectors/accounts | ~$3,400/mo* Growth: 200M rows/yr, 2x daily, 1 MCDM, 2 dests |
~$5,000+/mo* Advanced: 600M rows/yr, 4x daily, unlimited dests |
Custom Enterprise: 1B rows/yr, custom sync, dedicated CSM |
No | Demo only |
Prices as of March 2026. Billed monthly unless noted. Annual billing typically saves 15-20%. *Improvado prices estimated from a 2024 proposal made to a marketing agency; actual prices vary by contract. Databox and AgencyAnalytics only report inside their own platforms.
Price vs. data sources: tools with per-account pricing
This chart compares tools with per-source pricing. Porter Metrics is excluded because it charges per connected account, not per data source. Bubble size = accounts included.
Integrations: Connectors and destinations
| Tool | Connectors | Destinations |
|---|---|---|
| Supermetrics |
150+ | 19 |
| Porter Metrics |
25+ | 4 |
| Funnel.io |
590 | 28 |
| Windsor.ai |
325+ | 15+ |
| Whatagraph |
62 | Own platform + 5 |
| Databox |
130+ | Own platform + 3 |
| AgencyAnalytics |
85+ | Own platform + 3 |
| Dataslayer |
51 | 13 |
| Coupler.io |
400+ | ~20 |
| Power My Analytics |
75+ | 9 |
| Improvado |
500+ | 15+ |
Connector counts are based on each tool’s official integrations page.
Destinations across tools
Where each tool can send your data. Reporting tools (Whatagraph, Databox, AgencyAnalytics) have their own built-in dashboards, so destinations don’t apply to them the same way.
| Tool | Data Visualization | Spreadsheets | Data Warehouse / Database | |||||
|---|---|---|---|---|---|---|---|---|
 Tableau Tableau |
 Sheets Sheets |
.svg/960px-Microsoft_Office_Excel_(2019–2025).svg.png) Excel Excel |
 Snowflake Snowflake |
|||||
| Supermetrics |
✓ | ✓ | — | ✓ | ✓ | ✓ | ✓ | ✓ |
| Porter Metrics |
✓ | ✓ | — | ✓ | — | ✓ | — | — |
| Funnel.io |
✓ | ✓ | ✓ | ✓ | ✓ | ✓ | ✓ | ✓ |
| Windsor.ai |
✓ | ✓ | ✓ | ✓ | ✓ | ✓ | ✓ | ✓ |
| Whatagraph |
✓ | — | — | ✓ | ✓ | ✓ | — | — |
| Databox |
— | — | — | ✓ | ✓ | — | — | — |
| AgencyAnalytics |
✓ | — | — | ✓ | ✓ | — | — | — |
| Dataslayer |
✓ | ✓ | — | ✓ | ✓ | ✓ | ✓ | ✓ |
| Coupler.io |
✓ | ✓ | ✓ | ✓ | ✓ | ✓ | ✓ | ✓ |
| Power My Analytics |
✓ | — | — | ✓ | ✓ | ✓ | ✓ | — |
| Improvado |
✓ | ✓ | ✓ | ✓ | ✓ | ✓ | ✓ | ✓ |
Based on each tool’s official documentation. Destination counts only include data visualization tools, spreadsheets, and data warehouses/databases (excluding AI tools, APIs, and MCP). Some destinations may require higher-tier plans.
Features to look for
Beyond connectors and destinations, these are the features that differentiate marketing data tools. Most tools offer some version of these, but the depth and availability vary.
Data blending
Combining data from multiple sources into a single view. For example, merging Meta Ads spend with Shopify revenue to calculate ROAS, or combining Google Ads and LinkedIn Ads to see total ad spend by campaign. Without blending, you’d need to manually join data in spreadsheets or SQL.
Data transformations
Custom metrics, calculated fields, renamed dimensions, and formulas applied to your data before it reaches the destination. This lets you clean, fix, or enrich raw data without touching a spreadsheet. Examples: creating a “Cost per Lead” metric from spend ÷ conversions, or renaming campaign UTMs to readable names.
Built-in storage
Some APIs (like Shopify or HubSpot) return large datasets that need a data warehouse to work properly. Tools with built-in storage handle this for you. Tools without it require you to set up your own BigQuery or Snowflake instance, which usually means involving a data engineer.
Alerts and notifications
Automated messages when something changes: a campaign overspends, traffic drops, or a data sync fails. Can be delivered via email, Slack, or in-app. Useful for catching issues before they show up in a weekly report.
AI features
Natural language queries (“show me top campaigns last week”), AI-generated summaries, anomaly detection, and forecast modeling. These are becoming standard across tools, though the depth varies. Some offer full AI analysts, others just a query builder.
API access
A programmatic way to pull or push data from the tool itself. With AI coding tools like Claude Code and Cursor, any marketer can now connect a tool’s API to their own workflows and AI agents, no developer required. A well-documented API is becoming essential: it lets you automate reports, feed data into custom dashboards, or build AI-powered analysis pipelines that go far beyond the tool’s built-in features.
Some tools also offer MCP (Model Context Protocol) to connect AI assistants like ChatGPT or Claude directly to your data. However, its long-term value is uncertain: MCP servers consume tokens just by being connected (each tool description loads into the AI’s context), and a well-documented API already lets AI agents do the same thing more efficiently. If a tool has a solid API with good documentation, an AI agent can query it directly without needing an MCP layer.
The 10 best Supermetrics alternatives in 2026
Porter Metrics
Cross-Channel Marketing Reports & AI Automation
Porter Metrics is a no-code marketing reporting tool to measure marketing performance towards bottom-line, revenue and profit metrics across all your marketing channels, products, clients, and campaigns. No scripts or additional tools required. It connects your ad platforms (Meta Ads, Google Ads, TikTok Ads, LinkedIn Ads, Microsoft Ads), social media, SEO tools, CRMs (HubSpot, Klaviyo, ActiveCampaign), and e-commerce (Shopify, Amazon) to destinations like Data Studio and Google Sheets, at a fraction of what Supermetrics charges.
Unlike Supermetrics and most competitors that charge per destination, Porter Metrics includes all destinations in every plan: Data Studio, Google Sheets, Power BI, BigQuery, Slack, and Zapier. All plans include unlimited users, no additional usage fees, and +100 Data Studio templates installable in one click.
- All destinations included on every plan (Data Studio, Sheets, Power BI, BigQuery, Slack, Zapier)
- Automatic data blending across sources: dates, campaign names, UTM parameters, spend, impressions, clicks, conversions, and revenue are unified automatically. No table creation, no field mapping, no SQL. Used by +1,500 marketing teams in 60 countries
- Best HubSpot and Shopify ETL on this list: APIs from CRMs and e-commerce platforms have strict rate limits that break live connectors. Porter automatically manages backfills and stores data in a built-in BigQuery warehouse, so reports are fast and reliable from the start. Every other ETL tool on this list requires manual BigQuery setup; Funnel and Power My Analytics offer managed storage only on enterprise plans. Porter includes it on every plan
- AI Workflow Builder for alerts, notifications, chat with data, and task automation (pause campaigns, update products, adjust budgets) directly on connected platforms via Slack and Zapier. All triggers configurable in natural language, no code required
- Custom metrics and dimensions using natural language (AI-powered), written directly to your BigQuery table
- Largest gallery of Data Studio templates in the market, with multi-source combinable templates installable in one click
- Fewest connectors on this list (~25 vs. 150+ on Supermetrics, 325+ on Windsor, 590 on Funnel). If you need data from a platform Porter doesn’t cover, you’d have to use Google Sheets as a workaround or connect via BigQuery
- Fewer destinations than most competitors. Porter supports Data Studio, Google Sheets, Power BI, and BigQuery. No Tableau, no Snowflake, no Redshift, no Amazon S3, no FTP. If your team uses Tableau or Snowflake, Porter is not an option
- Built exclusively for marketers (social media, PPC, e-commerce, CRM). Not a general-purpose data pipeline. If you need non-marketing integrations (databases, project management tools, finance platforms), tools like Windsor or Coupler.io cover far more ground
- No SQL editor. Everything is managed through natural language, visual interface, and AI. Developers or data analysts who prefer writing SQL queries directly will find Porter limiting compared to tools like Funnel, Windsor, or Dataslayer that expose raw data and SQL access
- Not SOC2 Type 2 certified yet. Porter offers NDAs and client-owned BigQuery as alternatives, but for organizations that require SOC2 compliance as a hard requirement, Windsor (SOC2 + HIPAA) or Funnel (SOC2 + GDPR) are better options
Porter Metrics Pricing (source: portermetrics.com/pricing, verified March 2026)
Pay per data source account. All destinations included. Price per account decreases as you add more.
📖 Read more: Porter Metrics full review · Porter Metrics alternatives · Browse 100+ Data Studio templates · YouTube tutorials
Funnel.io
Enterprise Marketing ETL
 4.5 on G2 (74 reviews)
📊 590 connectors (121 on Starter plan)
🕐 Public pricing, but demo required to start
4.5 on G2 (74 reviews)
📊 590 connectors (121 on Starter plan)
🕐 Public pricing, but demo required to start
Funnel.io is the other market leader alongside Supermetrics in marketing data infrastructure. With $131M+ in funding (Balderton Capital, Eight Roads Ventures, Stena Sessan), ~$70M in estimated annual revenue, and ~400 employees, Funnel is the most well-funded tool on this list. It uses a data warehouse-first architecture: all your marketing data flows through Funnel’s managed warehouse before reaching destinations like Data Studio, Google Sheets, or your own BigQuery/Snowflake instance.
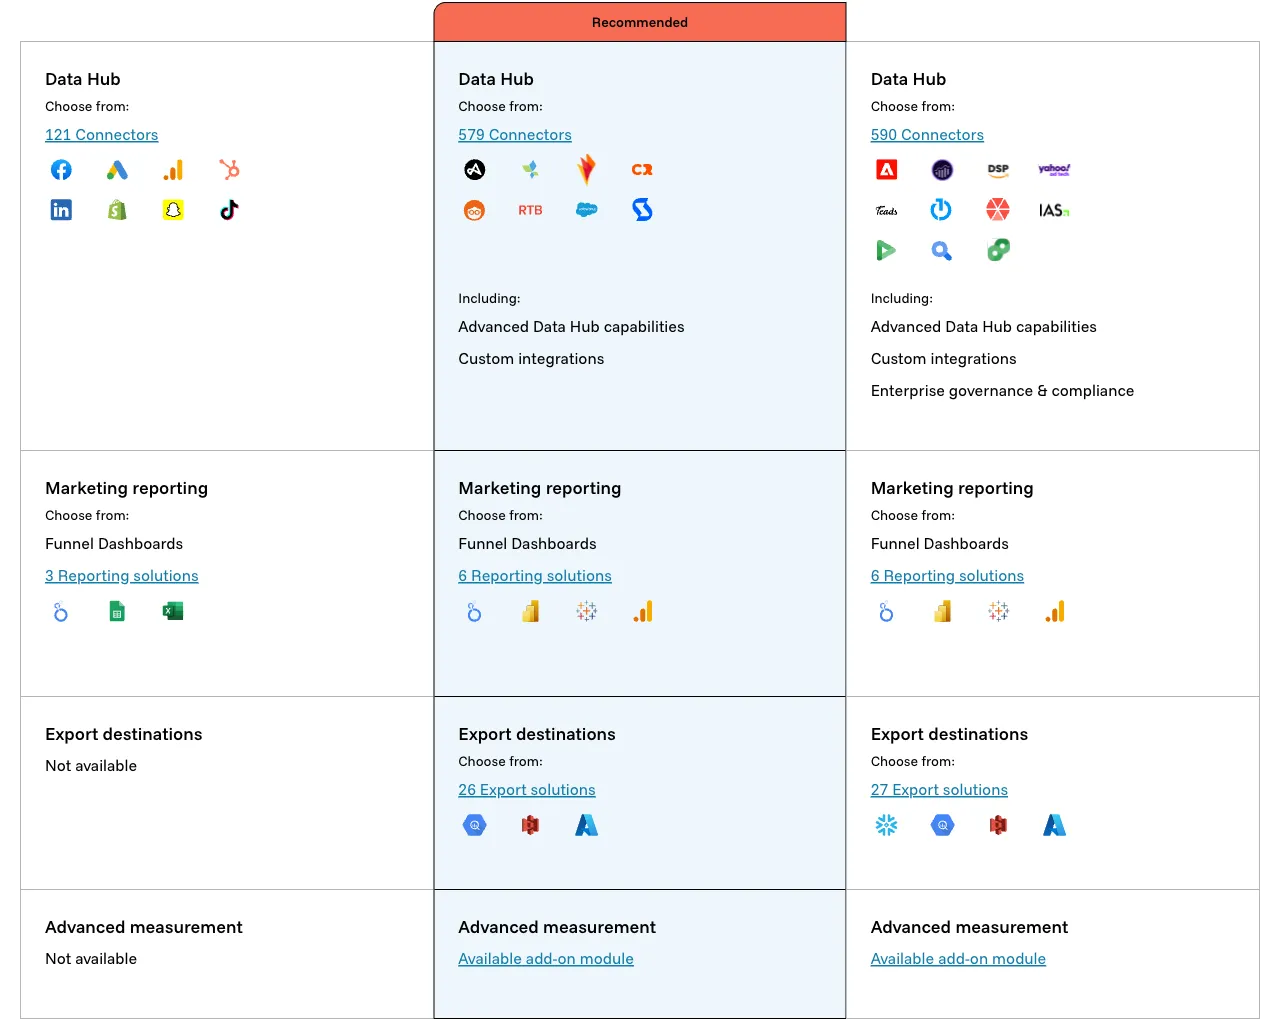
- 590 connectors across 3 tiers (Starter: 121, Business: 579, Enterprise: 590), the widest marketing-specific coverage after Improvado. Part of why Funnel has so many: high-value annual contracts fund custom connector builds for enterprise clients, which then become available to all users
- Data warehouse-first architecture: all data is stored in Funnel’s managed warehouse before reaching destinations, so Data Studio and Sheets reports load significantly faster than direct API connectors
- Visual transformation layer: map fields across sources, create table joins, build custom metrics, and normalize data (e.g., currency conversions) through a no-code interface
- GDPR compliant and SOC2 certified, which meets enterprise security requirements
- Managed data warehouse included, so there’s no need to set up your own BigQuery or Snowflake
- Most expensive alternative: starts at ~$200/mo, requires booking a demo, and likely annual contracts only with no self-service signup
- Complex even for technical marketers: setting up a connection requires mapping fields to tables, configuring joins between sources, and understanding data union logic. It’s not plug-and-play
- Data warehouse-first means no real-time data: there’s always a delay before data is available, unlike live connectors from Porter Metrics or Supermetrics that can query APIs directly
- $131M+ in VC funding creates pressure to grow revenue aggressively. Customers report price increases at renewal and being pushed into annual commitments
- Enterprise-focused: pricing, onboarding, and product complexity are designed for large teams with data analysts, not SMBs or small agencies
Funnel.io Pricing (source: funnel.io/pricing, verified March 2026)
Funnel shows public starting prices but requires a demo to sign up. No self-service. Previously used a Flexpoints (usage-based) model, now uses fixed tier pricing. Annual contracts likely required.
📖 Read more: Funnel.io full review · Funnel.io alternatives
Windsor.ai
Affordable No-Code ETL
Windsor.ai is a no-code ETL tool for marketing data. Think of it as a simplified, much cheaper version of Fivetran focused on marketing. Founded in 2017 in Zurich, Switzerland, it was acquired by team.blue in January 2026 (a European digital services group valued at ~€5B that also owns Metricool). With ~30 employees and 5,000+ customers across 120 countries, Windsor has built 325+ connectors and 15+ destinations at a fraction of the cost of enterprise alternatives.
- Ultra-competitive pricing: 75 accounts across 3 data sources for $23/mo, one of the cheapest options for high account volumes
- 325+ connectors and 15+ destinations including native Power BI and Tableau integrations (rare among marketing data tools). Also native MCP integrations for AI chat tools
- External authentication for agencies: share a link with clients so they connect their own data sources without giving you login credentials
- Free forever plan (1 data source, 1 account, 5M rows) plus a 30-day trial with broader access
- Bootstrapped, now part of team.blue with no VC pressure to raise prices aggressively
- All connectors available on all plans (no premium connectors locked behind higher tiers)
- SOC2 and HIPAA compliant, which is uncommon at this price point. As a European company (now under team.blue), Windsor meets strict EU data regulations by default
- Data quality and stability concerns: users with heavy BigQuery usage report that connectors can break or return inconsistent data. It’s cheap, but less reliable than Funnel or Fivetran
- Raw data output: data from platforms is not well-transformed, so users need SQL knowledge or technical skills to clean and transform data in their destination
- Basic, flat, technical interface: users must choose schemas, select fields, and map them to destinations manually. It’s not designed for marketers expecting plug-and-play like Data Studio
- Destination Tasks are a hidden limitation: each table synced to a destination = 1 task. The Basic plan ($23/mo) only allows 5 destination tasks, which limits how many tables you can create
- Limited data backfill to BigQuery: scheduling only lets you pull 60 days or 6 months of historical data, unlike Porter Metrics where you can choose any date range
- Shopify connector is free because without a data warehouse layer it’s barely functional. Shopify’s API is too slow for live queries
Windsor.ai Pricing (source: windsor.ai/pricing, verified March 2026)
Pricing is per data source and accounts. All connectors and destinations available on all plans. Monthly prices shown; annual billing saves ~15–20%.
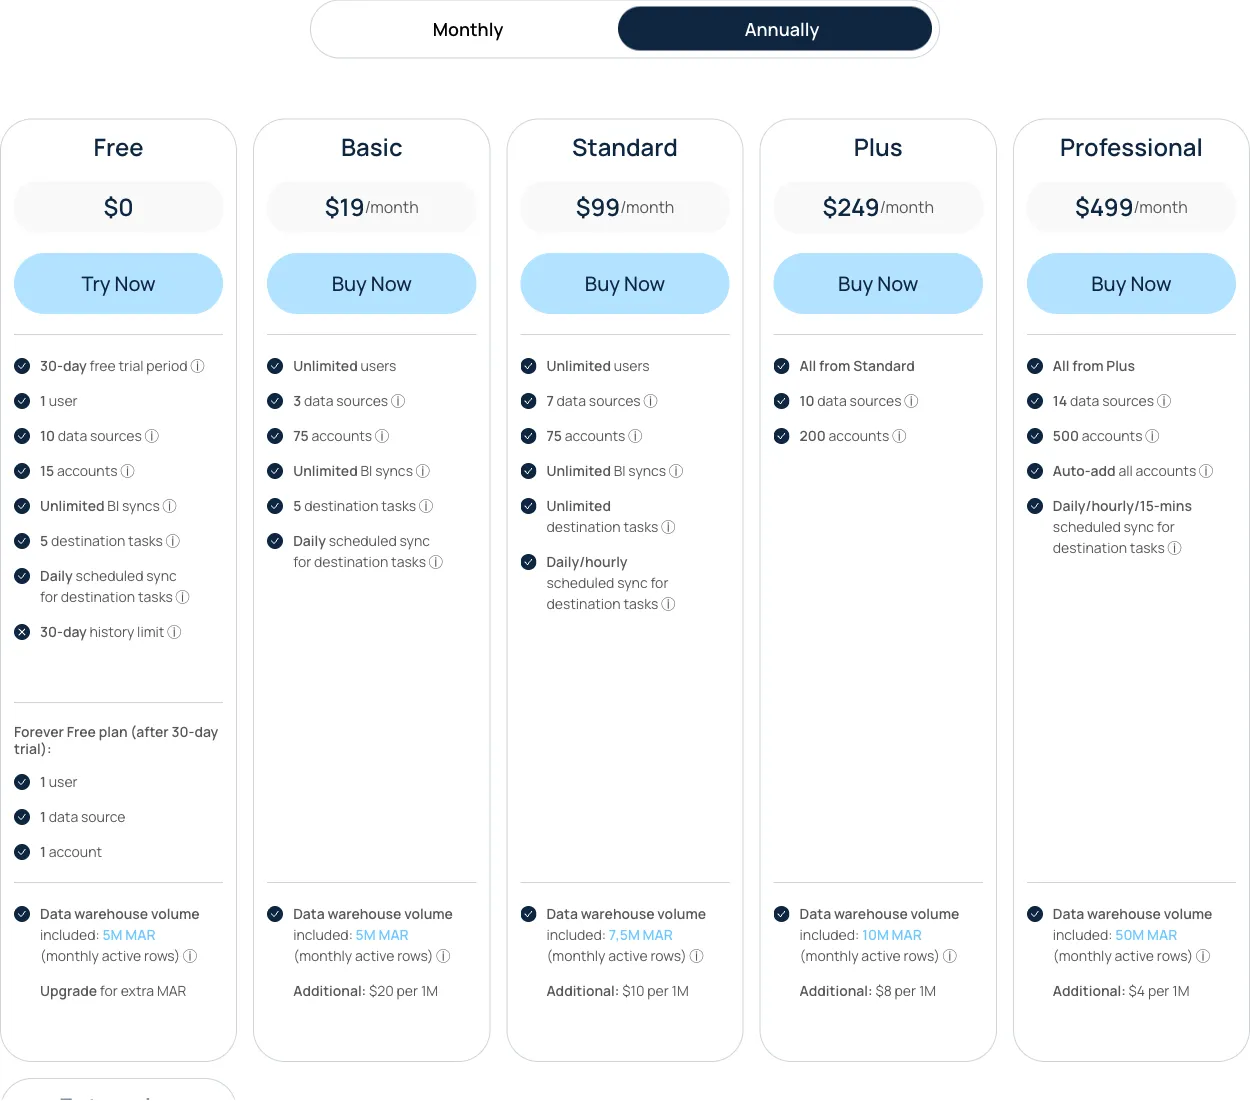
Also available: Professional plan at $599/mo (14 sources, 500 accounts, 15-min refresh, no sync limitations). 30-day trial gives broader access before dropping to free tier limits.
📖 Read more: Windsor.ai full review · Windsor.ai alternatives
Improvado
Enterprise Marketing ETL
Improvado is an enterprise marketing ETL platform with professional services built in. Founded in 2015 in San Diego, CA, it has ~100 employees and ~$34M in funding from Bessemer Venture Partners, Nexus Venture Partners, and 500 Startups. Its customers include Activision, ASUS, Chewy, Mattel, L’Oreal, Yamaha, and Monster Energy.
The platform stores data internally in a ClickHouse data warehouse before loading it to customer destinations.
Unlike self-service tools on this list, Improvado operates as a technology + professional services package. Every plan includes a dedicated Customer Success Manager, onboarding, training, implementation, monthly calls, quarterly business reviews, and professional services credits (5 credits = 1 hour of expert time). Credits can be spent on custom connector development (50-100 credits), dashboard builds (150-500 credits), or managed services (20-800 credits/month).
Pricing context: Improvado does not publish prices. All plans are annual contracts, book-a-demo only. Based on a 2024 proposal made to a client, the list price for the Growth plan was $80,000/year ($6,667/month), with multi-year discounts bringing it to ~$34,000-$41,000/year (~$2,850-$3,400/month). All plans include unlimited connectors, unlimited accounts, and unlimited report types. This makes Improvado the most expensive tool on this list by far, but it bundles professional services that the others charge separately for or don’t offer at all.
- 500+ connectors with 40,000+ metrics and dimensions. No limits on accounts, historical data, or data granularity per source. The deepest extraction coverage on this list
- MCDM recipes automate cross-platform data normalization: “Cost” in Google Ads and “Spend” in Meta Ads become the same field automatically. Available recipes: Paid Social, Paid Search, Organic Social, SEO, eCommerce, Paid Ads + GA4 (joined via UTMs), Programmatic, Email Marketing, and Mobile Analytics. Number included depends on plan (1 on Growth, 2 on Advanced, 4 on Enterprise)
- Cerebro governance engine: 250+ pre-built rules for naming conventions (auto-detects patterns, flags violations, suggests AI fixes, syncs corrections back to ad platforms after approval), budget pacing, campaign QA before launch, and KPI benchmarking with anomaly detection. The only tool on this list with a dedicated compliance layer
- Four transformation toolkits: ANSI-SQL via dbt + GitHub, natural language processing, MCDM pre-built recipes, and professional services. Teams can use all four simultaneously
- AI Agent: natural language chat for marketing data questions, chart/dashboard generation, scheduled reports, and anomaly detection. Choose between OpenAI, Anthropic Claude, or Google Gemini. Only metadata is shared with the LLM; actual data stays within Improvado’s secure perimeter
- Insights & Action Pulse: AI-generated weekly performance summaries with predictive recommendations on spend allocation. 8 insight templates per plan
- Professional services included in every plan: dedicated CSM, onboarding, training, implementation, monthly calls, quarterly business reviews, and credits for custom work (5 credits = 1 hour)
- Custom connector development with contractual SLA: new API connectors built within 4 weeks (50-100 credits per connector)
- Workspaces: physical data segregation for departments, brands, regions, or clients, with cross-workspace transformations for org-level reporting
- 4.5/5 on G2 with 370+ reviews. Quality of support score: 9.4/10 (top 5% on G2)
- SOC 2 Type II, HIPAA, GDPR, CCPA compliant. Geo-restricted data processing (US or EU). SSO/SAML. 6 user roles with full audit trail
- Enterprise customers: Activision, ASUS, Chewy, Mattel, L’Oreal, Yamaha, Monster Energy
- Multiple data warehouse destinations in parallel: BigQuery (managed or self-hosted), Snowflake, Redshift, S3, Databricks, PostgreSQL, MySQL, Azure SQL, ClickHouse, SAP HANA, Google Cloud Storage, SFTP
- Most expensive tool on this list by far. Based on a 2024 proposal made to a marketing agency, the list price for the Growth plan was $80,000/year. Negotiated multi-year contracts bring it to ~$34,000-$41,000/year (~$2,850-$3,400/month). Even at discounted rates, this is 10-20x the cost of tools like Porter Metrics, Dataslayer, or Windsor
- Annual contracts only, book-a-demo only. No self-service, no monthly billing, no free trial, no free plan. You cannot evaluate the product without going through a sales process
- Implementation takes approximately 2 months. This is not a tool you set up in an afternoon. Onboarding, data modeling, transformation setup, and dashboard configuration require dedicated time from both your team and Improvado’s
- Native dashboards are basic and not client-ready according to independent reviews. For polished reports, you need to push data to Data Studio, Tableau, or Power BI. The internal visualization layer is better suited for quick internal views
- Credits are consumed quickly: a custom connector costs 50-100 credits, a dashboard build costs 150-500 credits, and managed services cost 20-800 credits/month. The Growth plan includes only 240 credits/year (equivalent to 48 hours of professional services)
- AI Agent can automate campaign actions (pause ads, adjust budgets) on ad platforms and write back to Salesforce via MCP. Some of these write-back features are new and still being rolled out, so availability may vary by platform
- BI tools (Data Studio, Tableau, Power BI) connect through the data warehouse, not directly from Improvado. This adds latency compared to live connectors like Porter Metrics or Supermetrics that push data directly to Data Studio
- Overkill for small and mid-size teams. If you manage fewer than 50 ad accounts or spend less than $100,000/month on ads, the complexity and cost of Improvado are unlikely to be justified
Improvado Pricing (source: improvado.io/pricing + 2024 proposal made to a marketing agency, verified March 2026)
No public prices. Annual contracts only, book-a-demo required. All plans include unlimited connectors, accounts, and report types. Pricing is volume-based (by rows/year), not by number of data sources. Professional services credits included (5 credits = 1 hour). Below are the three tiers with price context from a 2024 proposal made to a marketing agency.
*Estimated from a 2024 proposal made to a marketing agency (list price $80,000/year for Growth). Multi-year contracts negotiate 49-64% discounts. Actual prices vary by data volume, features, and contract length. Credit usage: custom connectors (50-100), dashboard builds (150-500), managed services (20-800/mo).
Whatagraph
AI-First Reporting Platform
Whatagraph is a marketing reporting platform with its own built-in dashboards, data blending, and a strong AI layer. Founded in 2015 by three brothers in Lithuania (now headquartered in Amsterdam), it has ~63 employees, ~$9.8M in funding (Inventure, Open Circle Capital), and ~2,500 customers. Whatagraph recently relaunched with a much more modern, AI-first interface, a significant upgrade from previous versions.
While Whatagraph can send data to Data Studio and BigQuery, its focus is its own reporting platform. It competes with AgencyAnalytics for agency client reporting, but adds data blending and transformation features that make it closer to a hybrid between a reporting tool and a lightweight ETL.
- AI-first reporting with Whatagraph IQ: create complete multi-tab reports from a text prompt, auto-updating performance summaries, build widgets conversationally, and auto-generate branded themes from a logo upload. On Boost+, IQ+ adds self-healing widgets, custom AI dimensions, and personalized summaries with brand voice
- Beautiful, modern interface, recently relaunched with a significantly improved UX
- Data blending and transformation: “source groups” to blend data across integrations and sync to BigQuery. Visual interface for custom metrics and field mapping, more accessible than writing SQL
- Generous free plan: 5 source credits, unlimited users and reports with Essential integrations
- 62 in-house managed integrations, fewer than ETL tools but maintained by their own team for better reliability
- Key integrations locked behind higher tiers: HubSpot, Shopify, Salesforce, ActiveCampaign, BigQuery, Ahrefs, and Amazon Advertising are Advanced (Boost, €624/mo) or Premium (Max, custom) only, while tools like Porter Metrics include all integrations on every plan
- Data blending requires manual field mapping: you need to understand join logic, map fields across sources, and create table connections. It’s not automatic, but accessible, though still technical
- Alerts are time-based only (notifications), not event-based: you can schedule weekly or daily reports, but you can’t trigger alerts when a specific event occurs (e.g., “notify me when ad spend exceeds $500”). Porter Metrics’ Workflow Builder supports real event-based triggers
- Grid-based dashboard limits layout flexibility compared to Data Studio’s freeform canvas, so you’re constrained to a grid structure for widget placement
- Pricing is high for what you get: Start plan at €249/mo (~$270) for 20 source credits with only Essential integrations. Monthly billing is significantly more expensive than annual
- Tried to move upmarket to compete with Funnel.io for enterprise, but hasn’t matched the depth of dedicated ETL tools. It’s best suited for mid-size agencies, not enterprise data teams
Whatagraph Pricing (source: whatagraph.com/pricing, verified March 2026)
Whatagraph charges by source credits (1 credit = 1 connected platform account). Integrations are tiered: Essential (all plans), Advanced (Boost+), and Premium (Max only). Key Advanced/Premium integrations include HubSpot, Shopify, Salesforce, ActiveCampaign, BigQuery, Ahrefs, and Amazon Advertising.
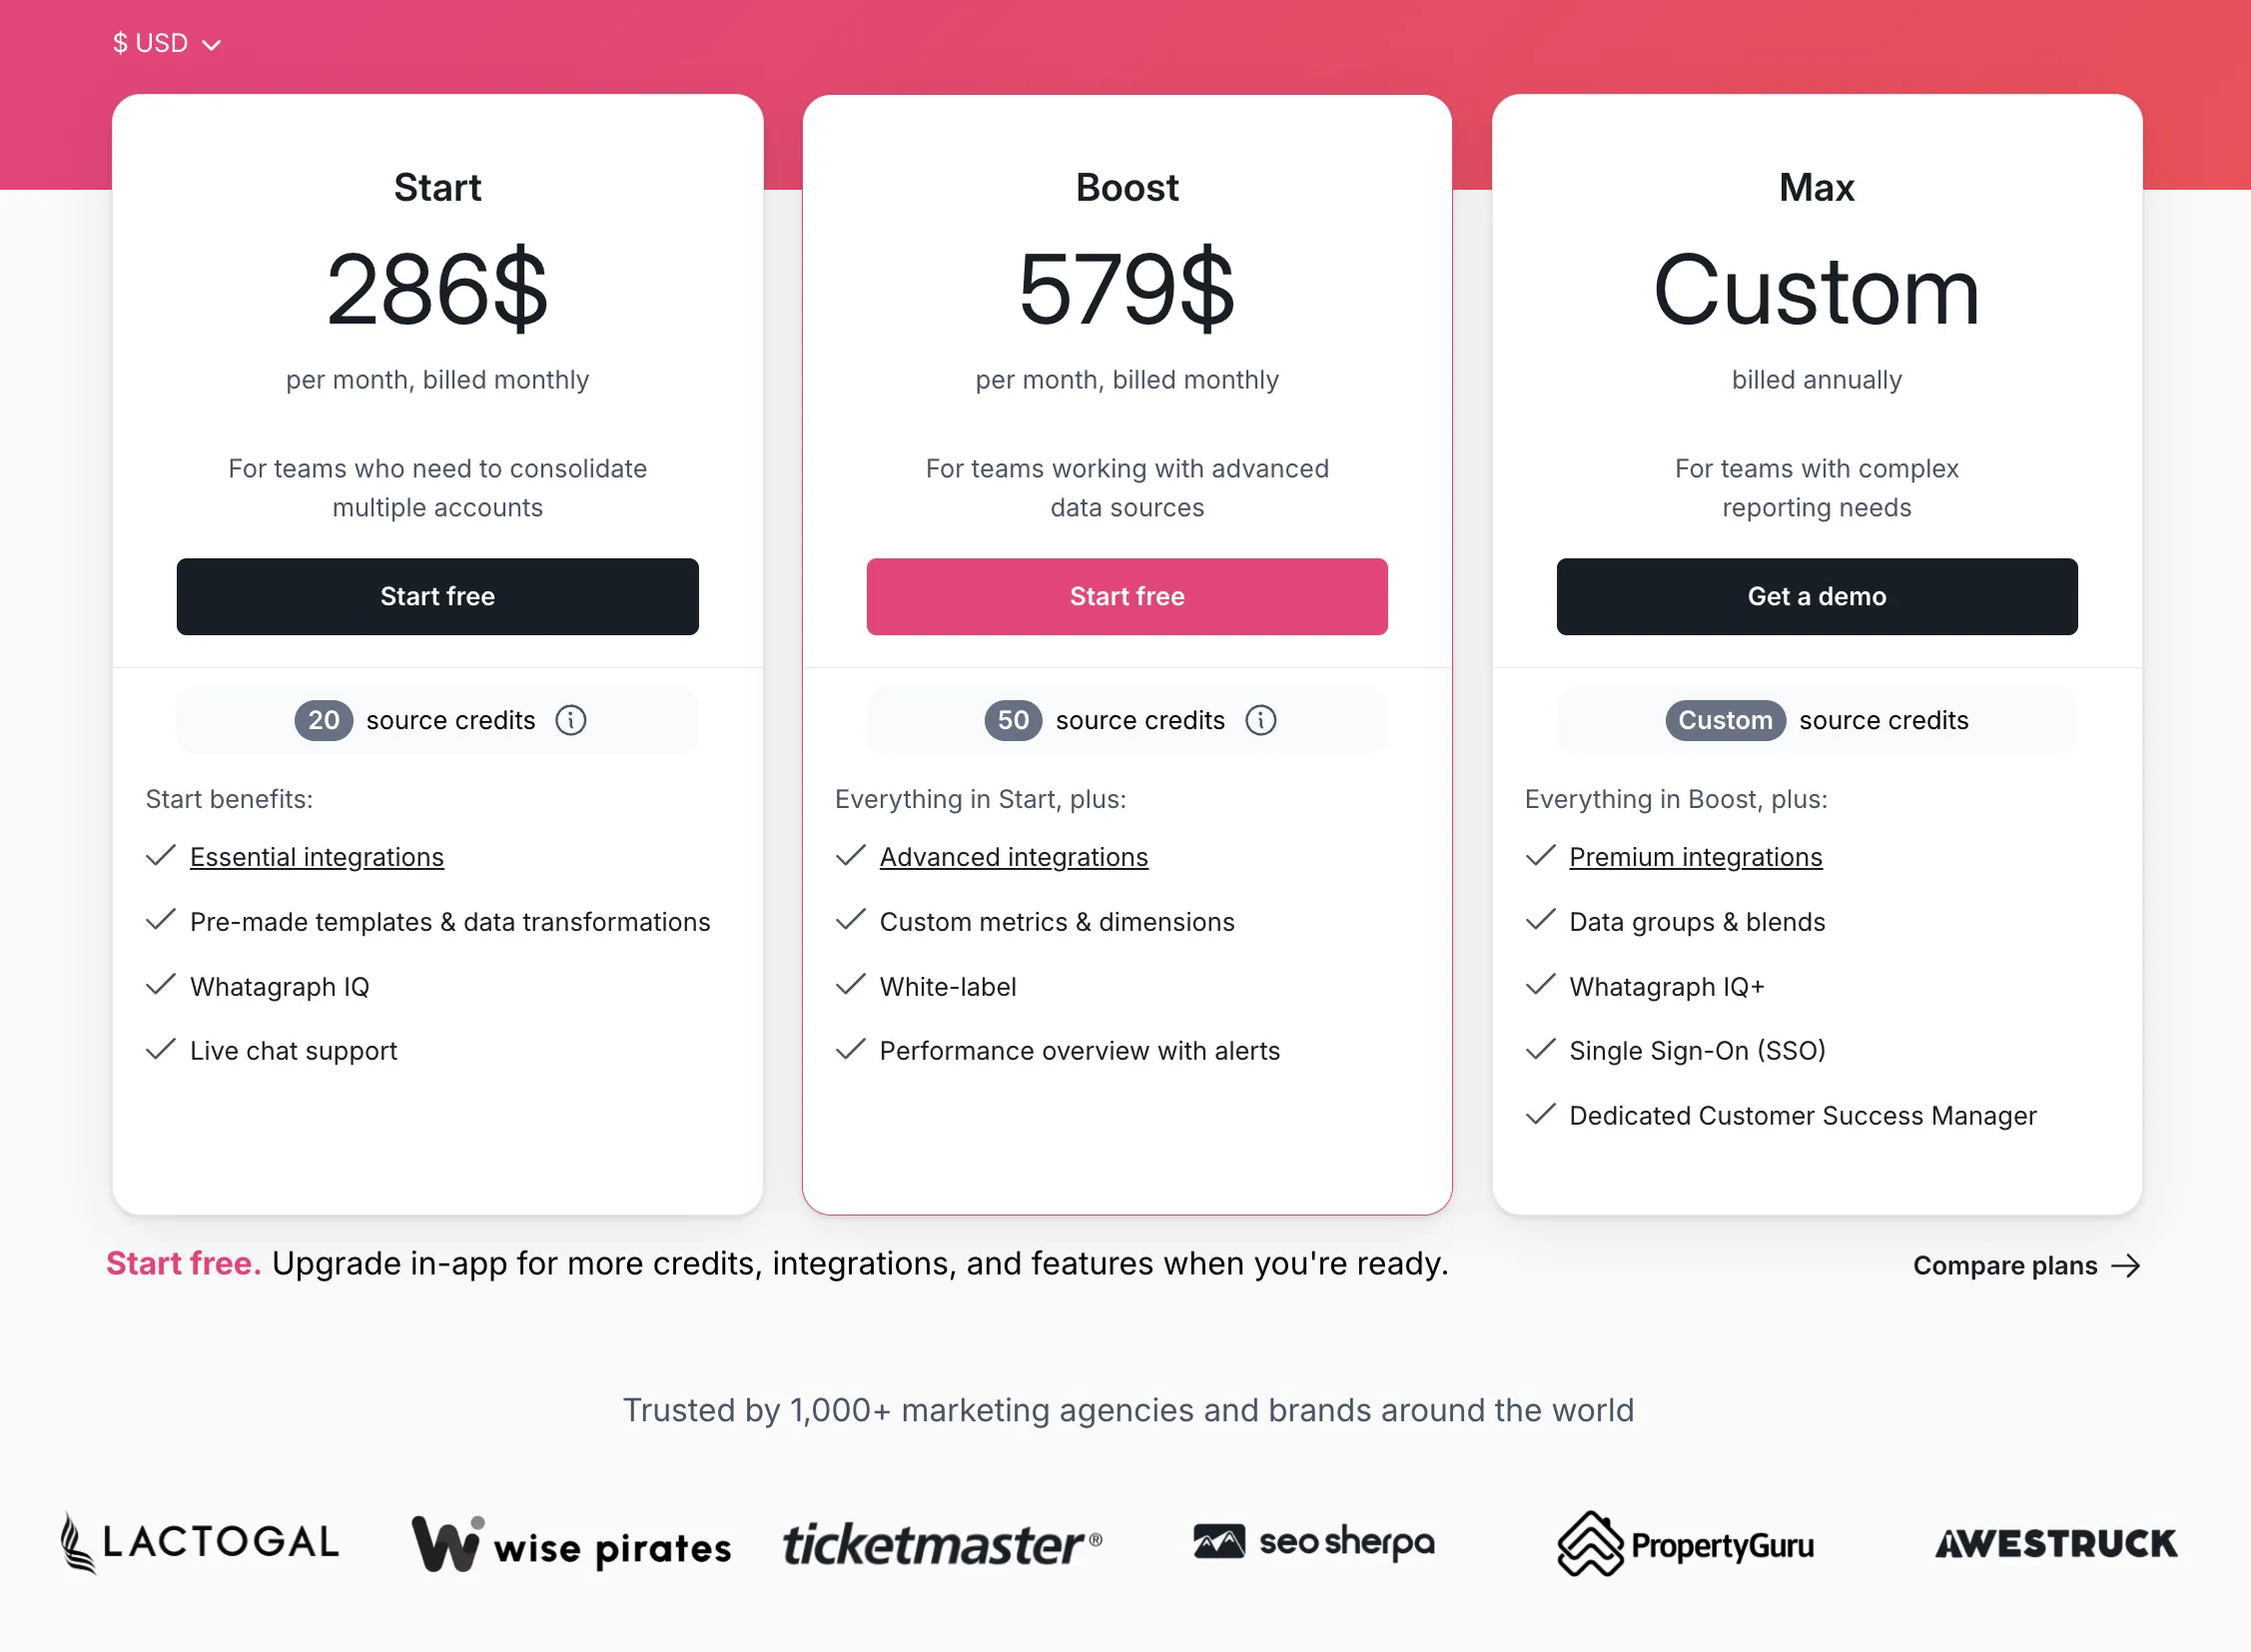
Annual billing saves ~20–35%: Start €199/mo, Boost €399/mo. Whatagraph’s pricing page defaults to annual pricing.
📖 Read more: Whatagraph full review · Whatagraph alternatives
AgencyAnalytics
Agency Client Reporting
AgencyAnalytics is a reporting platform (not an ETL tool or data connector) built specifically for marketing agencies. Founded in 2010 in Toronto, Canada, it’s a bootstrapped, 100% employee-owned company with ~145 employees and an estimated ~$15.7M in annual revenue. It has its own built-in dashboard and reporting interface where agencies create, customize, and share reports with clients.
We’ve seen clients leave Porter Metrics and Data Studio for AgencyAnalytics because it’s significantly easier and more intuitive. These tend to be agencies that need simple, visual client reports and presentations, not teams that need custom metrics, deep data granularity, or cross-source transformations. For simple client reporting, AgencyAnalytics is genuinely one of the best options available.
- Easiest, most intuitive reporting interface for agencies: pre-built templates, drag-and-drop widgets, and Smart Reports that auto-generate in ~11 seconds. We’ve seen clients switch from Data Studio specifically because AgencyAnalytics is simpler to set up and use
- Client portal with integrated messaging: clients log into a branded dashboard, view live dashboards, select date ranges, and chat directly with the agency. Integrates with Intercom, Zendesk, HubSpot, and HelpScout, keeping communication centralized around the data
- Built-in goal/budget tracking, alerts, and industry benchmarks (150,000+ campaigns). Everything organized by client project with lightweight task management
- Built-in SEO tools: rank tracking, site auditing, and backlink monitoring directly in the platform. Most competitors require separate SEO tools (SEMrush, Ahrefs). Available as add-on (~$42/mo per 500 keywords)
- Pricing per client, not per account: 1 client with 5 connected accounts (Meta, Google Ads, GA4, Search Console, Instagram) = 1 client on your plan
- 100% employee-owned, bootstrapped, with aligned incentives with customers, no VC-driven price hikes
- Limited data granularity: tables only allow breakdown by one dimension at a time (e.g., by campaign OR by ad set, but not both together), which is a significant limitation for detailed performance analysis that connectors like Porter Metrics handle natively
- Integration quality can be fragile: in conversations with people who have worked at the company, we’ve heard that some connectors can be slow, return incomplete data, or break. The user experience is polished, but the underlying data layer has known limitations
- No data transformation capabilities: no custom dimensions, no regex to clean URLs, no formula-based fields. What the API returns is what you get. For anything beyond that, you need a separate tool
- Not a data connector: your data lives inside AgencyAnalytics’ platform only. You can’t send it to Data Studio, BigQuery, or your own data warehouse (database connectors for MySQL/BigQuery exist as paid add-ons, but it’s not the core product)
- Costs scale at $20/month per additional client beyond your plan’s included clients. An agency with 30 clients on the Agency plan (10 included) would pay $179 + (20 × $20) = $579/mo
AgencyAnalytics Pricing (source: agencyanalytics.com/pricing, verified March 2026)
Pricing is per client (1 client = 1 business you manage, regardless of how many accounts are connected). Annual billing saves ~20%.
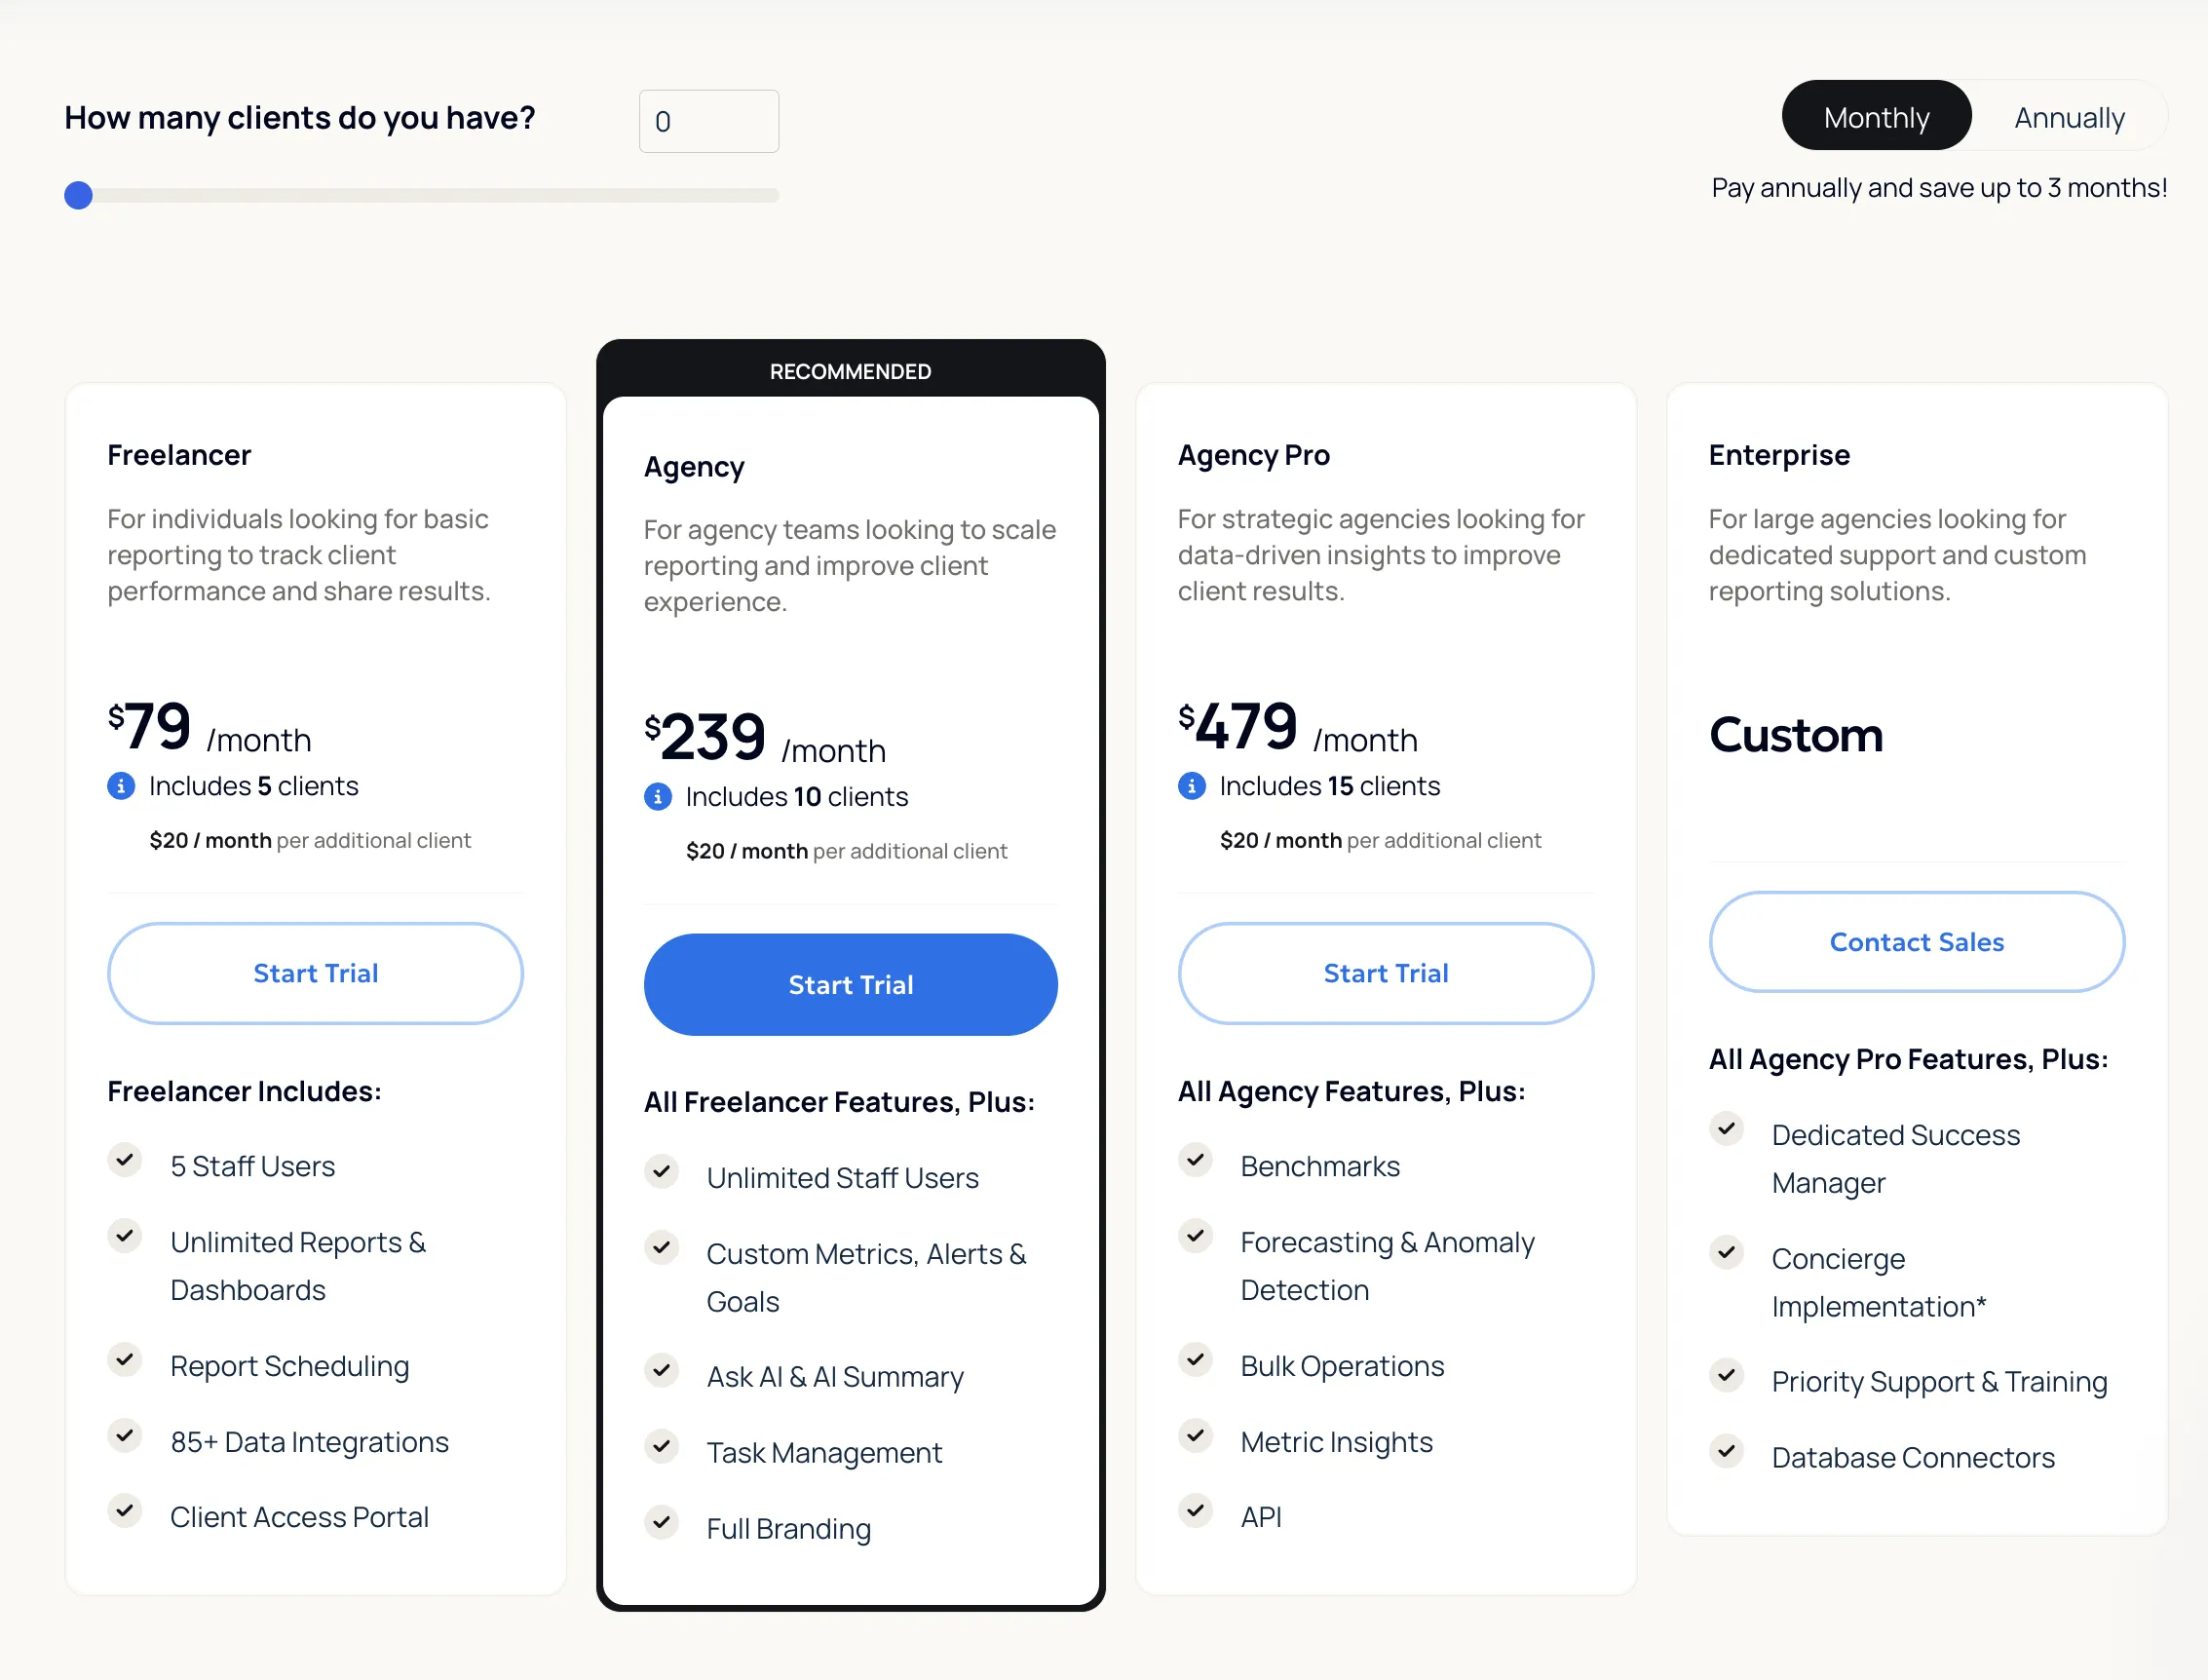
Add-ons: Rank Tracker (~$42/mo per 500 keywords), Database Connectors (MySQL, BigQuery) at custom pricing.
📖 Read more: AgencyAnalytics full review · AgencyAnalytics alternatives
Dataslayer
Budget Supermetrics Alternative
Dataslayer is the most direct Supermetrics clone on this list. Founded in 2020 in Madrid, Spain, it’s a bootstrapped company with ~18 employees and an estimated ~$2M in annual revenue. Its pricing structure, plan tiers (3/7/10 data sources), per-destination model, and add-on system are nearly identical to Supermetrics, but at a lower price point. Where Supermetrics’ Starter costs $37/mo, Dataslayer’s starts at $39/mo with more accounts included. It scores an impressive 4.8/5 on G2 (295 reviews, 88% five-star), making it the highest-rated tool on this list.
- Highest G2 rating on this list: 4.8/5 with 295 reviews (88% five-star). Users consistently praise ease of use and support
- Cheaper than Supermetrics at every tier while mirroring the same pricing structure (per source + per account + per destination), making it the easiest direct swap for teams already on Supermetrics
- API Query Manager: create custom API queries and route data to Power BI, Tableau, or any API-compatible platform, giving broader destination coverage than the standard connector list
- Live chat support with fast response times, a recurring positive theme in G2 reviews
- Marketing Mix Modeling (Morpheus): AI-powered product built on PyMC (Bayesian modeling) that measures channel contribution to sales and runs budget simulations. Only relevant for large advertisers ($100K+/mo ad spend), available as a custom-priced add-on
- Product strategy is based on copying Supermetrics: same pricing structure, same tiers, same add-on model, with limited original differentiation beyond being cheaper
- No built-in storage: relies entirely on direct API calls, which means connectors like Shopify or HubSpot can be slow or break for large datasets. No data warehouse layer to buffer this
- Data blending and AI features only available from the Advanced plan ($139/mo), while Porter Metrics includes data blending on all plans
- Enterprise destinations (BigQuery, Snowflake, Redshift) have strict row limits: 5K rows/mo on Starter, 100K on Advanced, 2M on Pro, while core destinations (Sheets, Data Studio) get unlimited rows
- Data blending requires manual field mapping: users must map metrics and dimensions across sources themselves, unlike Porter Metrics where fields are pre-combined automatically
- Only 1 core destination per plan (like Supermetrics), so additional destinations require add-ons. Porter Metrics includes all destinations on every plan
Dataslayer Pricing (source: dataslayer.ai/new-pricing, verified March 2026)
Pricing mirrors Supermetrics’ structure: per data source, per account, per destination, with add-ons. Only 1 core destination (Sheets, Data Studio, Excel, or Power BI) per plan. Enterprise destinations (BigQuery, Snowflake, Redshift) have row limits. Bundle discounts: 10% for 2 destinations, 15% for 3+. Annual billing saves ~20%.
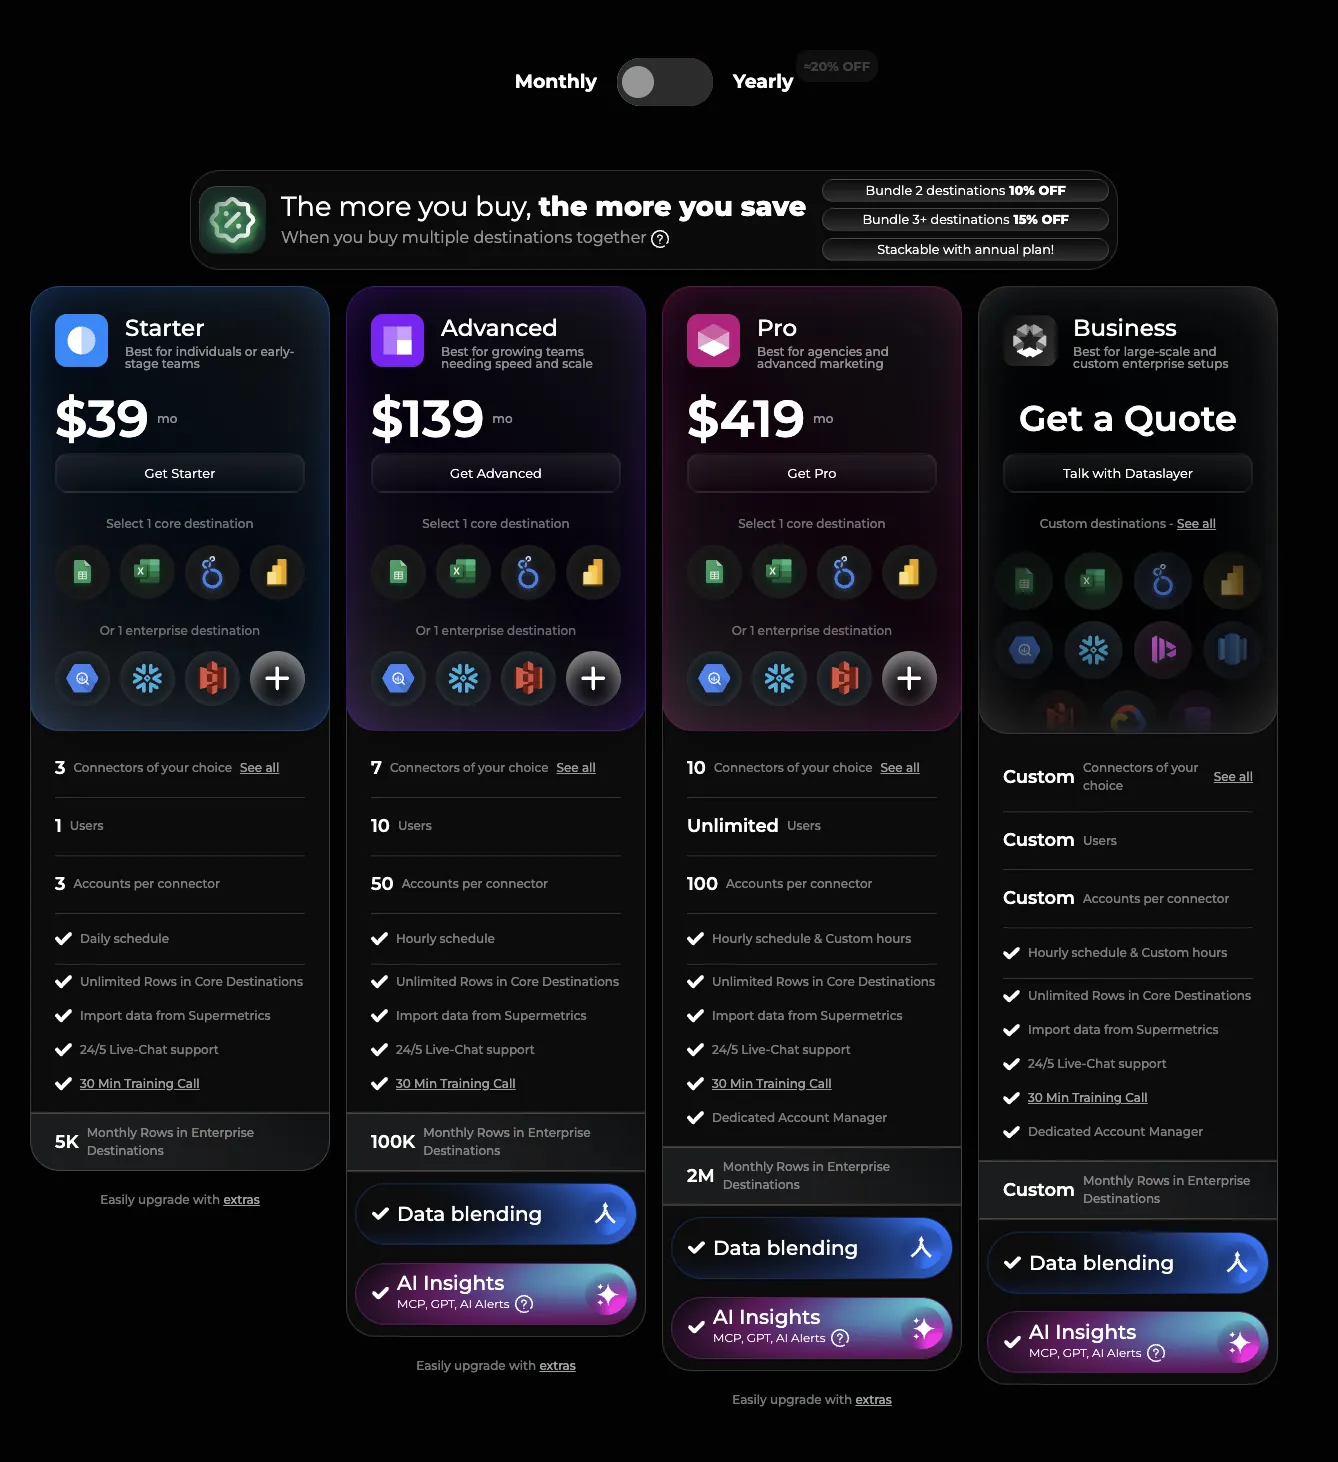
Free plan available (1 connector, 1 account, 1 destination, manual refresh). Marketing Mix Modeling (Morpheus) available as a separate custom-priced product for large advertisers ($100K+/mo ad spend).
📖 Read more: Dataslayer full review · Dataslayer alternatives
Coupler.io
General-Purpose Data Automation
Coupler.io is a general-purpose workflow-based ETL tool (not marketing-specific) built by Railsware, a bootstrapped product studio from Poland/Ukraine (~200 employees, ~$17M in total revenue). Launched in 2019 as “Airtable Importer” for Google Sheets, it evolved into a full data integration platform with 400+ sources and ~20 destinations. Unlike Supermetrics or Porter Metrics which focus on marketing data, Coupler covers project management (ClickUp, Airtable, Asana), customer service (ServiceNow, Typeform), time tracking, and finance (QuickBooks, Xero, Stripe) alongside marketing platforms. SOC 2 certified and GDPR compliant.
Coupler works differently from marketing connectors like Porter Metrics or Supermetrics. Instead of drag-and-drop fields in a dashboard, the user builds data flows as workflows: connect a source, get a raw table, then manually filter, join (combine tables side by side), or append (stack tables on top of each other) to create the output you need. Each integration delivers independent tables per endpoint. This means the user has to understand data modeling concepts (join types, append logic, field mapping) to combine data across sources. In tools like Porter Metrics, this is already solved automatically: dates, campaigns, UTMs, and metrics across all sources are pre-combined without any configuration.
- Broadest destination coverage: Data Studio, Power BI, Tableau, BigQuery, Snowflake, Redshift, PostgreSQL, Monday.com, ClickUp, Google Sheets, Excel, CSV, and API
- 400+ integrations covering marketing, CRM, project management, databases, and finance. Goes far beyond marketing-only tools
- Monday.com and ClickUp as data destinations: unique among alternatives on this list (only Supermetrics also offers Monday.com)
- SOC 2 certified and GDPR compliant at a bootstrapped price point
- Free plan available (1 account, 1 destination, 100 rows, manual refresh)
- API destination allows connecting data to AI tools (ChatGPT, Claude) and any API-compatible platform
- User must model data from scratch: each integration delivers raw, independent tables. The user has to manually filter, join, and append tables to combine data across sources. This requires understanding data modeling concepts that marketing connectors like Porter Metrics handle automatically
- No pre-built relationships between data: for example, combining HubSpot contacts with deals and companies requires manual joins. In Porter Metrics, these relationships are already built into the connector
- Row limits on lower plans: Starter ($32/mo) is capped at 5,000 rows per query. This is a limitation that most ETL competitors (Porter, Windsor, Dataslayer) do not have on their entry plans
- Data transformations (joins, appends, filters) are NOT available on the Starter plan ($32/mo). You can only get raw tables without any combining or filtering. Transformations start at Active ($132/mo)
- Automations (webhooks to trigger data flows from external events) are only available on the Pro plan ($259/mo)
- Not marketing-specific: no report templates, no automatic campaign/UTM matching, no pre-combined cross-channel metrics. You get raw data and build everything yourself
- No white-label or agency-specific features
- Data is not live: tables refresh on a schedule (daily on Starter/Active, hourly on Pro). Not real-time connectors that update on demand
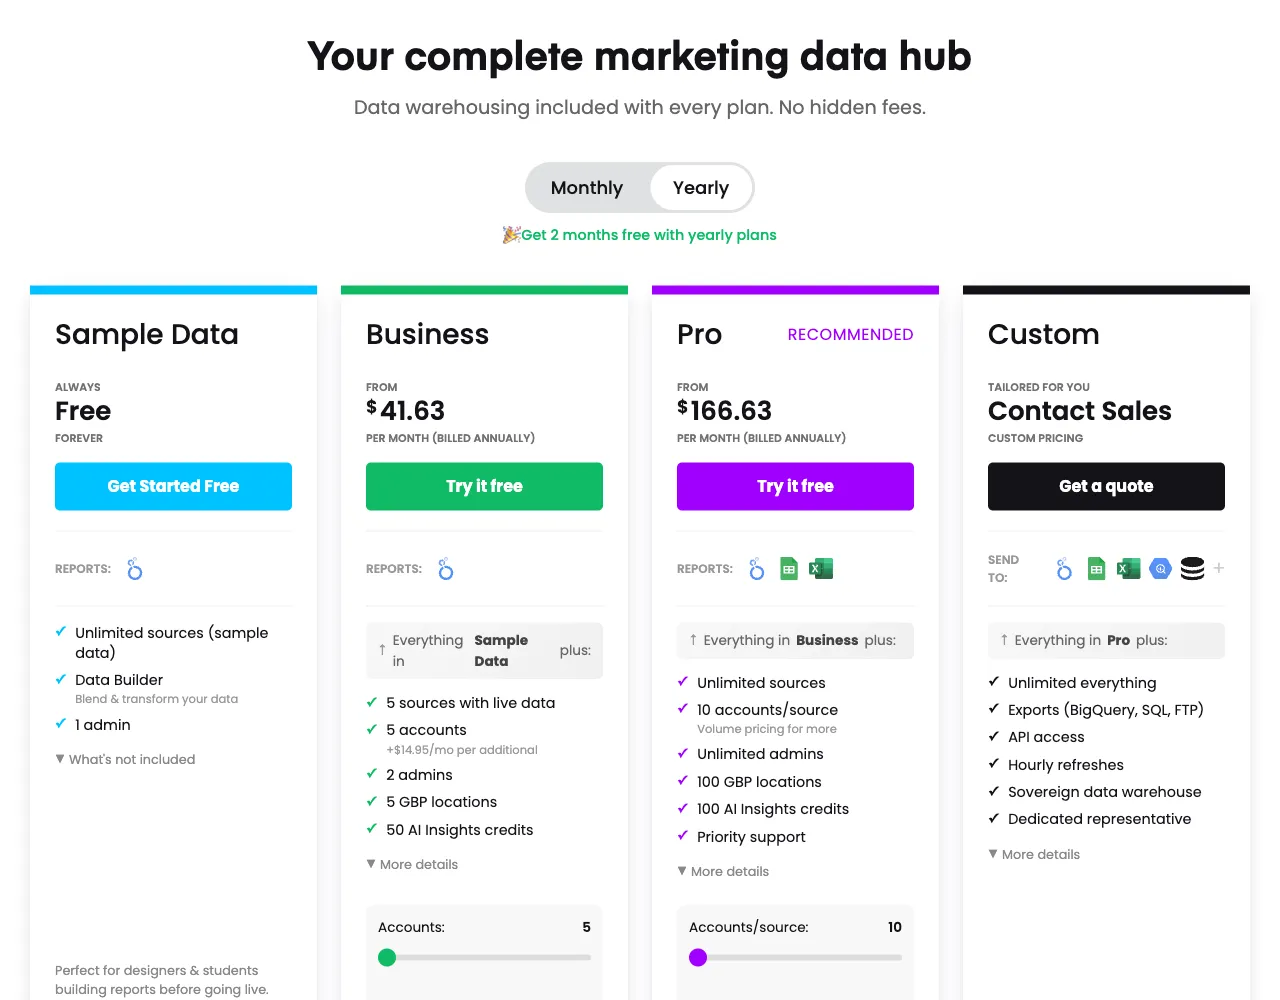
Coupler.io Pricing (source: coupler.io/pricing, verified March 2026)
Pricing is per connected account (same definition as Porter Metrics: 1 account = 1 property/connection). Extra accounts cost $5.99/mo. Annual billing saves ~25%.
Free plan available (1 account, 1 destination, 100 rows/query, manual refresh only). Additional accounts: $5.99/mo each.
Power My Analytics
US-Focused PPC & E-commerce
Power My Analytics is a no-code marketing data connector founded in 2011 in Maitland, Florida. It’s a bootstrapped company with ~15 employees, one of the oldest tools on this list. Originally built as an internal tool by a web analytics consulting agency, it grew into a standalone product. It holds ISO 27001 (2023) and SOC 2 (2024) certifications. PMA was a strong Supermetrics competitor 4–5 years ago, but tools like Porter Metrics, Dataslayer, and Windsor.ai have since surpassed it in pricing, data transformation, and feature depth. PMA remains strongest for US-based PPC and e-commerce teams that need reliable connectors to Data Studio, Sheets, and Excel.
- 75+ connectors with strong coverage for US-focused PPC and e-commerce platforms
- Developer-friendly destinations: Amazon S3, FTP, Snowflake, SQL databases (Azure SQL, MySQL, PostgreSQL), and BigQuery, which is broader than most marketing connectors
- Sovereign Data Warehouse (Enterprise only): a dedicated, isolated data warehouse where the client owns the data. Important for compliance-sensitive organizations
- ISO 27001 + SOC 2 certified, providing enterprise-grade compliance for a bootstrapped tool
- Automatic backfill of historical data upon connection, no manual setup needed
- Pro plan offers volume discounts: extra accounts cost $4.95 each (vs. $14.95 on Business plan)
- No Google Sheets as a data source: if a connector you need isn’t available, you can’t use a spreadsheet to fill the gap. Porter Metrics, for example, supports Google Sheets as a source so users can blend custom data with connector data
- Data Builder is limited in practice: GA4 shows ~20 metrics (vs. 100+ in the API), no auto-combined fields for campaigns/dates across sources, and rigid date ranges (28 days, 30 days, this week, with no custom ranges)
- Business plan ($49.95/mo) only gives access to Data Studio. Sheets and Excel require the Pro plan at $199.95/mo
- 5 accounts total on Business plan (not 5 per source), and extra accounts cost $14.95 each, so 15 accounts would cost ~$200/mo
- Free plan is sample data only (demo dashboards for students), not usable for real business data
- API access is locked to the Custom/Enterprise plan (contact sales), so most users on Business or Pro won’t have it
- Hourly data refreshes are also Custom-only. Business and Pro plans don’t specify refresh frequency, and since PMA uses a pre-data warehouse layer, refresh delays are likely but undisclosed
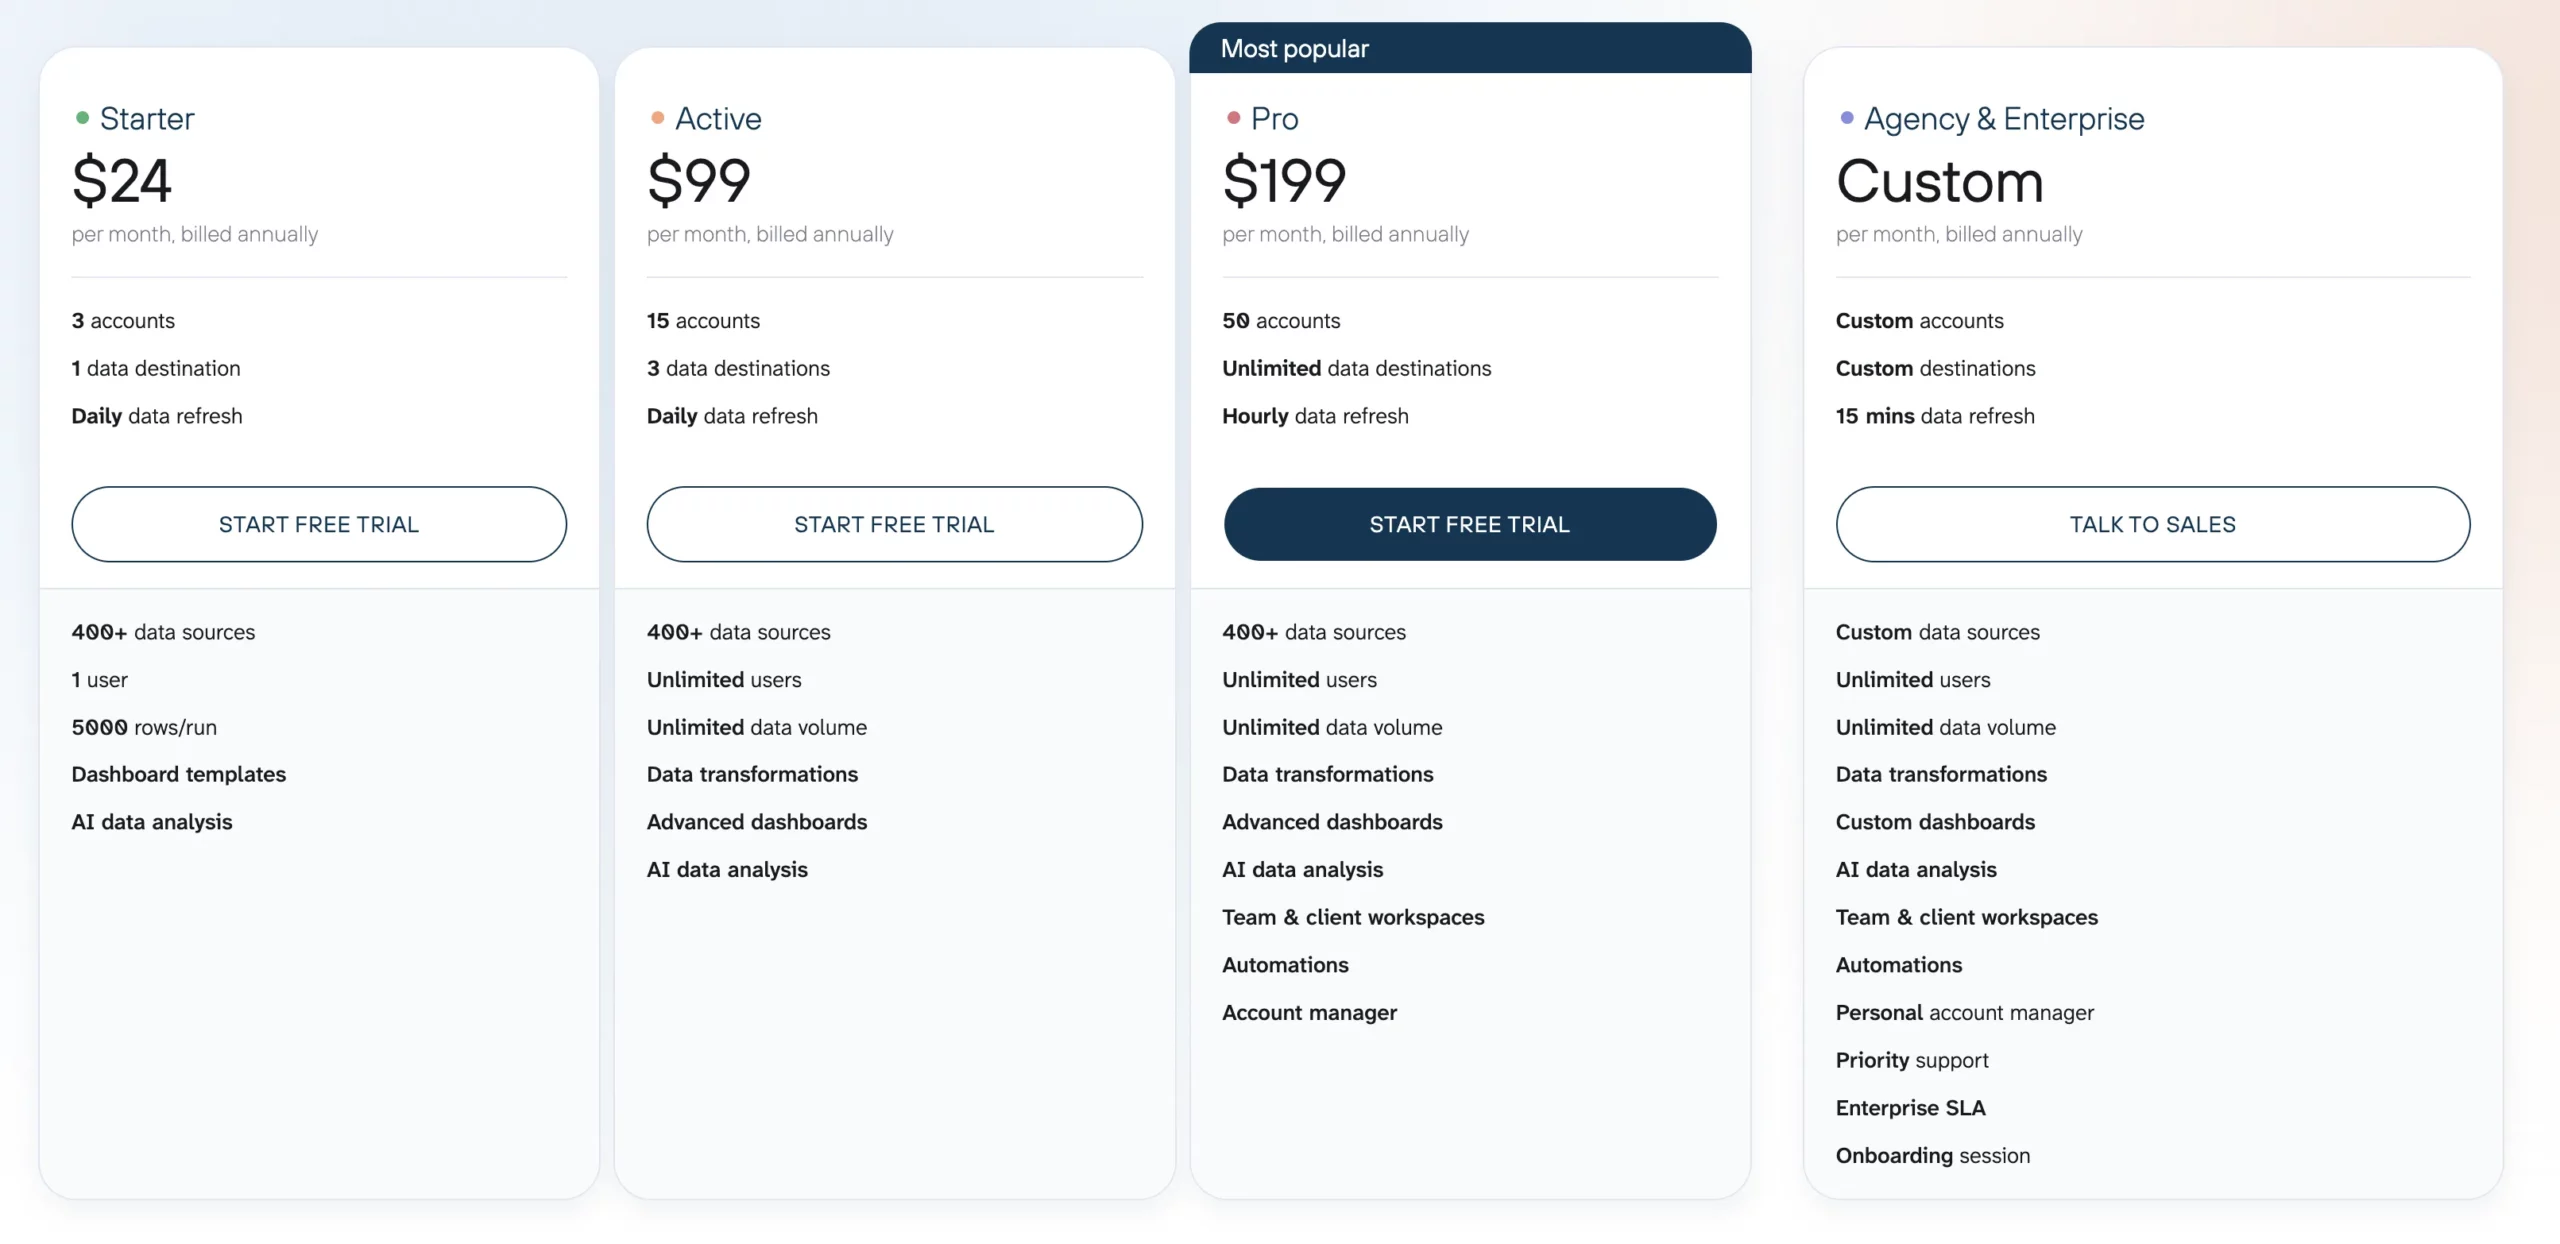
Power My Analytics Pricing (source: powermyanalytics.com/pricing, verified March 2026)
Pricing is per account across all sources (not per source). Business plan limited to Data Studio only. Pro unlocks Sheets + Excel. Enterprise/Custom for BigQuery, SQL, S3, Snowflake, FTP. Annual billing saves ~16%. Extra accounts: $14.95/each on Business, $4.95/each on Pro.
Free plan available but uses sample data only (not real client data). Max accounts: Business 15 (~$200/mo), Pro 100 (~$645/mo). 50–100 AI Insights credits depending on plan.
📖 Read more: Power My Analytics full review · Power My Analytics alternatives
Databox
SMB Goal Tracking & Dashboards
Databox is a reporting and analytics platform with its own built-in dashboards, founded in 2012 in Boston, MA. It has ~160 employees, ~$5.3M in funding (Entree Capital, Founder Collective, Techstars), and ~1,600 customers. Unlike ETL tools that send data to external destinations, Databox wants to be the single source of truth for your business data: everything comes into Databox, and you build, analyze, and share reports inside their platform. It is the only tool on this list with separate plan tiers for businesses and agencies.
Pricing note: In Databox, 1 data source = 1 connection to 1 property (e.g., one GA4 property). In ETL tools, “data source” means the platform itself. So Databox’s “3 data sources” = “3 accounts” in ETL terminology.
- Databases and spreadsheets as input sources: BigQuery, MySQL, PostgreSQL, Google Sheets, and Excel can all be used as data sources (not just destinations). If you have external data not covered by native connectors, you can still bring it in and combine it with marketing data
- Goal tracking and OKRs linked to live data from 130+ integrations. Automatic progress updates, risk notifications, and strategy map views. The only tool on this list with native OKR tracking. OKRs available on Premium ($999/mo) or as add-on ($200/mo)
- Forecast modeling and anomaly detection: unique among the tools on this list (available from the Growth plan)
- AI analyst (Genie): create dashboards from prompts, ask questions in natural language, get performance explanations and recommendations. Available on all paid plans (currently in early access), including API access on the free plan
- Datasets (data transformation layer): create custom tables with raw data, apply filters, calculate new columns, and drill down into raw data behind any metric. Available from the Growth plan ($499/mo)
- Client overview for agencies: a dashboard that groups accounts by client for global monitoring
- Free plan includes API access, which is unusual. 3 users, 3 data sources, 1 dashboard, 10 custom metrics, daily sync
- Hourly data refresh on all paid plans. Data stored in Databox’s internal warehouse, so dashboards load fast
- Strong HubSpot and Shopify integrations, deeper than many of their other connectors
- Separate pricing tiers for businesses and agencies: the only tool on this list with dedicated agency plans optimized for volume
- Mobile app for dashboard access on the go
- “Data source” means something different here: 1 data source in Databox = 1 connection to 1 property (like one GA4 property). In ETL tools, “data source” means the platform itself. So Databox’s “3 data sources included” is equivalent to “3 accounts” in ETL pricing. Extra sources cost $7/mo each regardless of plan
- Connector depth is limited compared to ETL tools: fewer fields, fewer breakdown dimensions. For example, ad creative breakdowns were added much later than competitors like Porter Metrics or Supermetrics
- Data transformation (Datasets, blending, filters, calculated columns) is only available from the Growth plan at $499/mo. The Pro plan at $199/mo allows custom metrics but not data blending or transformation
- Data lives inside Databox only. No native export to Data Studio, Power BI, or external data warehouses. If you leave Databox, your historical data stays behind
- Many differentiating features are locked behind expensive tiers or add-ons: OKRs ($200/mo add-on or Premium at $999/mo), white-label ($250/mo add-on or Premium), advanced security and activity logs ($100/mo add-on or Premium), 15-minute refresh ($18/mo add-on or Premium), fiscal calendar ($50/mo add-on or Premium)
- ETL tools offer live data directly from APIs, while Databox always goes through its internal warehouse. The fastest refresh is 15 minutes (Premium only), while ETL connectors like Porter Metrics or Supermetrics can show real-time data
- Benchmarks feature (anonymous performance comparisons) is being deprecated on April 6, 2026, removing what was once a unique differentiator
Databox Pricing for Businesses (source: databox.com/pricing, verified March 2026)
Pro and Growth plans start with 3 data sources; Premium includes 50 (remember: 1 data source = 1 account/property, not 1 platform). Extra sources cost $7/mo each. Separate agency plans available with lower per-source pricing ($2.40/mo each). Prices shown are monthly billing. Annual billing saves ~20%.
Add-ons available on Pro/Growth: white-label ($250/mo), OKRs ($200/mo), dedicated specialist ($200/mo), advanced security ($100/mo), fiscal calendar ($50/mo), 15-min refresh ($18/mo).
Agency plans are priced separately and reward volume: extra data sources cost $2.40/mo each (vs $7/mo on business plans). Agency Starter includes 5 client accounts with client performance overview, scheduling, and Google Sheets from the first plan. Agency Pro adds unlimited client accounts and branding removal (white-label remains a paid add-on). This makes Databox significantly more competitive for agencies managing many accounts than the business pricing suggests.
Not sure which tool is right for you?
Read our guide on how to choose a marketing reporting tool, or jump straight to the Supermetrics full review to understand what you’re comparing against.
If you’re already using Data Studio, browse our 100+ free Data Studio templates to get started in minutes.
Frequently asked questions
Porter Metrics (free plan, 3 accounts, all features, 30-day history), Windsor.ai (free, 1 source), Dataslayer (free, 1 account, manual refresh), Coupler.io (free, 100 rows/run), Whatagraph (free, 5 source credits), and Databox (free, 3 sources). Adveronix offers a free Google Sheets add-on with connectors for Facebook Ads, Instagram Insights, and Facebook Pages. Supermetrics does not have a free plan.
For Data Studio, keep the same report template and replace data source connections with the new tool’s connectors. Field names may differ, so remap some fields. For Google Sheets queries, rebuild the formulas in the new tool’s syntax. For data warehouse pipelines, table structures vary by tool, so queries need adapting. At Porter Metrics, we handle migration end-to-end: our team migrates your dashboards, remaps fields, and validates data at no extra cost.
Porter Metrics (native Data Studio connectors, 100+ pre-built templates, data blending), Dataslayer (similar connector model, affordable plans), Power My Analytics (strong for US PPC and GBP data), and Windsor.ai (multi-touch attribution built in). All four offer direct Data Studio integration without needing a data warehouse.
Porter Metrics, Dataslayer, and Windsor.ai support Google Sheets as a destination. Coupler.io specializes in ETL to Sheets with scheduling and transformations. Coefficient (free plan, 100+ integrations including Salesforce and HubSpot, two-way sync that pushes data back to platforms) and Awesome Table (35+ connectors, from $16/mo, also builds interactive web apps from Sheets data) are Google Sheets add-ons for pulling live data from CRMs, databases, and marketing tools into spreadsheets. Both serve marketing, finance, and operations teams.
For BigQuery: Porter Metrics (built-in managed BigQuery storage on all plans), Dataslayer, and Windsor.ai. For Snowflake and Redshift: Funnel.io, Improvado, and Windsor.ai. For general-purpose ETL: Fivetran (700+ connectors, usage-based pricing on Monthly Active Rows), Stitch (140+ sources, row-based pricing from $100/mo, built on Singer), Airbyte (open-source option available, capacity-based pricing), and Dataddo (400+ connectors, from $129/mo). These are engineering-focused tools, not marketing-specific. Supermetrics requires an Enterprise plan for warehouse destinations.
Porter Metrics (white-label reports, agency templates, multi-client monitoring, pricing per account), AgencyAnalytics (all-in-one client reporting platform, per-client pricing), DashThis (drag-and-drop dashboards, 30+ integrations, from $49/mo, unlimited users on all plans), and Databox (KPI dashboards with AI insights and client sharing). For enterprise agencies managing large ad budgets, Funnel.io and Improvado offer deeper ETL pipelines.
Porter Metrics (combines Shopify, Meta Ads, and Google Ads data to measure revenue and profit in one dashboard). Polar Analytics (DTC analytics with a first-party server-side pixel for multi-channel attribution, sends enriched conversion data back to Meta and Google via Conversion API, from $400/mo). Triple Whale (Triple Pixel for cross-device attribution, reverse ETL to send data back to ad platforms, Sonar Send for email/SMS enrichment, free tier available, paid from $149/mo). Daasity (omnichannel analytics for consumer brands, 60+ e-commerce integrations, demand forecasting). Unlike Supermetrics, these tools include tracking pixels and send conversion data back to ad platforms to optimize campaign performance.
Dreamdata (B2B revenue attribution platform, maps multi-stakeholder customer journeys, syncs engagement data back to Salesforce and HubSpot, free tier available, paid from ~$750/mo). HockeyStack (B2B revenue data intelligence, 9 attribution models, cookieless tracking, integrates with CRMs and data warehouses, ~$2,200+/mo). Porter Metrics (combines CRM and marketing data for B2B reporting). These tools are built for long sales cycles and multi-touch attribution across marketing and sales, while Supermetrics only moves data without built-in attribution models.
Funnel.io (590 connectors, built-in data warehouse, data governance) and Improvado (500+ connectors, marketing-specific data model, dedicated CSM). Both require annual contracts and custom pricing, with enterprise-grade SLAs and SOC2 compliance. For general-purpose ETL pipelines, Fivetran, Stitch, and Airbyte are industry standards used by data engineering teams, though they lack marketing-specific data models.