


In this blog post, you’ll learn how to create a Social media report in Google Data Studio (formerly Looker Studio)!
You will also learn the easiest way to pull and integrate data from different social media data sources such as Facebook, Instagram, LinkedIn, and TikTok and display the broadest picture in a Google Data Studio dashboard.
In case you want a quick answer, it’s easy! Connect your social media to Google Data Studio….
However, if you want the complete tutorial and get some free social media report templates (valued on 400$) while at it, keep reading.
By the end of this tutorial, you will not only have your Social media report in Google Data Studio. But you will also have professional reports without any hassle.
Before you begin
If you know Google Data Studio and want to start immediately, I suggest you download one of our free Social Media report templates.
To link your Social Media to Google Looker Studio, you will need the following:
- A Google account.
- A Facebook Ads account.
- A Data Studio account
You can also check out this video for a step-by-step guide on connecting Social Media to Data Studio.
Select the Apps You Want to Report On
The purpose of this tutorial is to automate your social media report on Data Studio to create the best report for your client and businesses.
Porter is here to accompany you in creating a great social media report while you understand how Google Data Studio works to display data from Facebook, Instagram, or TikTok.
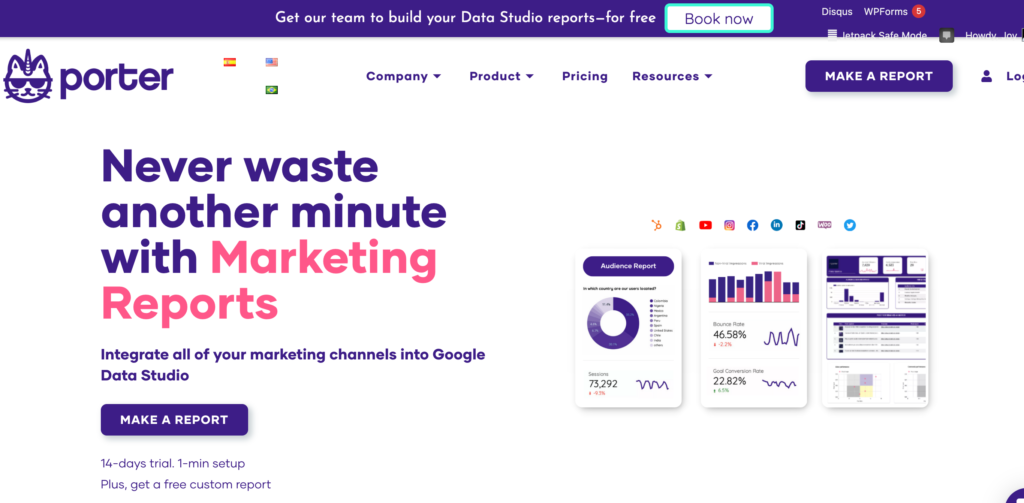
First, go to the templates section on the Porter Metrics website, and select the templates that go according to what you want to visualize in Google Data Studio between the following:
- Instagram and Facebook Insights connector
- Facebook Ads and Instagram Ads connector
- Facebook Public Data,
- TikTok Ads connector
- LinkedIn Ads connector
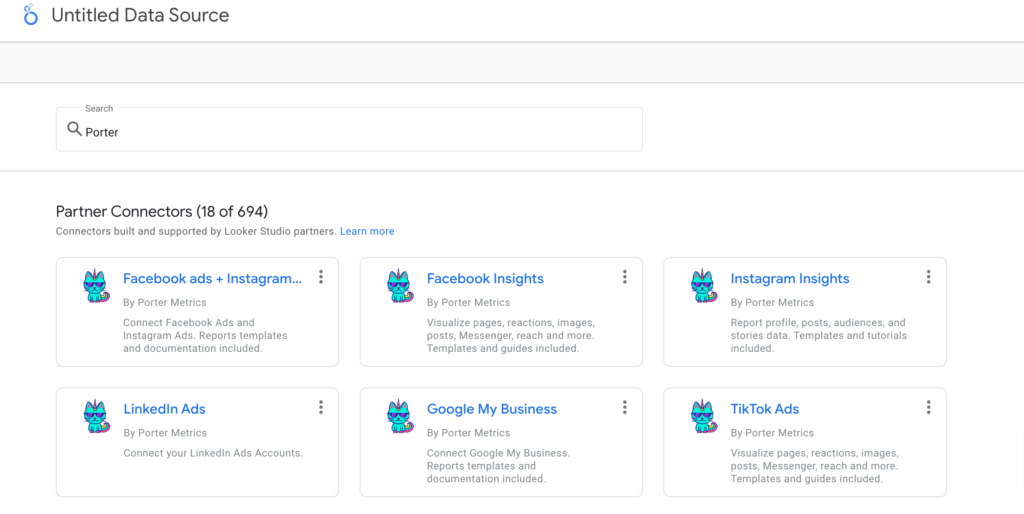
If you are in Google Data Studio, it’s even easier. Simply for Porter Metrics connectors by typing “Porter” on the search bar.
Now that everything is connected, let’s start pulling data and creating complete social media reports.
Connecting Your Social Media App to Data Studio
There are two ways to connect and create a Social Media Report on Data Studio.
You can create reports on Data Studio using CSV files or a connector. Although the CSV files method is free, the process is long and meandering. However, using a connector makes it easy and straightforward.
We have a tutorial on How to Connect Facebook Ads to Google Data Studio, which you can read here.
What does a Social Media Report need to include?
When facing a blank report on data studio; the first thing you should do is get back to why you are in the market. What’s the reason to exist of your business, brand, or company? What are you aiming for?
You can’t forget or isolate your communications strategy in social media from your business objective. First, you must integrate a section in your visualization that allows you and your team members to understand where your report will respond according to the strategy.
Basically, to show what you are going to get from it. We are going to go through the specific points to integrate into this very first part of your reports:
1. Overview
The overview is one of the most critical sections of your social media report. You will introduce why you create content and manage a Facebook, Instagram, or LinkedIn community here.
The overview of your social media depends on the strategy you have created to help your business achieve its goals.
As is shown in the following caption of one of our templates available on the “resources” tab at Porter Metrics.

This Social Media executive report example shows you a structure of those items you may integrate into your report to show actionable results to your team.
This stricture suggests visualizing in a qualitative as in a quantitative way the efforts you are tracking. Remember only to visualize what matters.
2. Objectives
The objectives show you the light and guide you to focus only on what is valuable for your company. Some objectives could be:
- Increase the number of sales month over month to get the leadership of our market category.
- Gain relevance to becoming the number one SaaS of Business Intelligence and raise funds to develop more solutions for users.
3. Social Media Objectives
Sometimes each platform has to help to achieve the main organization’s objective. This is something you have to consider when posting on social media.
Facebook is different from Instagram, LinkedIn is a professional network, and TikTok is meant to bring a different experience to users. That said, setting a different objective for each social media platform is important.
Or which is better, to discover what is the objective you want to achieve and select what platform works better for this purpose. Some of the Social Media objectives could be:
- Reach a larger audience with interests in cars, travel, and clothing
- Engage with users that share a common interest in your organization’s message
4. Social Media KPIs
The Key Performance Indicators or KPIs are the DNA of your Social Media. The KPIs are trackable, achievable, and time-related. For that reason are also comparables.
As you defined your social media strategy, you know the performance indicators you are going to track to determine your strategy’s success. Some of the KPIs you can use are:
- Conversion Rates
- Engagement Rates
- View-through rates
- Click-through rates
This category of KIPs is well known by marketers who need to have a readable report. Your team must be familiar with those calculations and what they tell us.
As a quick example, the Click-Through rate is not only “the number of clicks users made” on a post. It can also be an indicator due to its combination with the metric Rech that determines a percentage of those users who saw the post.
Here you are interpreting how many users were interested in your content to give you a click. So it is simple. We have two metrics (Clicks) and (Reach).
But without any context, the easiest way to read them is when you can calculate something that indicates the performance of your piece of content.
Now you have a: Consideration KPI! But what about when those metrics do have a context? It is the case of the metric: Reach as an indicator.
The indicator could be reached users in a month or just the regular Page Reach when talking about Facebook. As an example, the Page Reach for this page is 54M, but it was 44% lower compared to the previous month:

What can you say about this behavior? As an analyst is necessary you always interpret data and make your outcomes. Some of the most common KPIs analyst track are:
- Community Growth: It’s ubiquitous to focus on this number because it can indicate changes in social media algorithms.
- Reached audience: This indicator is helpful when visualizing variation and differences considering time ranges. In addition, it is useful when you hypothesize about what type of content helps achieve your communication goals better.
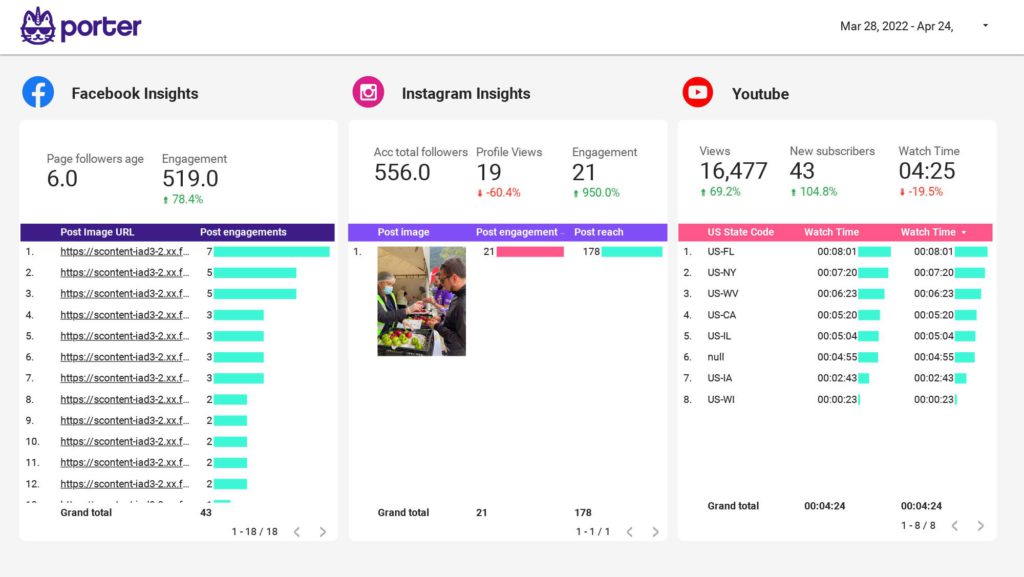
5. Social Media Metrics
The metrics are just items that help the gathered information to make sense. Metrics vary according to what you want to show and complement your report. Those without context are just numbers.
Some metrics from a Facebook Page can be pulled from the Page Insights or Post Insights sections.

In this example, we displayed data related to the page because it is part of the next part of the story we want to tell with our report.
The very first part of your content analysis should provide numbers as a reference to guide the reading of the performance of each content.

You can add the number of content pieces you’ve posted in a period of time and also display metrics such as:
- Post Engagements
- Post Reactions
- Post Comments Count
- Post Shares
Now that we better understand the differences between KPIs and Metrics, it is time to read the performance of the posted content pieces.
Get our Free Data Studio Templates!
Templates are helpful, and we will share some inspiring ones to lit up the reporting process. Porter offers a free bundle of templates, and you can receive those via email by clicking on the resources tab at Porter Metrics.
- Go to the Porter Metrics website
- Click on the “Resources” tab and select “Templates”
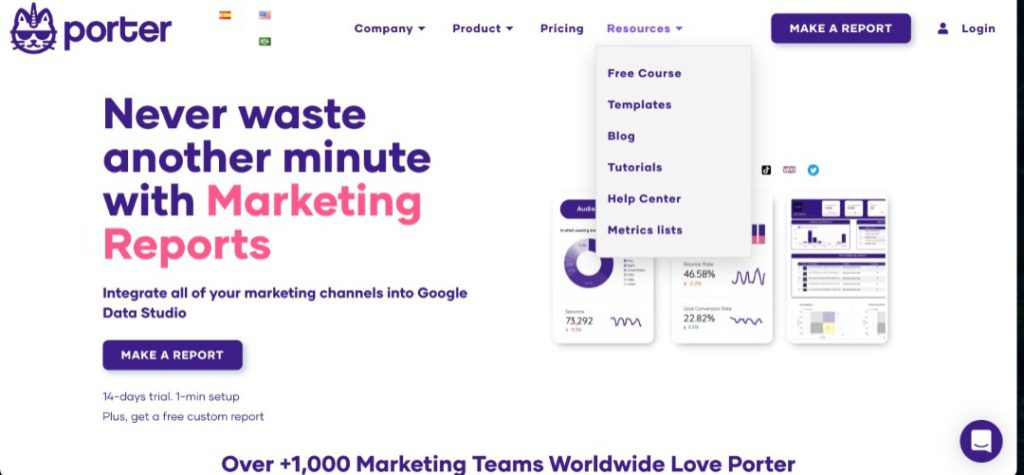
- You will be redirected to our “Free digital marketing report templates “
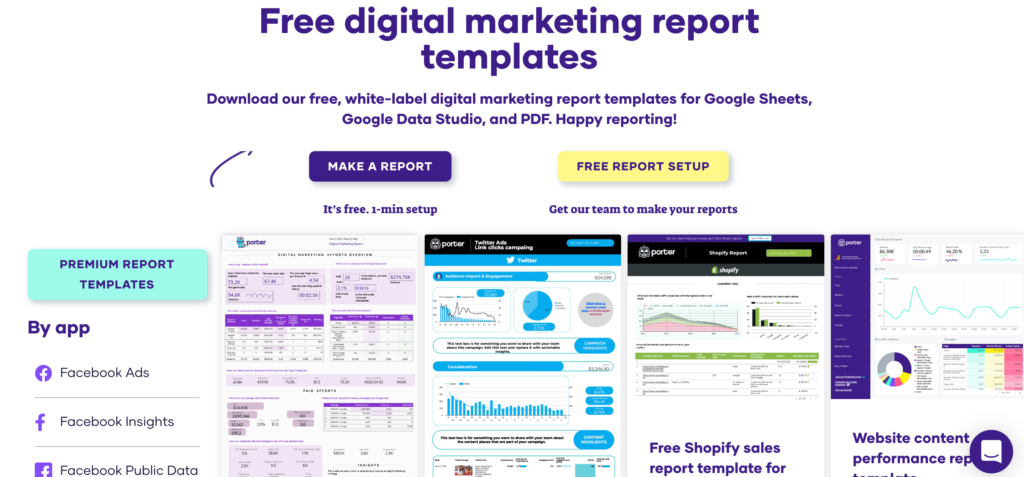
- You can either scroll through the gallery or select a specific app on the left-hand side of the page. For this tutorial, we chose the “Social Media” templates.
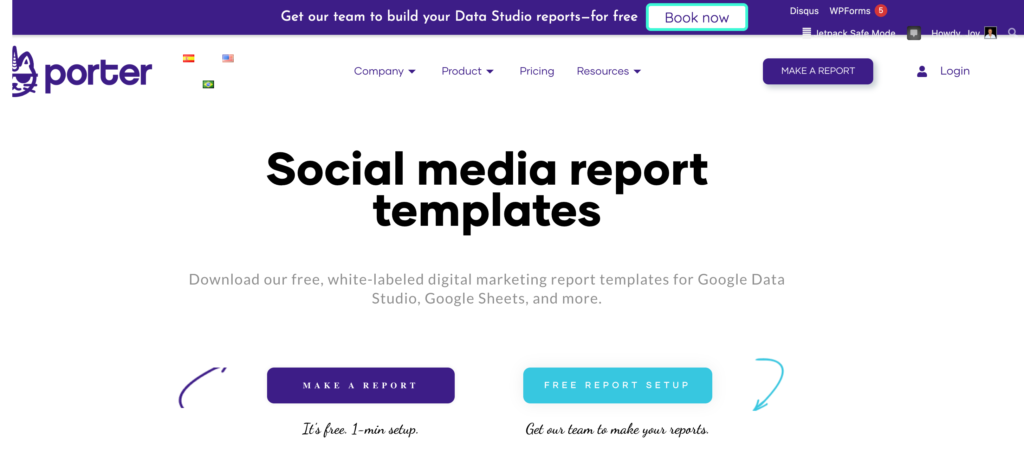
- You will be redirected to this page. You can choose to either download the template or get a free setup call with our support team. Click on “Download Template”
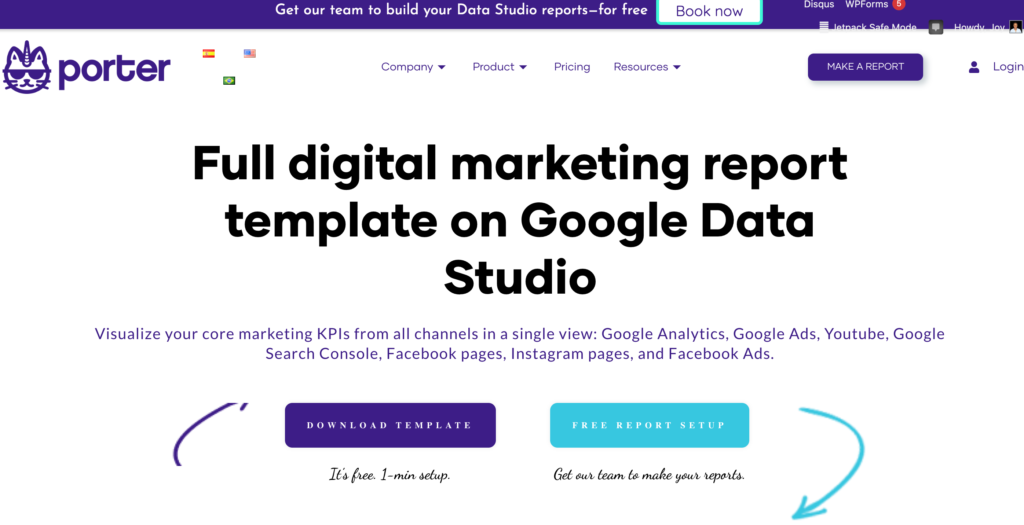
- Once you get to this page, you can choose to either schedule a call with our team, start a free trial or get the template directly. Click on “Access the template”
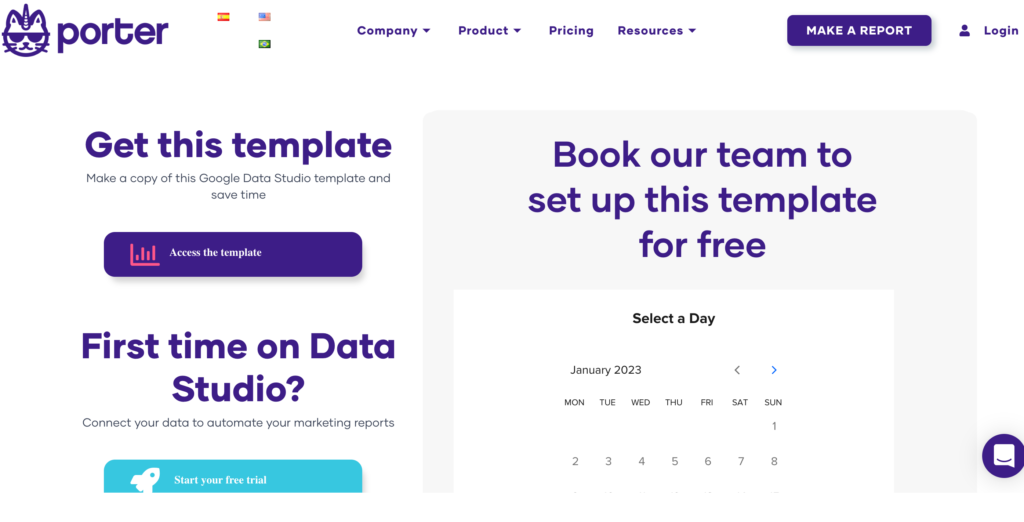
- You will be redirected to Looker studio, where you can upload your data.

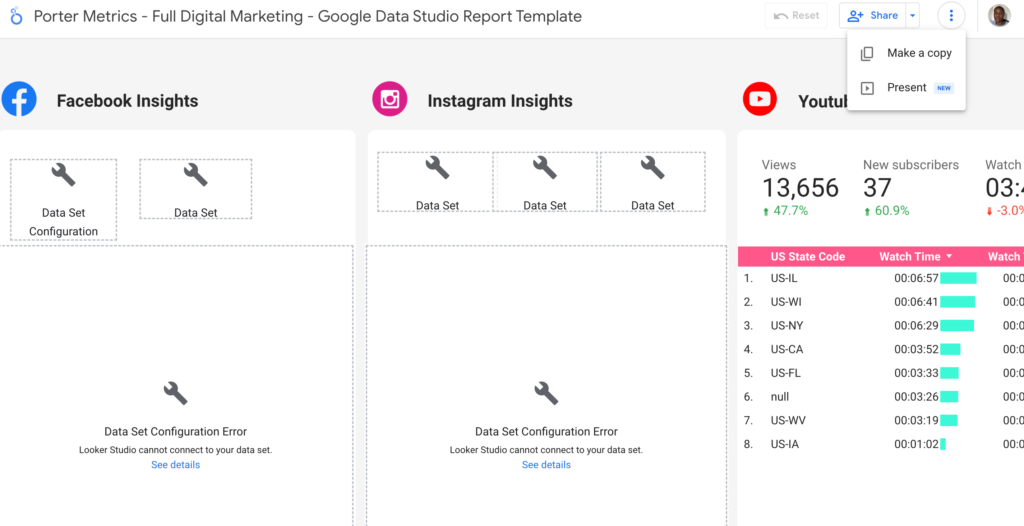
- Click on “Make a copy”
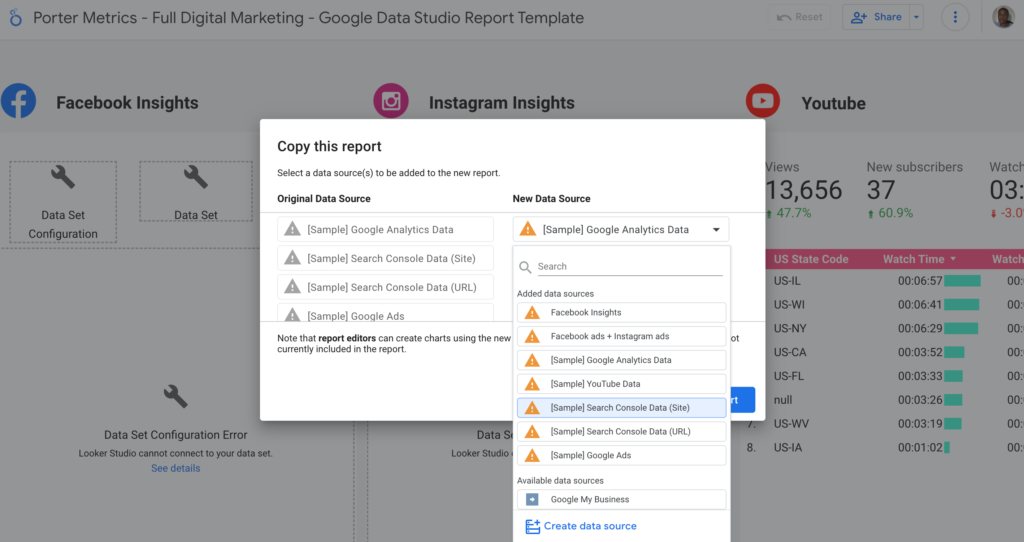
- Select your data source
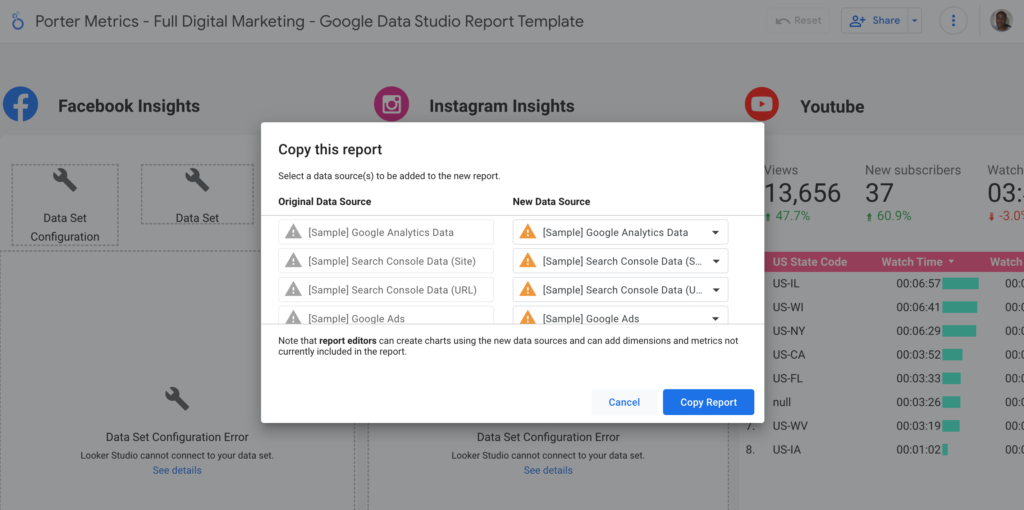
- For this tutorial, we will use the “Facebook ads + Instagram ads” data source.
- Click on “Copy Report”
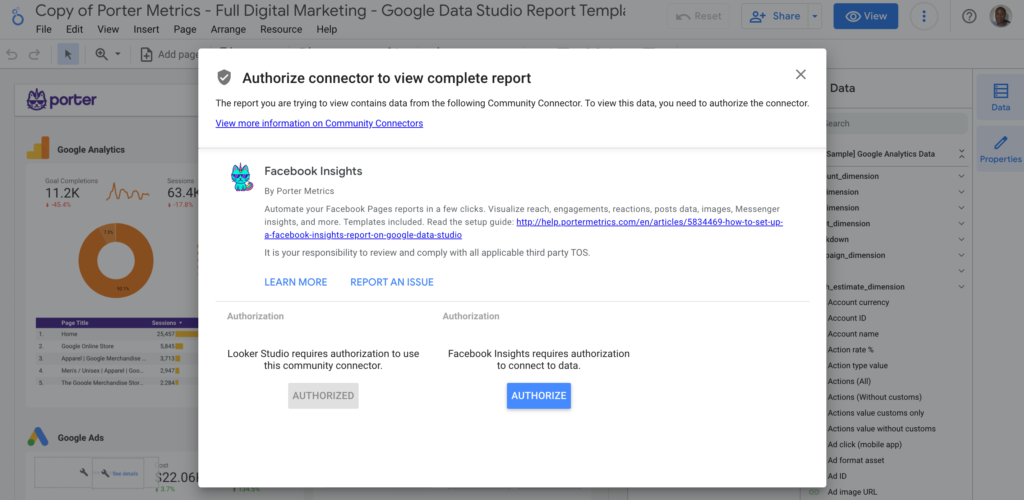
- Once you successfully connect your data source, you will get your report template.
There you have it. You now have your customized report.
Customizing your Social Media Report
Making better data-driven decisions is possible with the help of Google Data Studio, a potent data visualization tool. Despite having many features, one of its best qualities is that it can be customized.
Google Data Studio can be used to create a report that is specific to your requirements. You can use the FREE templates at Portermetrics to create your marketing reports if you detest creating data studio reports from scratch.
Yes, you can alter these templates to meet your specific requirements. We prepared a video tutorial showing how to customize your Social Media reports (and make them Whitelabel).
You can also check out this post on How to Customize your Google Data Studio Report. Let’s get right into the topic without further ado.
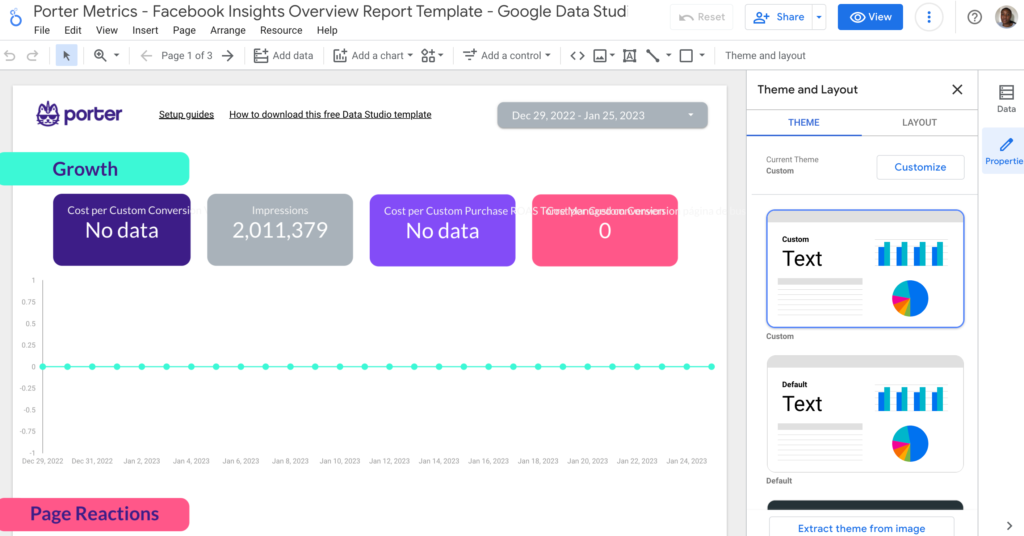
Themes
The theme and layout of the report are among the first things that can be customized when creating custom Data Studio reports.
You can apply and use 19 different themes from Data Studio for your reports. On the menu of your report dashboard, select “Theme and layout” to access them.
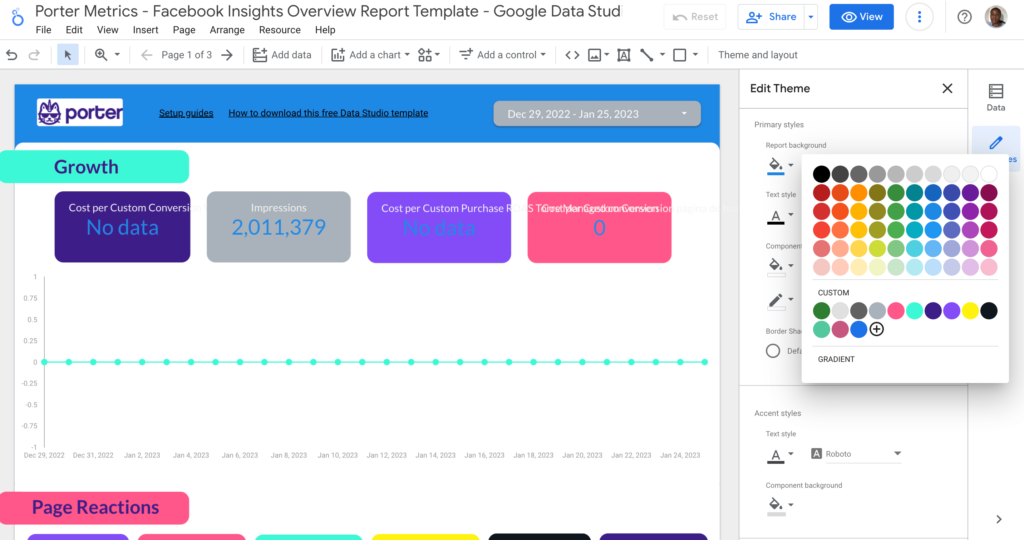
Editing current theme
You can choose specific colors for your reports thanks to this. Here, you can change the colors of your background, border, textbox, accent, and text.
You can also select the color for the different types of charts in the report.
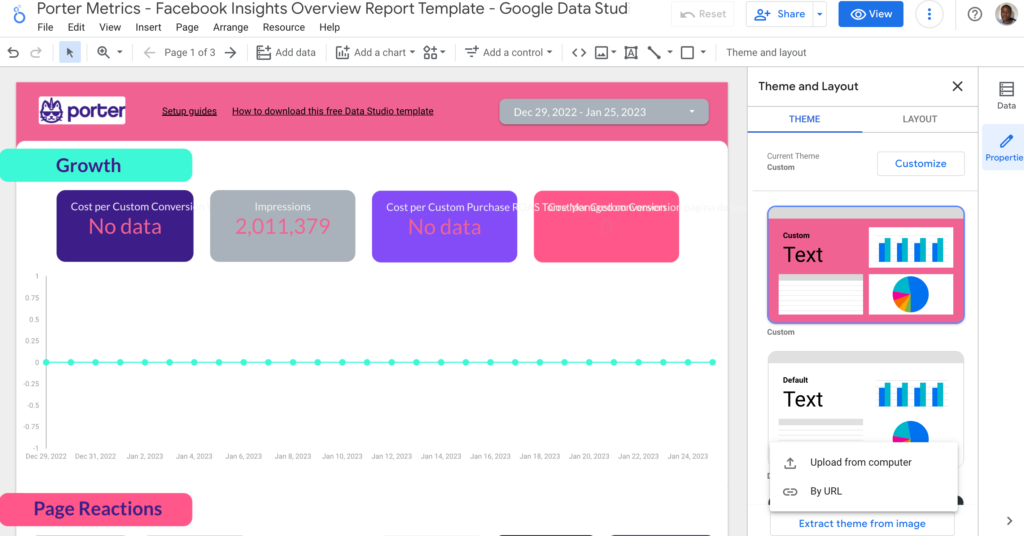
Extracting Colour Theme From An Image
You can tailor your reports to match the brand colors on your website, which is one of data studio’s exciting features.
You don’t necessarily need to copy and paste color codes to use your brand colors in your reports.
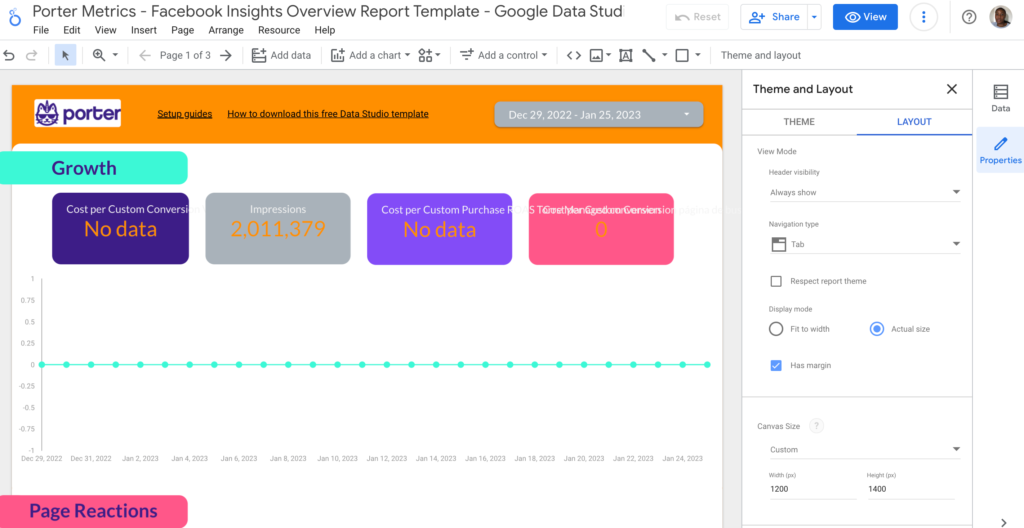
Layout Settings
By selecting “Layout” to the right of “Theme,” you can change the report’s layout.
View mode, canvas size, grid settings, and report level composite position are the four sections of the layout tab.
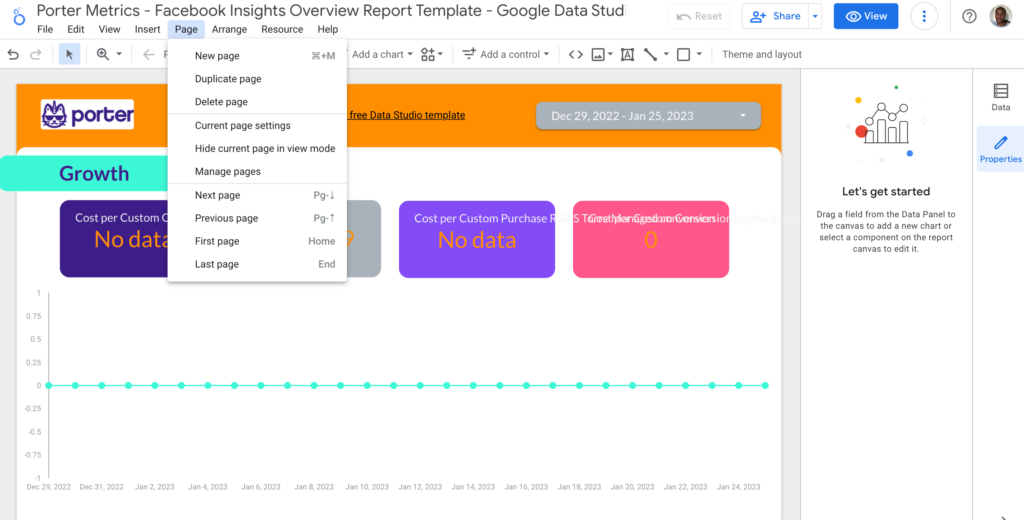
Grouping & Editing Your Report Pages on Data Studio
Since Google Data Studio dashboards serve as the users’ navigational framework, they have a significant impact on how data is visualized; as a result, grouping and editing your report pages is crucial.
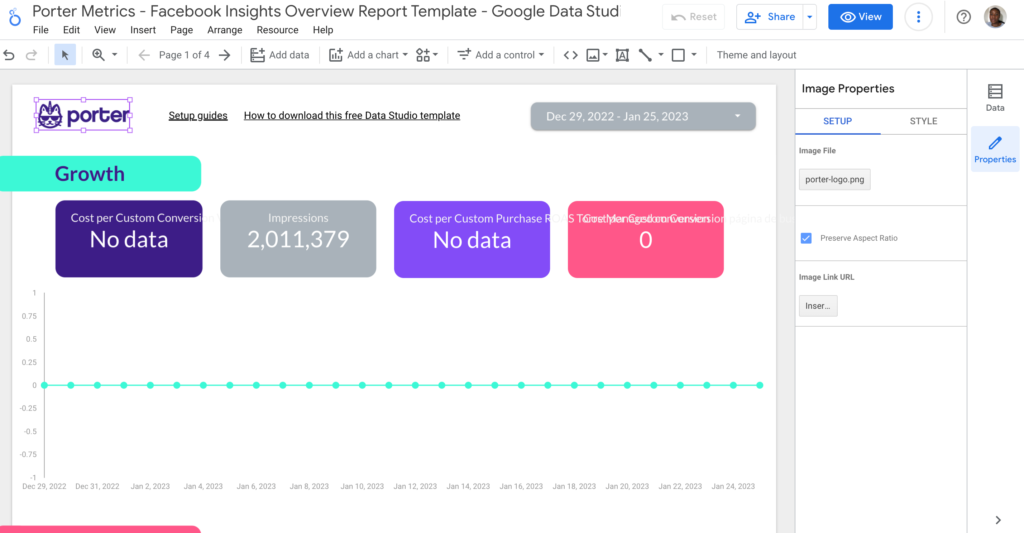
Adding your logo
Click on the image icon to upload your logo from your computer. You can also upload your logo by entering the URL of the logo.
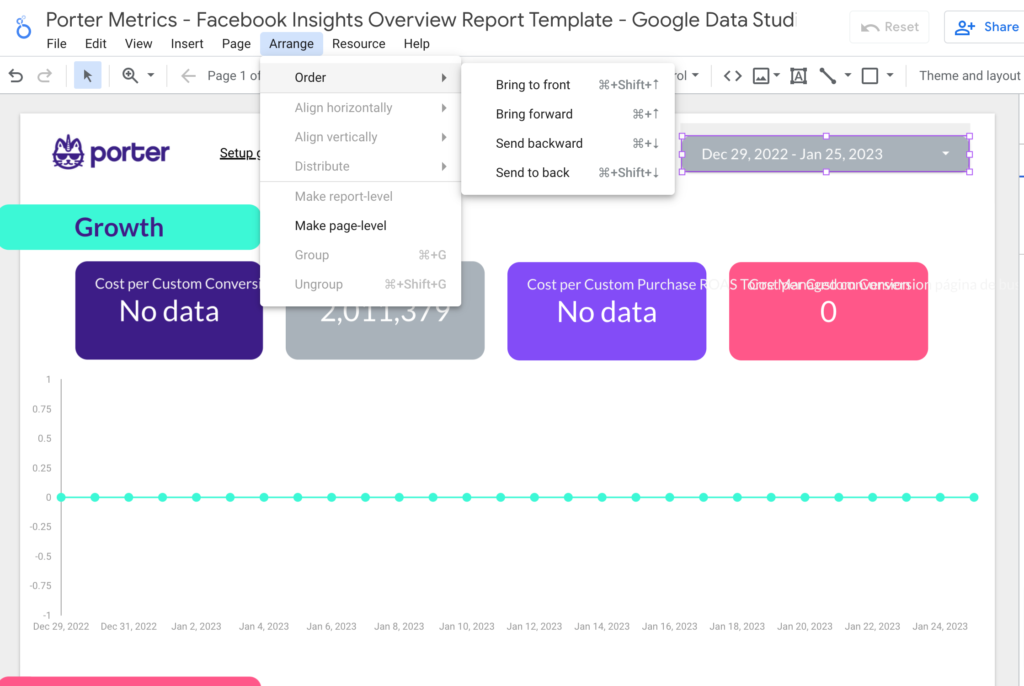
Customizing the Report Banner
When creating reports with multiple pages, you’ll want some components from one page to appear throughout the report.
Depending on the type of report you’re creating, this could be your report header or banner, date ranges, charts, or time series.
Styling your Data Studio Reports
To further personalize your reports, Google Data Studio is flexible enough to let you style every aspect of your report.
Styling Charts in Data Studio
Charts are important components of reports. Google Data Studio does an excellent job of providing a wide range of options to its users.
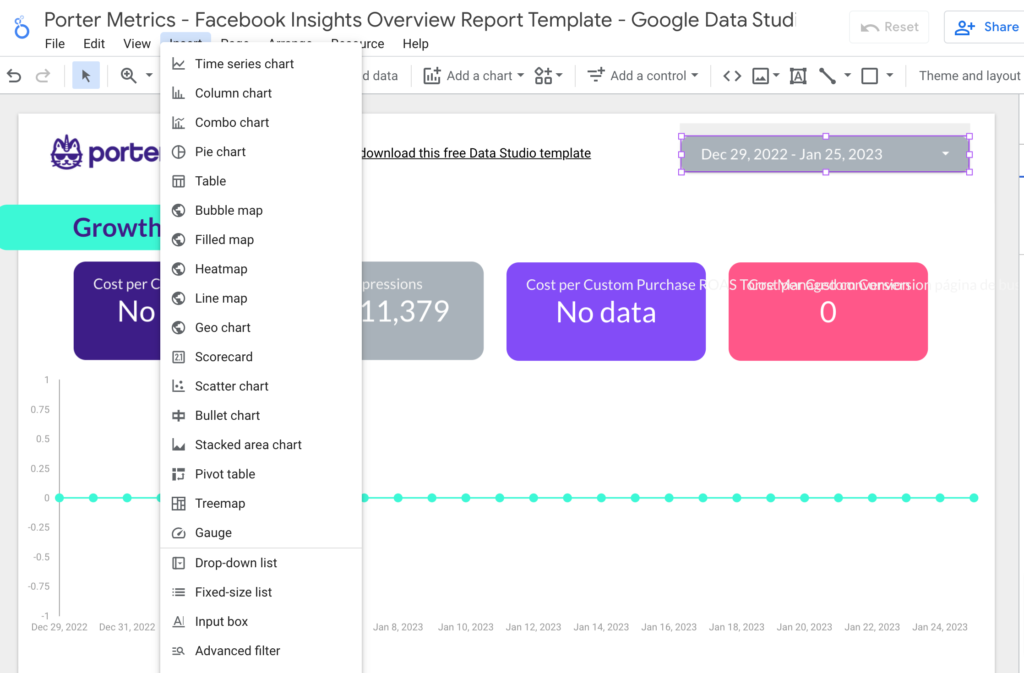
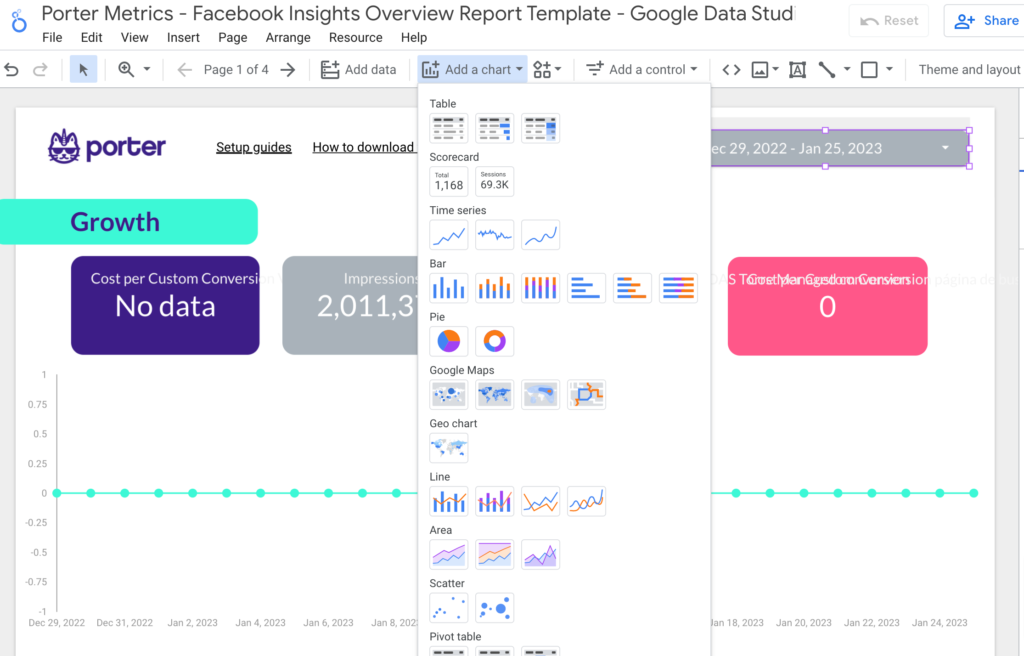
Tables, scorecards, time series, bar charts, pie charts, Google map charts, Geo charts, lines, area, scatter charts, pivot tables, bullet charts, treemaps, and Gauge charts can all be added to reports using Data Studio.
On the report dashboard, click “Add a chart” to access the various chart types in data studio. This reveals the 14 chart types available in Google Data Studio.
Check out this article for more details on How to Customize your Google Data Studio Report. Remember that you can always use a Porter Metric template to save time on your reports.
Sharing and Exporting your Social Media Report
Google Data Studio like other Google products, Google Data Studio has excellent collaboration and sharing features. Share your data stories with other members of your organization, clients, or the world.
You can find a summary of how you can share your reports in this section. We covered this topic in detail here; How to Share your Google Data Studio reports.
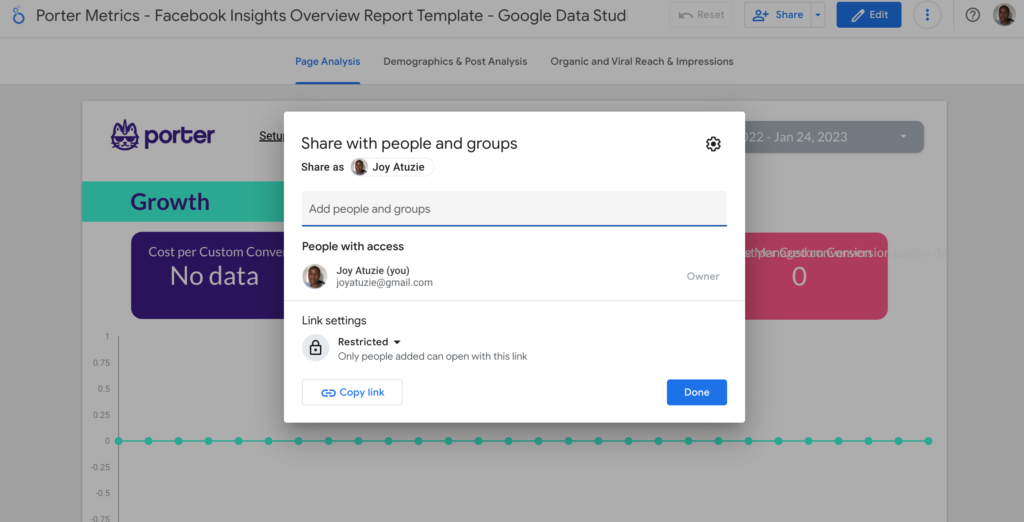
To share, view the asset you want to share, then select Share from the menu in the top right:
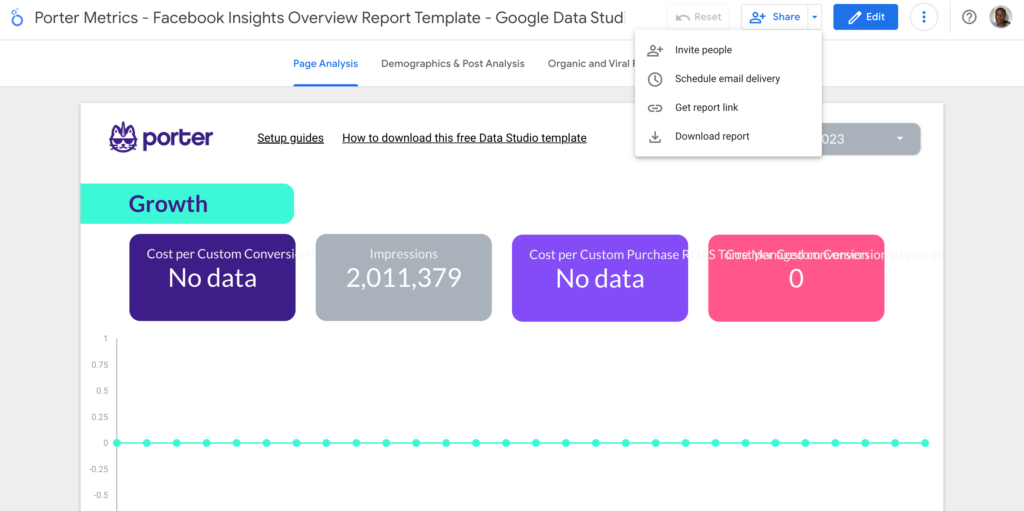
You can invite people to collaborate.
You can send viewing or editing invitations to specific individuals or Google Groups. Your Data Studio assets are only accessible to those people or members of those groups.
By activating link sharing, you can also share information more widely. By doing this, anyone within your company or online—even those without a Google account—can view your Data Studio assets.
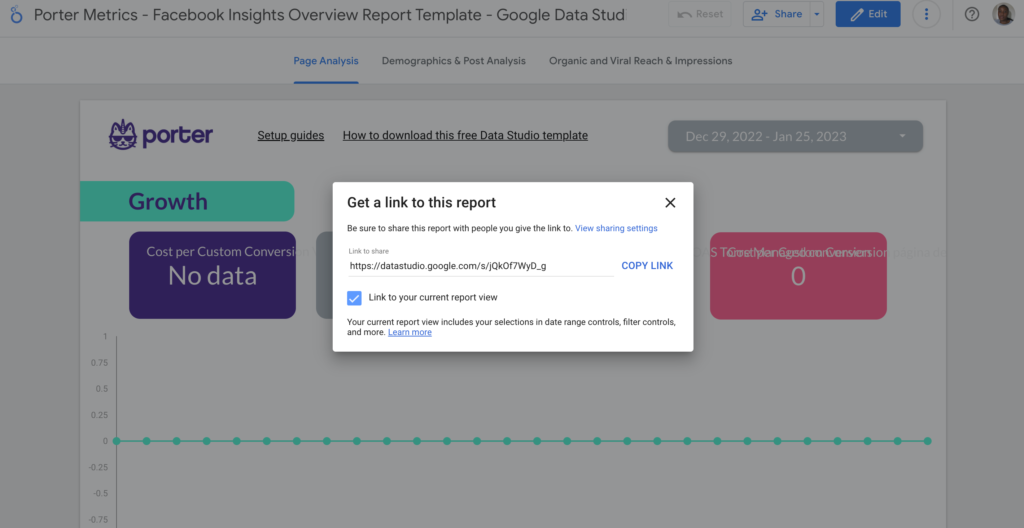
Share a link to access the report.
A short URL to a Data Studio report can be created and shared, used in web pages, or used for any other purpose that links can be used for.
The report’s current settings, including filters and date ranges, may be included in the link. Understand how to obtain a report link.
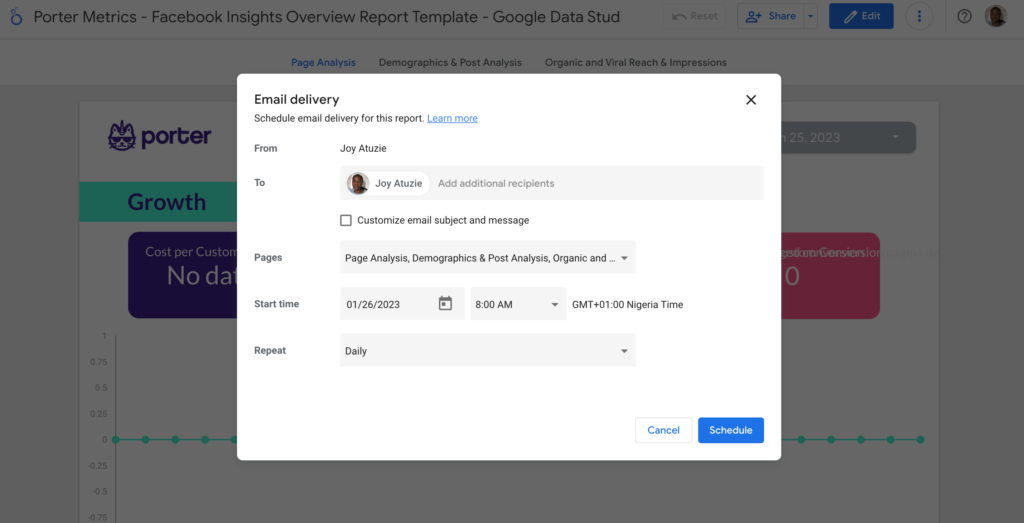
Schedule an automatic email delivery
By establishing an email delivery schedule, you can routinely send yourself and your stakeholders a PDF of your Data Studio report.
This is perfect for monthly reports, as data is updated in real-time, and no time is lost in updating or sending.
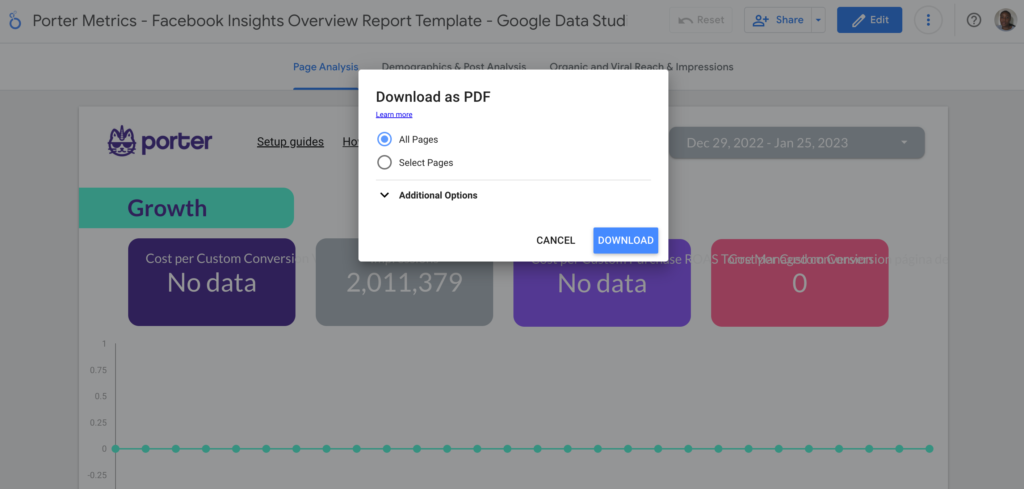
Download a PDF version
Downloading your report as a PDF will allow you to save a copy of it. The file can then be printed, archived on disk, shared offline via email, and used in any way that PDF files can be used.
Embed the report
You can put your data stories into a wider context by embedding your reports. You can embed into Google Sites or any other website that supports iframes.
Additionally, you can post your reports on websites that allow Embed links, like Reddit and Medium. Study up on embedding.
Share reports on social media
Reports from Data Studio can be shared on social media sites like Facebook, Slack, LinkedIn, and Twitter as well as in chat programs like Hangouts and iMessage.
Ensure that others can view the report before pasting the link into the app. Find out more about social media sharing.
Conclusion
With the Social Media connector for Google Data Studio, you can track: standard events, performance Metrics, engagement Metrics, page Post Metrics, messaging metrics, media Metrics, click Metrics, and awareness metrics.
Also, remember you can break them down by geography, demographics, publisher platform, platform position, and time.
You can save much time automating your Social Media reports on Looker Studio, even more, if you start using templates.
We create new templates every week for free that you can find in our Google Data Studio Template Library. We have templates for almost every use case: Facebook Ads, Social Media, E-Commerce, Google Ads, and SEO. We have it all.
It is time for you to start building your own Social Media dashboard! If you have specific questions write to me at support@portermetrics.com.