


Learn how to connect data to Data Studio (formerly Looker Studio) with this complete step-by-step guide with real examples we have seen at Porter Metrics so you connect your data faster!
We made a ‘how to video’ if you prefer to see how we do it!
Now, here’s the step-by-step guide.
How to connect any data source to Data Studio?
Connect a data source to a Data Studio report in six steps:
On your report, click on ‘Add data’
Or click ‘Resource’ > ‘Manage added data sources’ > ‘Add data source’
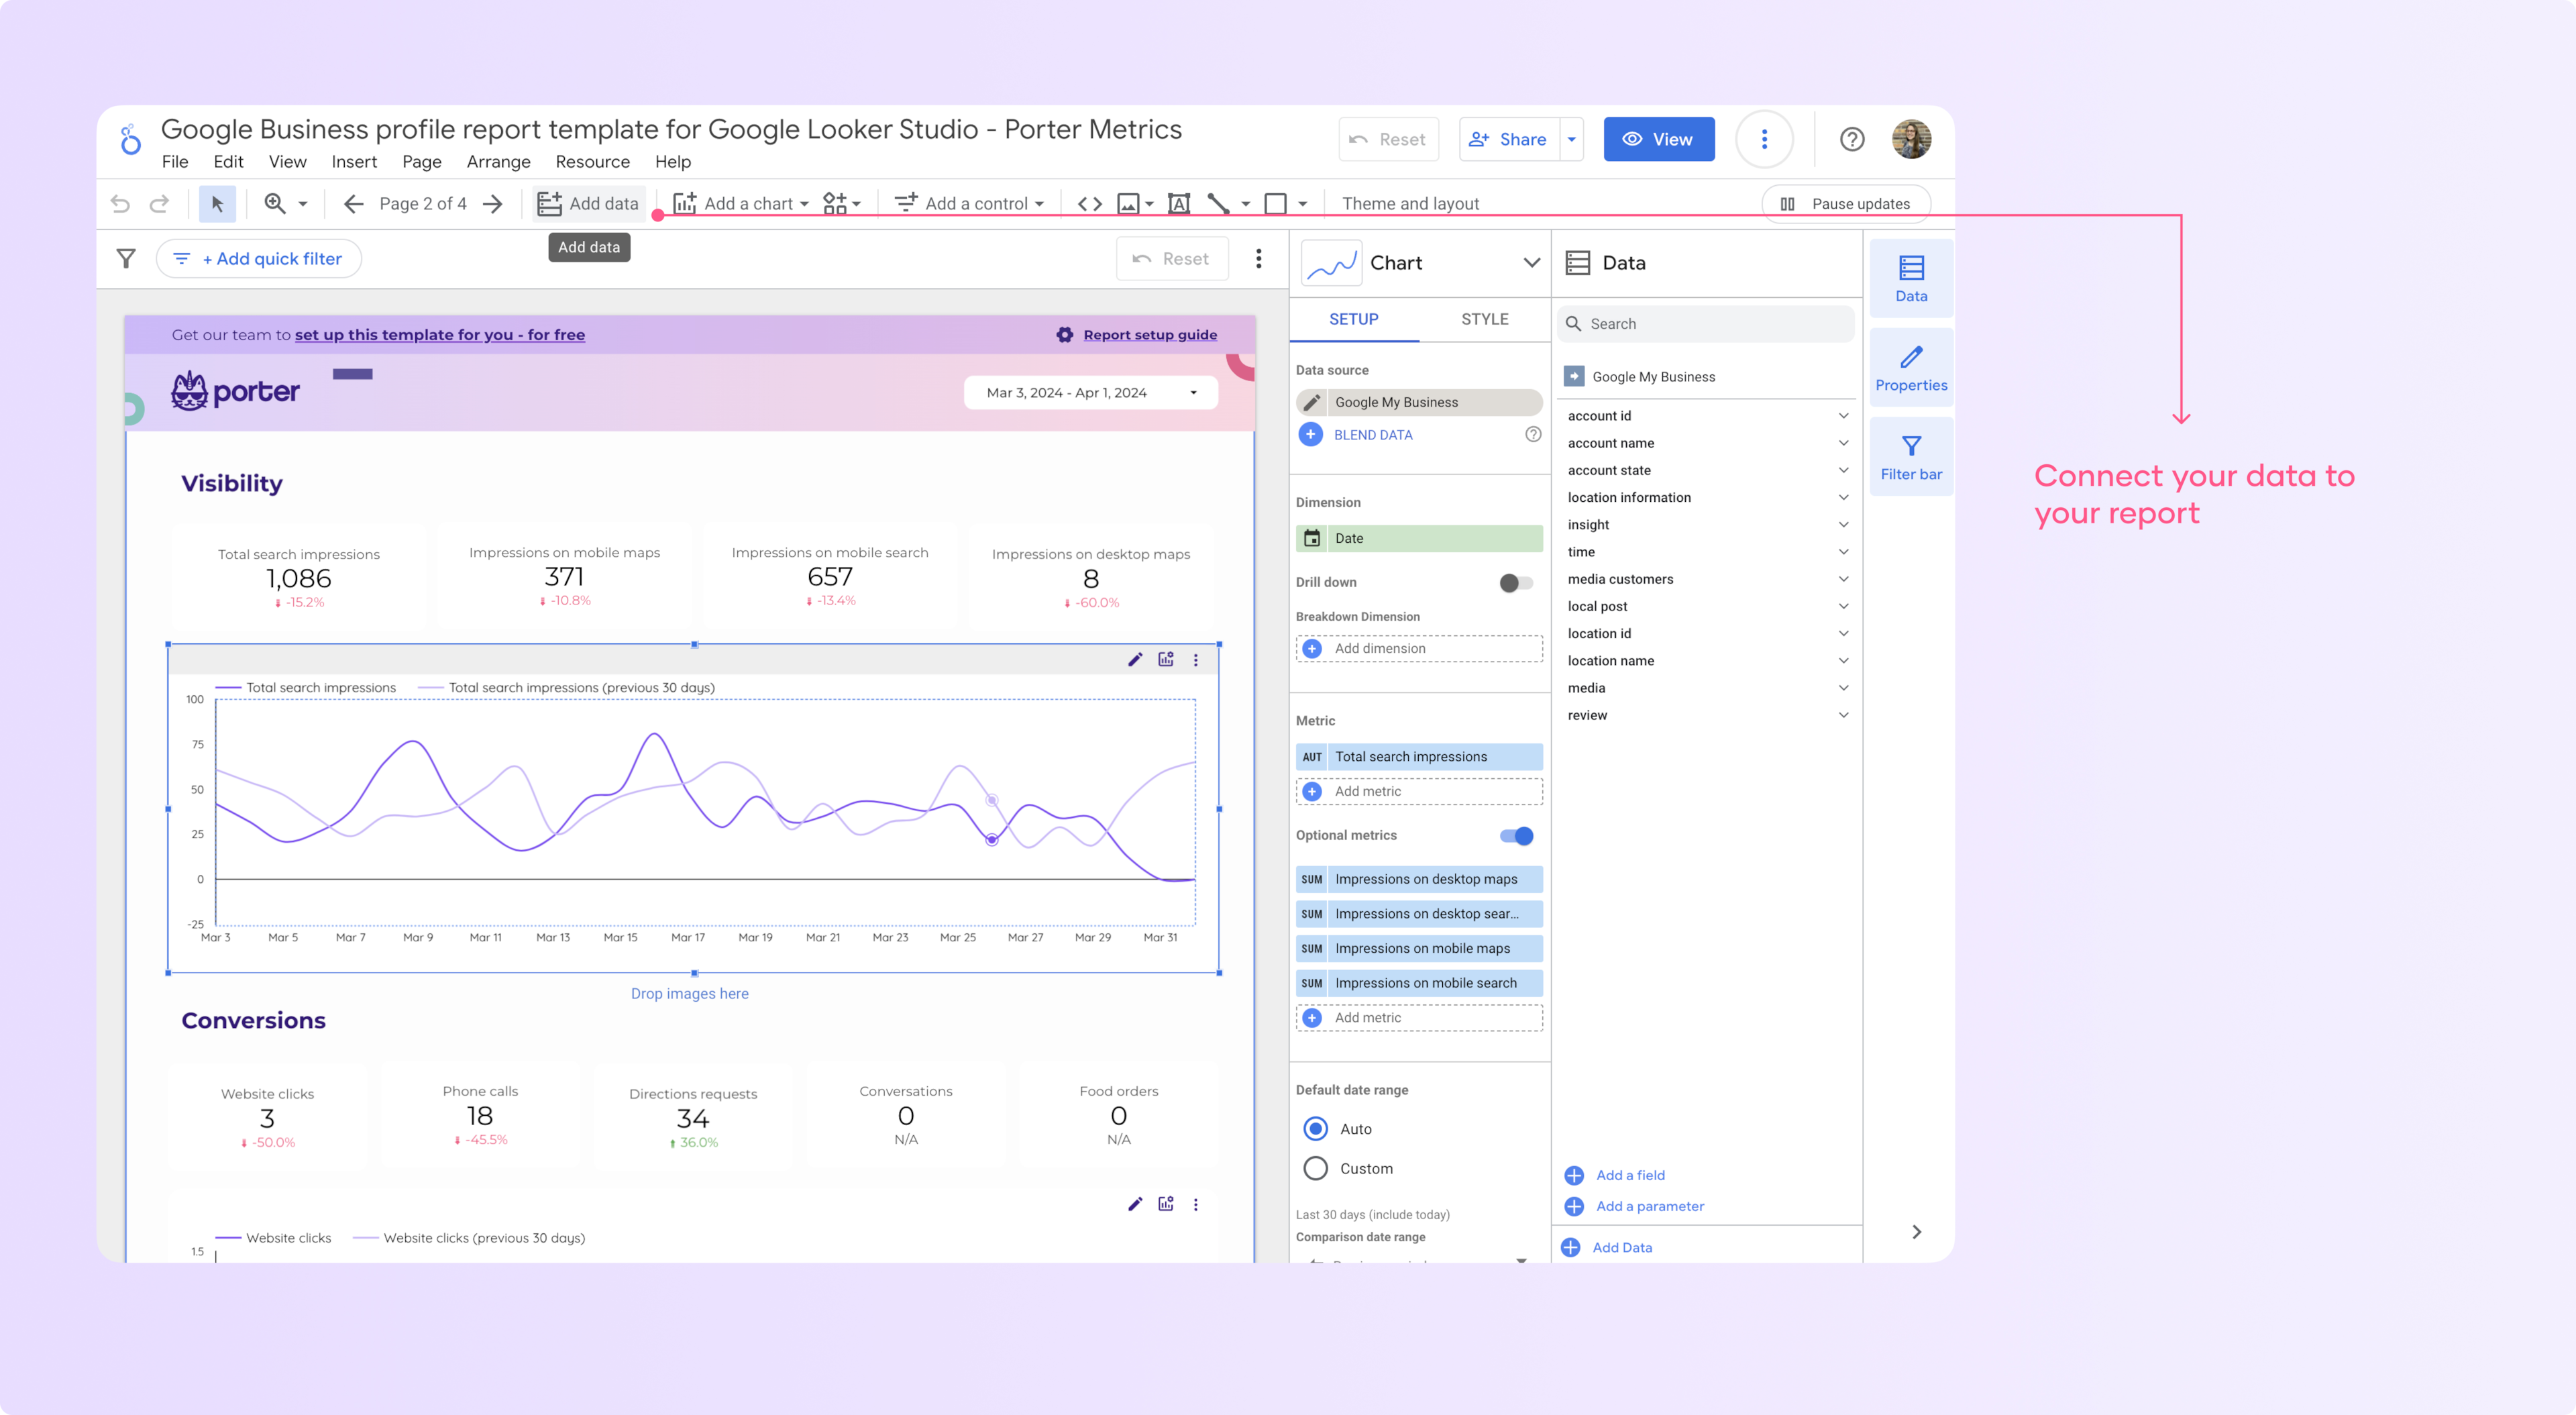
You will find all the Data Studio connectors, select one or search for the integration you need on the search bar.
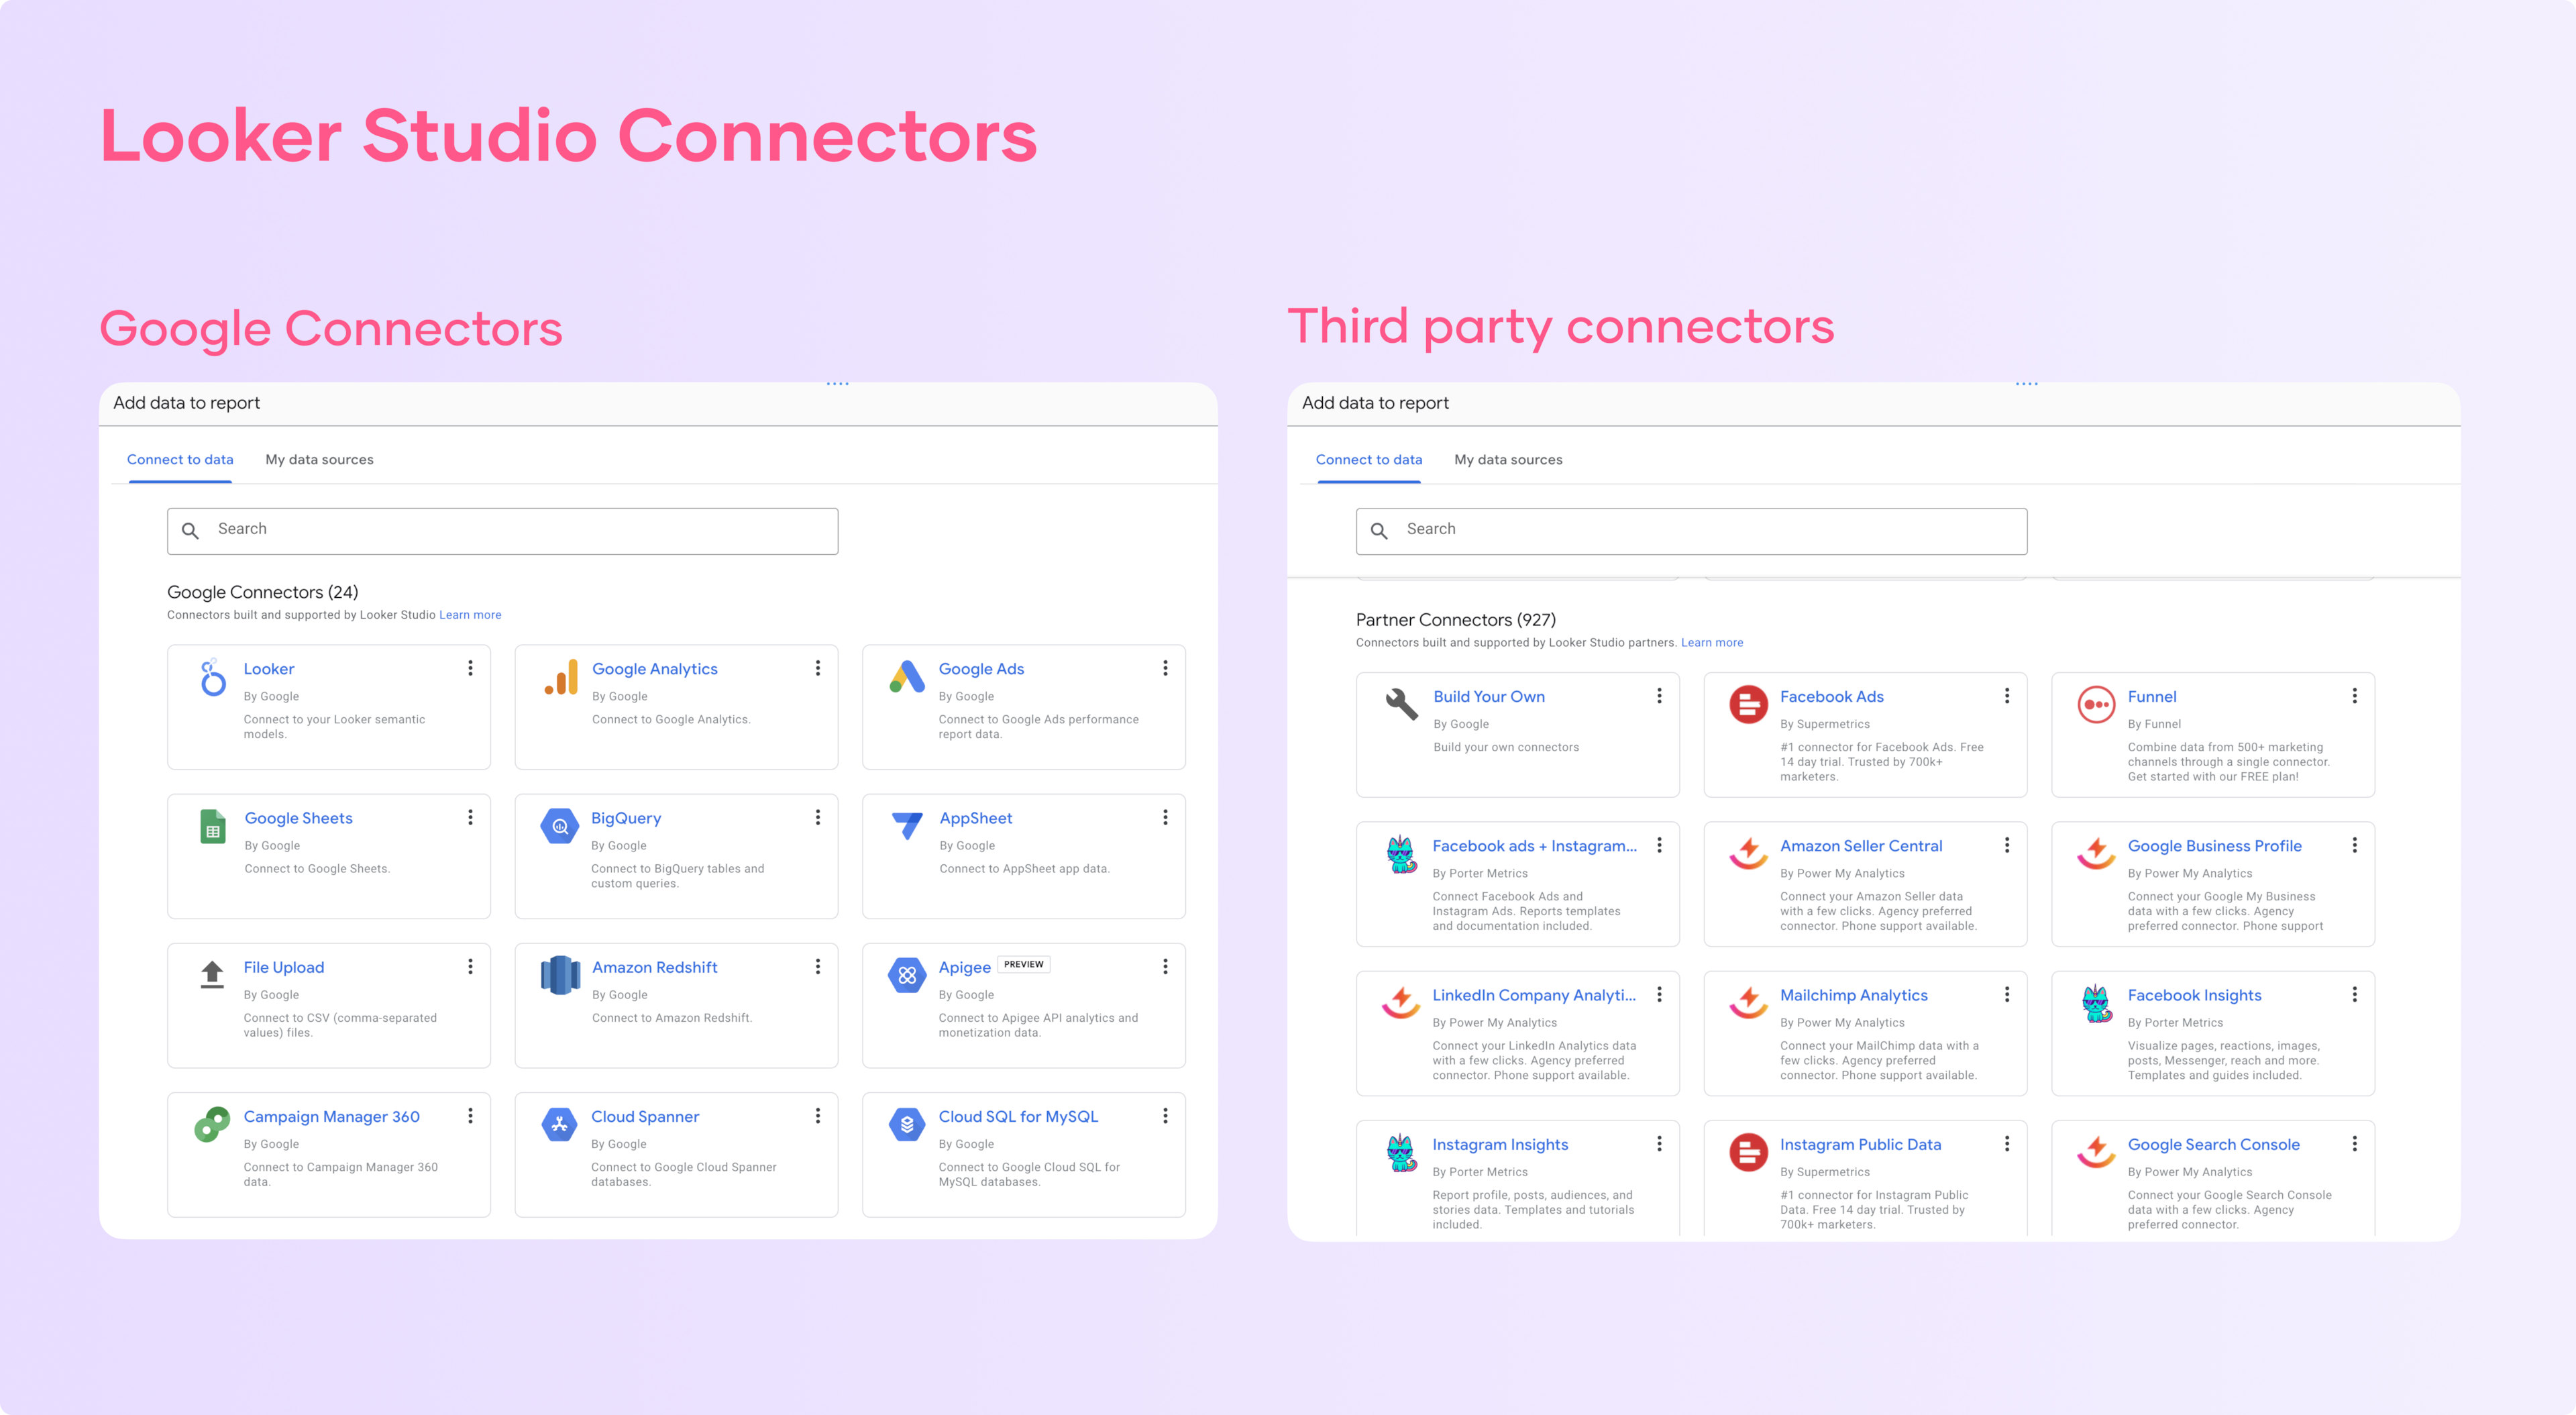
Looker has integrations with almost any platform and database, such as Google BigQuery, Google Sheets, Google Analytics 4, Facebook Ads, and many more.
After selecting the data source, click ‘Authorize’
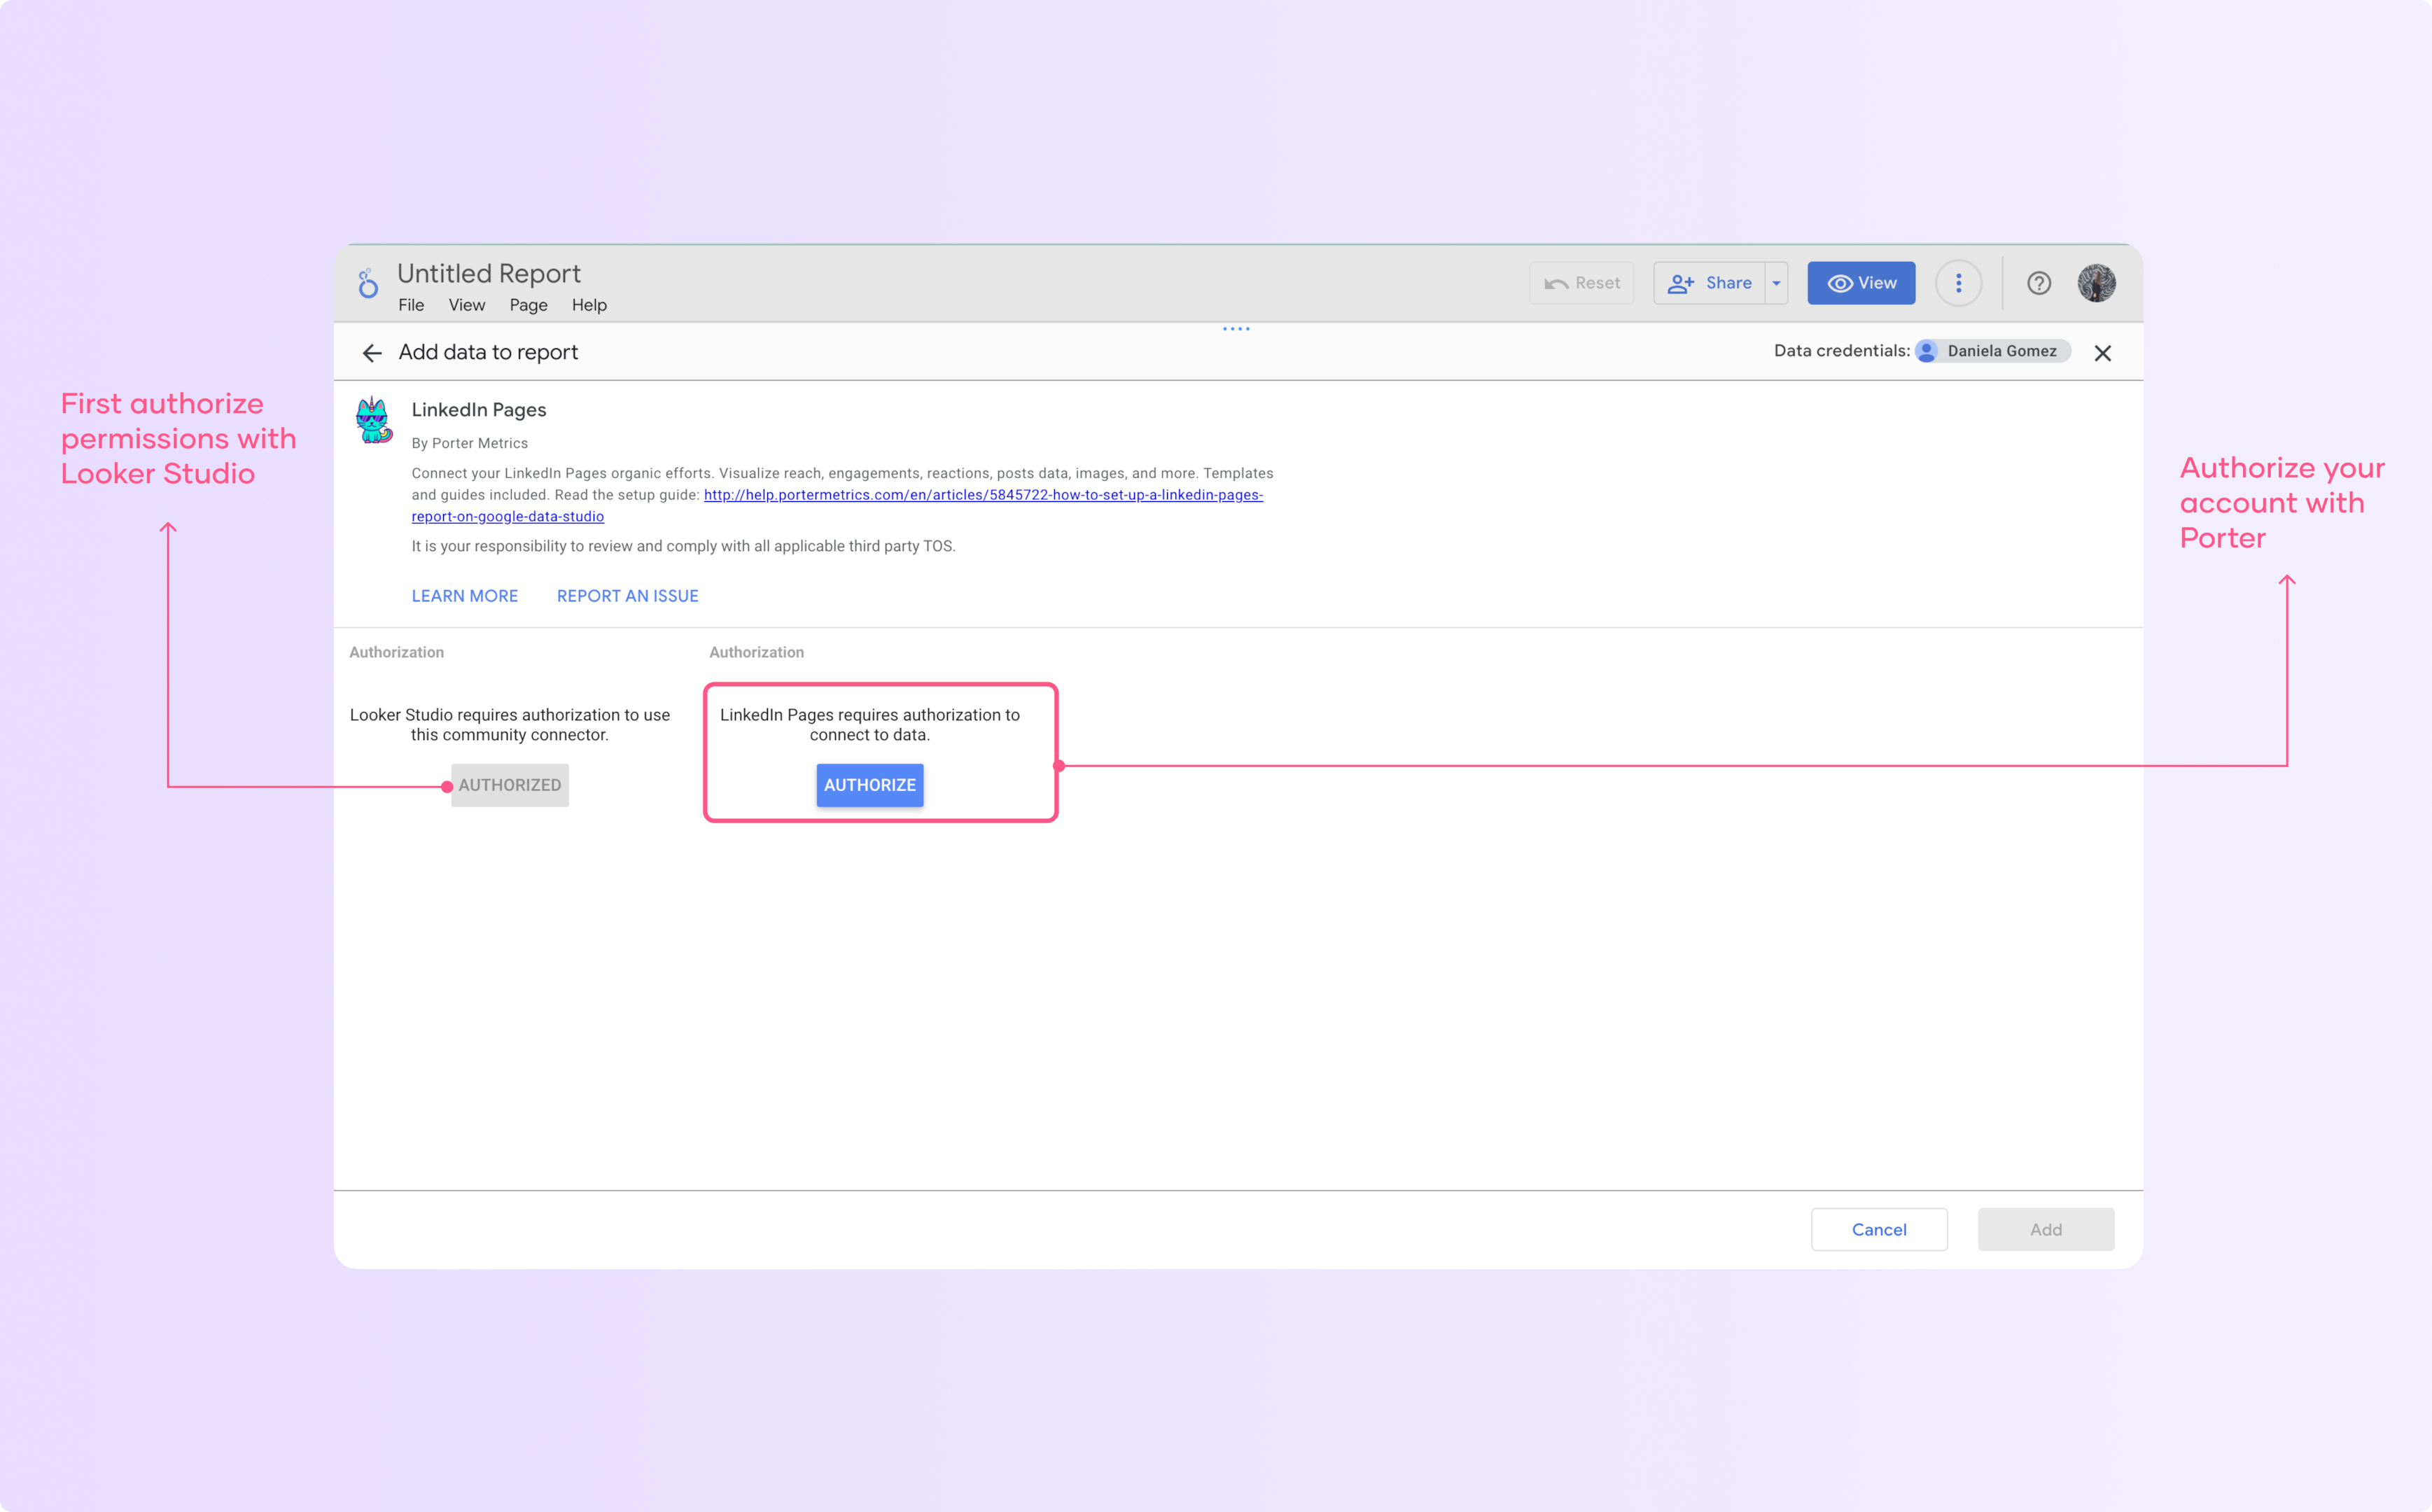
You must authenticate to Data Studio and authorize your account with the platform you want to connect with.
The authentication process is slightly different depending on the data sources you are connecting to. The important thing is to remember to have permission levels on the platform you are connecting to.
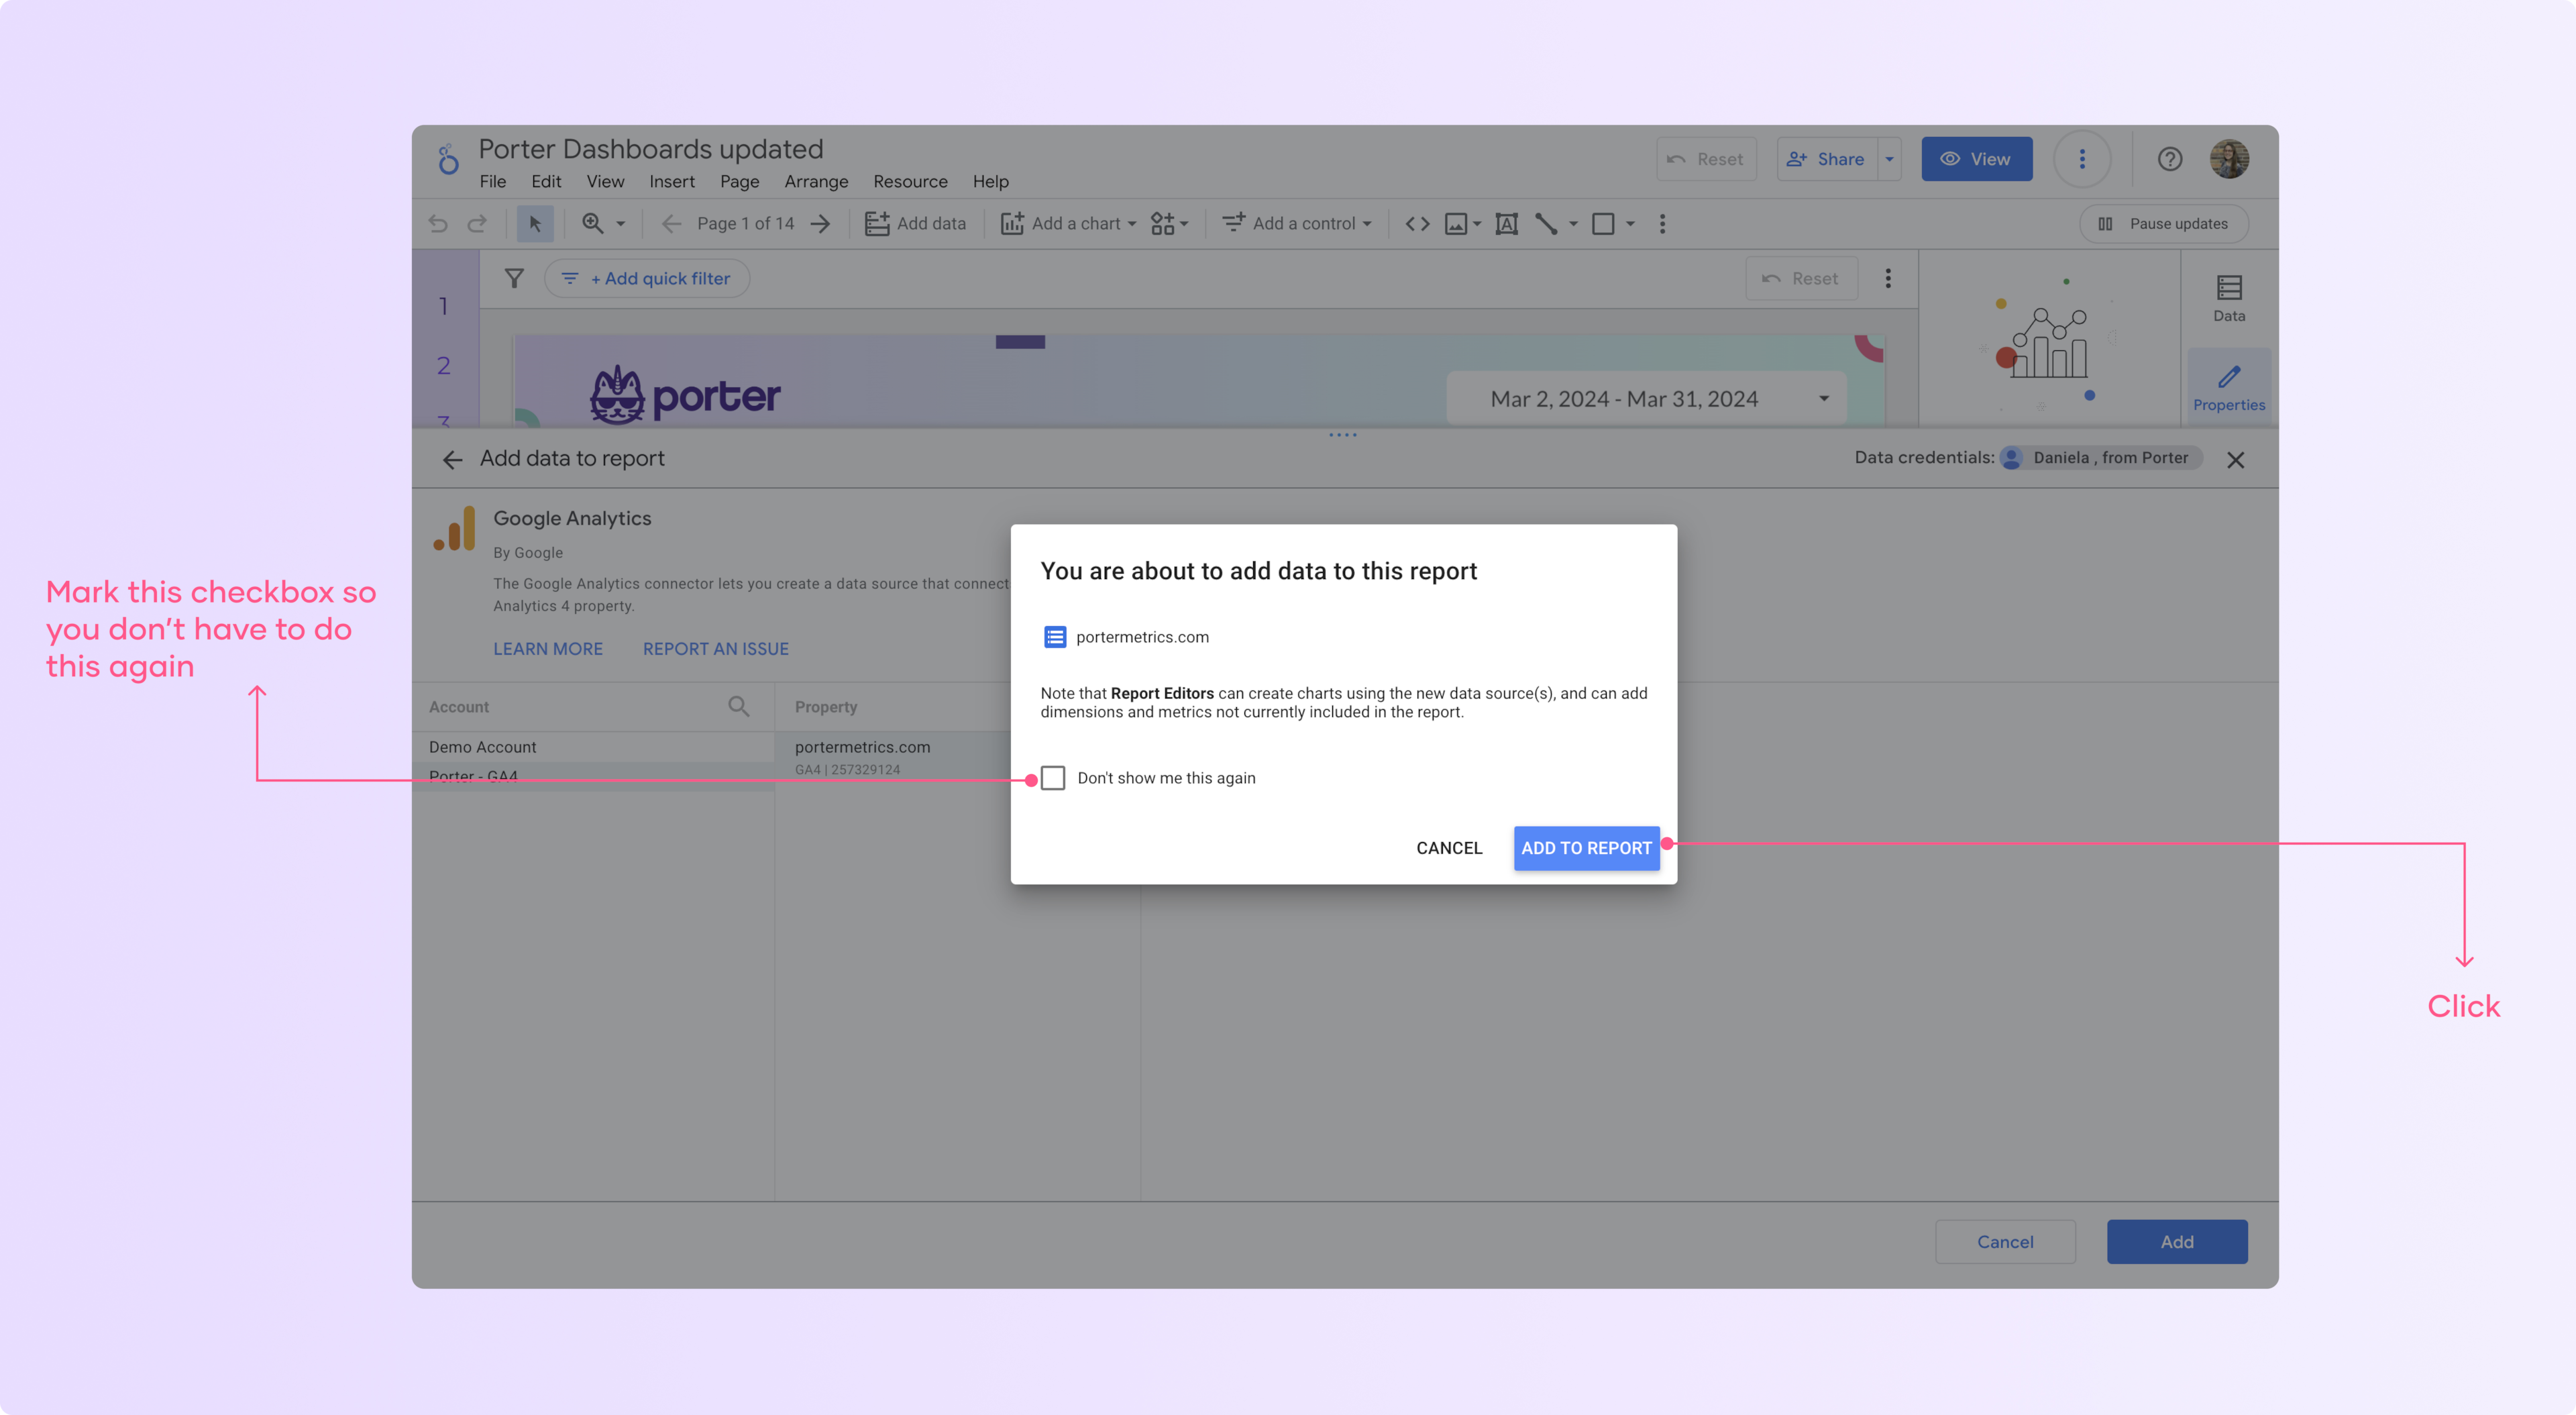
Click on ‘Add’ when you finish authorizing your data, and then click on ‘Add to report’
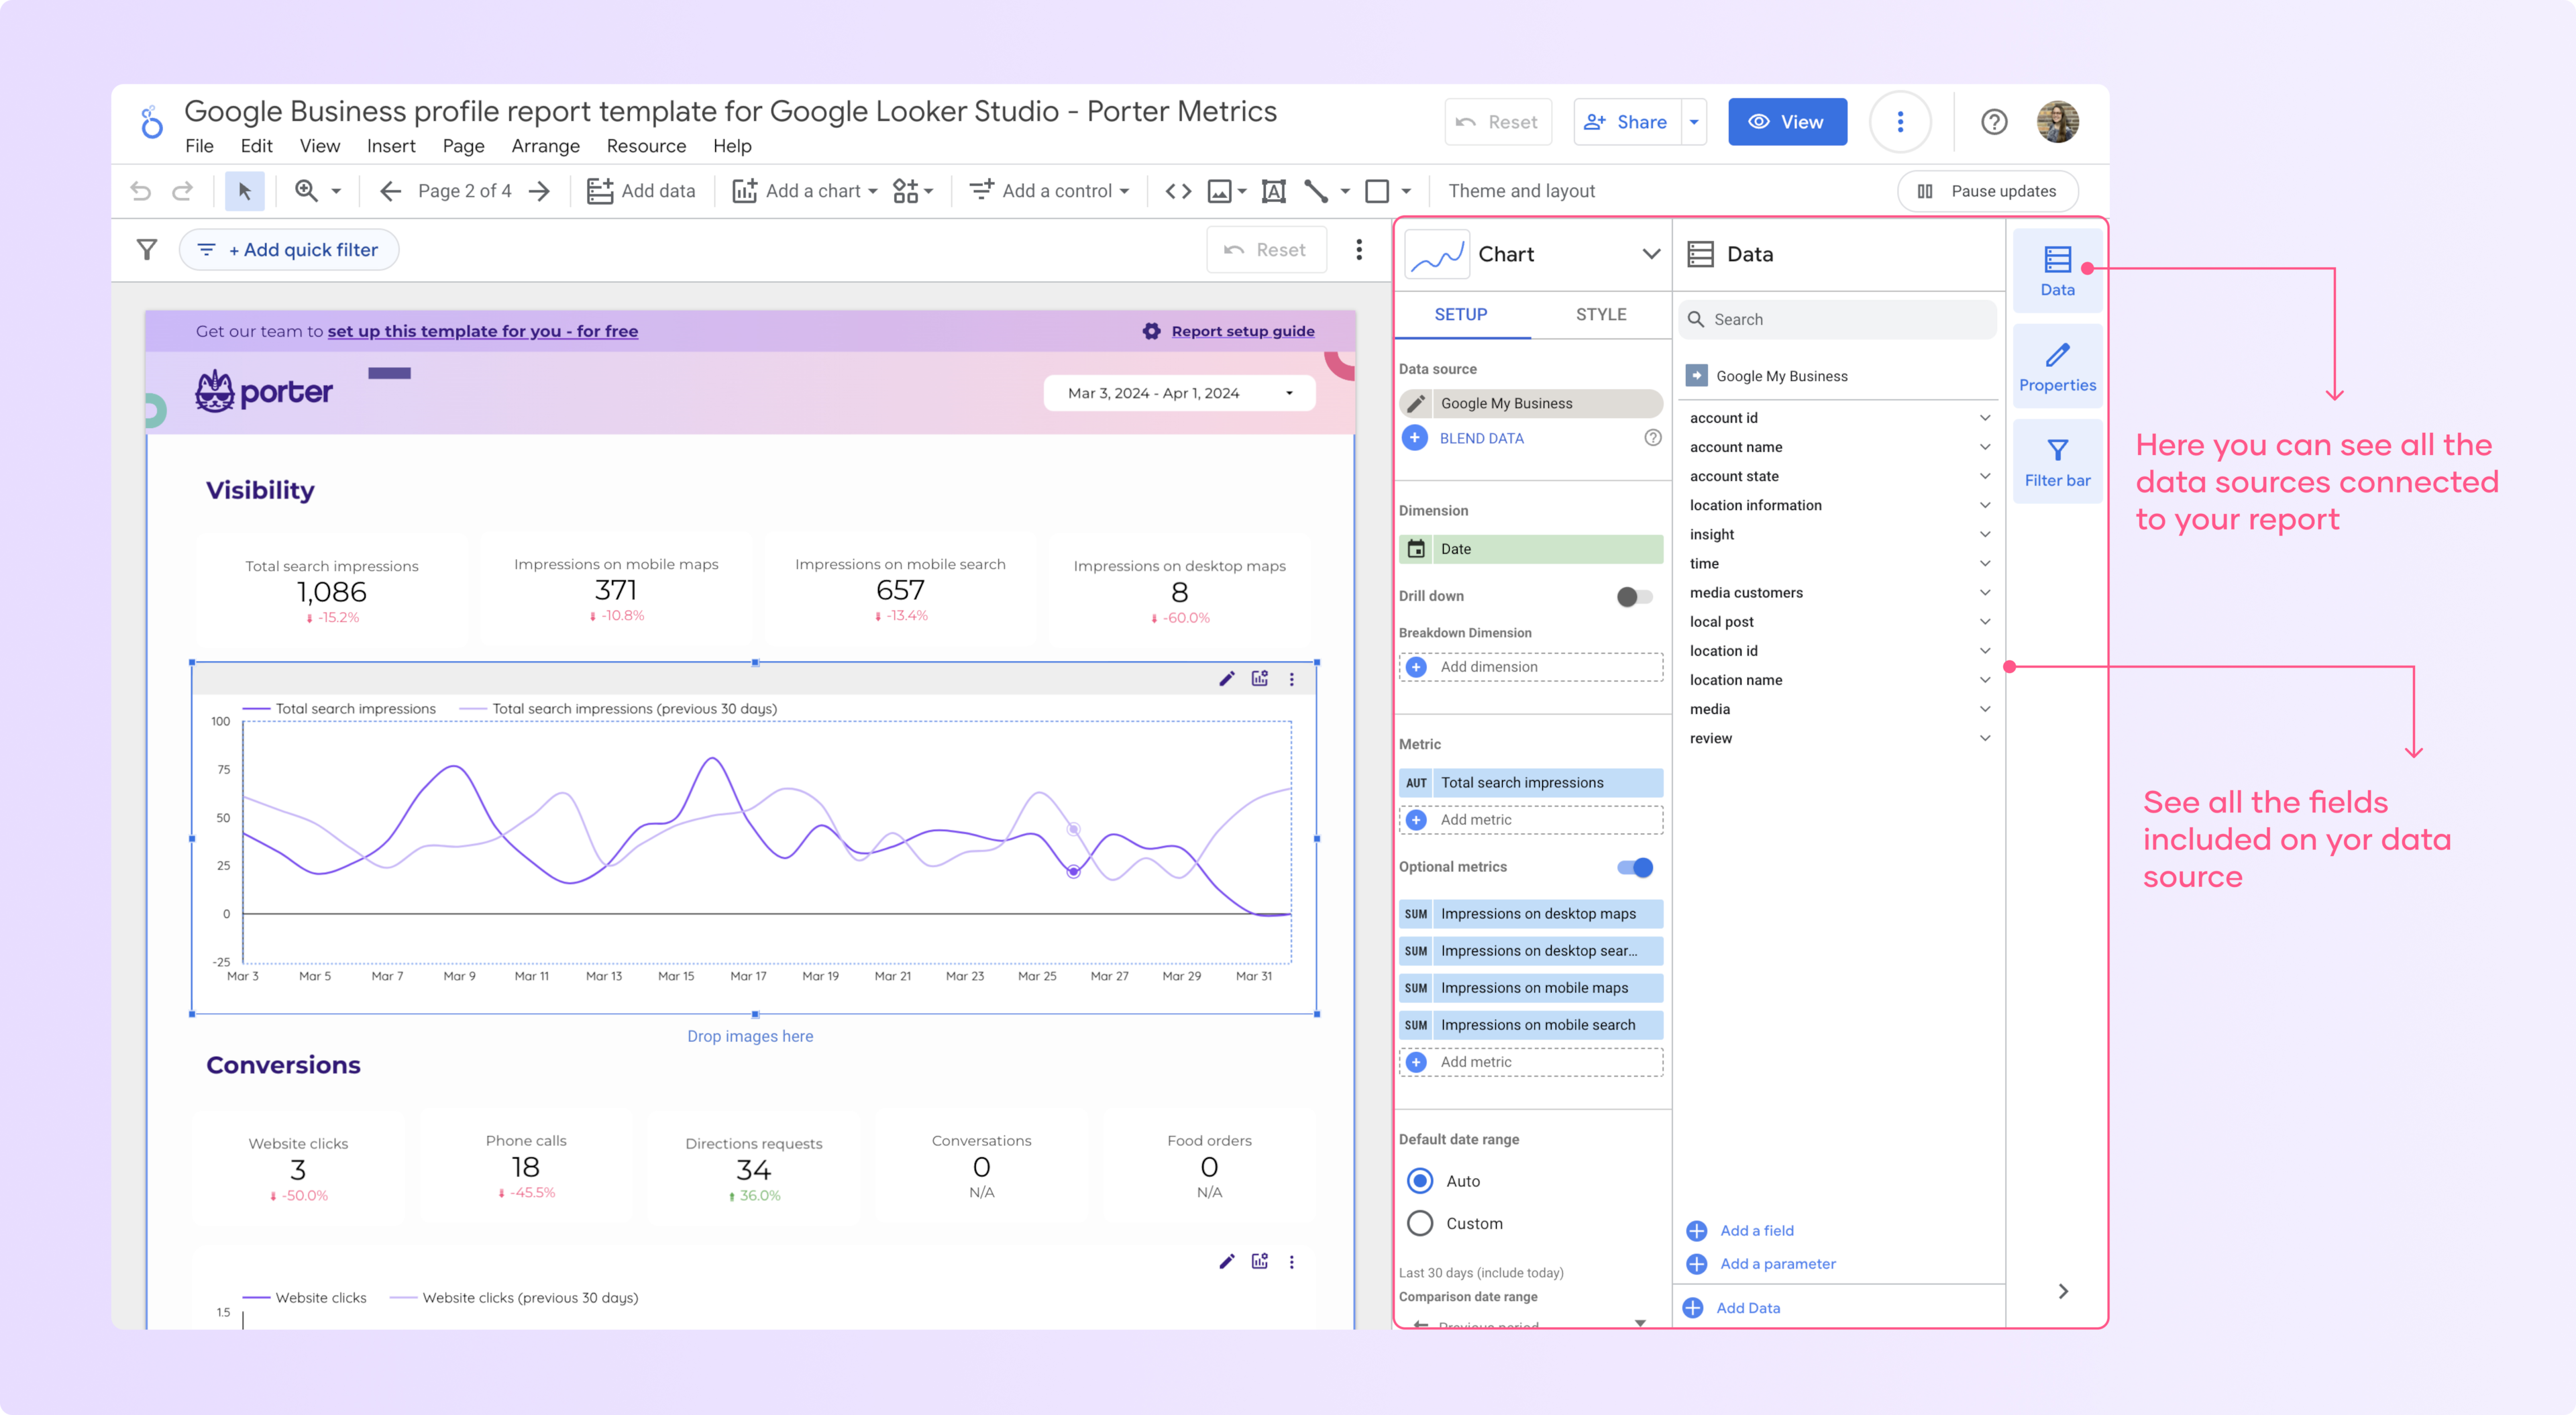
Check the connected data sources with all the fields included in the right panel
How to add more than one data source to Data Studio?
You can add multiple data sources to your report and combine them to make calculated fields to measure KPIs such as the cost per acquisition and total ad spend.
To add a new data source, you have to follow the same process, just click ‘add data’, select the data source and then follow the authentication process.
Editing existing data sources
In the top-right corner of the report, click on the “Resource” menu and select “Manage added data sources”.
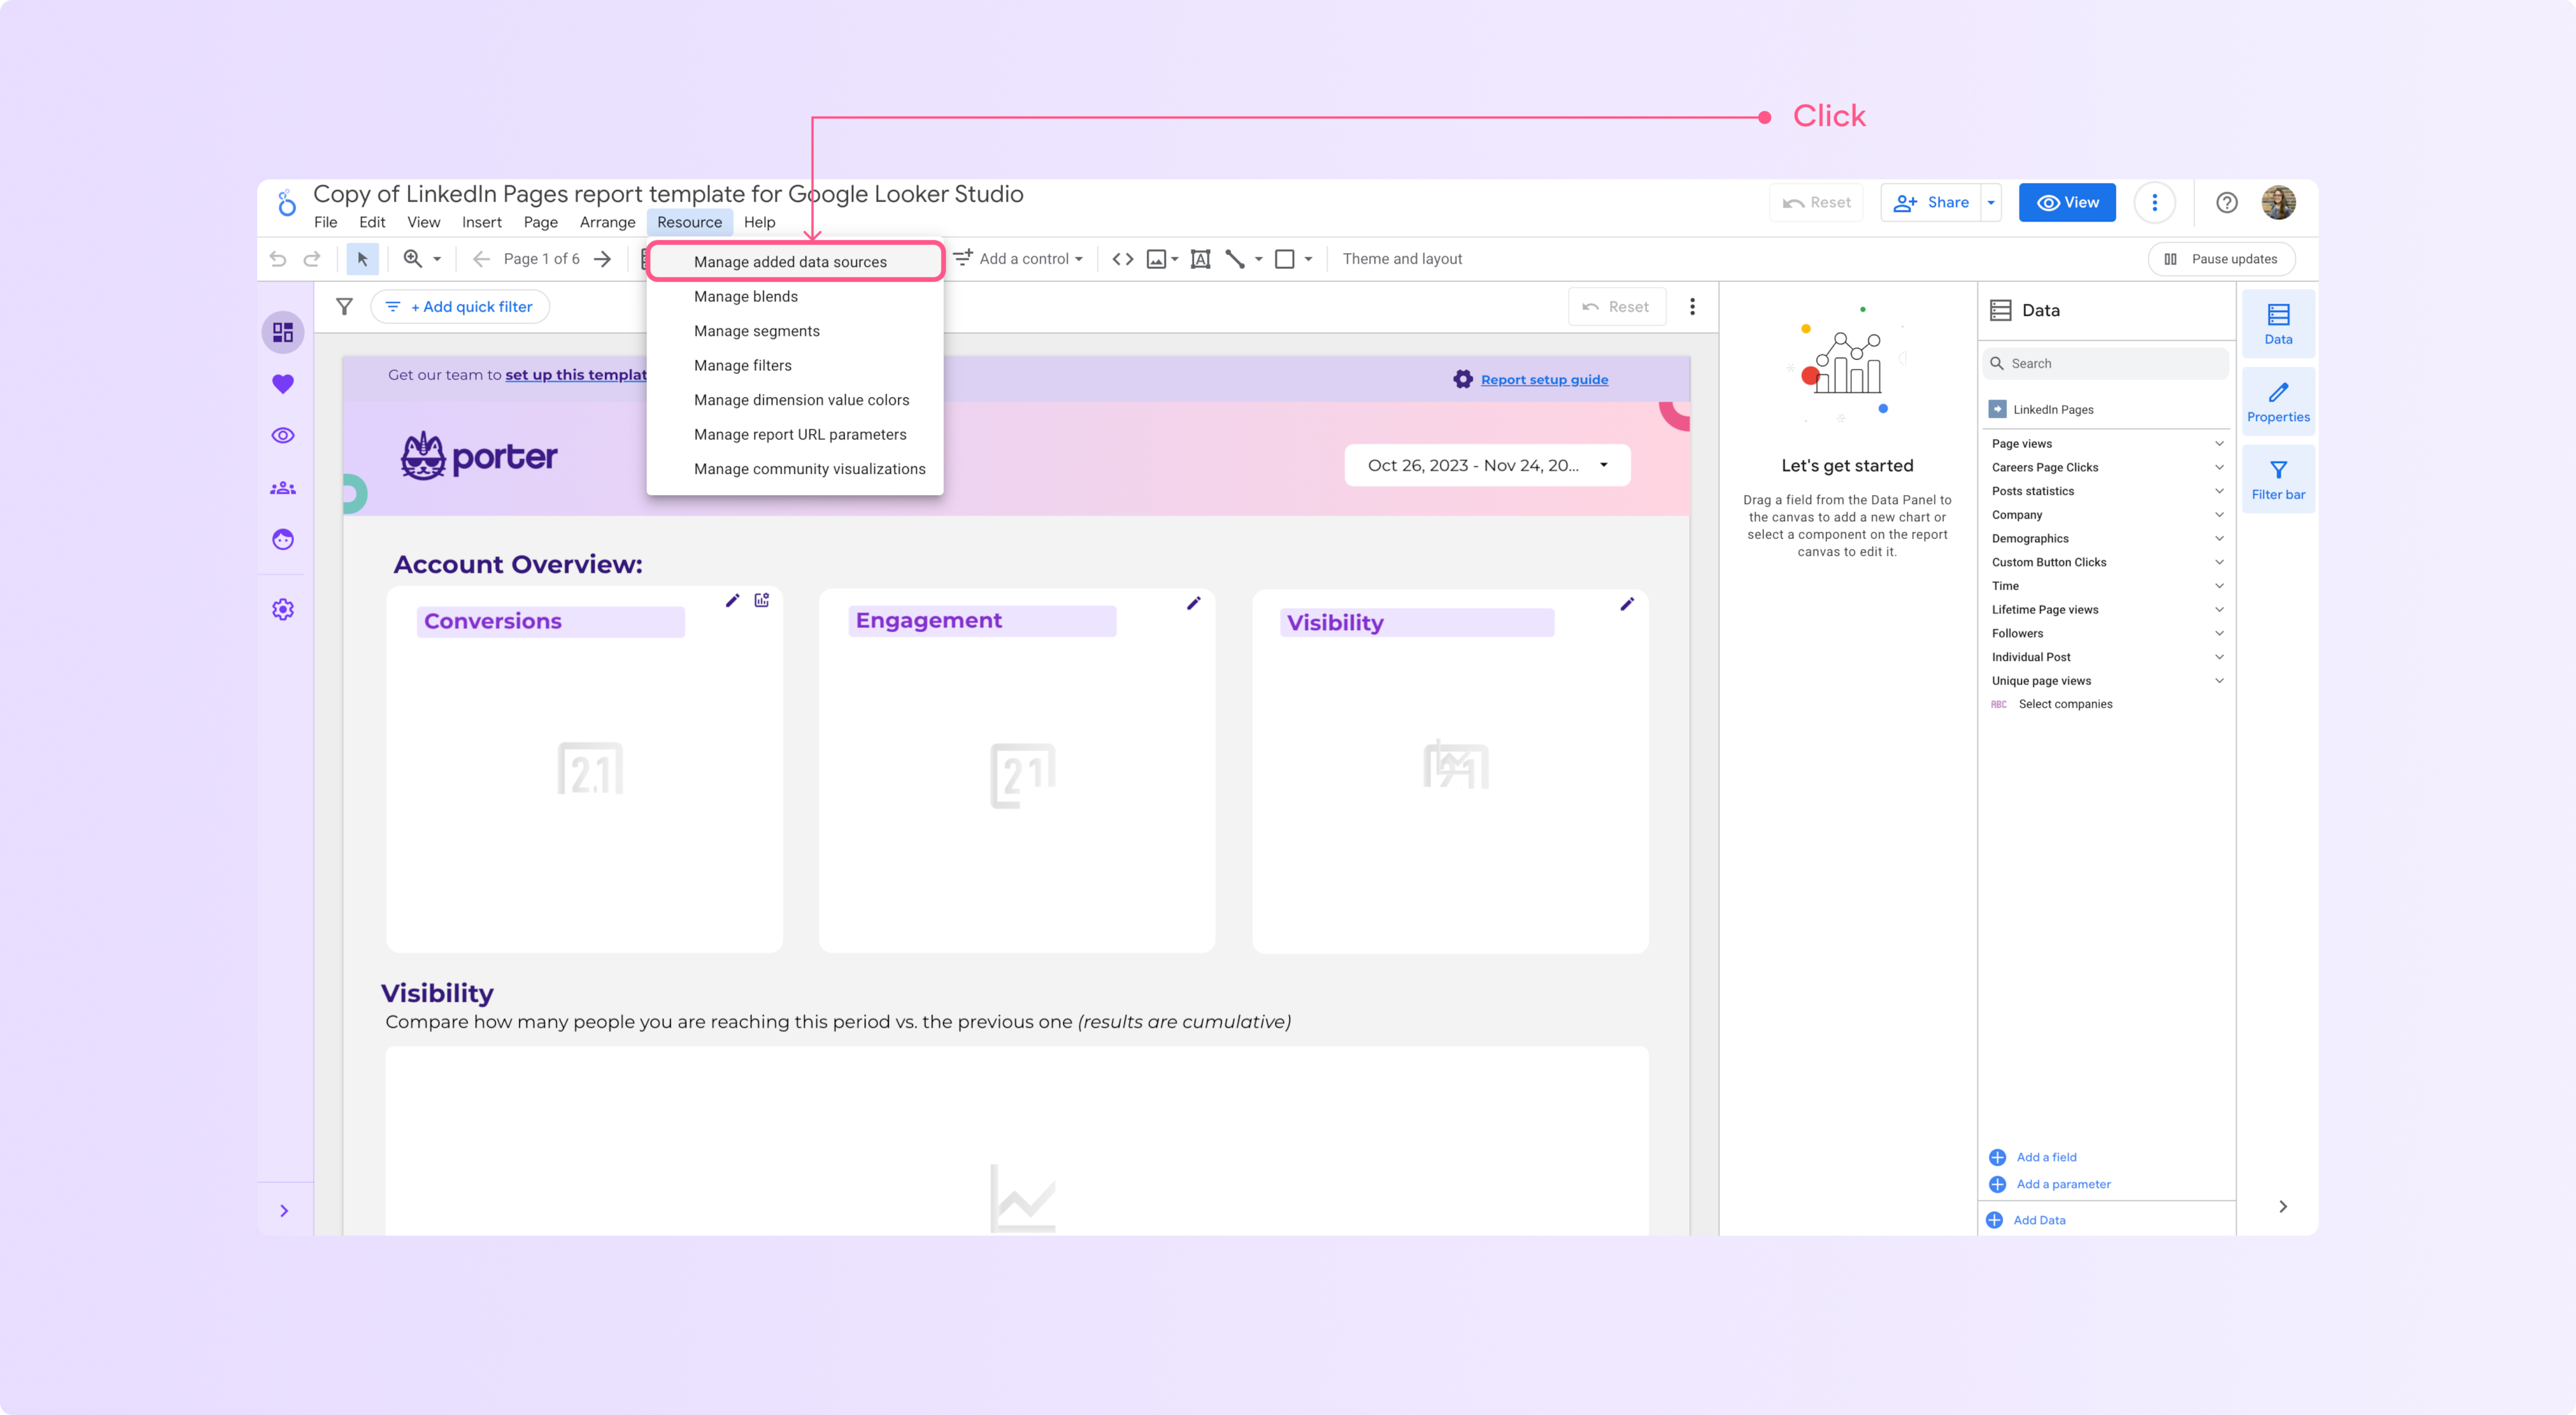
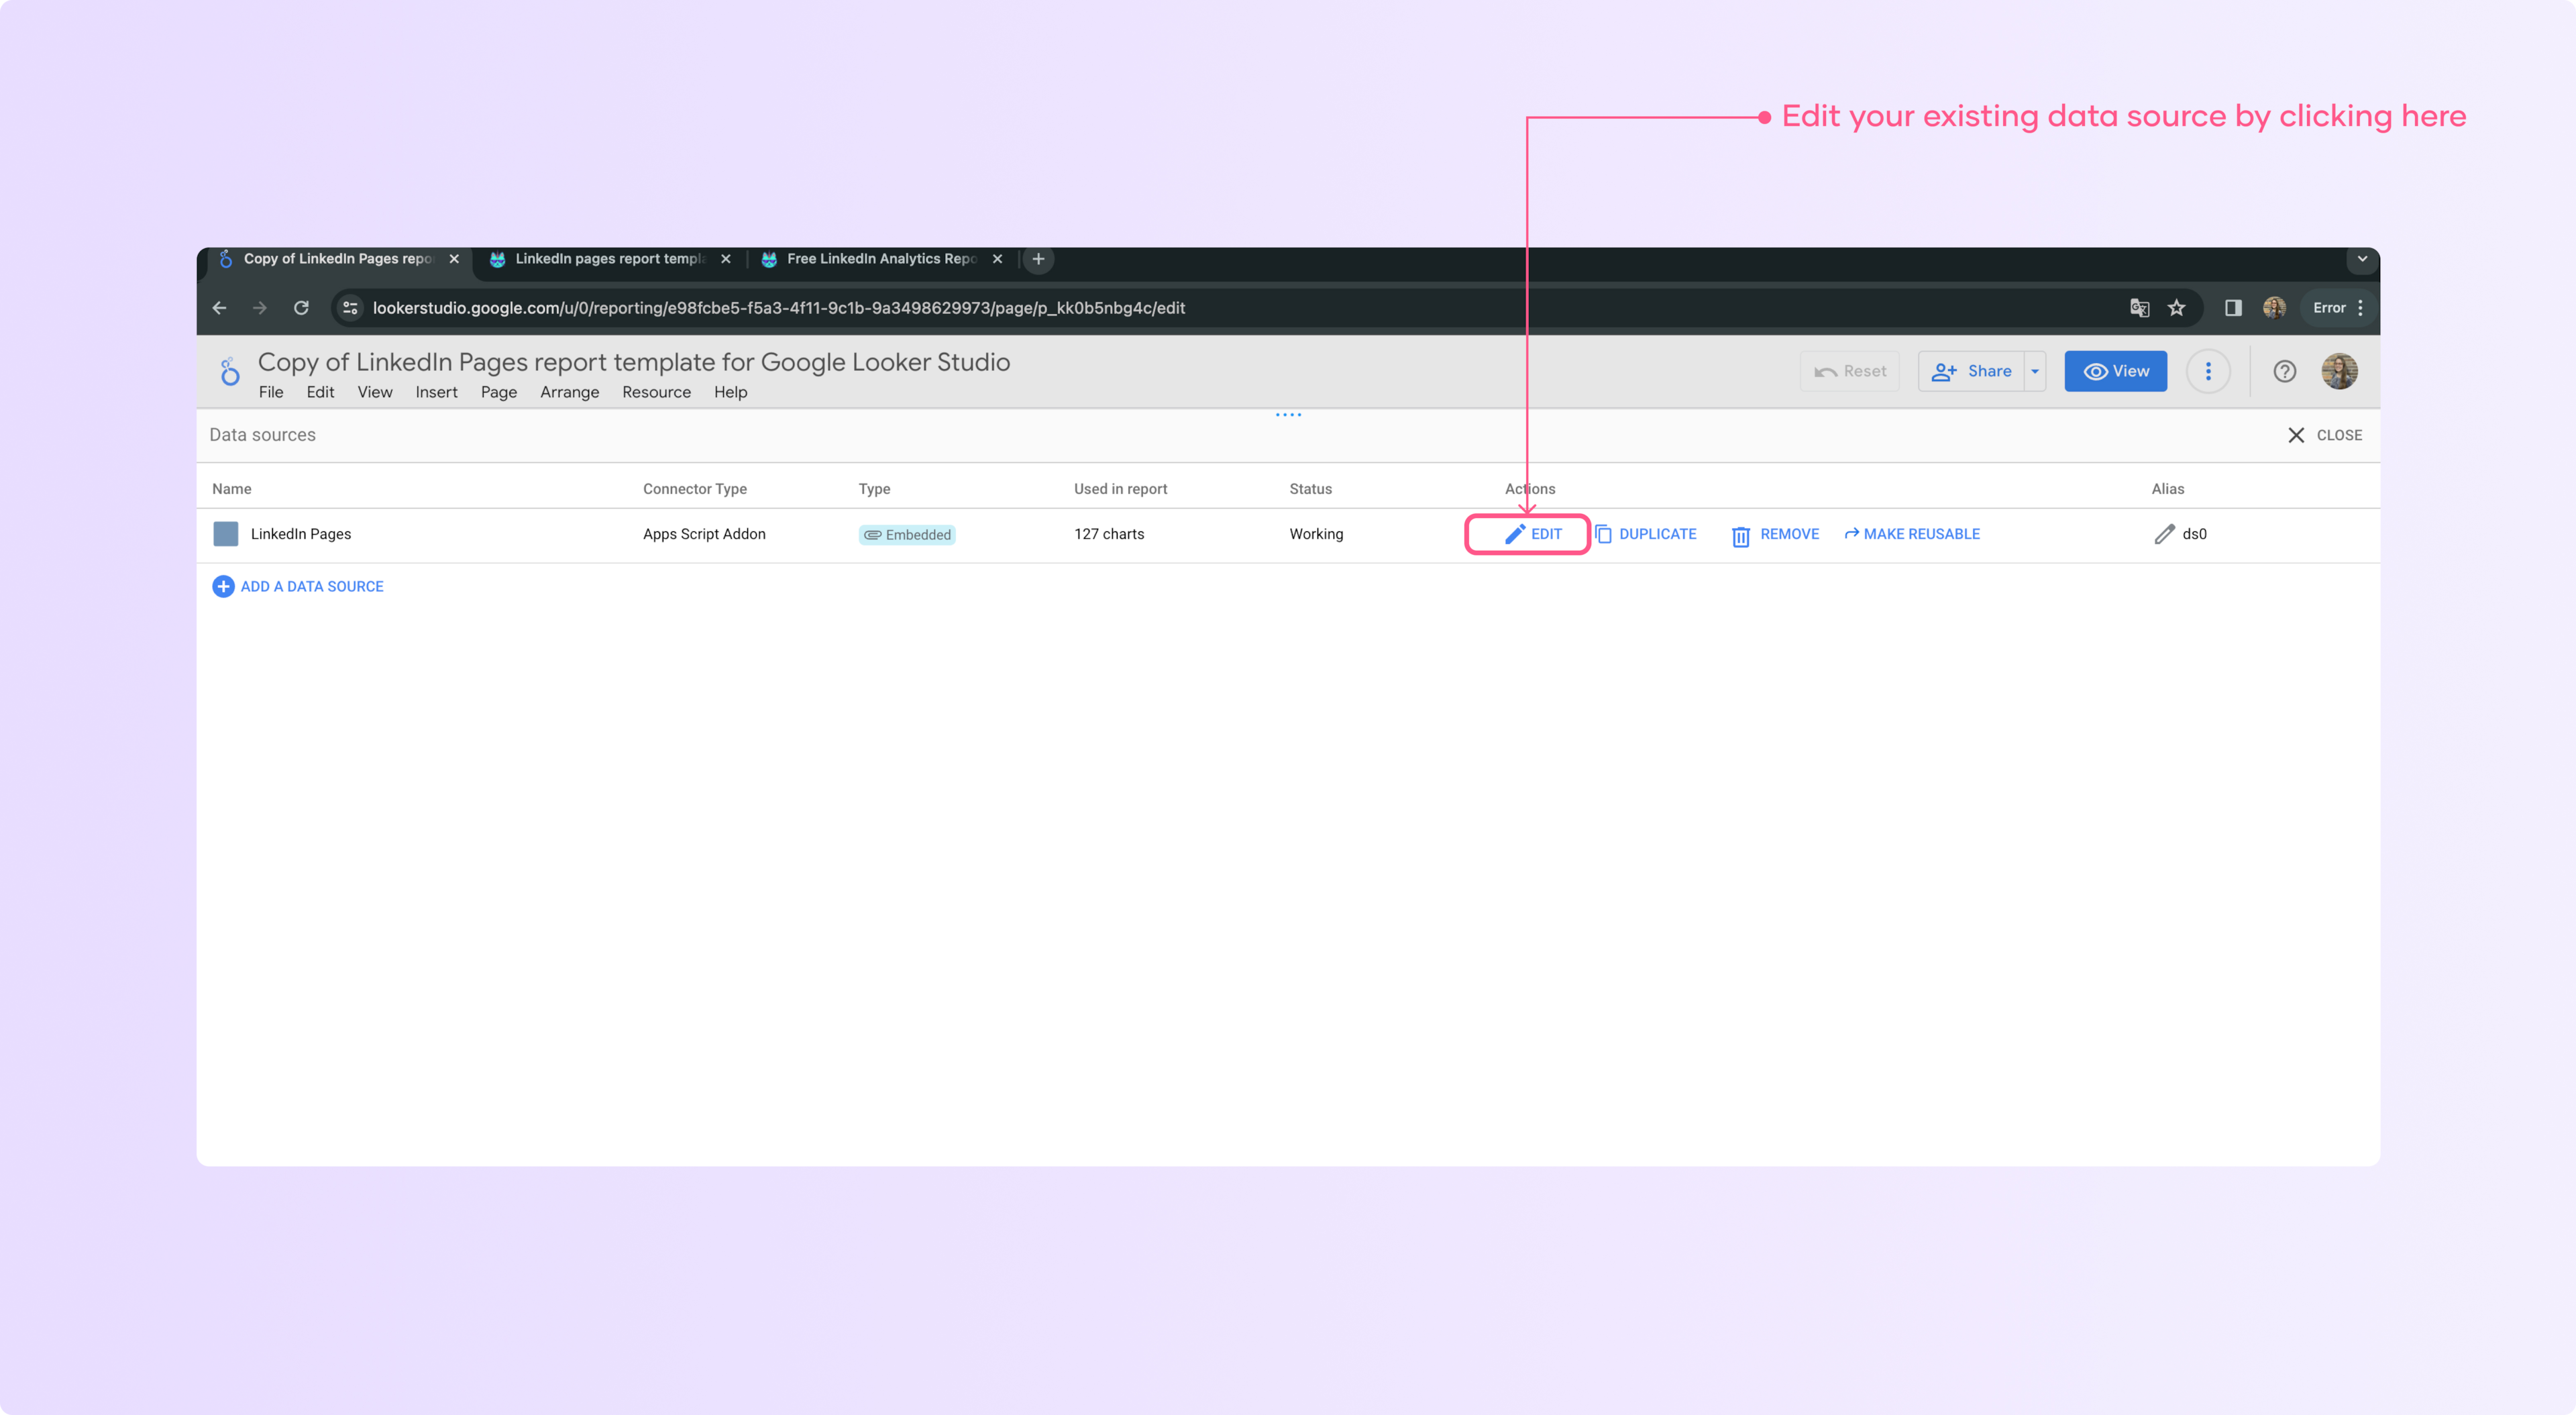
Find the data source you want to edit and click on “edit”
This will open the data source configuration page, where you can make changes to the data source settings, such as:
a. Renaming the data source
b. Updating the data source credentials or connection settings
c. Changing the data source
d. Modifying the data source fields (e.g., renaming, hiding, or changing the data type of fields)
f. Modify metrics and dimensions type
g. Change the default aggregation of a data source
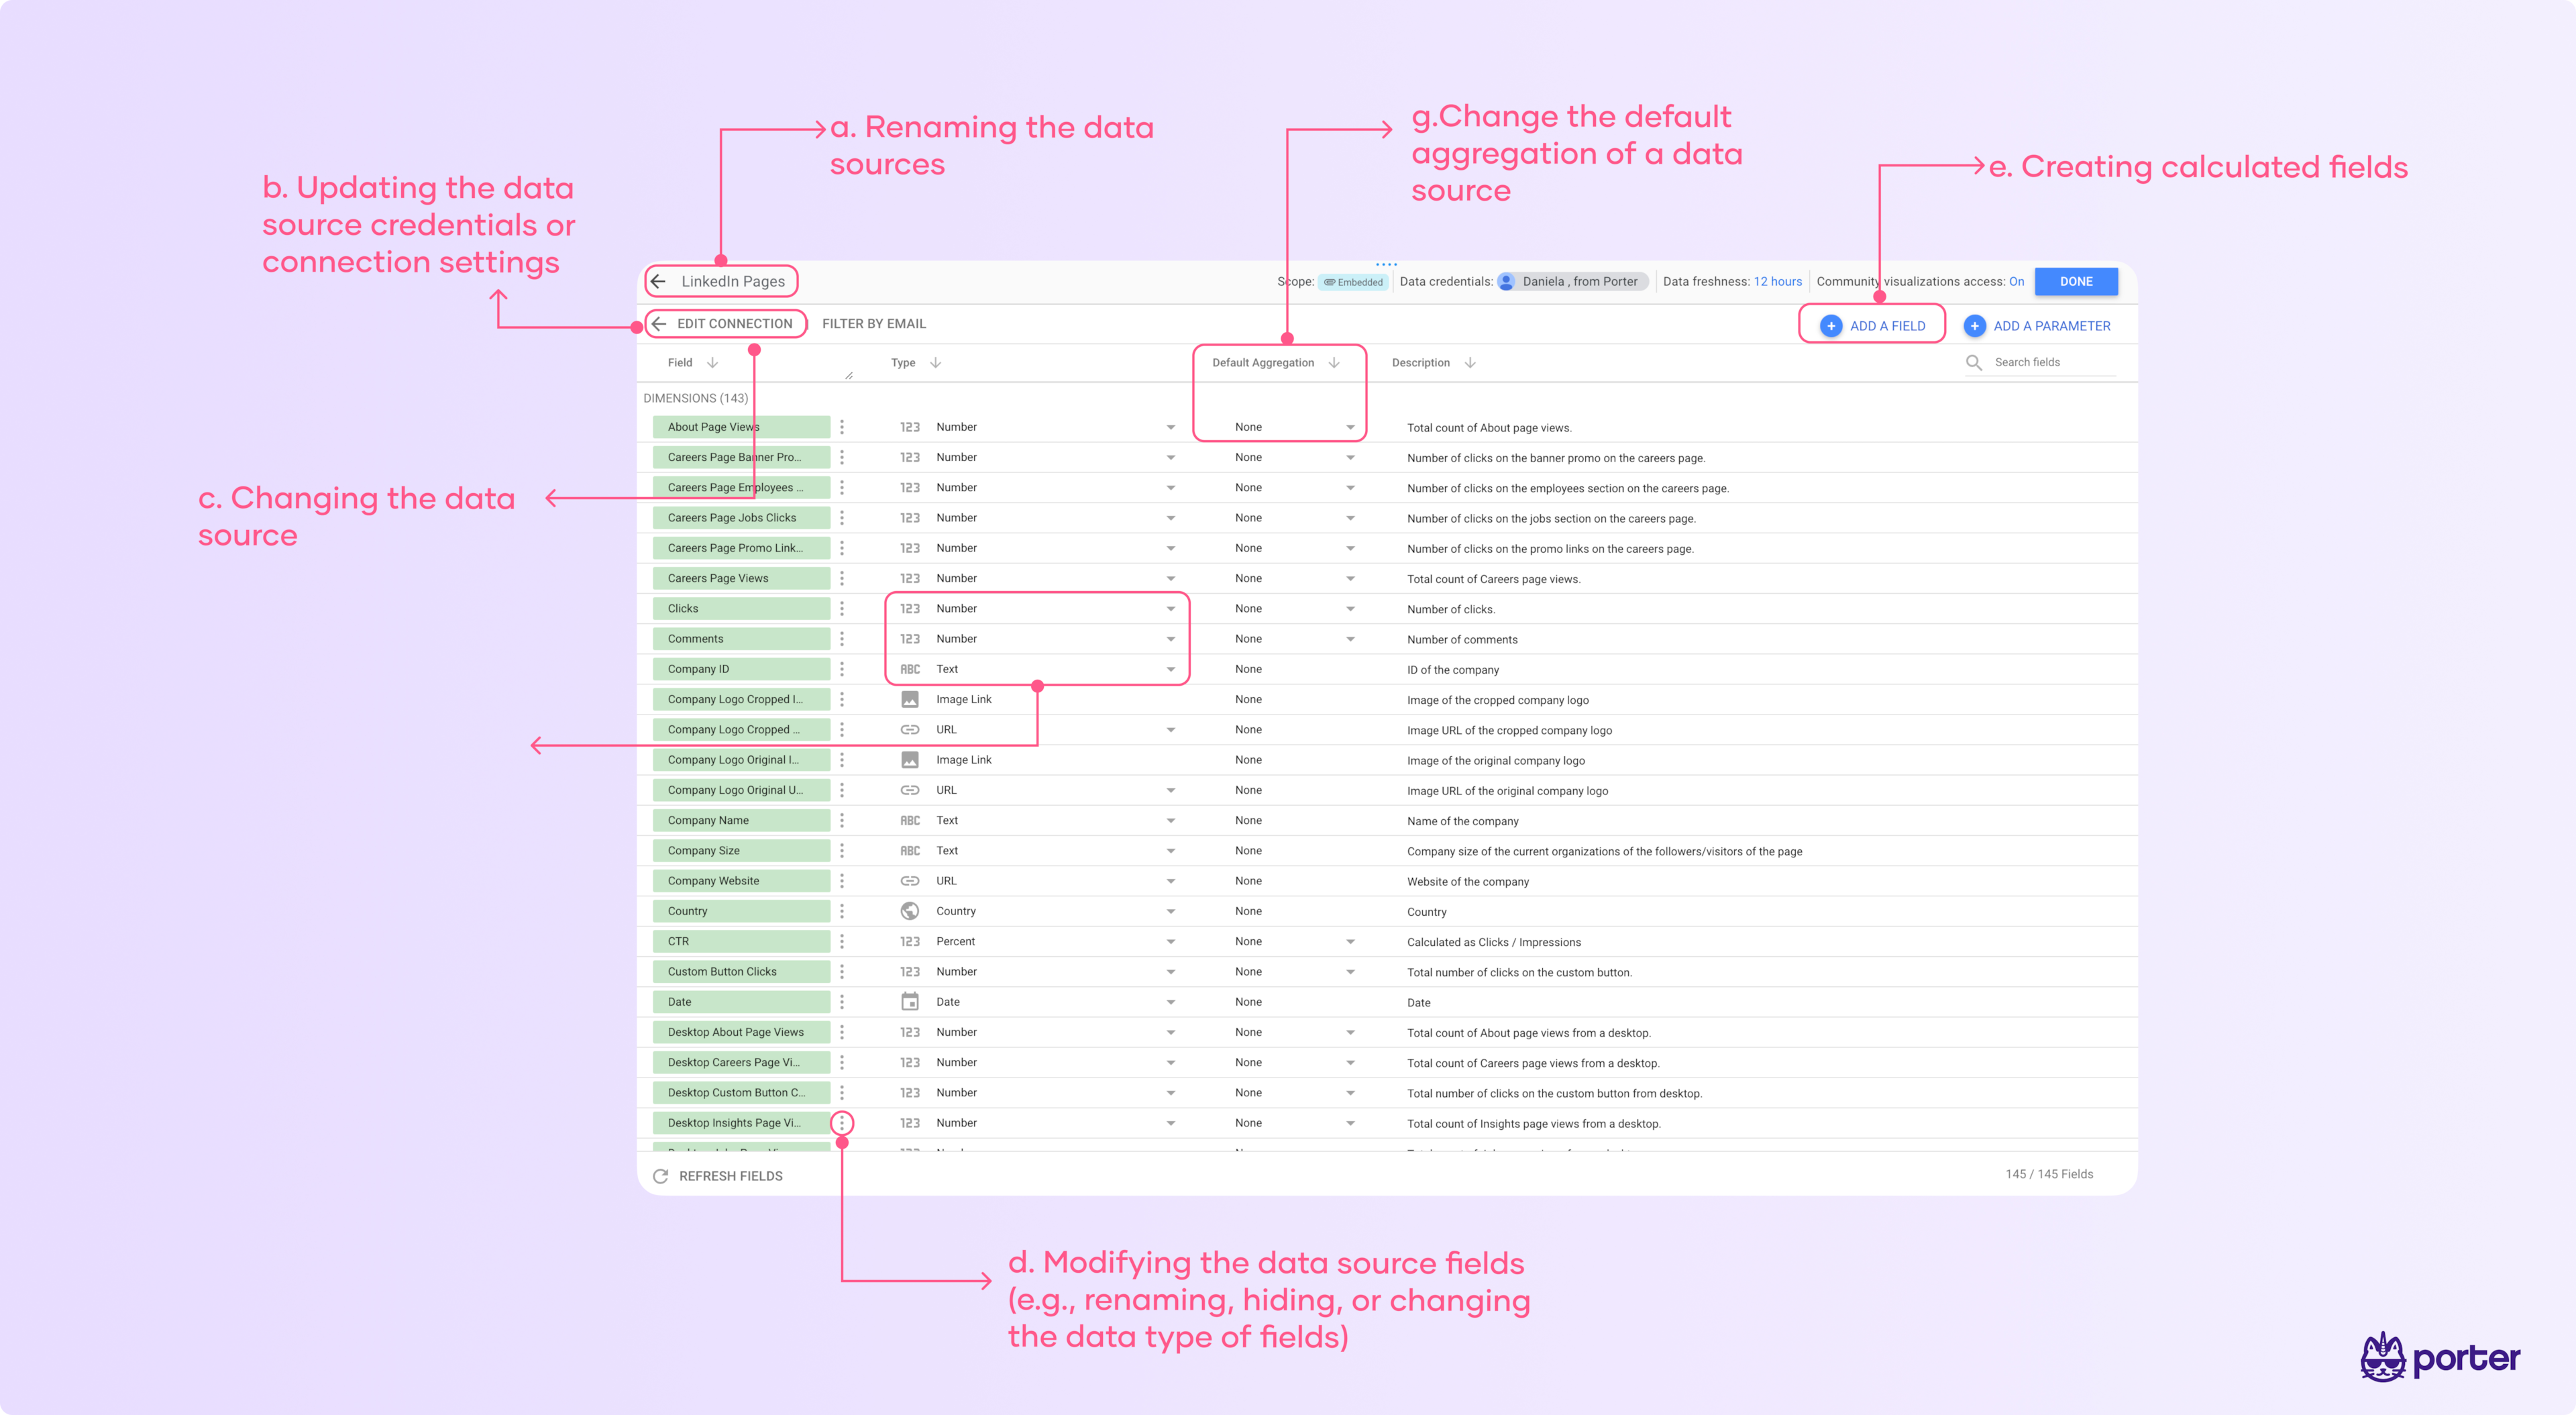
After making the necessary changes, click on “done” at the top-right corner of the screen to apply the changes to your data source.
Close the data source configuration page, and your report will now use the updated data source.
Remember that editing a data source will affect all the charts and controls in your report that use this data source; if you change the name of metrics and dimensions or you change the data source, your previous charts could break.
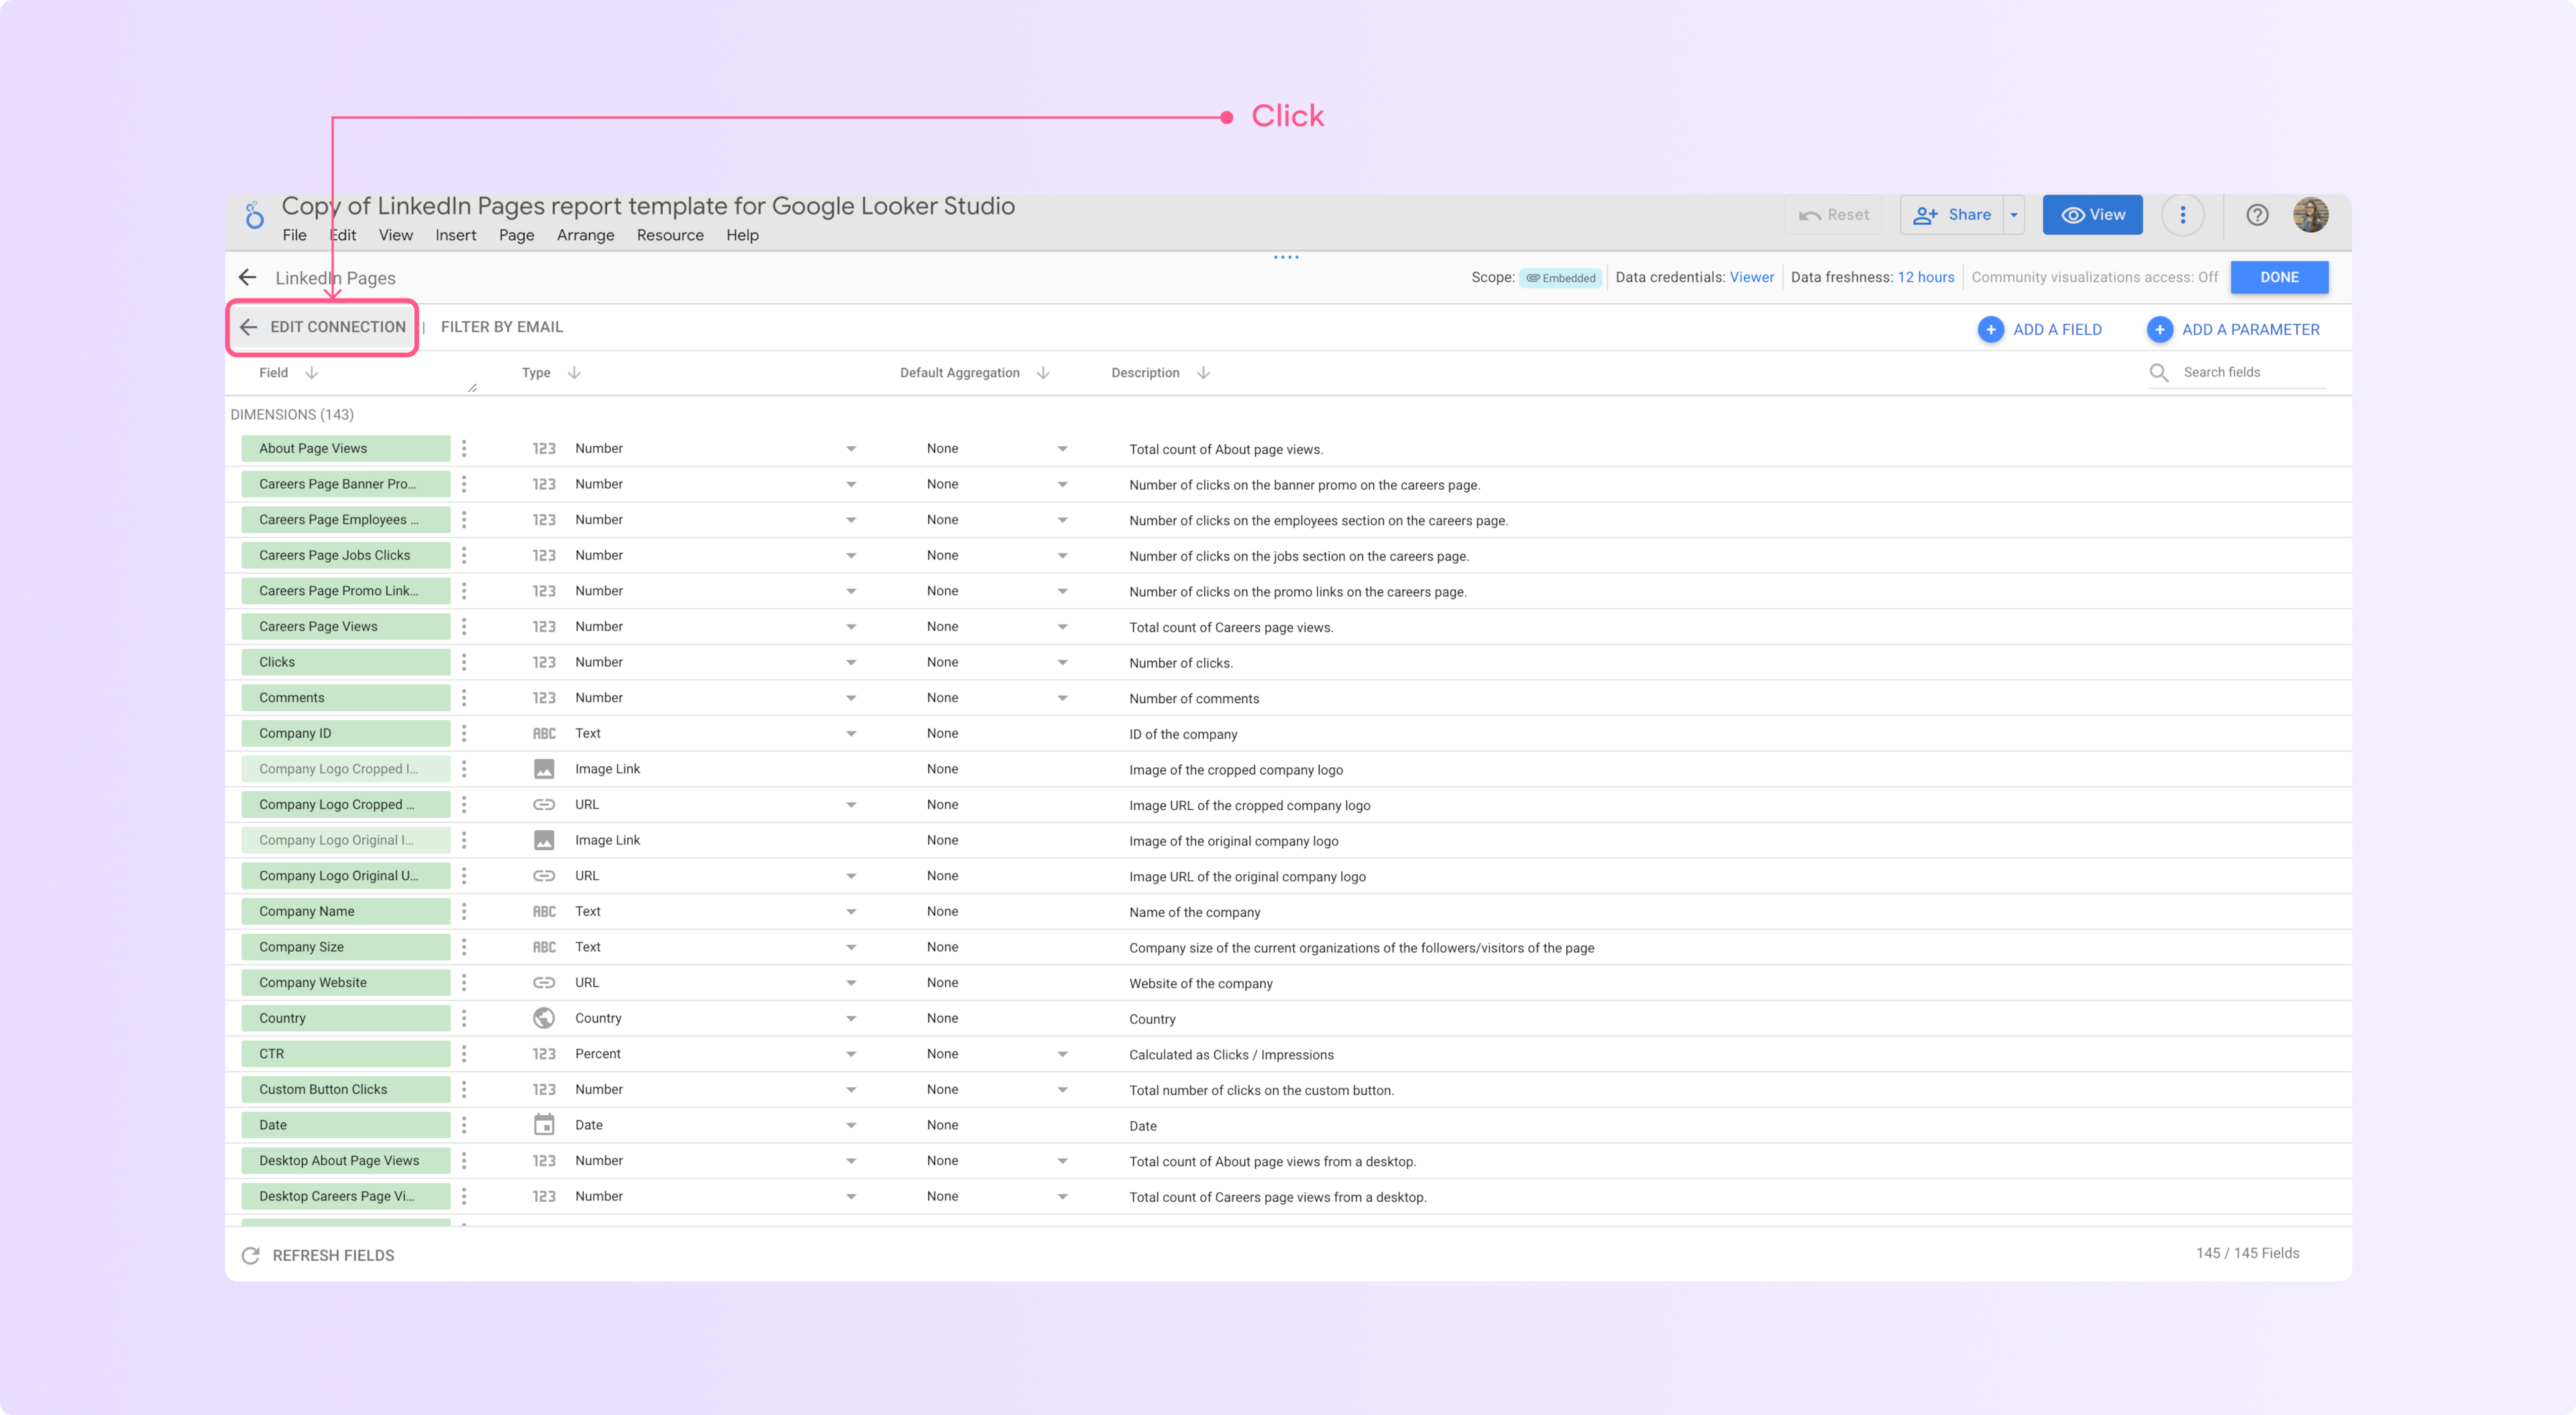
How to change data sources and accounts
You can change the data source easily, just go to ‘Resources’ and then click ‘Manage edit data sources’

Now click on ‘edit’ the data source and when you find the fields go to the left corner and click ‘Edit connection’
Now you will see the connector and the accounts related to the integration and the settings.
If you just want to change the account you connected, click on the dropdown and select the new one
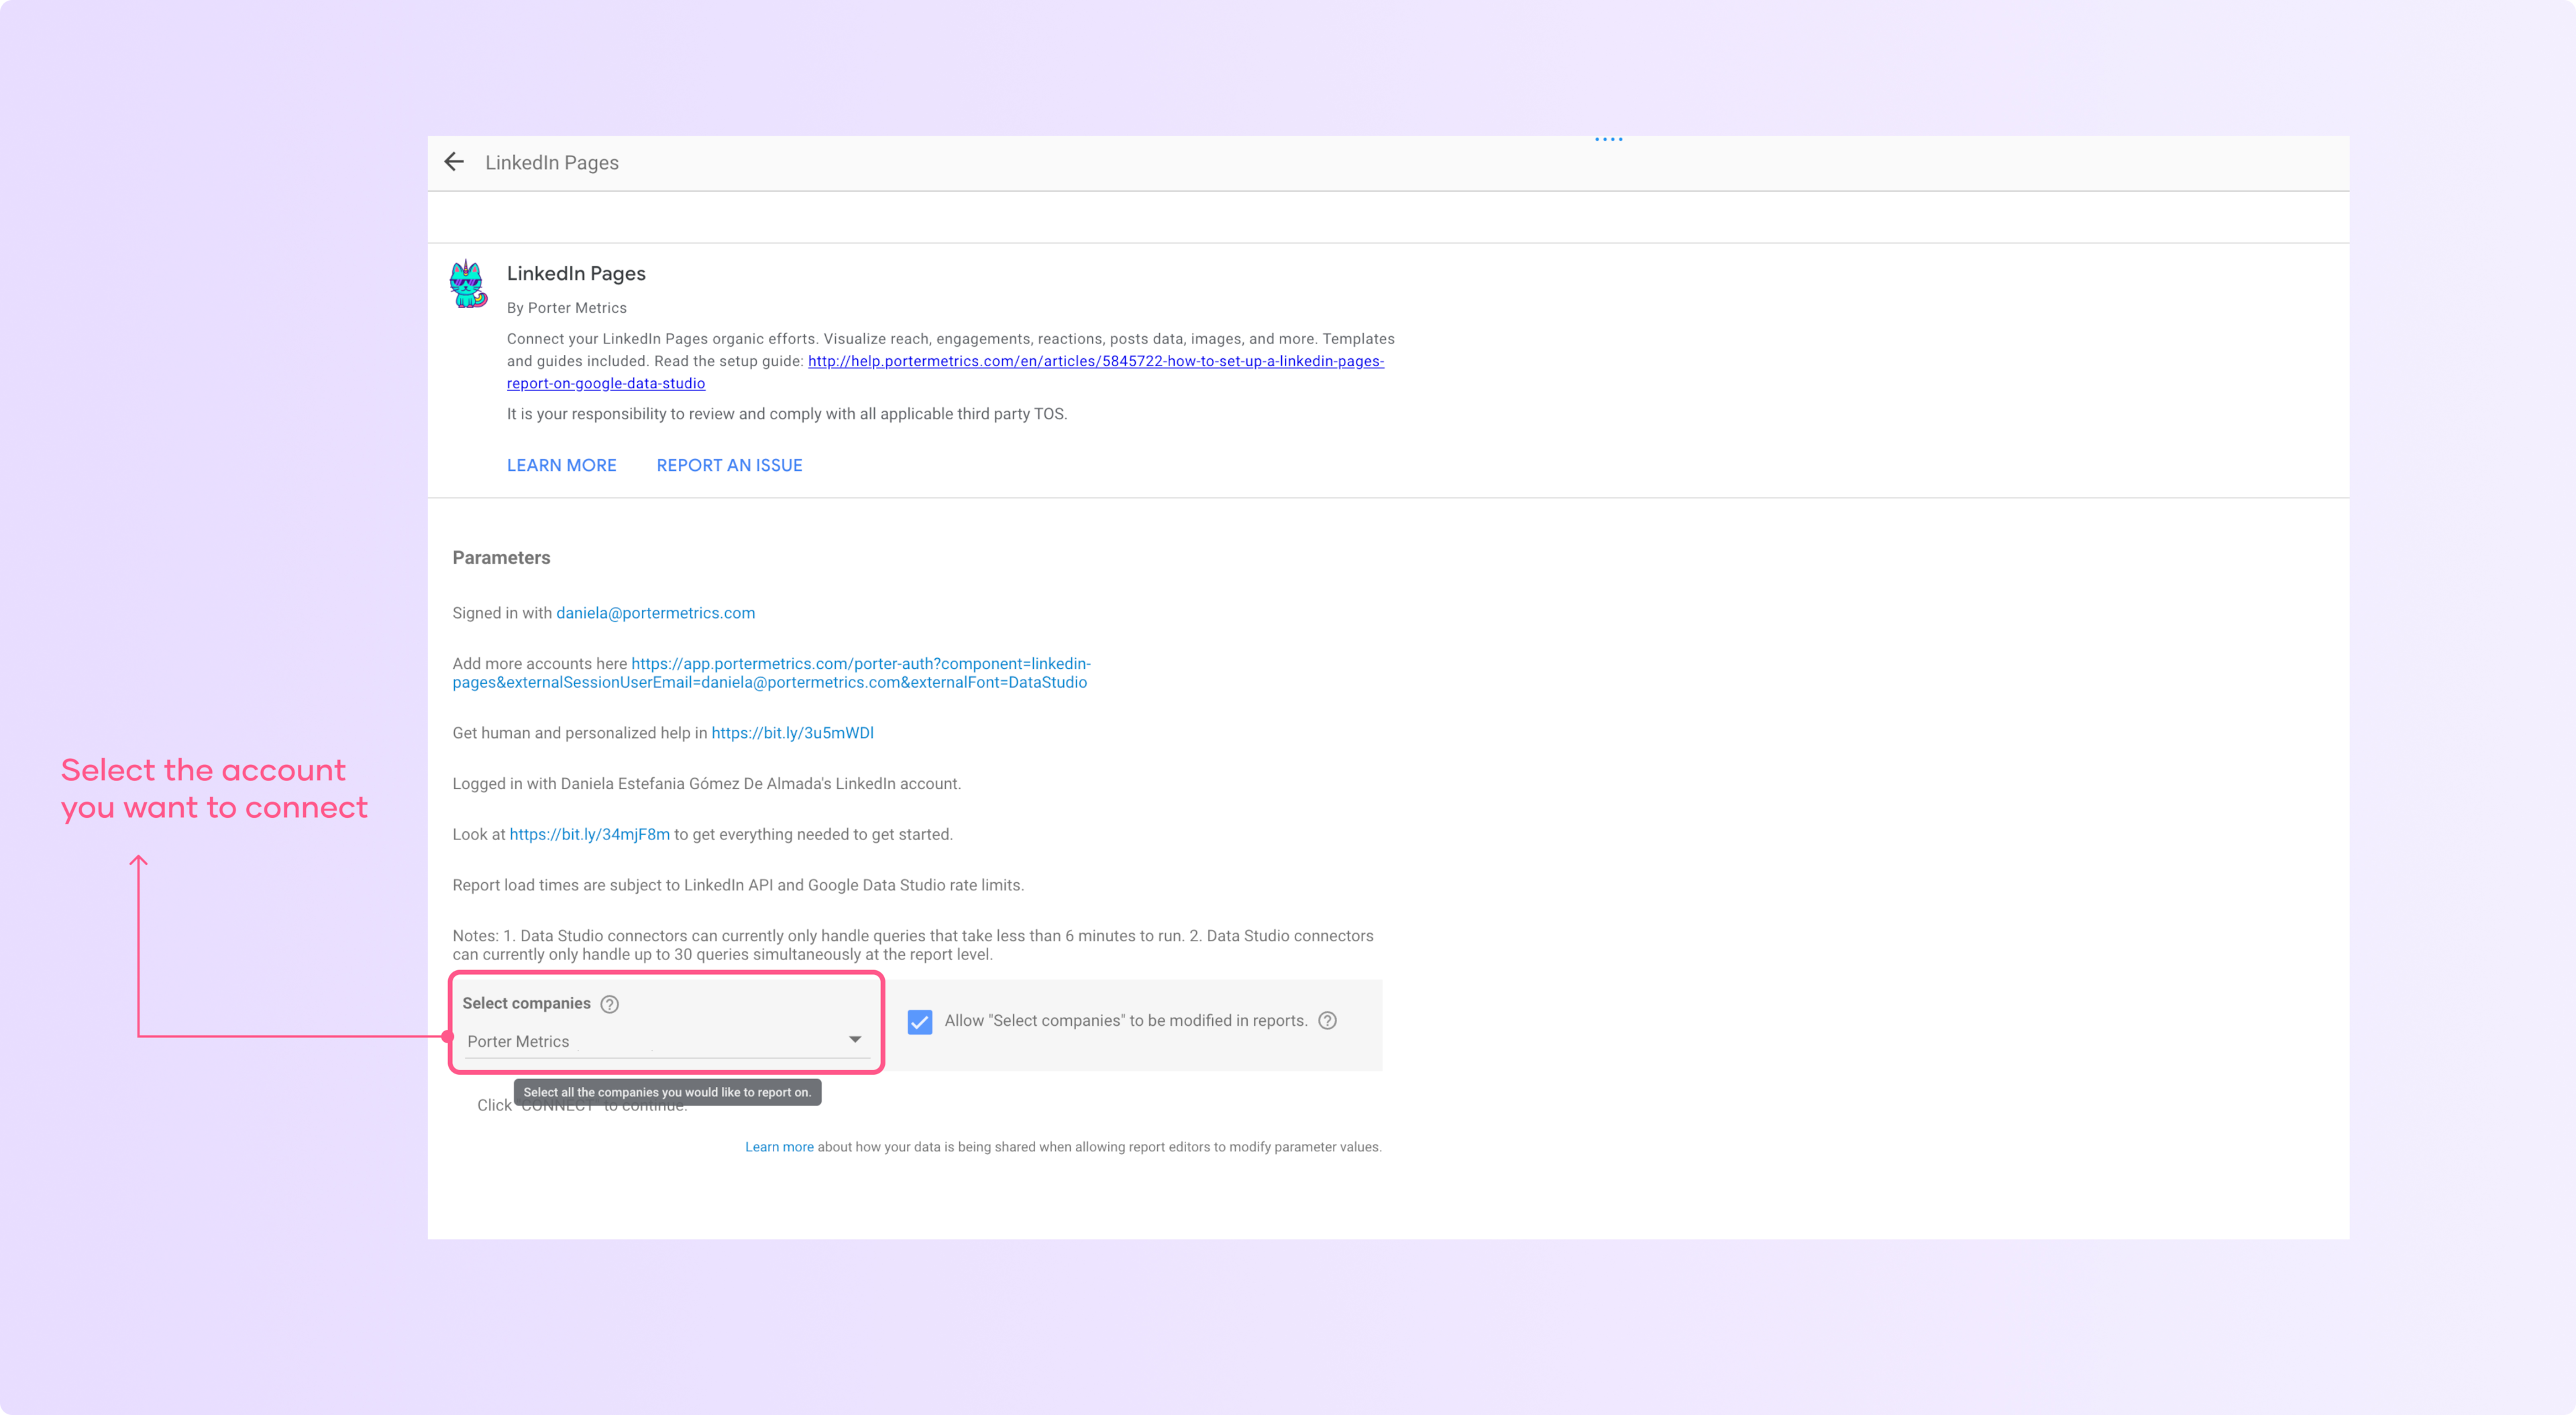
Or if you need to refresh an authentication in a partner connector, just click the link and follow the steps your connector provider offers.
Types of Data Studio connectors
You will find +950 connectors, but actually, you will find that you can find the same integration with different providers.
That’s why when you choose a provider, search for one that offers you the data sources you need, brings all the fields and metrics, stores your data to ensure stability and speed, and offers a good and fast post-purchase service.
Google Native connectors
The 21 connectors by Google are offered for free – and that’s why they are great. You can connect data sources such as Google Sheets, Google Ads, Google Analytics 4, and Google Search Console.
They have limitations, such as the number of queries you can do in a certain amount of time with GA4 or the number of fields they bring in Google Ads or GA4, but generally speaking. They are a great place to start.
Partner connectors and Data Studio community connectors
Google will not build integrations to all platforms -and their competitors- but they allow other companies to do it and commercialize them. These types of connectors are called third-party connectors or Data Studio community connectors.
That’s what Porter Metrics does. We integrate with marketing platforms such as Facebook Ads, Hubspot, Shopify, and LinkedIn Pages, and then we send the data to Data Studio and Google Sheets.
How to connect Google Sheets to Data Studio?
To connect Google Sheets to Data Studio, follow these steps:
Create a report and click ‘add data’
Then select ‘Google Sheets’ as a data source.If it’s your first time connecting it you have to authorize permissions.
Select the spreadsheets you want to connect and the specific worksheet you want to visualize the data from.
Now, you will see all the metrics and dimensions on your sheet, and you can customize the metrics format.
Recommendations to connect your Google Sheets to Data Studio
The right structure to connect your Google Sheets to Data Studio is to have every field in columns and the headers with unique names.
Don’t combine cells because that will cause an error.
A good practice is to add drop-downs with multi-select to your Google Sheets when possible to avoid duplicate data on your charts.
Don’t mix numbers with text in the same column.
Check that all your number formats are right on your Sheets.
For instance, if your decimals are configured with a ‘.’ and you have a, ‘,’ that could cause an error because some would be recognized as numbers and others don’t.
How to connect Facebook Ads (Meta Ads) to Data Studio?
Connect your data to Data Studio with a partner connector
To connect your Data Studio to Facebook Ads and refresh your data directly from the API, you need a third-party connector.
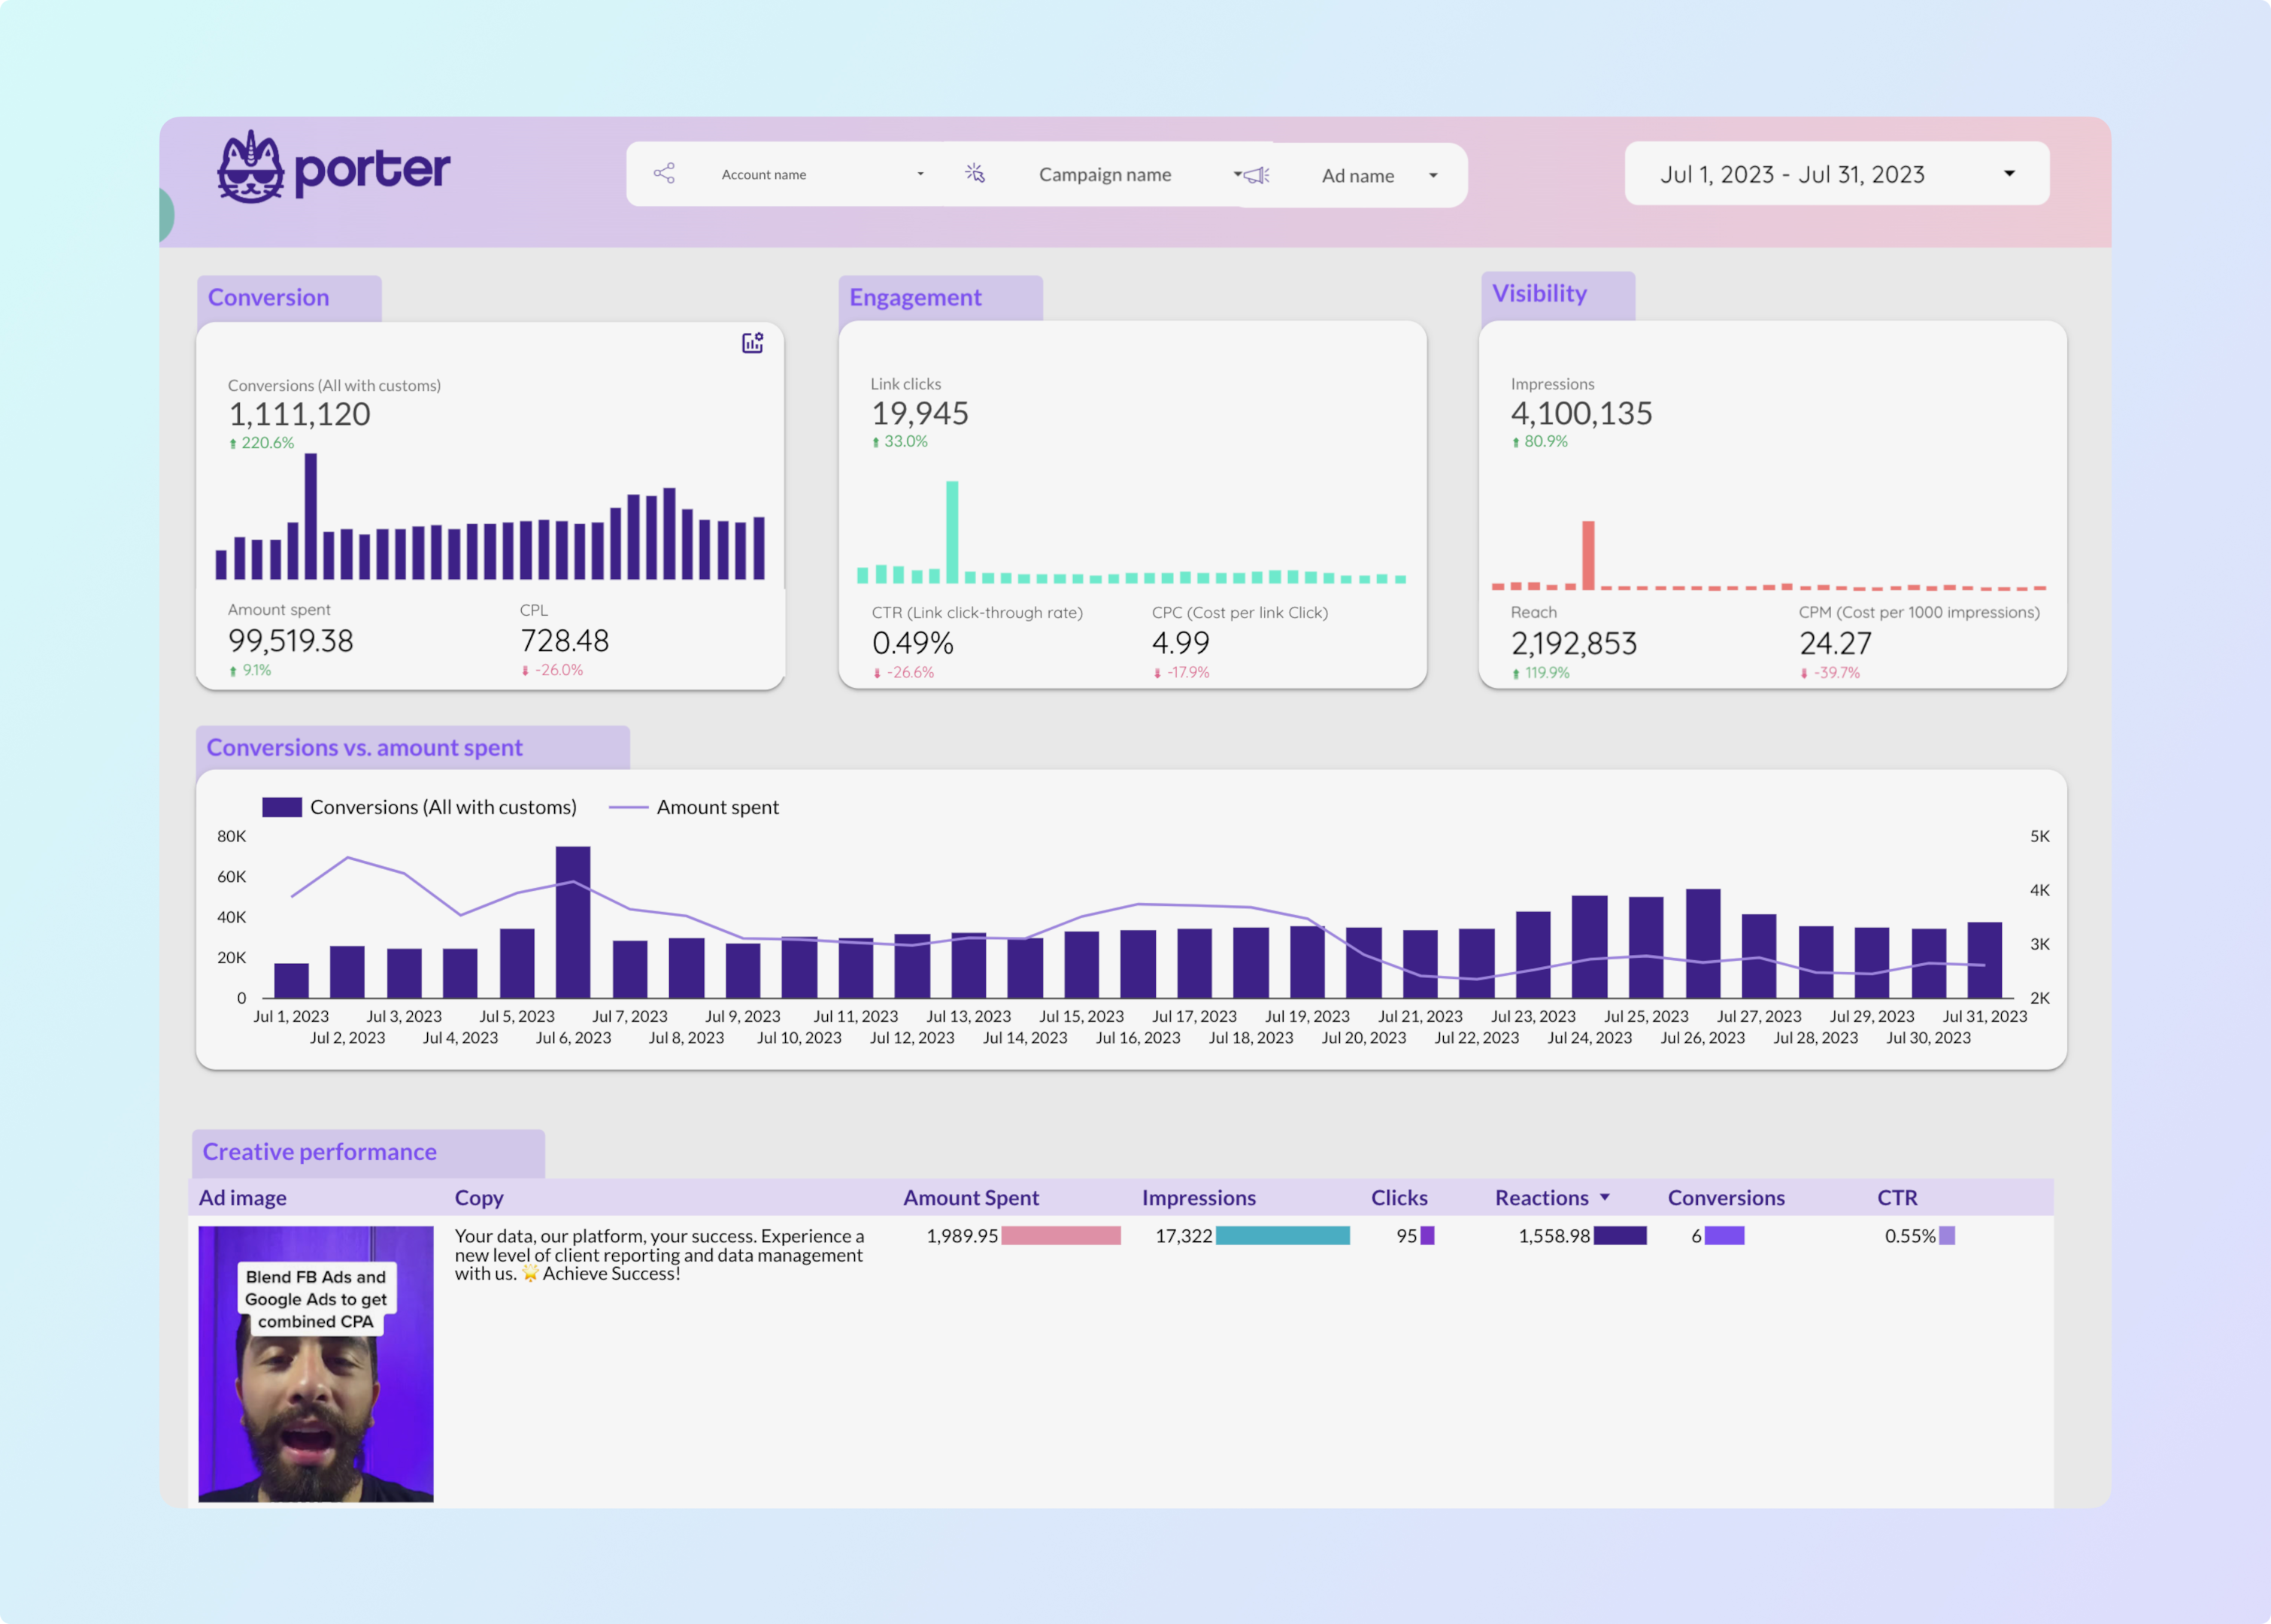
This will allow you to easily and quickly create metrics and dimensions such as post images, the amount spent, and custom conversions instead of manually downloading a CSV and then exporting the data.
To connect your Facebook Ads data to Data Studio using a third-party connector follow these steps:
On your report, click on ‘Add data’
Type Facebook Ads on the search bar and select one of the connectors available.
If it’s your first time, authorize with Data Studio and then with the partner connector you selected. You will have to authenticate your account using your Facebook Profile.
You will be redirected again to Data Studio to select which Facebook Ads account you want to connect.
Now click on ‘Add’ when you finish authorizing your data, and then click on ‘Add to report’
You will see all the metrics and dimensions of the data source.
A tip from me: type ‘Image’ and check that the ad image and other image fields are not hidden.
Click on ‘Add a chart’ and select the type of chart you want to visualize your data with the correct metrics and dimensions.
If you connect you Facebook Ads data using Porter Metrics, the report you create will come with a fully customizable template that will save you hours!
Connect your Facebook ads data to Google Sheets and then to Data Studio
You can connect your Facebook ads data to Google Sheets automatically and then to Data Studio for visualization if you want to easily store and manipulate your data.
One benefit of this alternative is that reports load faster, and custom formulas can be easily created on sheets.
To export Facebook Ads data to Google Sheets automatically, follow these steps:
Install the Google Sheets add-on
On your Sheet, go to Extensions – Porter Metrics add-on – Launch
Choose the Facebook Ads integration and connect your Facebook profile. Porter will bring all the ad accounts associated.
Select the Facebook account you want to connect to.
Choose all the metrics and dimensions you want to include in your report, such as the amount spent, date, clicks, conversions, campaign name, and more.
Now, on the schedule option click on schedule and select what’s the frequency you want the data to be updated on your Google Sheets, for example, you could set it to refresh the data daily, weekly or monthly.
You can do this manually by downloading the CSV directly from the Facebook Ads manager. It’s time-consuming, but it’s free.
Now you have to connect your Google Sheets worksheet directly to Looker and create charts and graphs to help you tell a better story with your data.
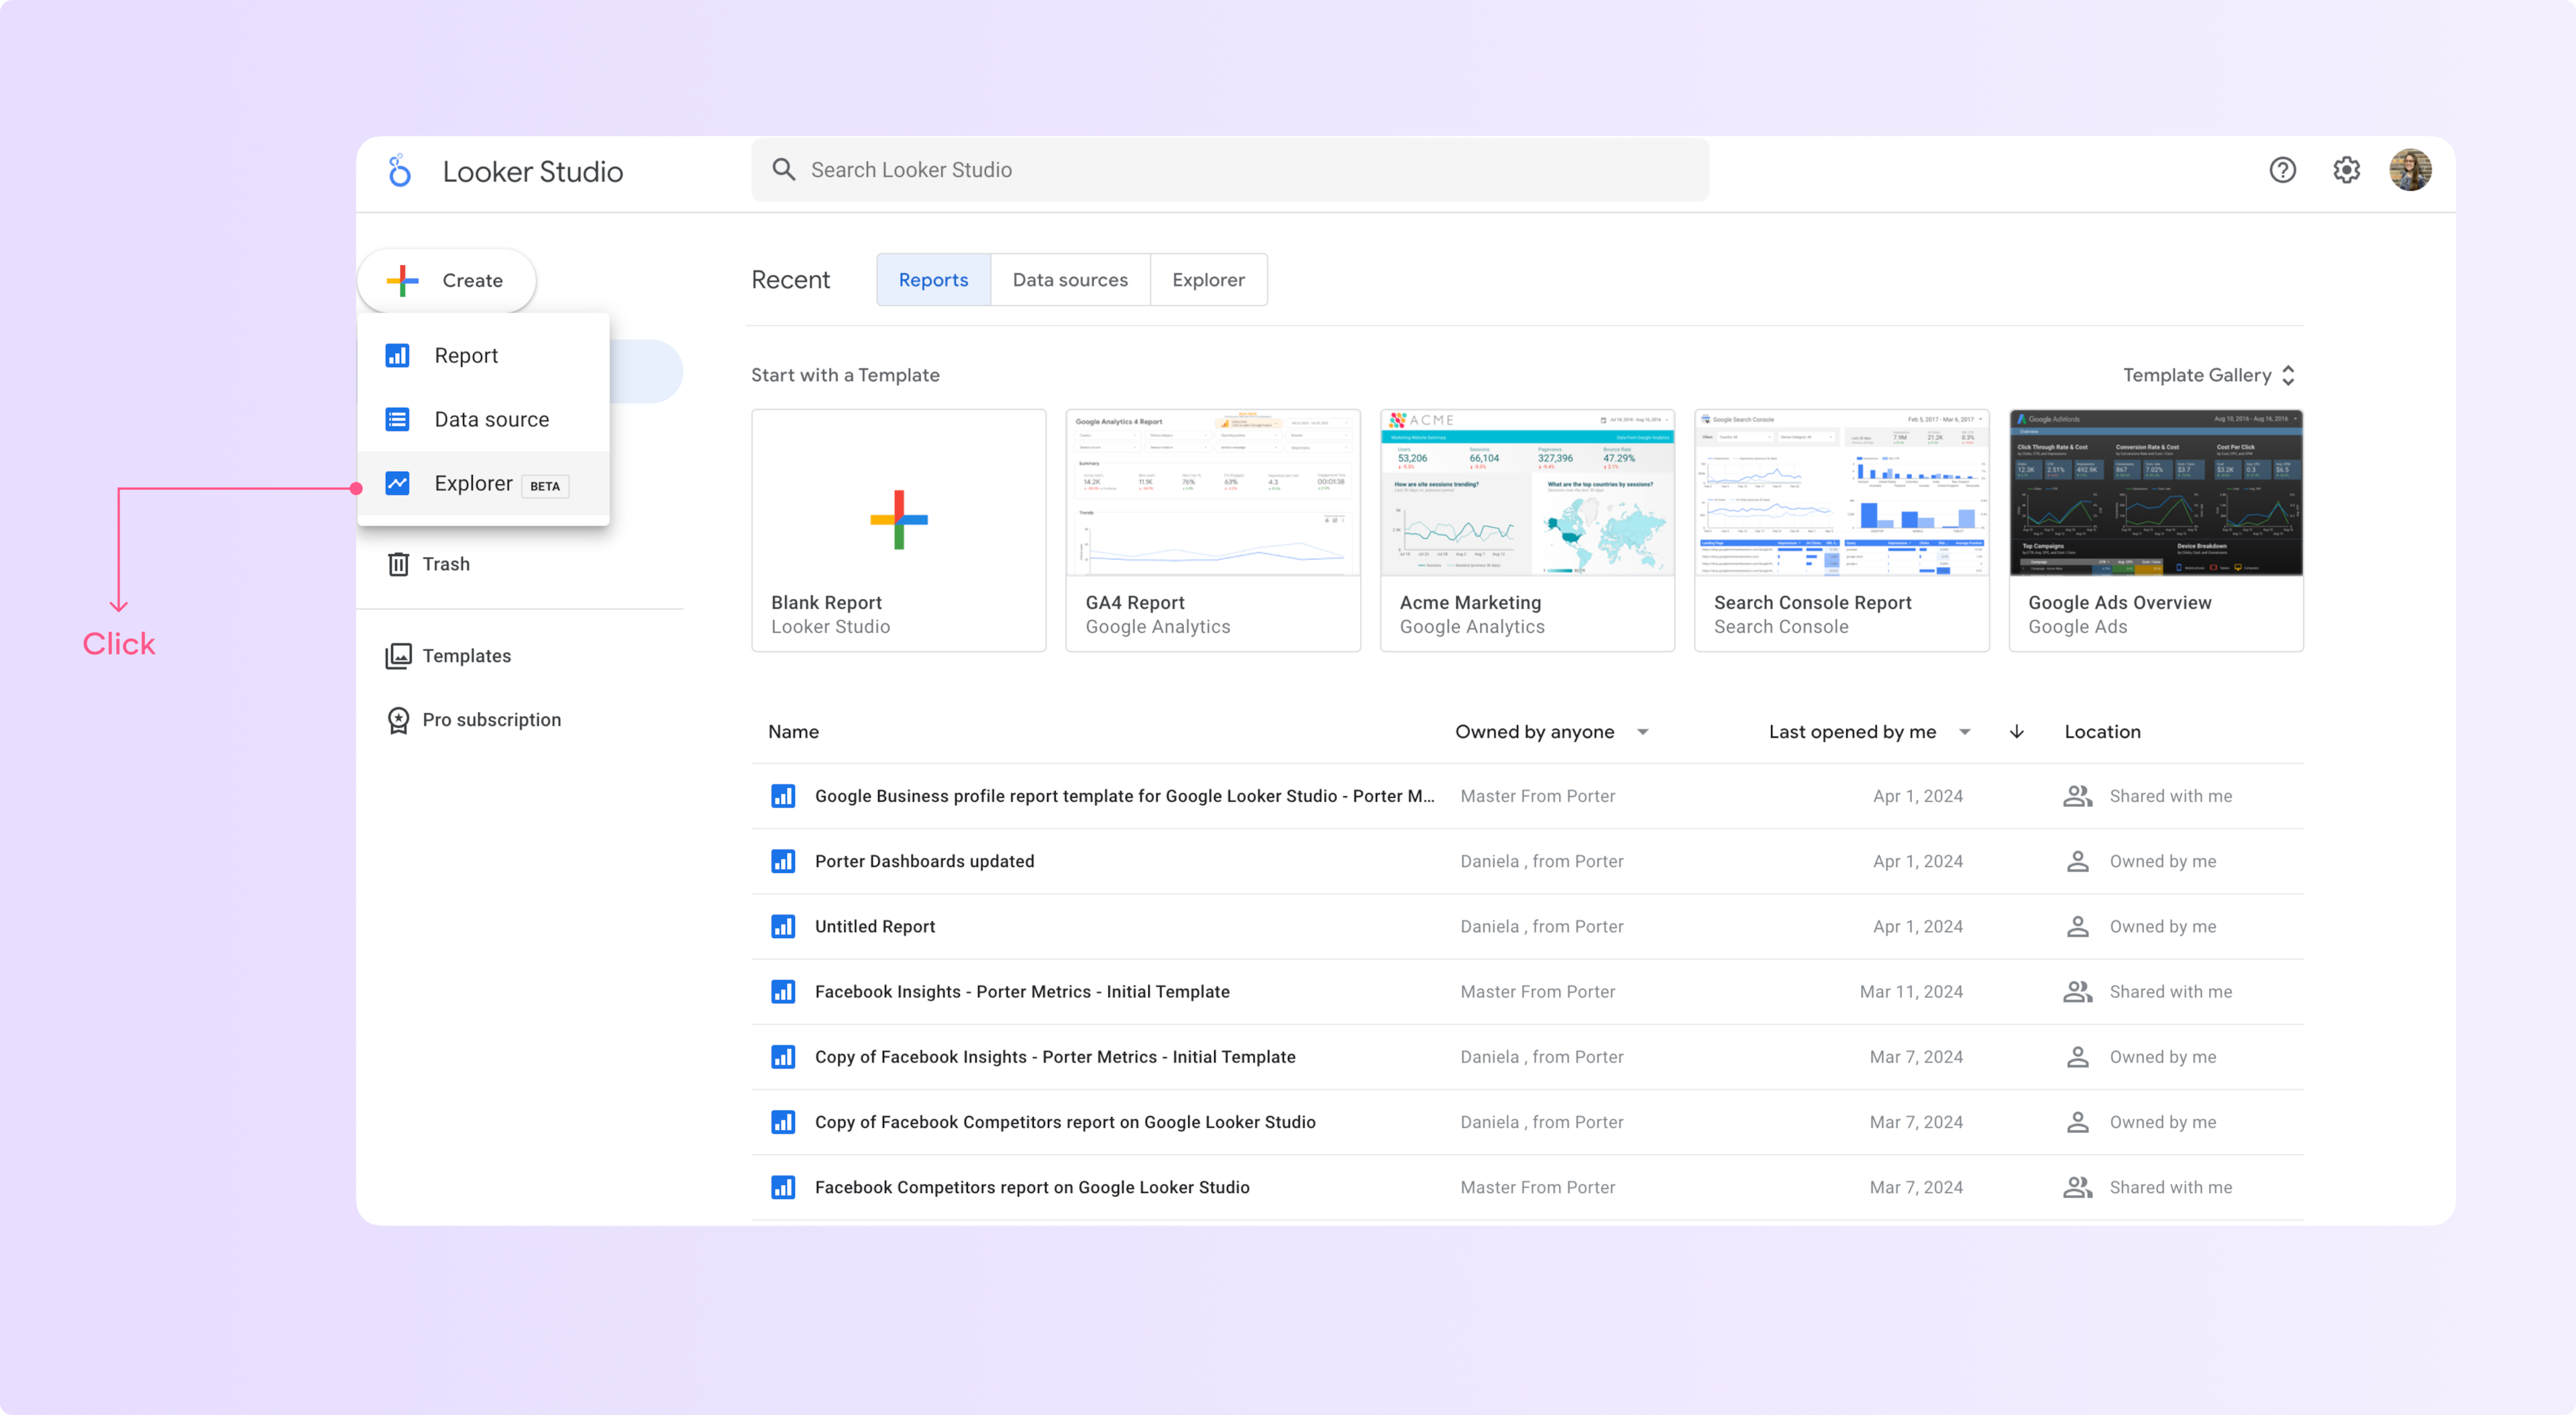
Use the explorer function to visualize your data
The explorer function lets you explore your data without building a complete report.
This is great, so you don’t have a lot of unfinished dashboards on your account.
To use it go to the Data Studio home page and click on ‘Create’ and select the ‘Explorer’ option.
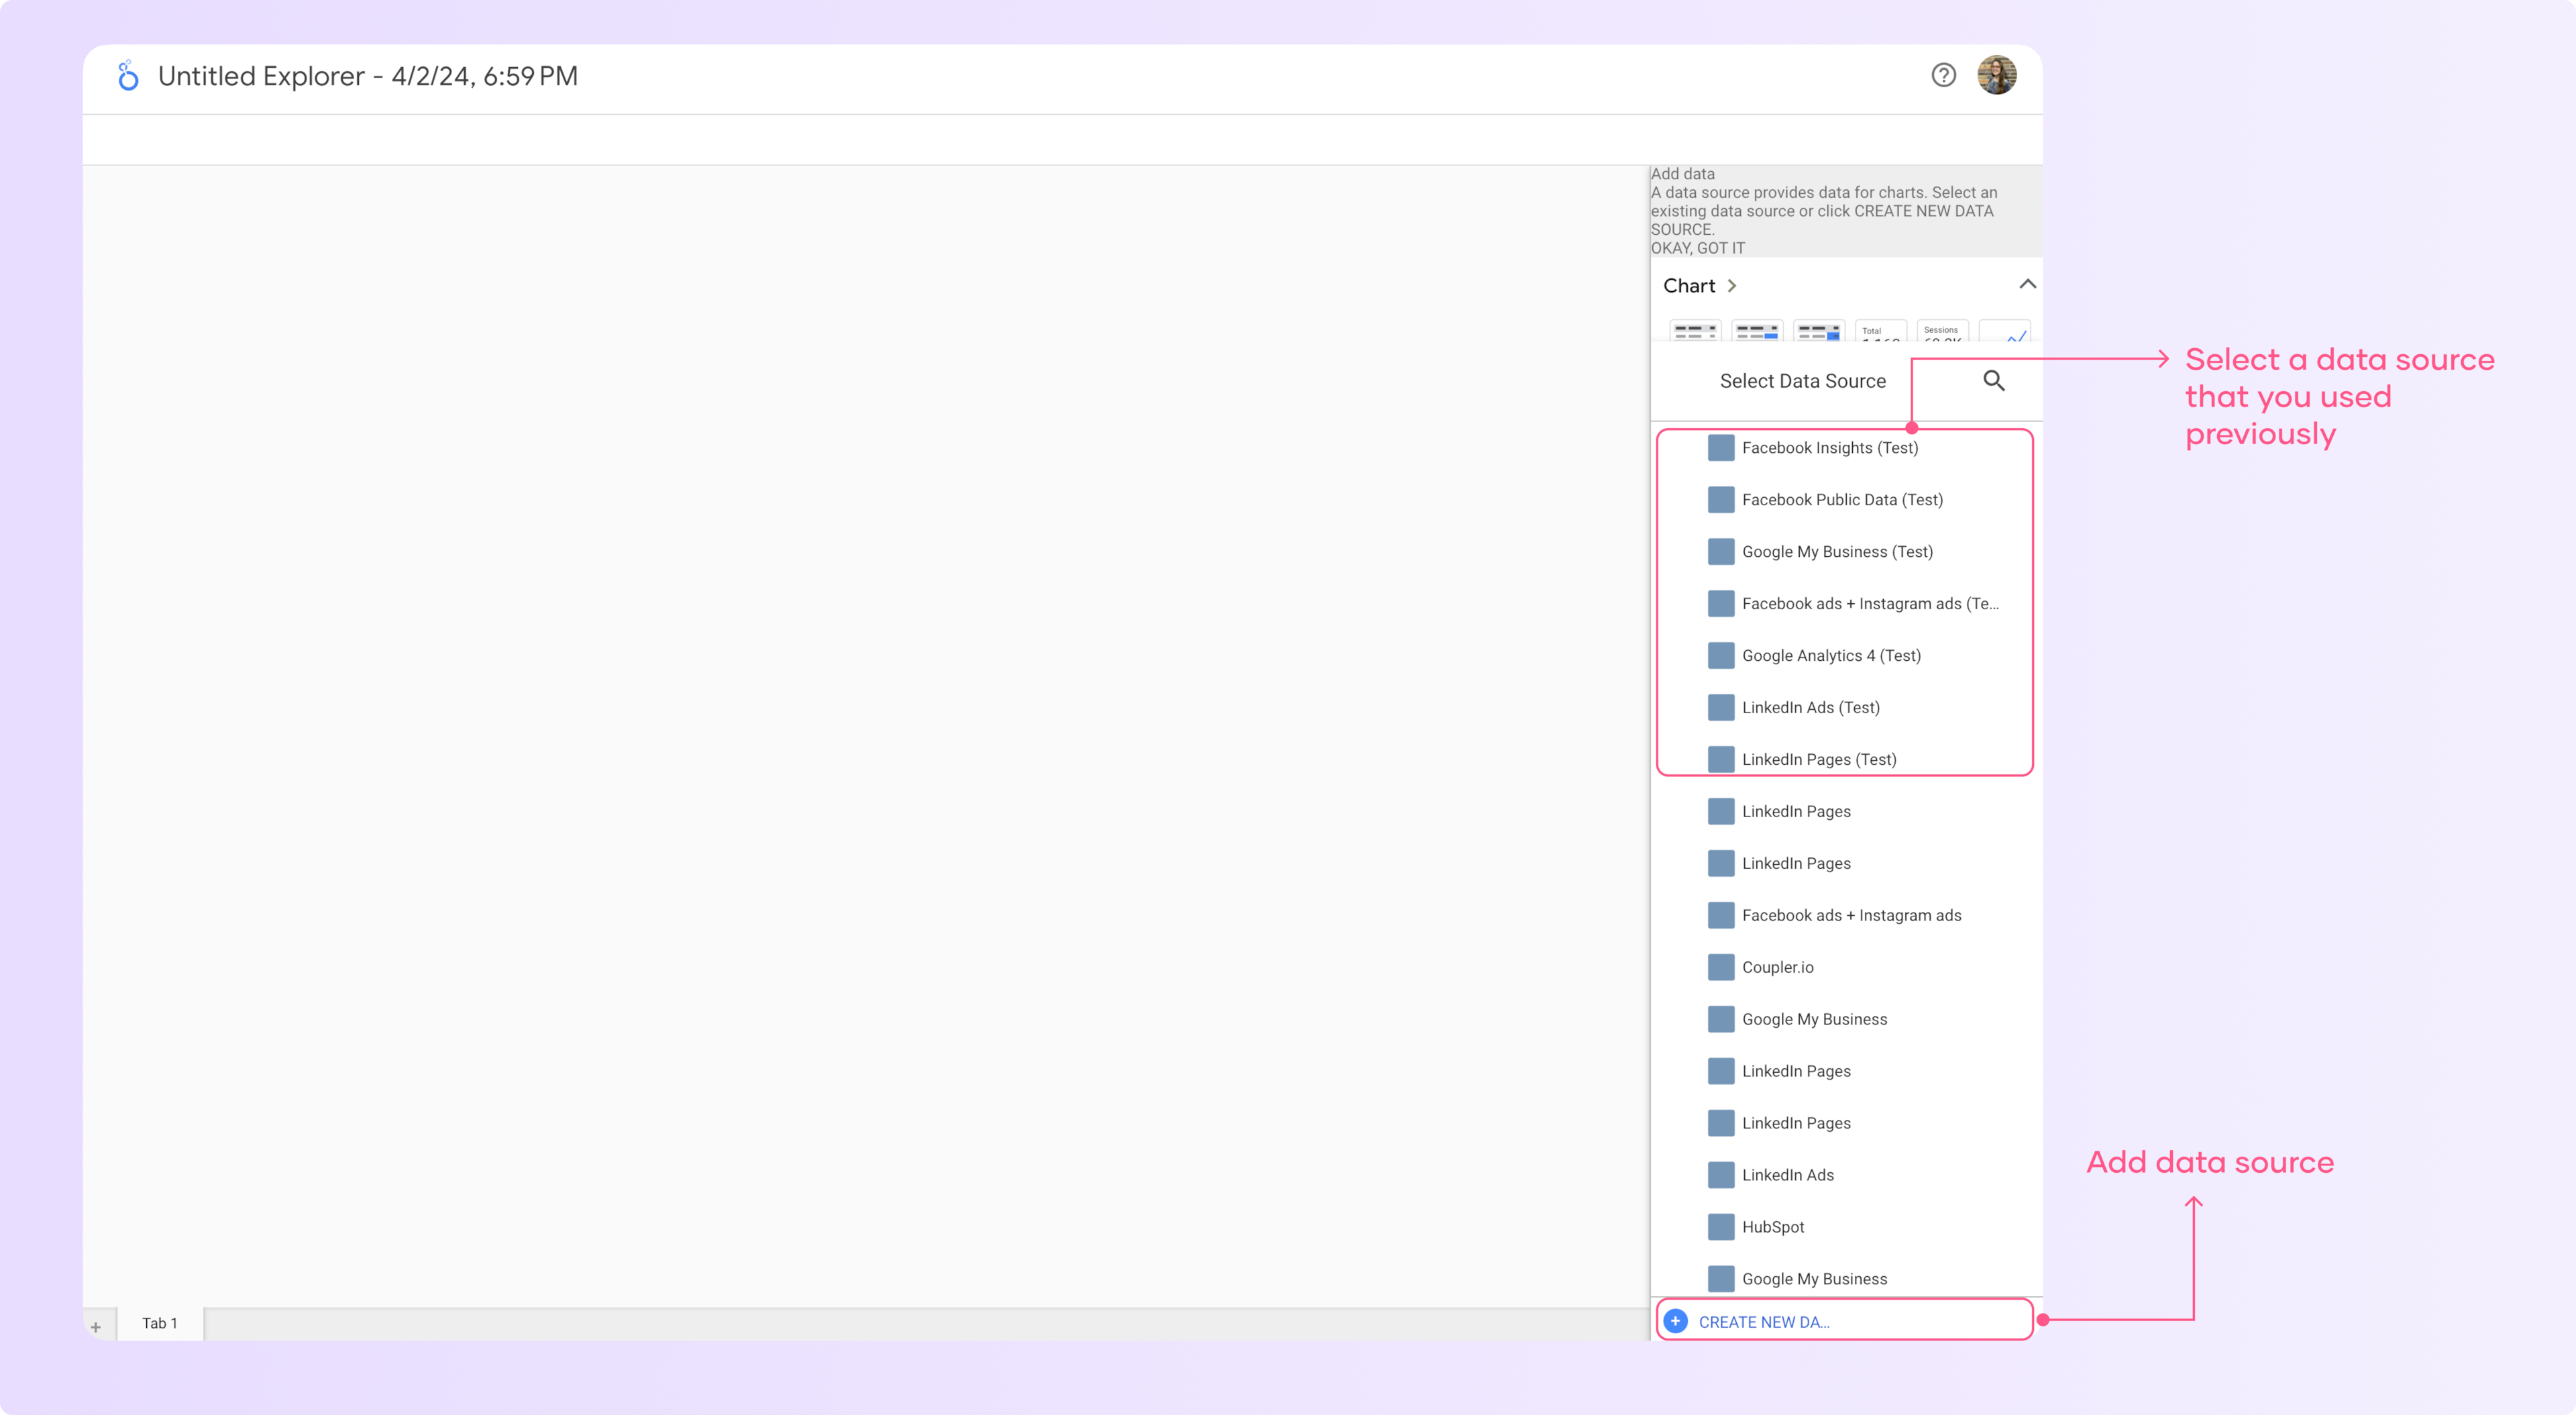
In the right panel, select a data source you have used previously or add a new data source to the explorer.
You can even play with sample data sets that Data Studio has available.
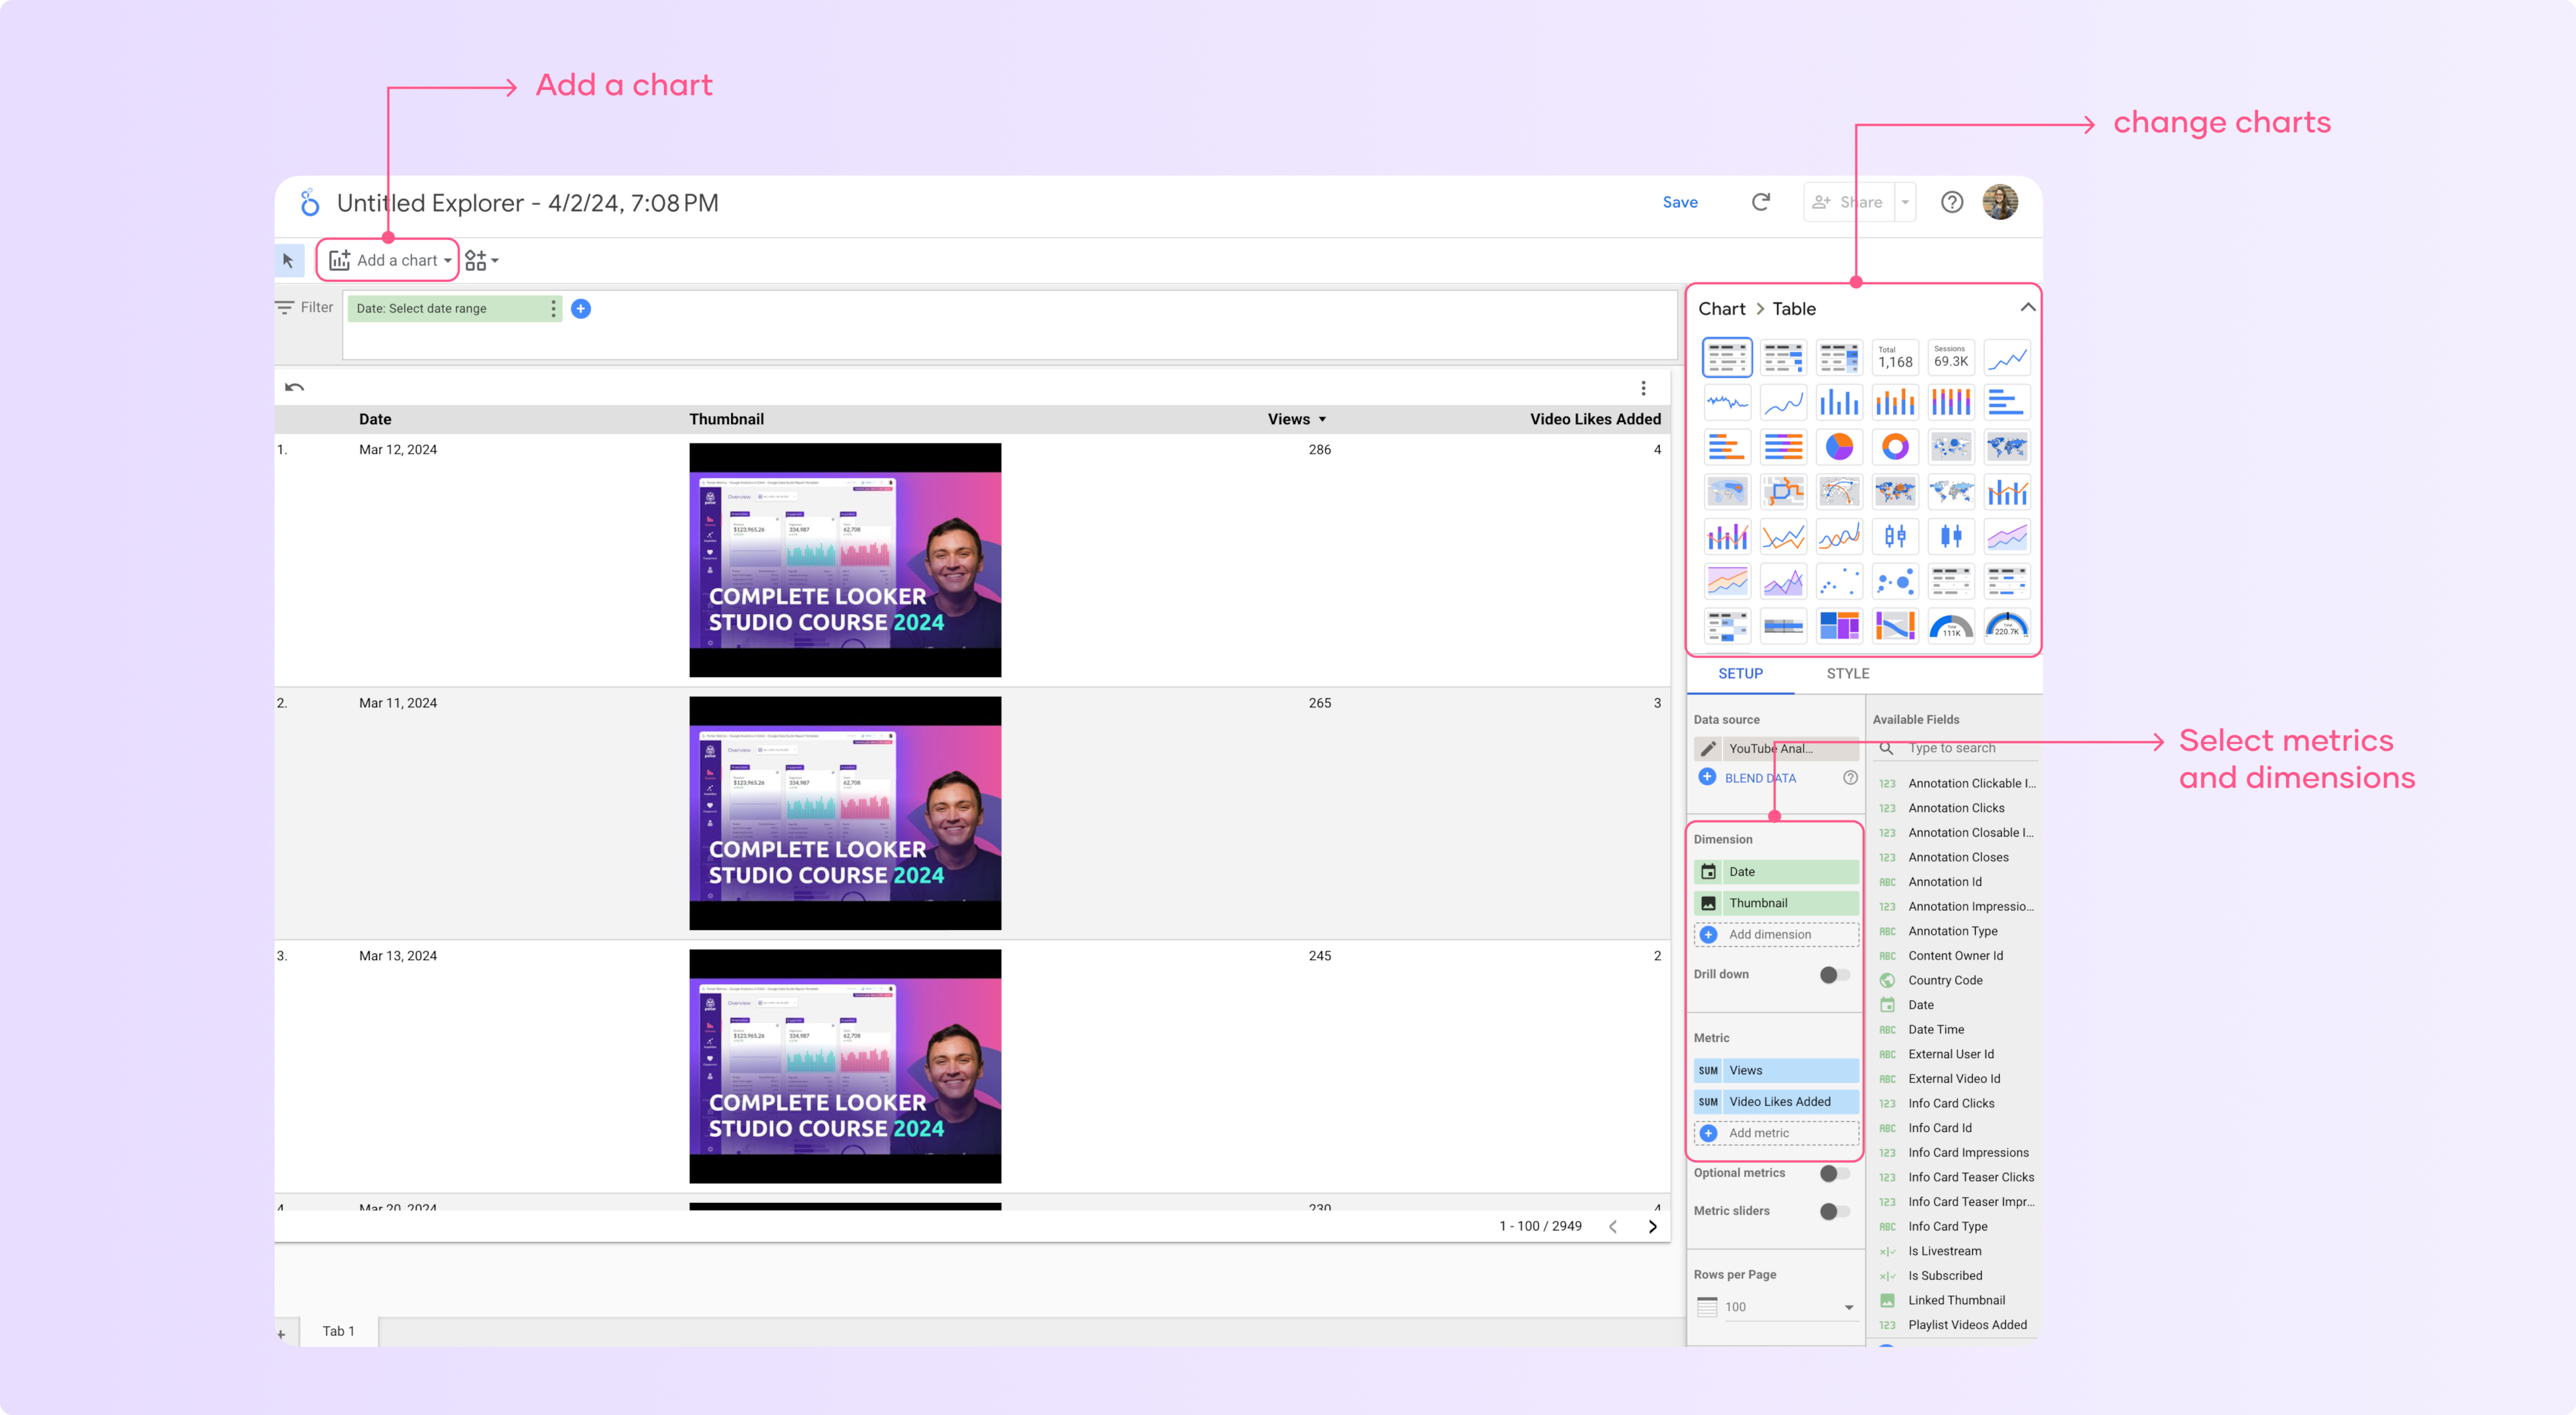
Now you can add charts and graphs at the top left corner and add the metrics and dimensions to identify trends and gain insights fast
Common errors when connecting data and how to fix them
There a three main errors I see related to connecting data sources to reports that cause error messages to appear. I will teach you how to solve these common Data Studio errors
Missing data source
This issue is usually caused by accidentally removing data sources from reports, to fix it:
Identify the chart displaying the error message and connect the chart to the appropriate data source.
If you copied a report you will have to authenticate your data to visualize it.
Unknown data source
This happens mostly with third-party connectors
Open the affected report in edit mode
Go to Resource – Manage added data sources
Disconnect and reconnect the problematic connector
If the issue persists, wait a few hours or days and try again
System errors
This was probably caused by you or someone else accidentally removing the connector used in the affected visualizations.
The solution is to select all the charts and add the new data source by replacing the previous one.
Sometimes Google Data Studio occasionally crashes for no apparent reason, which is not your fault.
That’s it! If you have additional errors and want help, we created a complete article about how to fix the common errors on Data Studio. So, if you are getting error messages and don’t know what to do, check it out.

