


Calculated fields enable you to create new metrics and dimensions from existing data, allowing you to create insightful reports based on your use case and specific data sources.
The result? More insightful analysis and better decision-making with the help of chart-level calculated fields.
In this tutorial, you will learn how to create custom fields, formulas, and practical applications.
You can also see our step-by-step video:
Key Takeaways
Calculated fields in Data Studio (formerly Looker Studio) allow users to create custom metrics and dimensions through the manipulation of existing data using arithmetic and logical functions.
Users can create calculated fields by defining a formula based on existing metrics and dimensions and can manage these fields by updating or editing them within the Data Studio’s field editors.
Two types of calculated fields exist in Data Studio: Data Source Calculated Fields for broad use across multiple reports, and Chart-Level Calculated Fields for specific, one-off calculations within a single chart.
Understanding Calculated Fields in Data Studio
What are calculated fields?
Calculated fields allow you to create your own metrics and dimensions using operators (+, -, /,*) and act formulas, transforming existing data into new metrics and dimensions.
You can add arithmetic and mathematical formulas to divide, multiply, add, or subtract two or more fields, manipulate text, date, and geographic information, and use branching logic to evaluate your data and deliver a variety of results.
Differentiating Between Data Source and Chart-Level Calculated Fields
Calculated fields are not all created equal. In Data Studio, there are two types: Data Source Calculated Fields and Chart-Specific Calculated Fields. Understanding the differences between these two types and when to use each one is crucial to managing your data effectively.
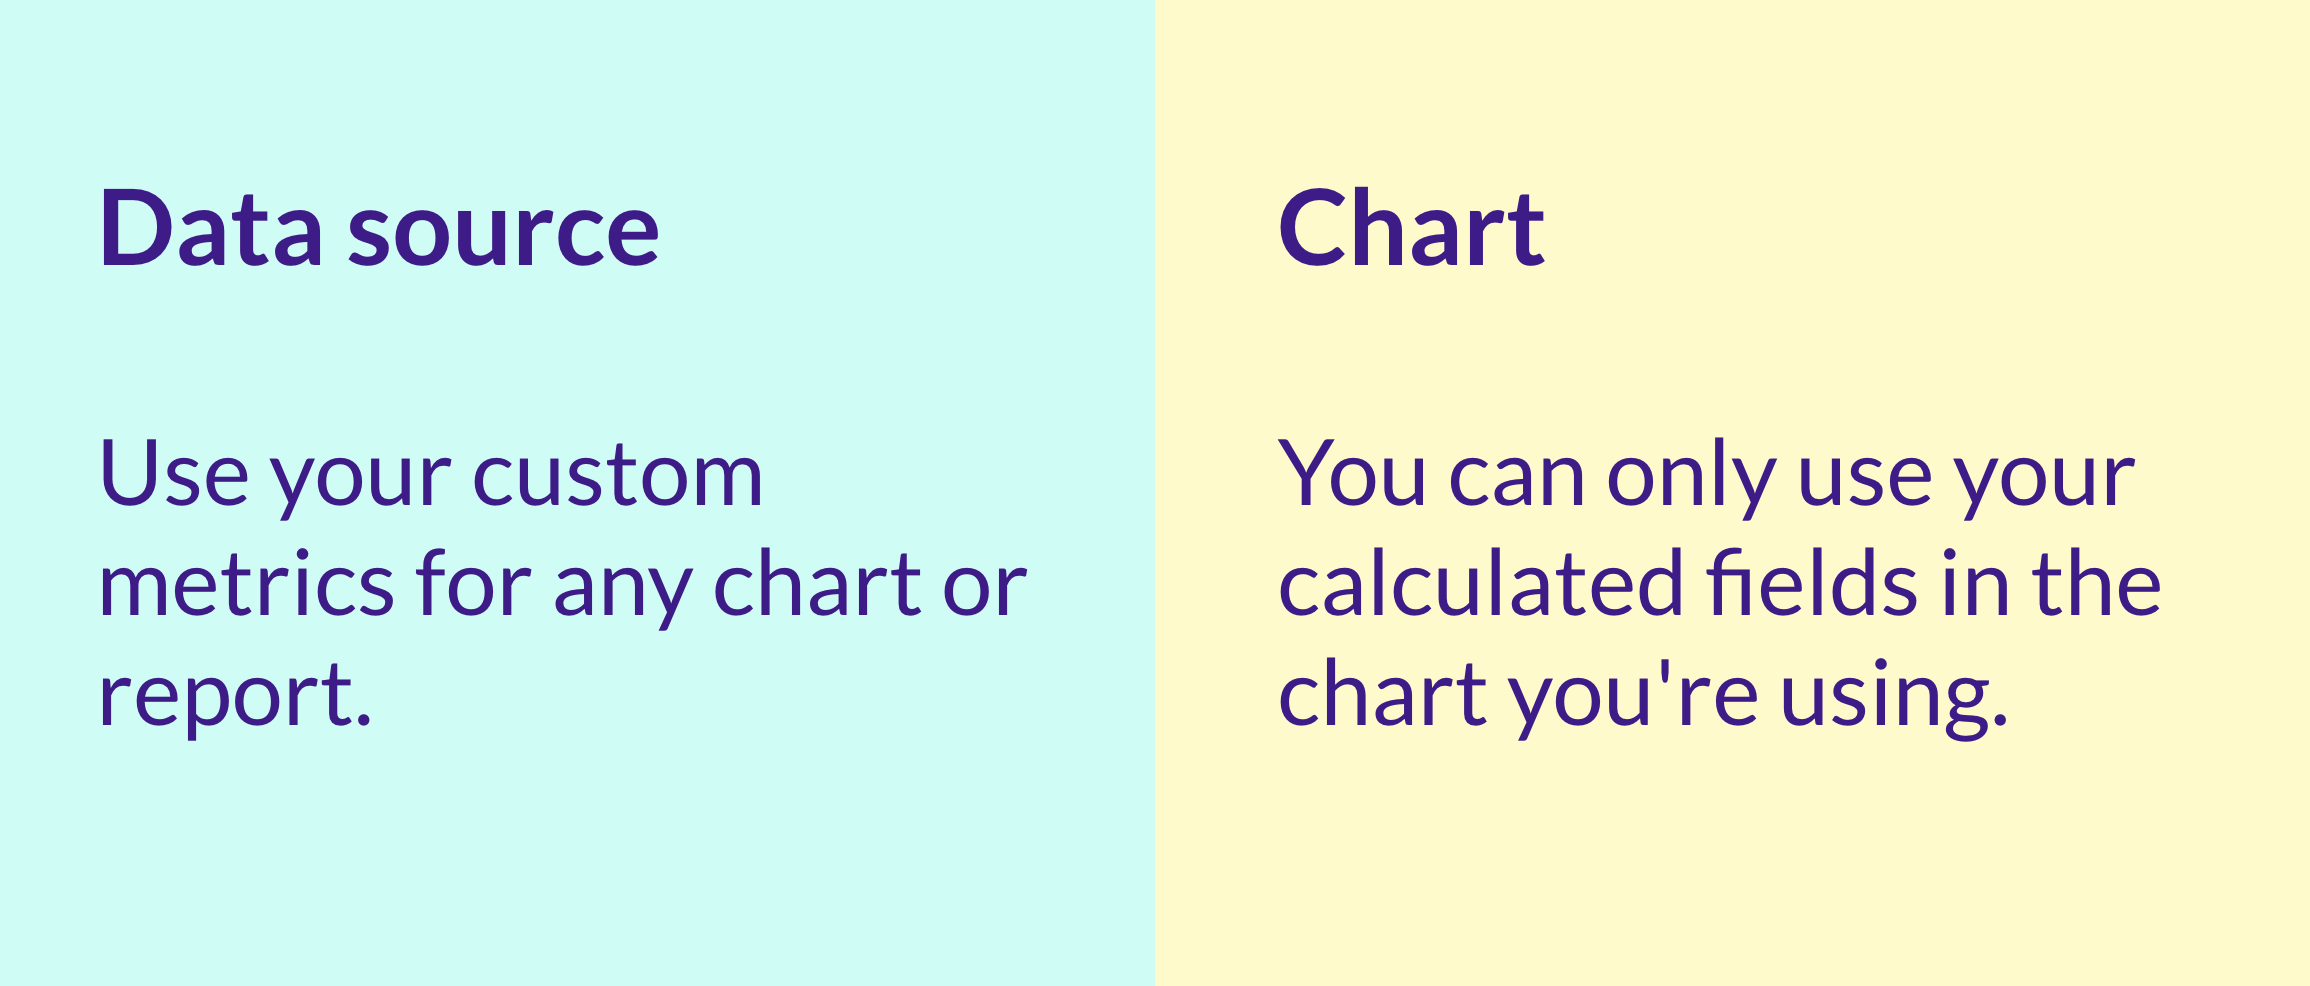
When to Use Data Source Calculated Fields
Data source calculated fields are like the reusable shopping bags of data analysis. They can be used across multiple reports that use the same data source, such as a search console data source, and treated like regular fields for filtering purposes. However, they are not compatible with blended data and cannot be used when blending data from multiple sources.
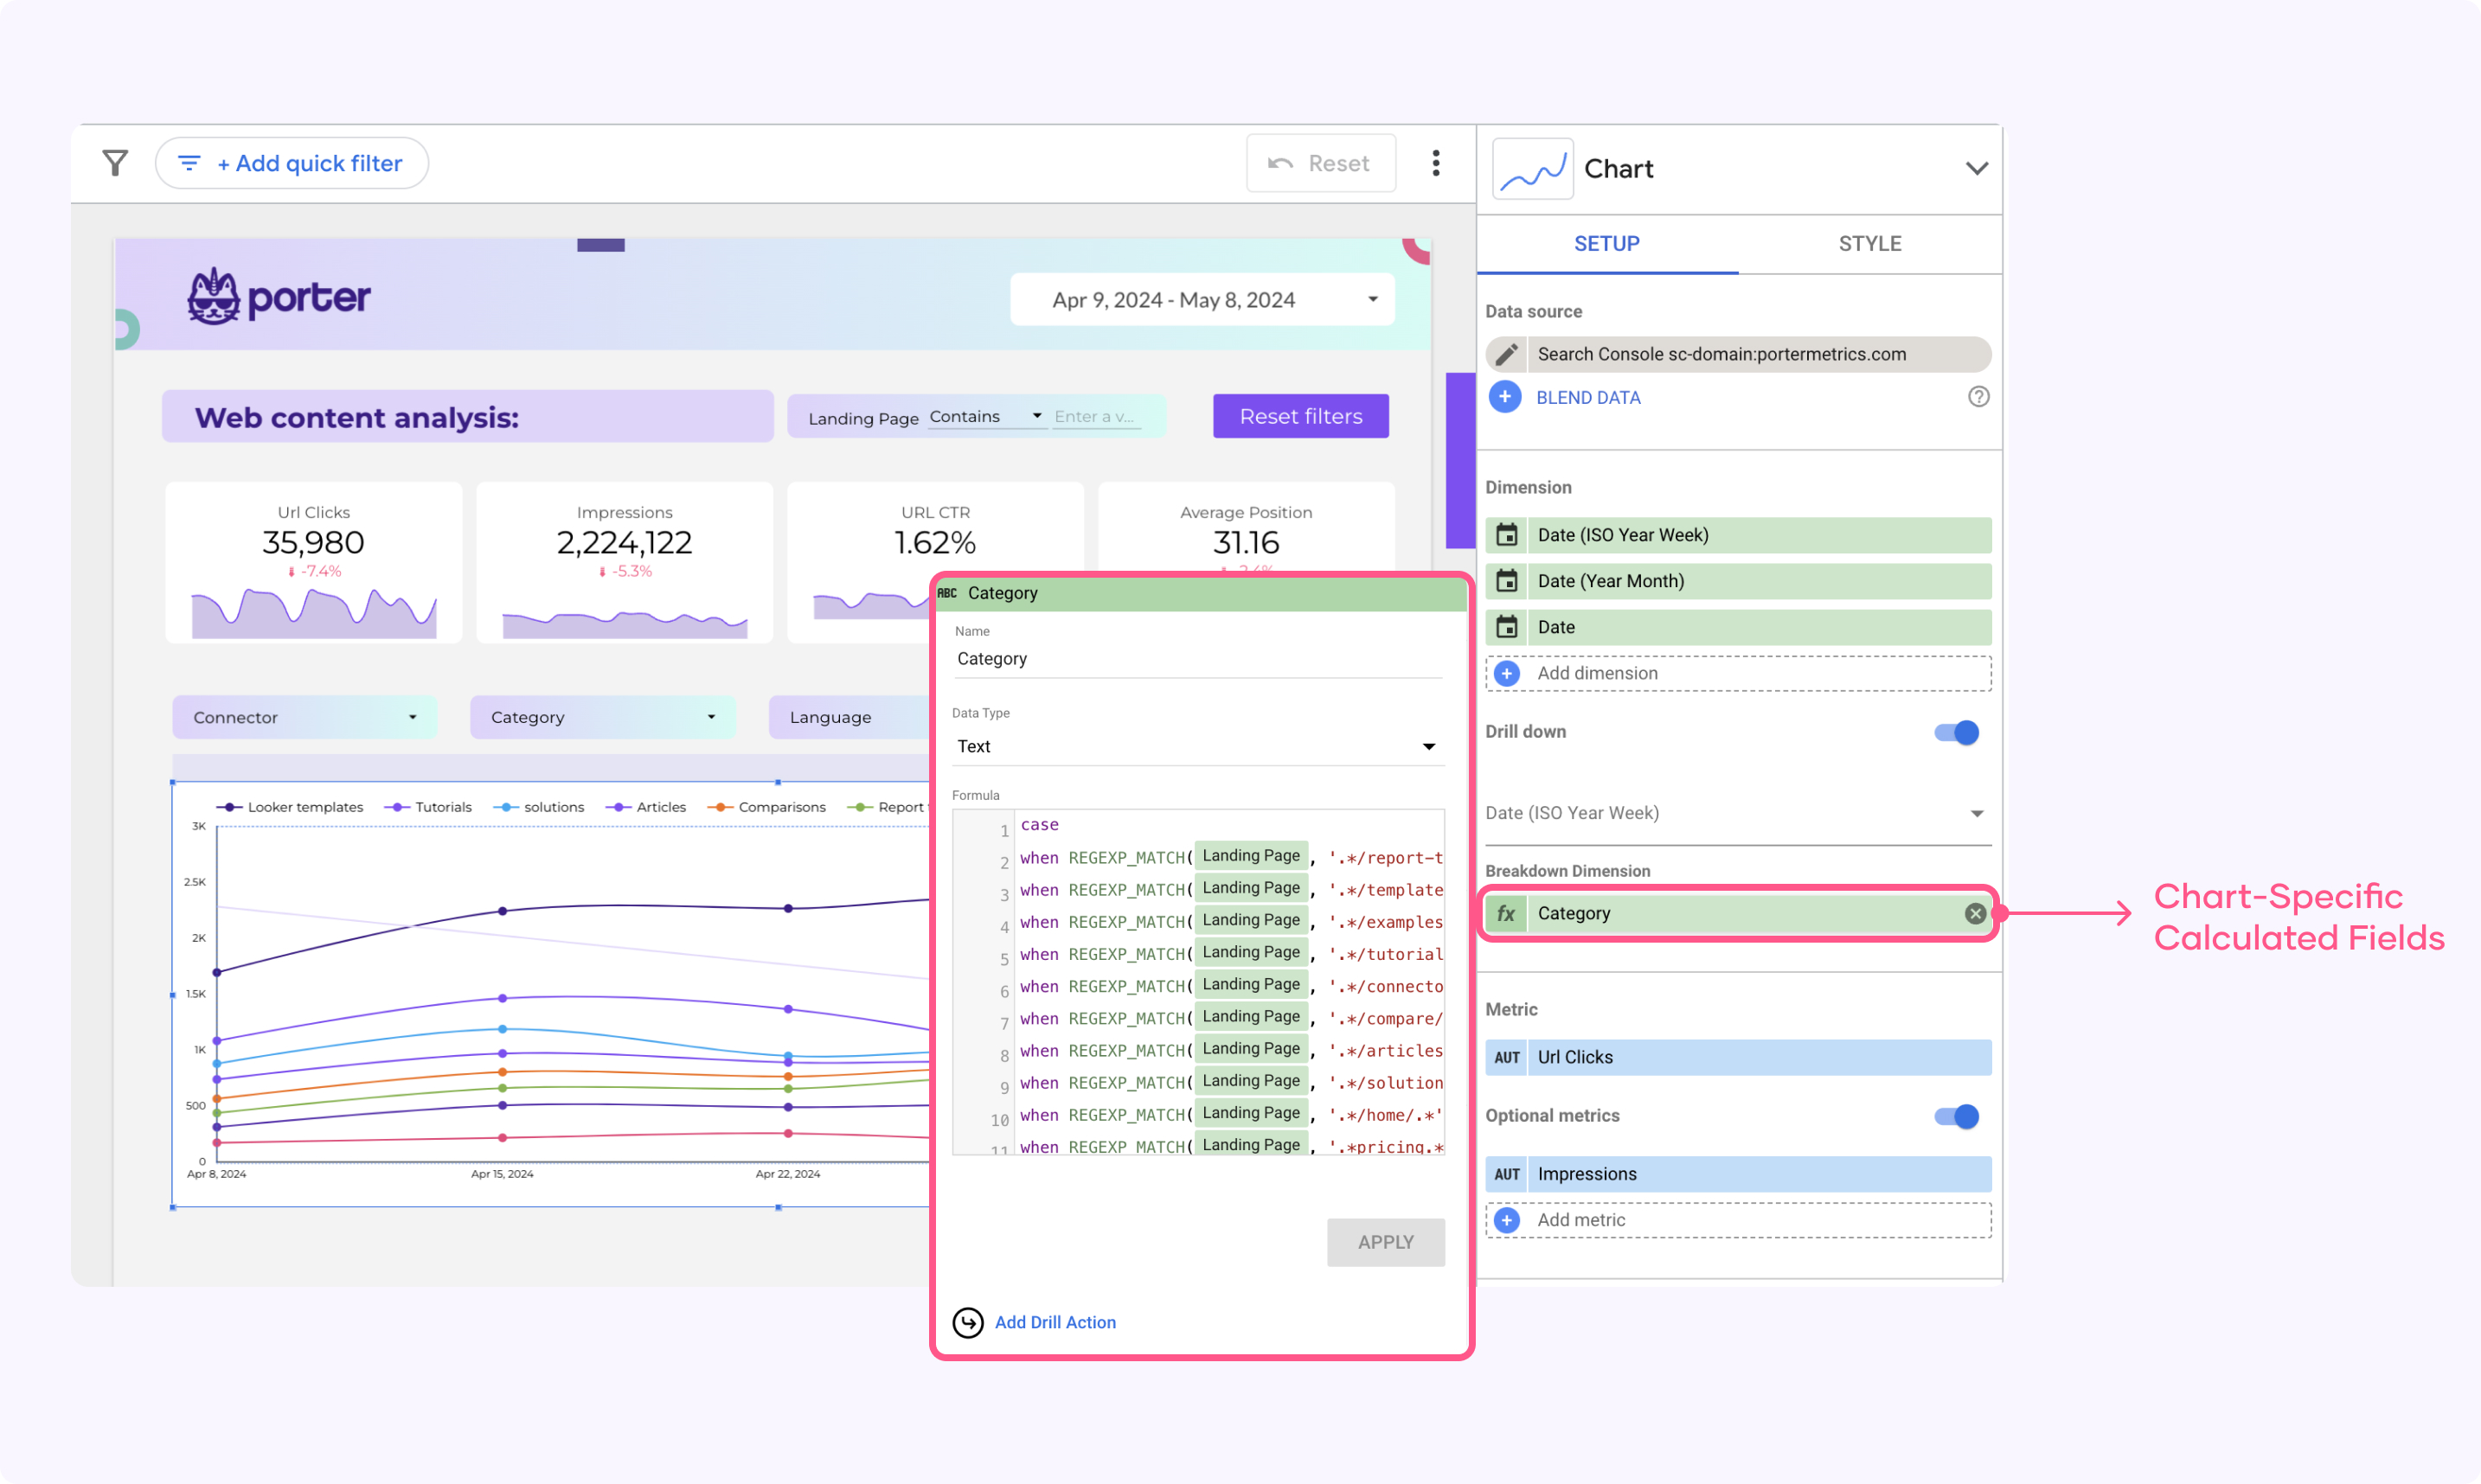
When to Use Chart-Specific Calculated Fields
Chart-specific calculated fields, on the other hand, are for one-time use only. They are used for one-off calculations within a single chart and cannot be reused in multiple reports or charts. However, a chart specific calculated dimension can be utilized to further enhance the data representation in these charts.
These fields can include data from blended data sources, allowing for more complex data analysis in Data Studio.
Step-by-Step Guide to Creating Calculated Fields Data Source Level
If you want to create a calculated field, you can reutilize it later on different charts; you should do it at the data source level. This is my go-to alternative when I plan to use that field in different charts.
Remember you need to add a data source to your report in which you are the owner to be able to edit it. In this example, I’m using Porter Metrics Facebook Ads connector for Data Studio, which brings all the fields from the API and all your custom conversions.
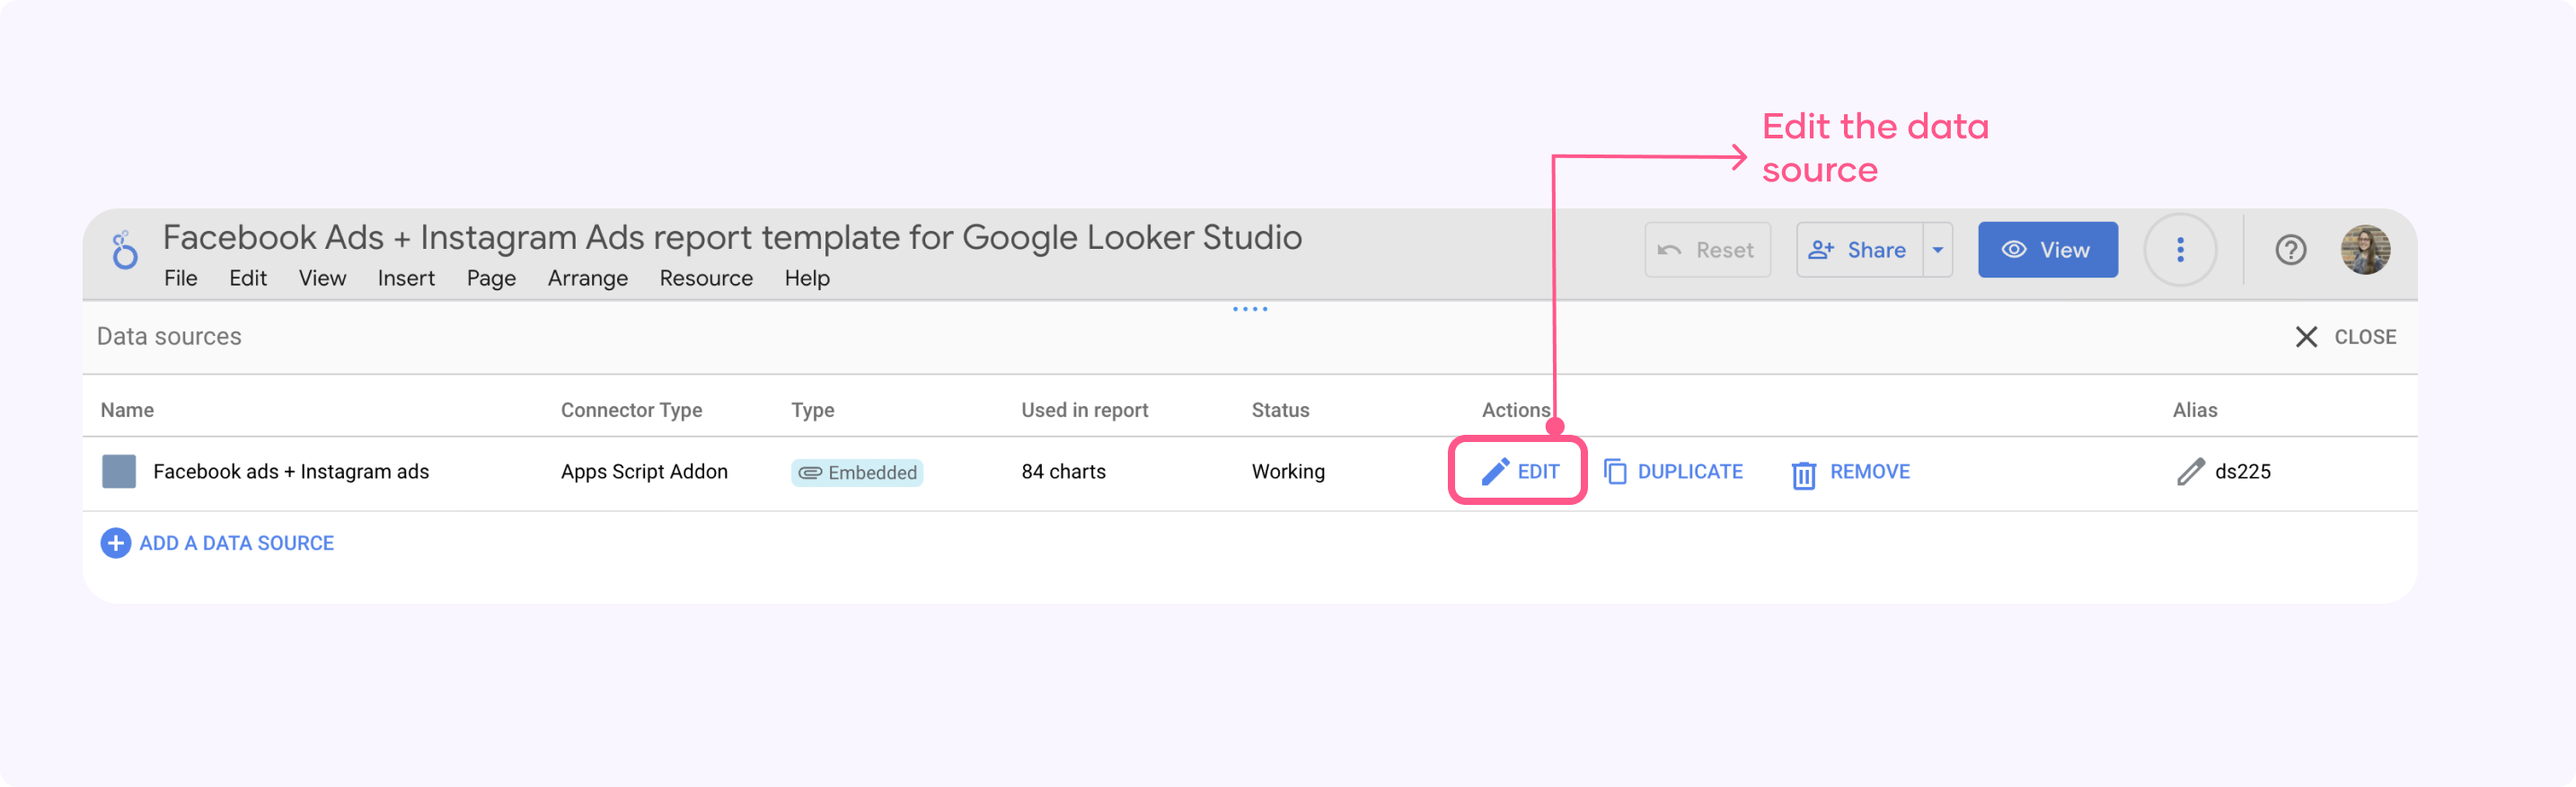
Step 1: Accessing the Field Editor
On your Data Studio report, click on ‘Resource,’ then select ‘Manage added data sources, ‘ and click on ‘Edit’ in the data source where you want to add the custom field tab.
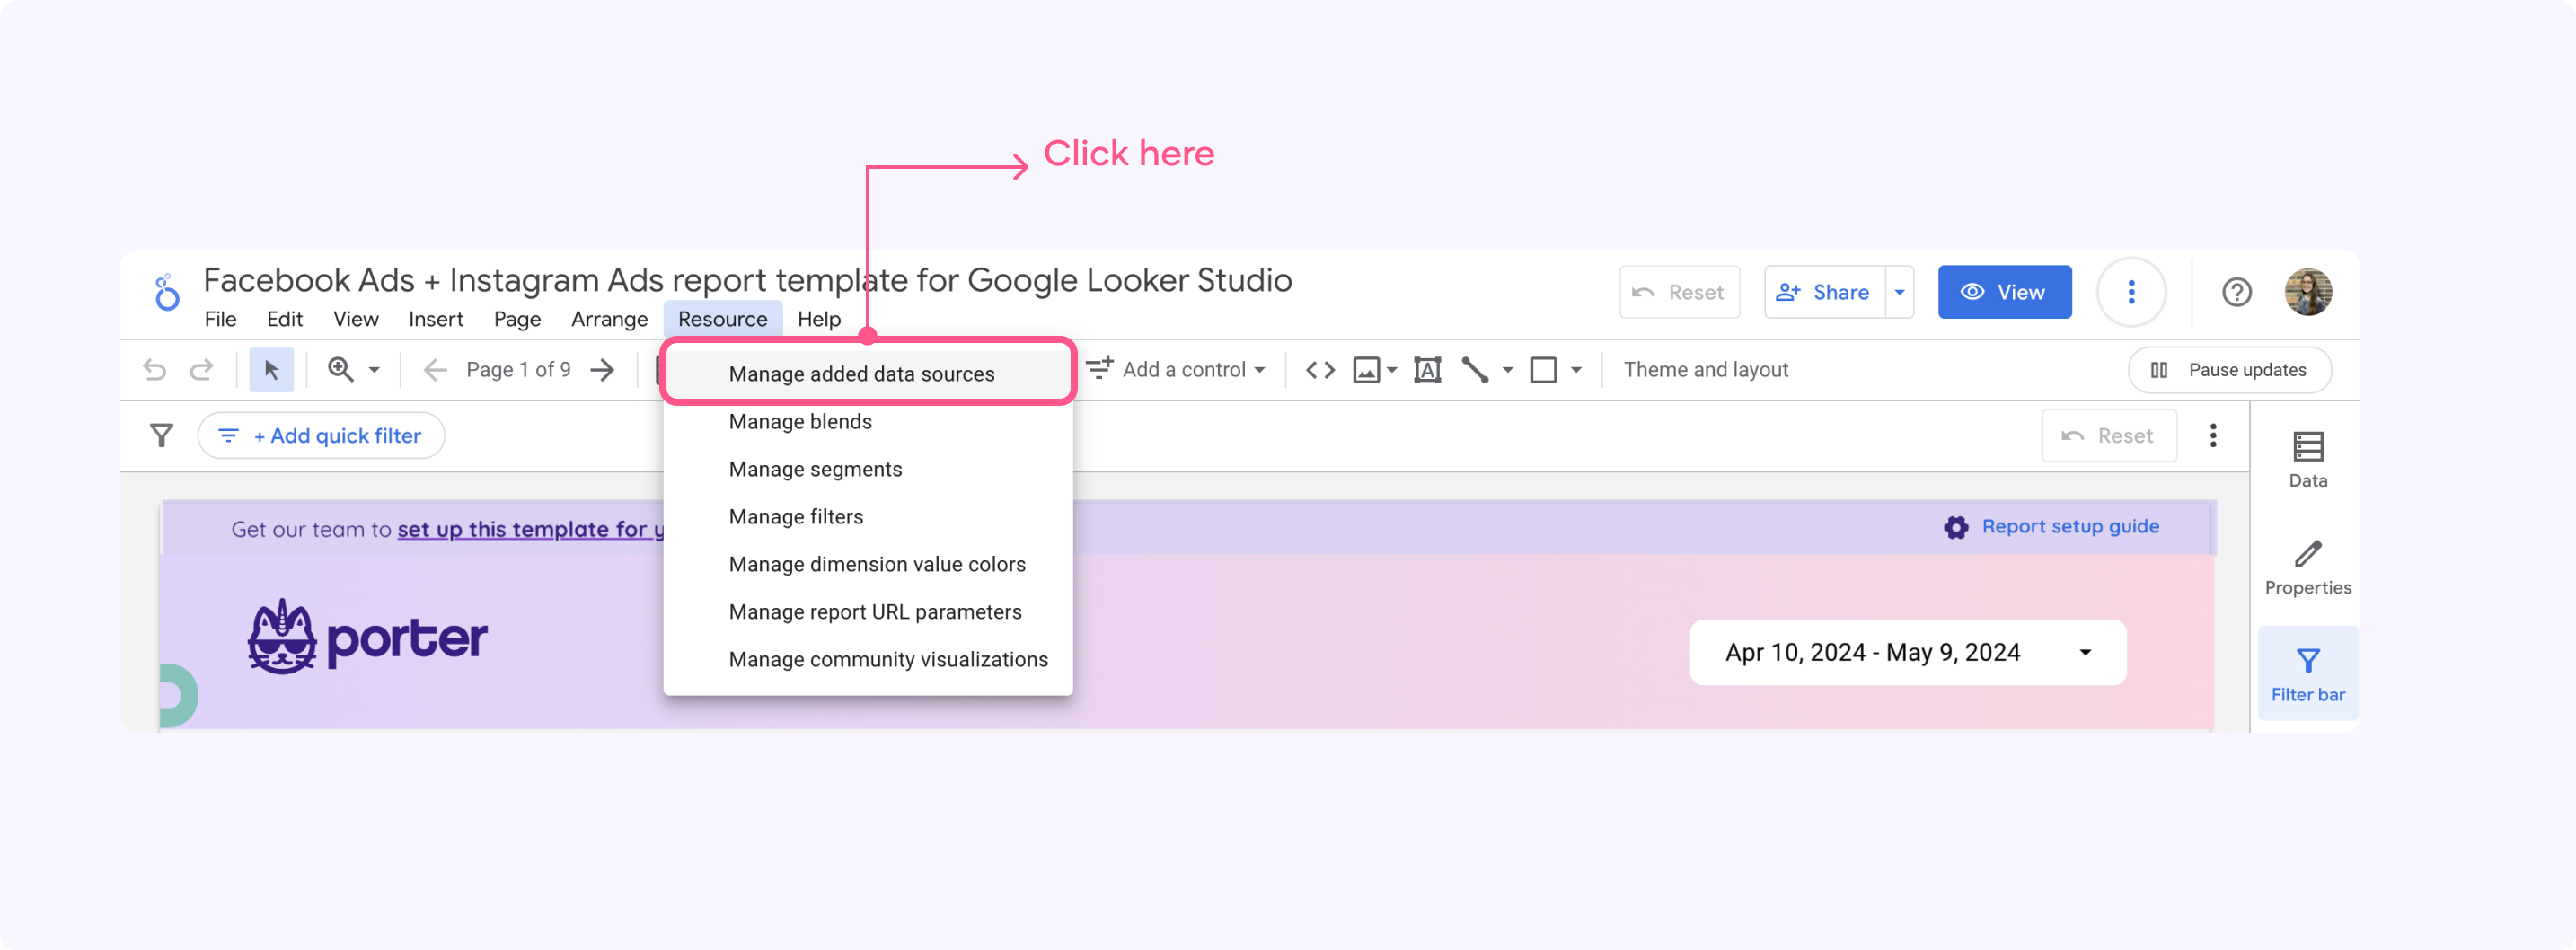
Now click on ‘Edit’
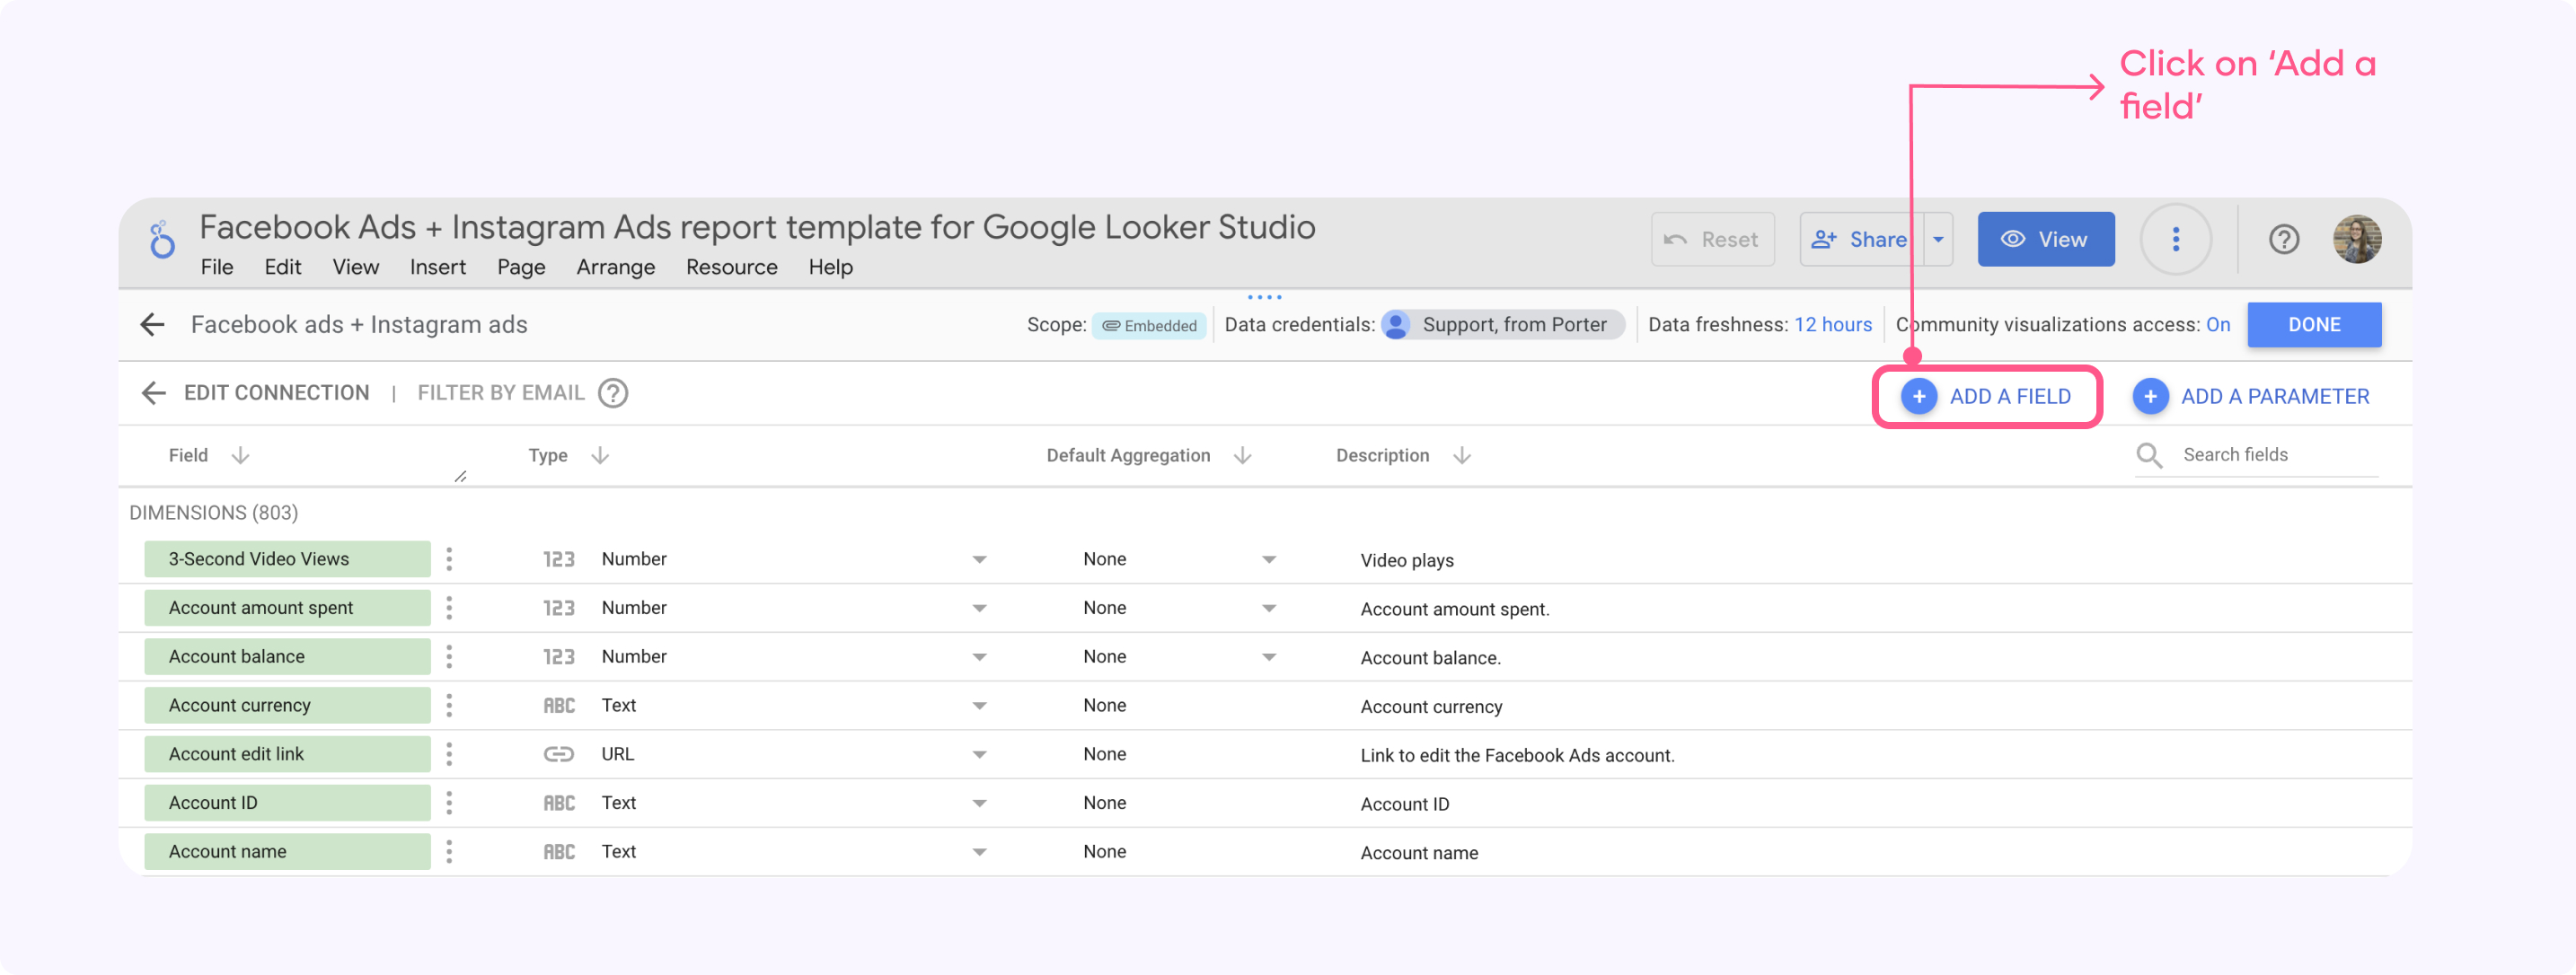
Once in the data source fields panel, you can create a new calculated field by clicking ‘ADD A FIELD’ and then select ‘Add a calculated field’, which opens the calculated field editor for inputting your formula.
Step 2: Writing Your First Calculated Field Formula
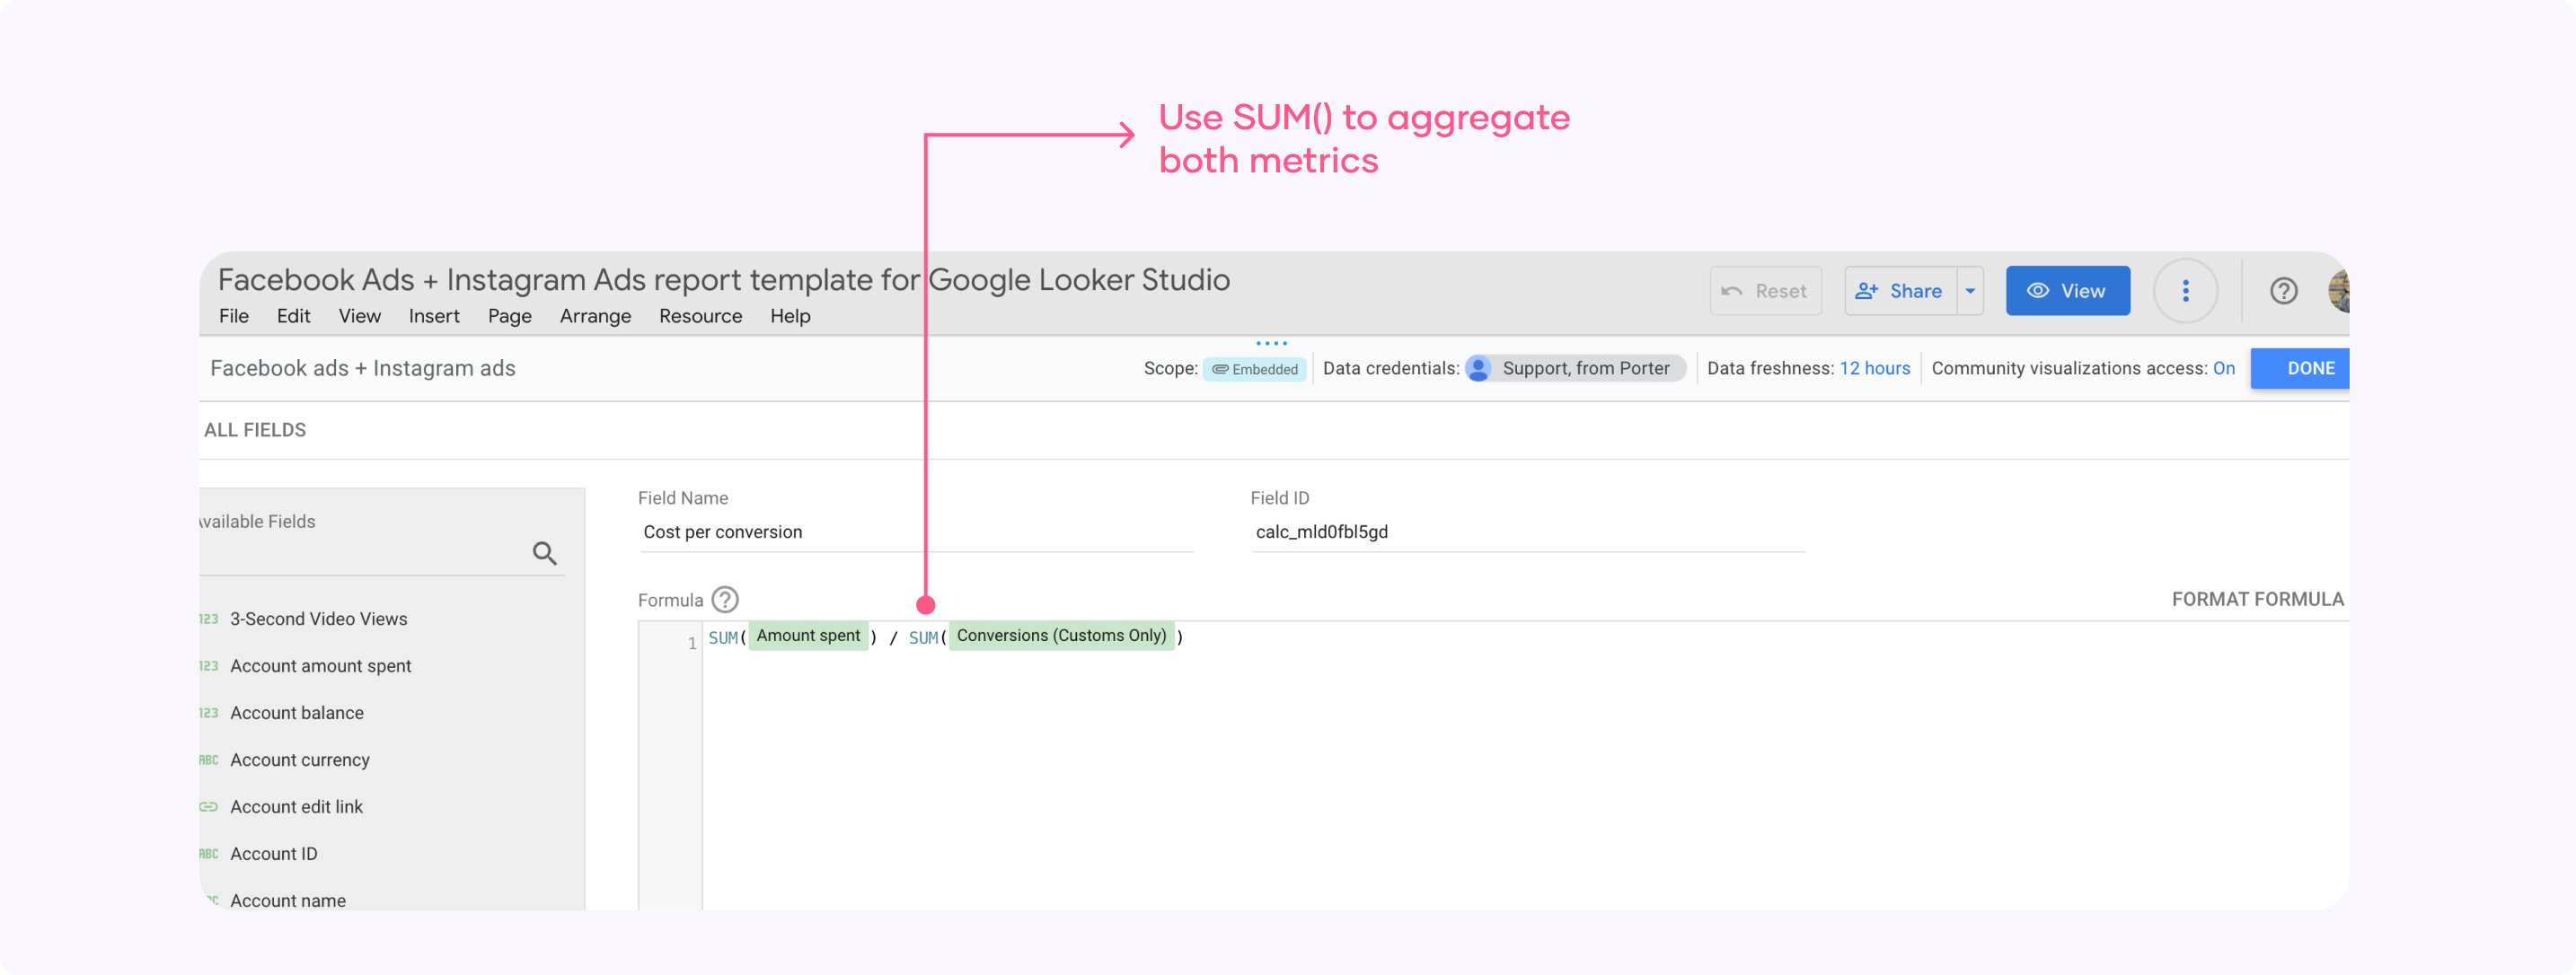
Now that you can add any formula, I recommend that you read the Google Documentation (that’s what I do). In this example, I’m going to calculate Facebook Ads cost per conversion using a calculated field.
To do it, I’ll divide ‘Amount spent’ and ‘Custom conversions,’ but first, you have to aggregate each metric by adding a SUM() to each field.
The final formula will be SUM(Amount spent) / SUM(Conversions (Customs Only))
Once you’ve developed your formula, the next step is to ‘add a field name’ and and save your calculated field by clicking ‘done’ on the right corner.
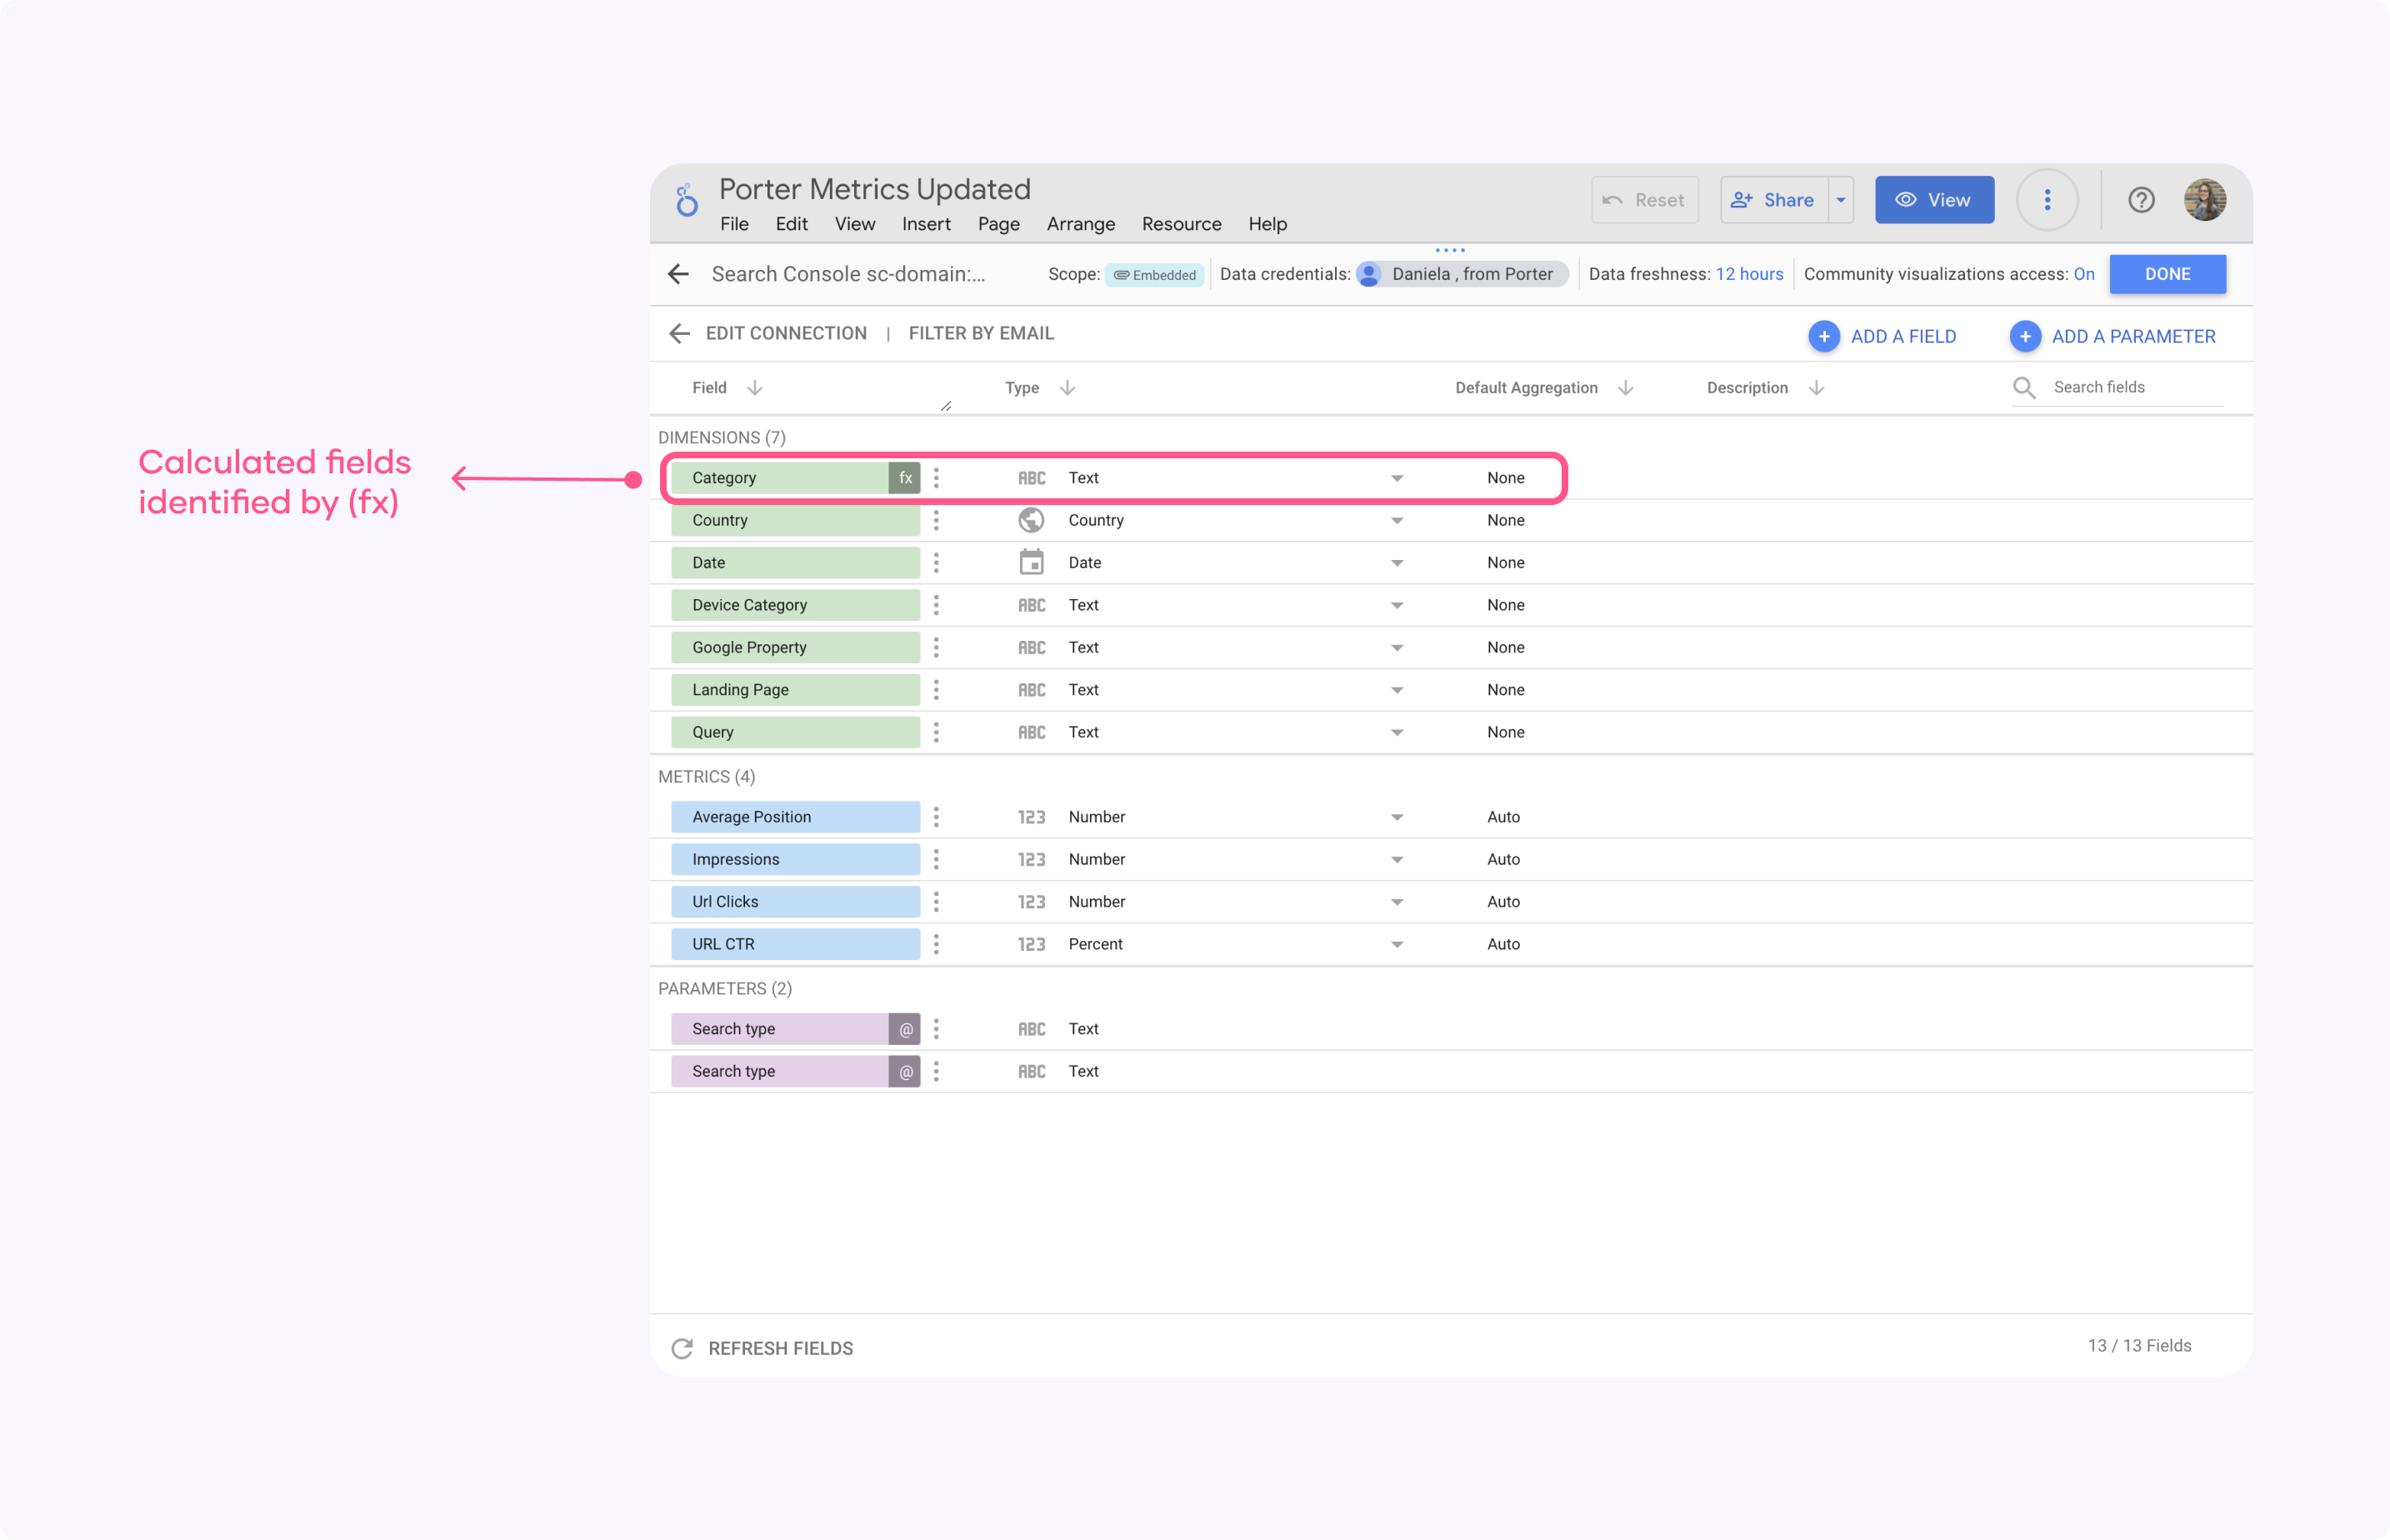
Now your calculated list will appear in the data source fields list, you can identify it because you’ll see the ‘fx’ next to the field name
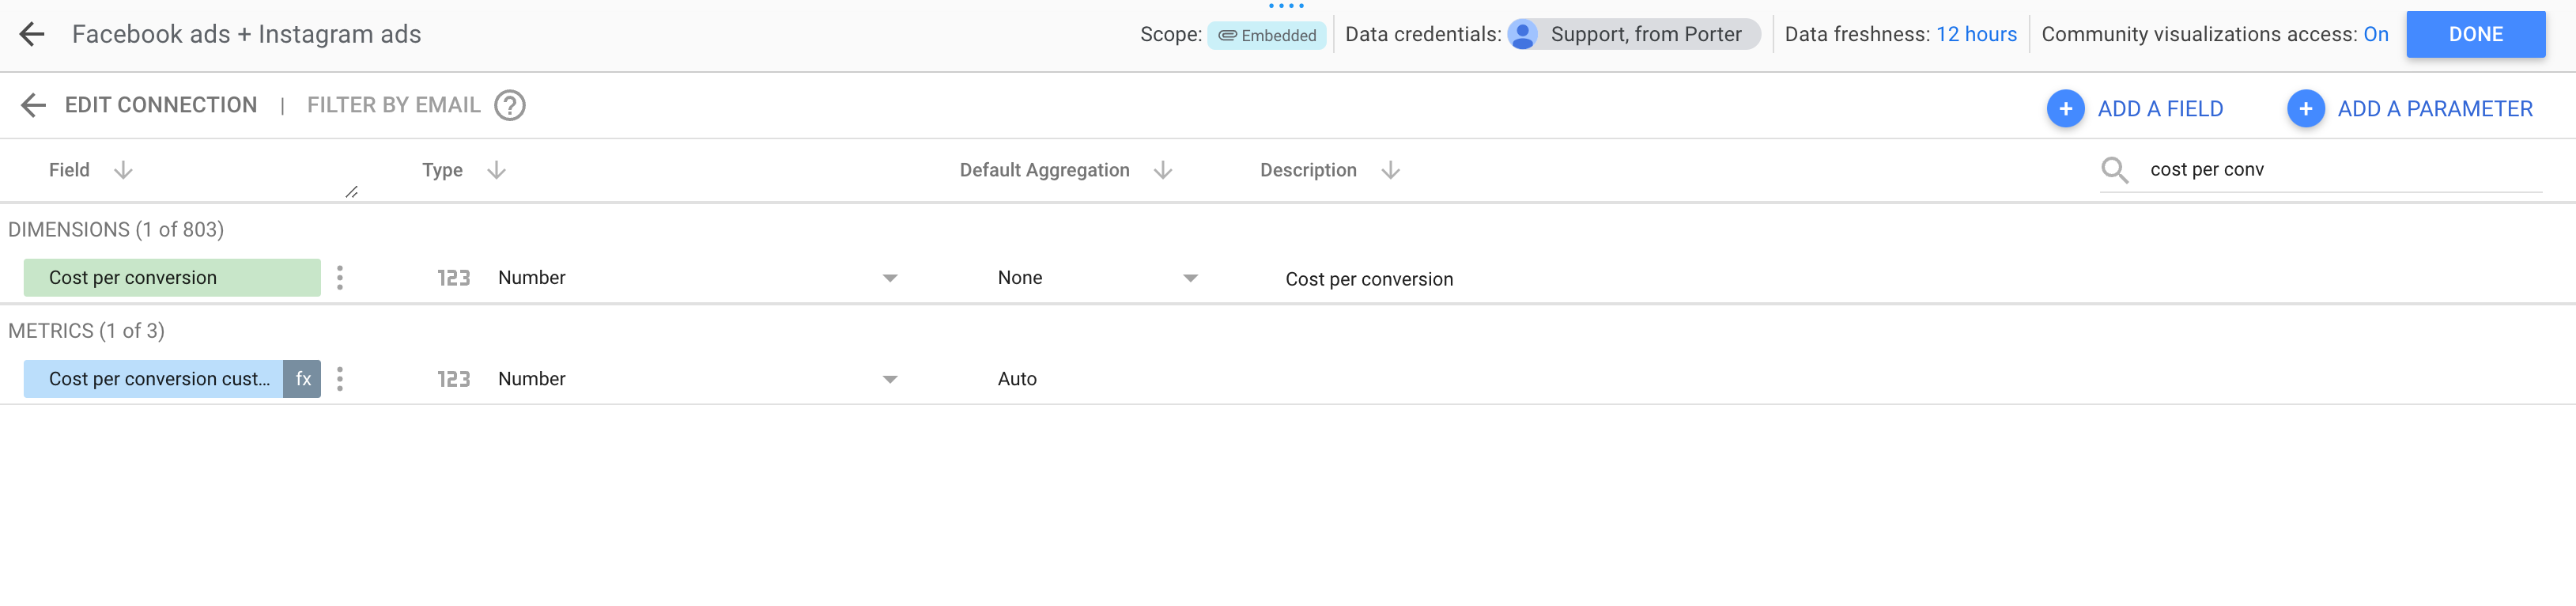
Remember, the newly created calculated field can be added to a report alongside the standard metrics and dimensions. Save your changes to ensure your calculated field is available for future use.
Step 3: Editing Your Calculated Field
You can edit your newly calculated field and even edit the field type. To do it, click on the current field type in this case ‘number’
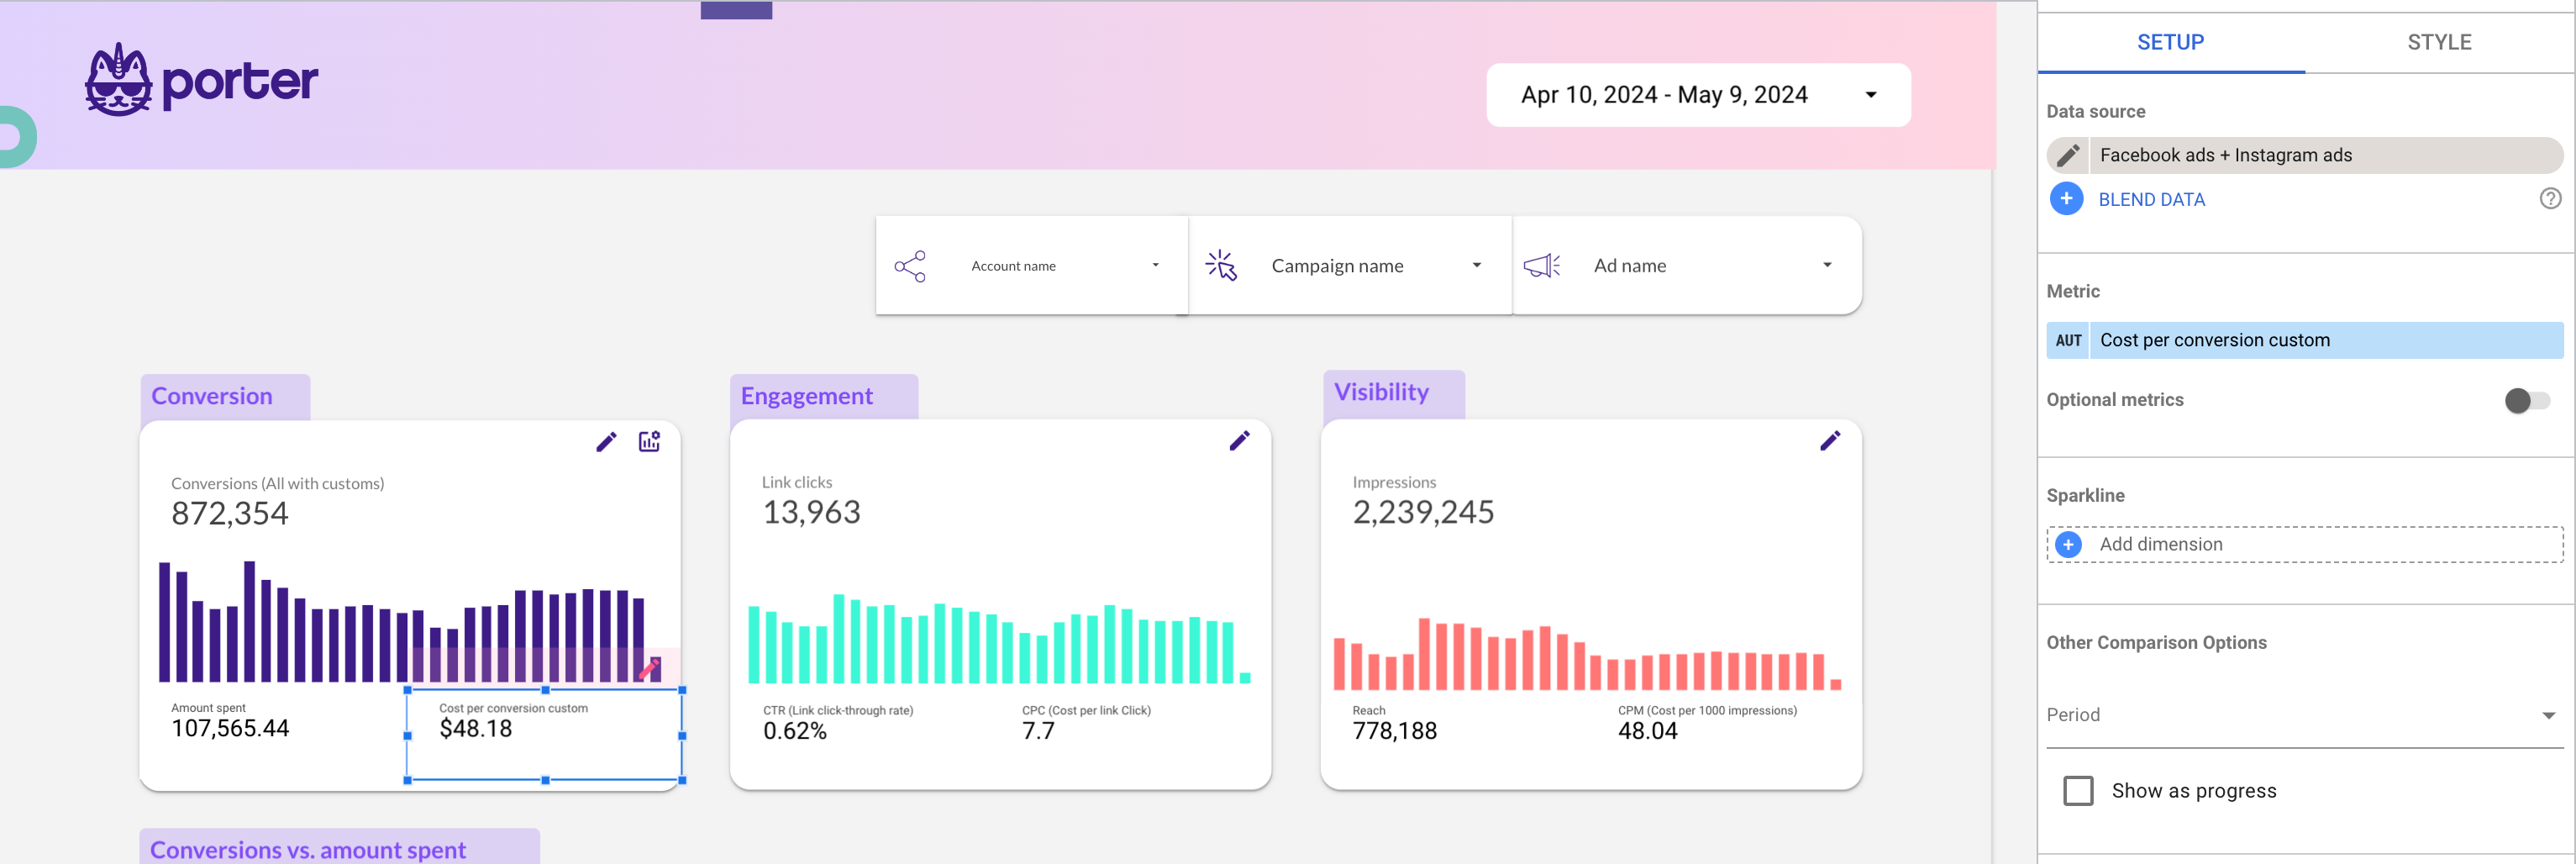
My metric is the cost per conversion and my result should be expressed in a currency. That’s why I’m going to click ‘Currency’ and then ‘USD – US Dollar ($)’
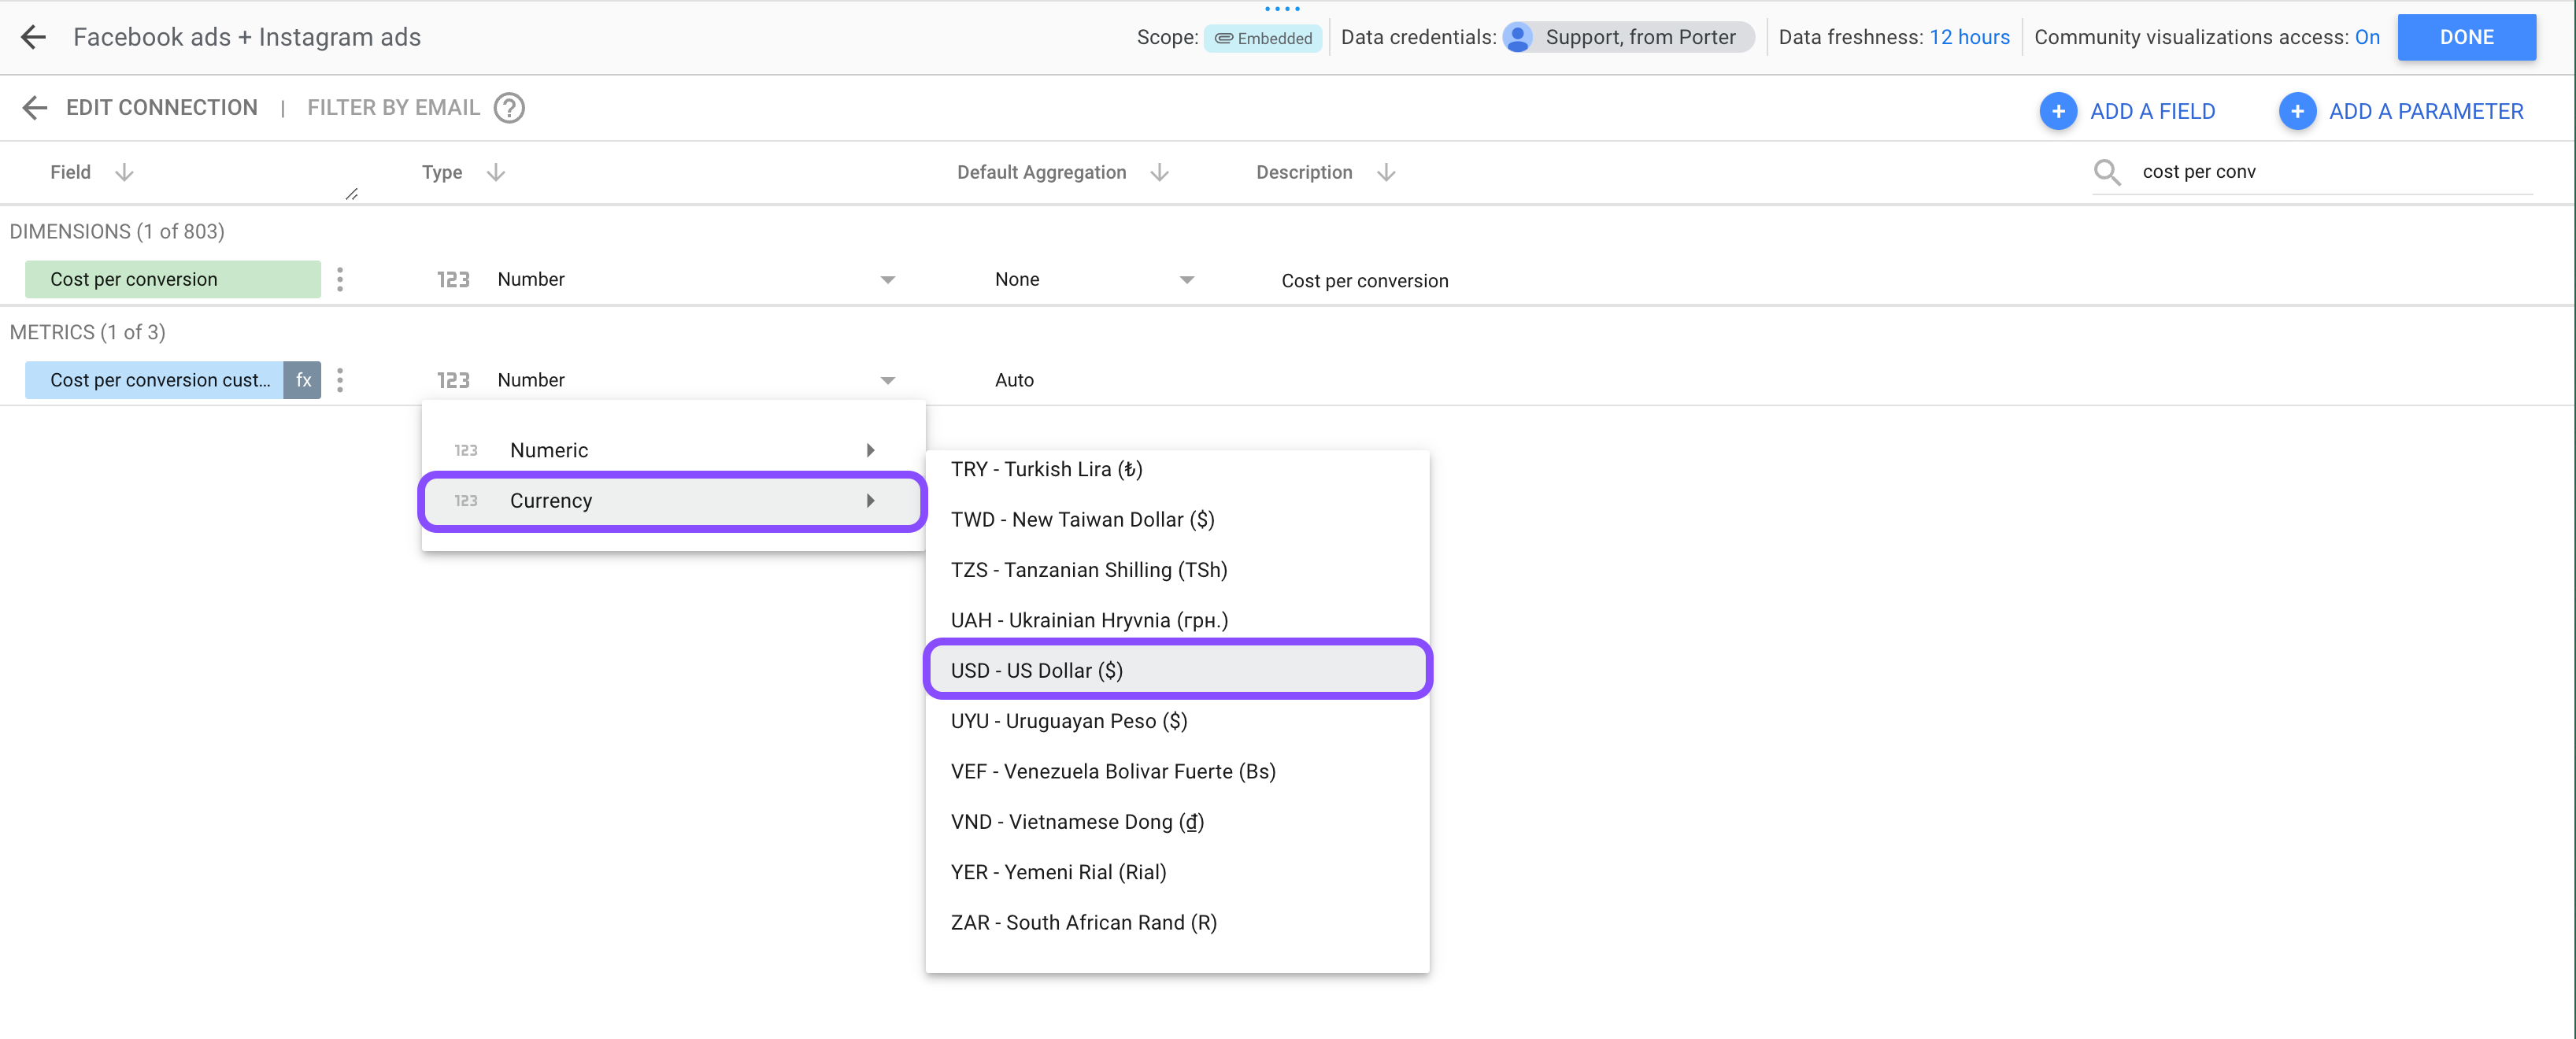
Now, my cost per conversion will be expressed in currency instead of just a number.
Step-by-Step Guide to Creating Calculated Fields chart-level
Creating a calculated field chart level is the same as creating it at a data source level in terms of writing the formula; the only difference is that first, you need a chart and then add the specific field.
In this case, I’ll create a calculated field to compare goals vs. actual results. In this case, I’ll measure the ‘Amount spent’ vs. a limit
To do it I’ll add a scorecard I’ll click on the metric and then click on ‘+Create field’
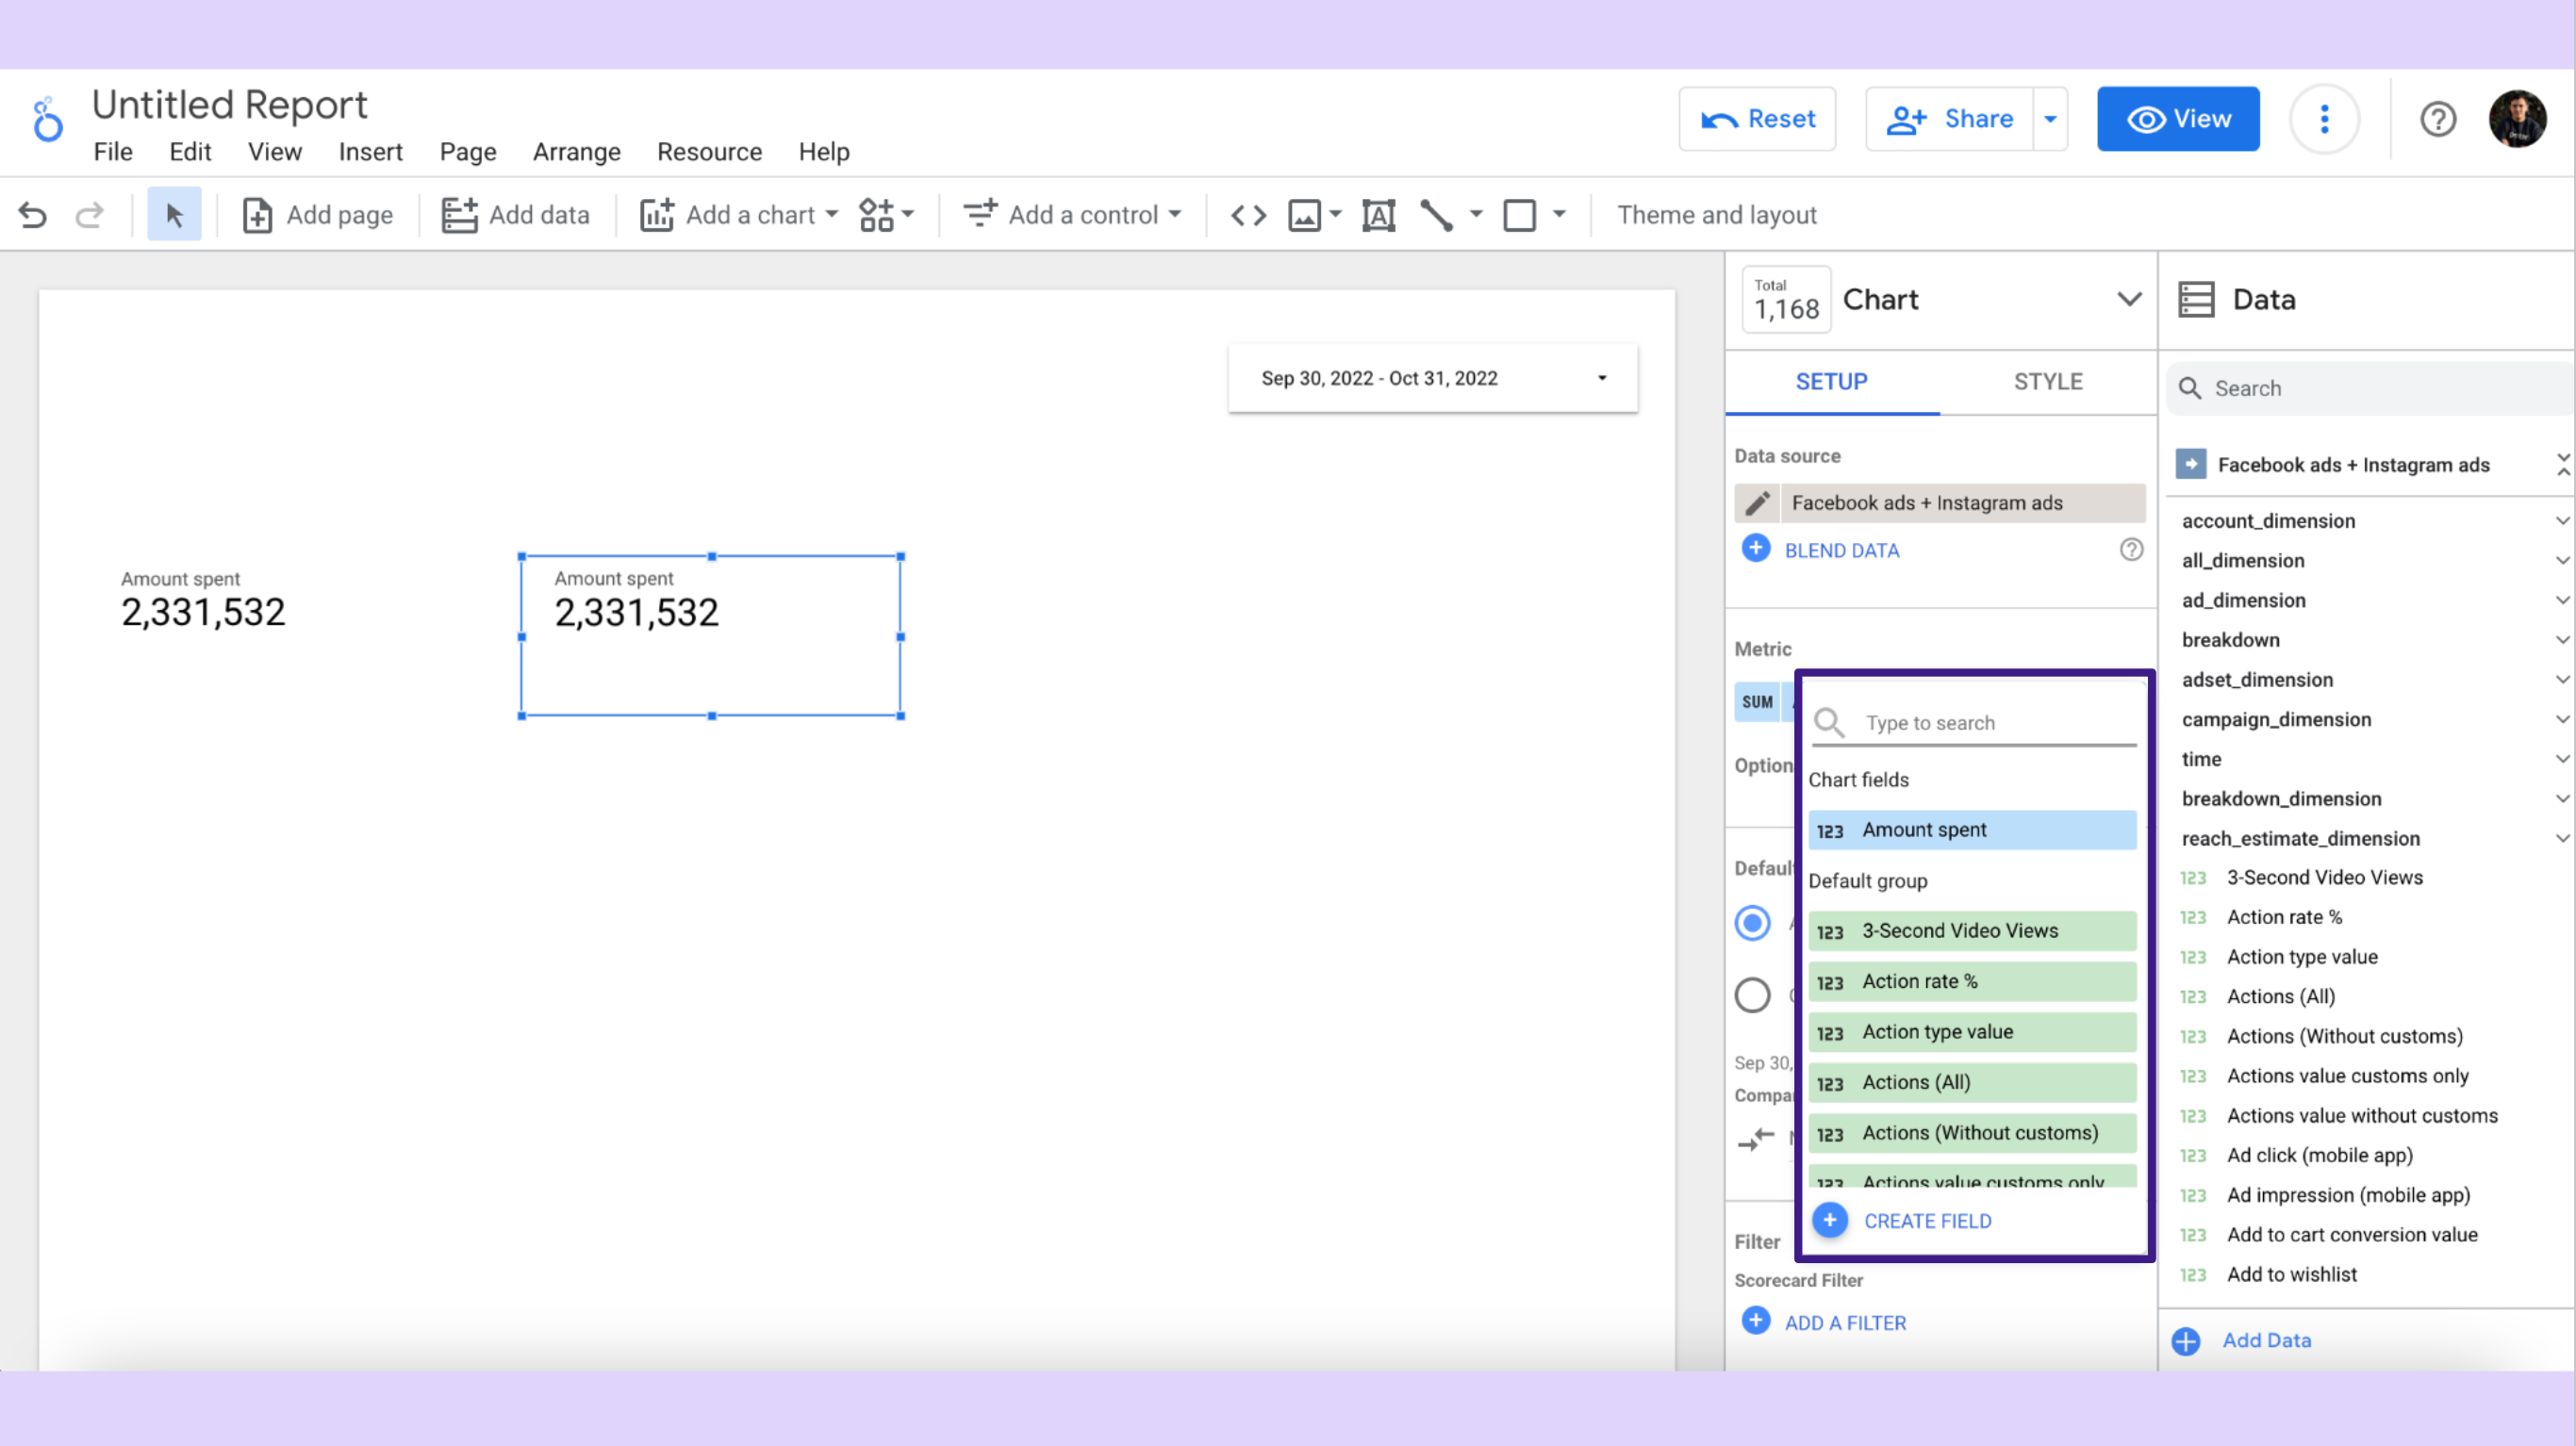
Then I’ll divide the amount spent by the limit I defined for the maximum spent, in this case ‘3000000’
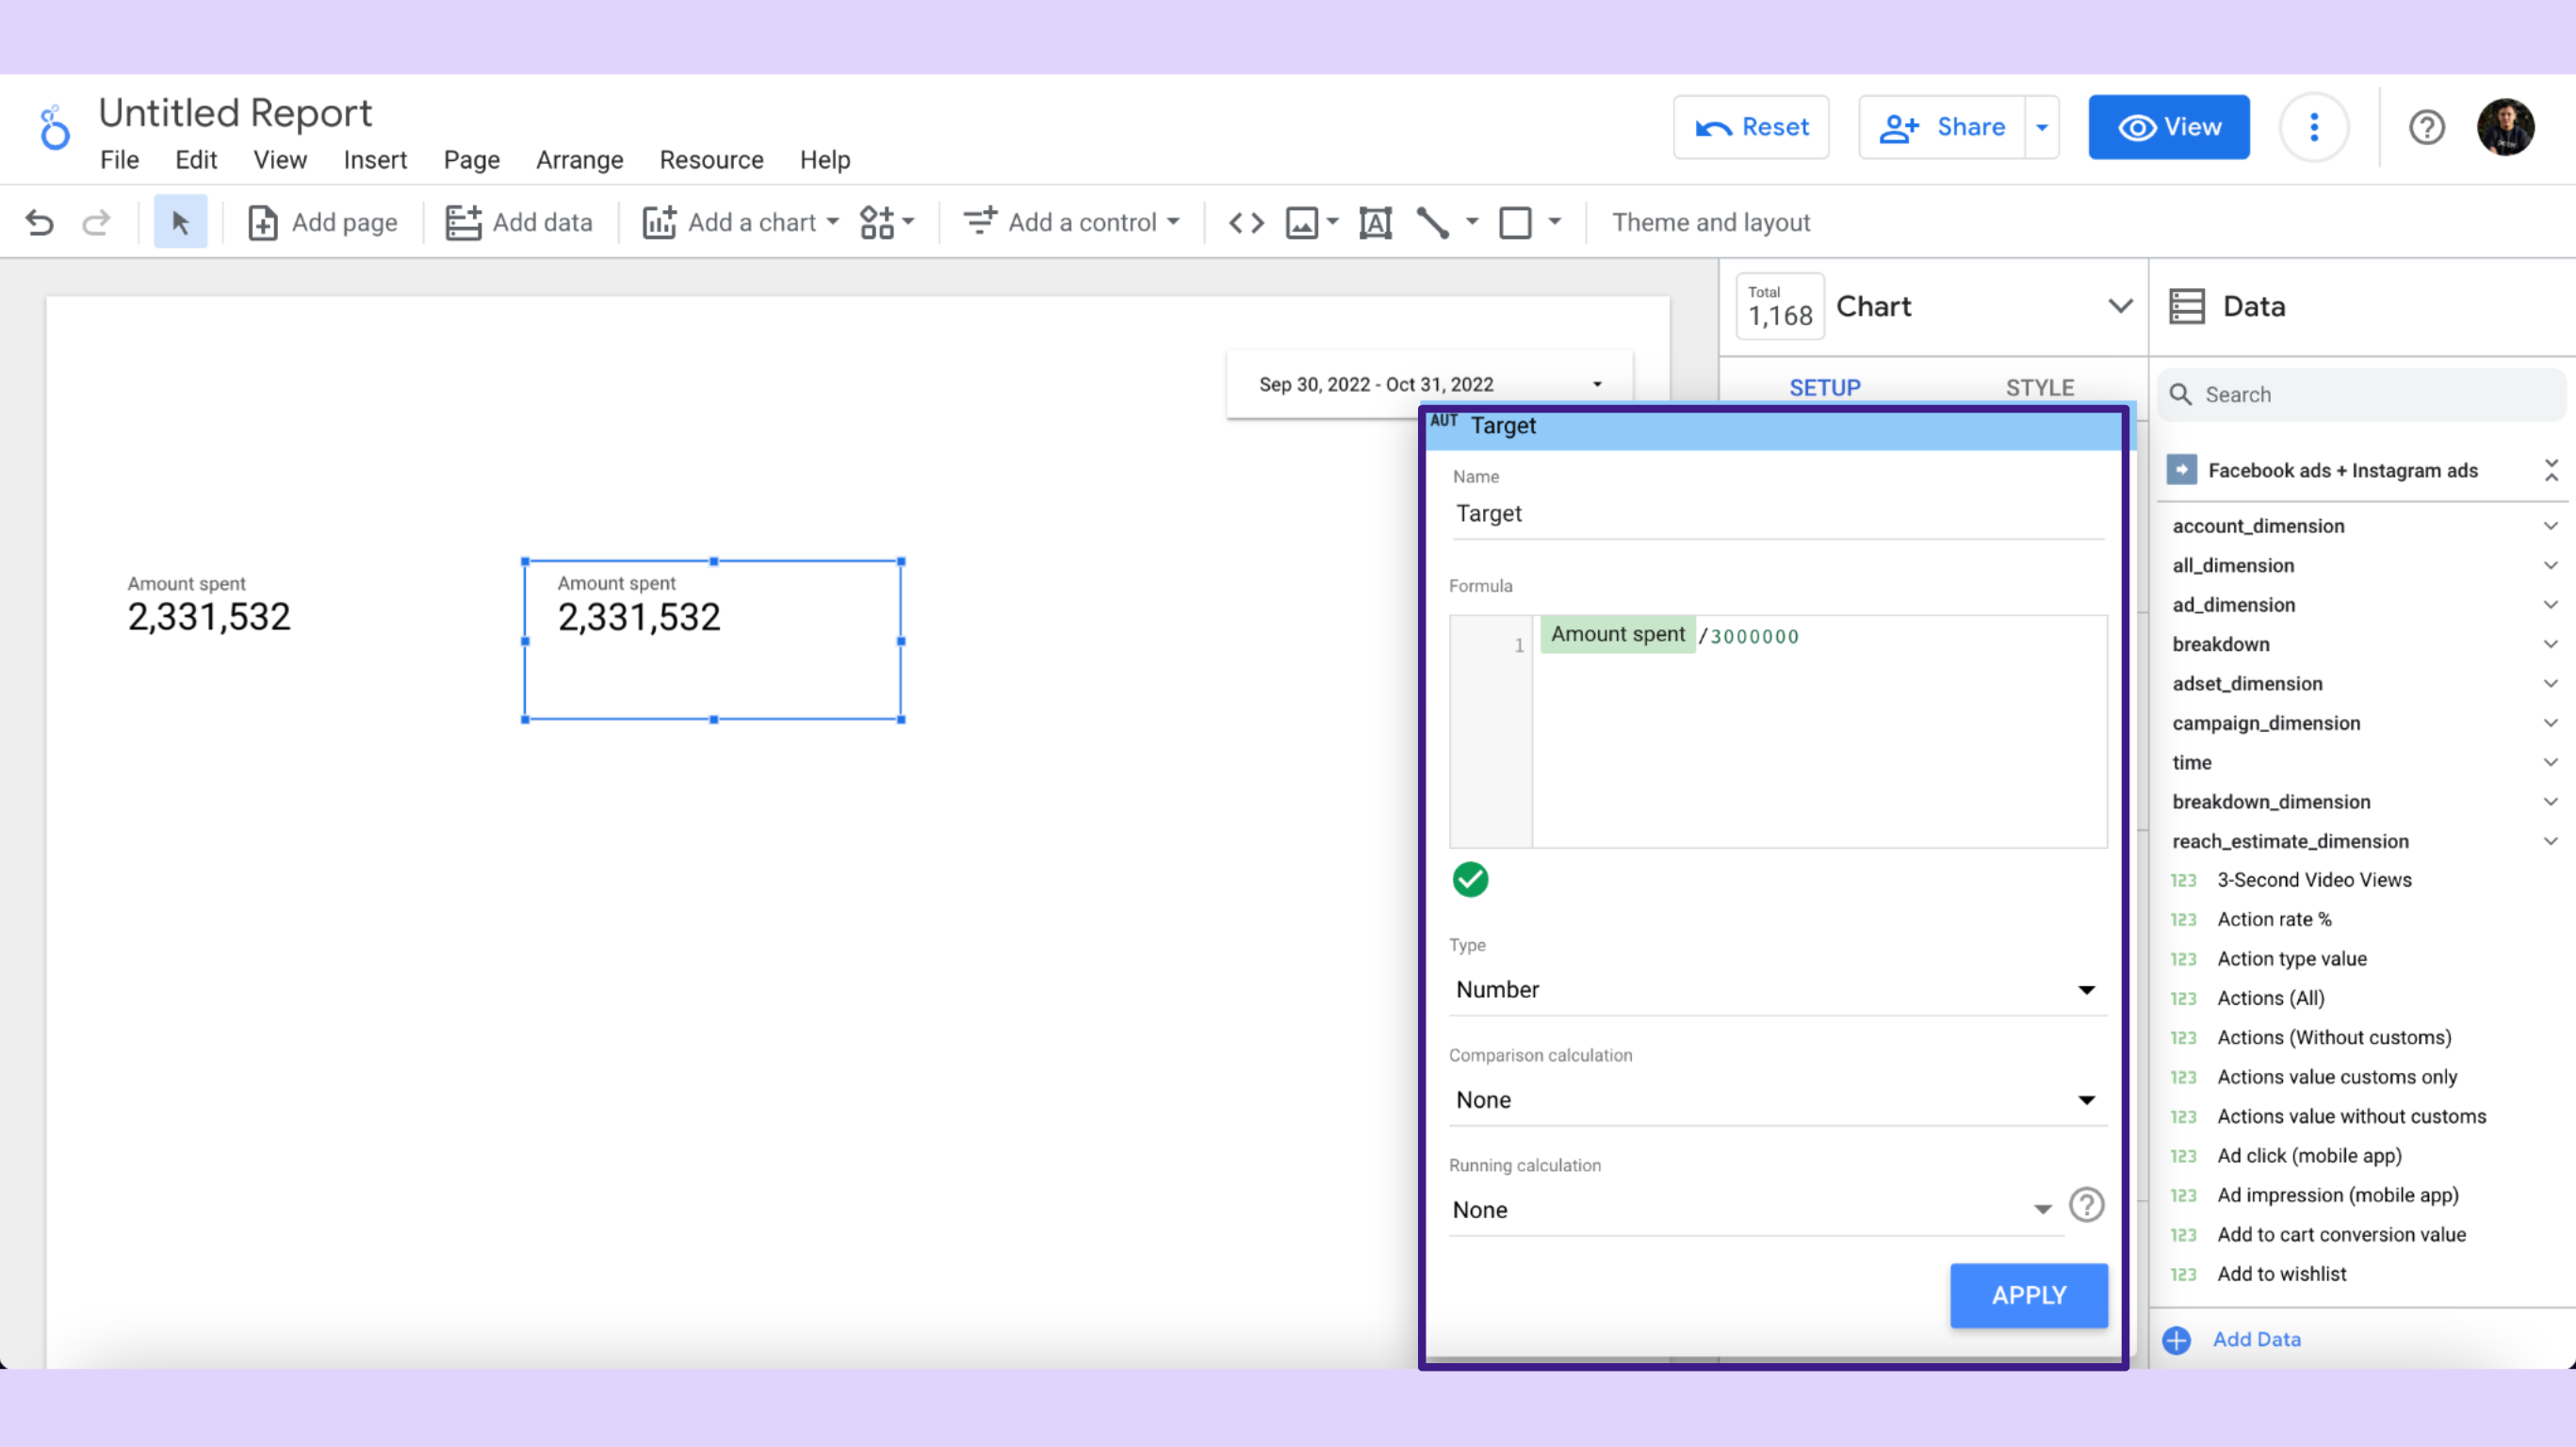
The beauty of Data Studio’s formula editor is its autocomplete system, which suggests dimensions, metrics, or functions as you type. To ensure you’re on the right track, a green checkmark appears in the formula field if your formula has no syntax errors.
Now I want this field to be shown as a percentage, so I’ll edit the field type from the same edit window.
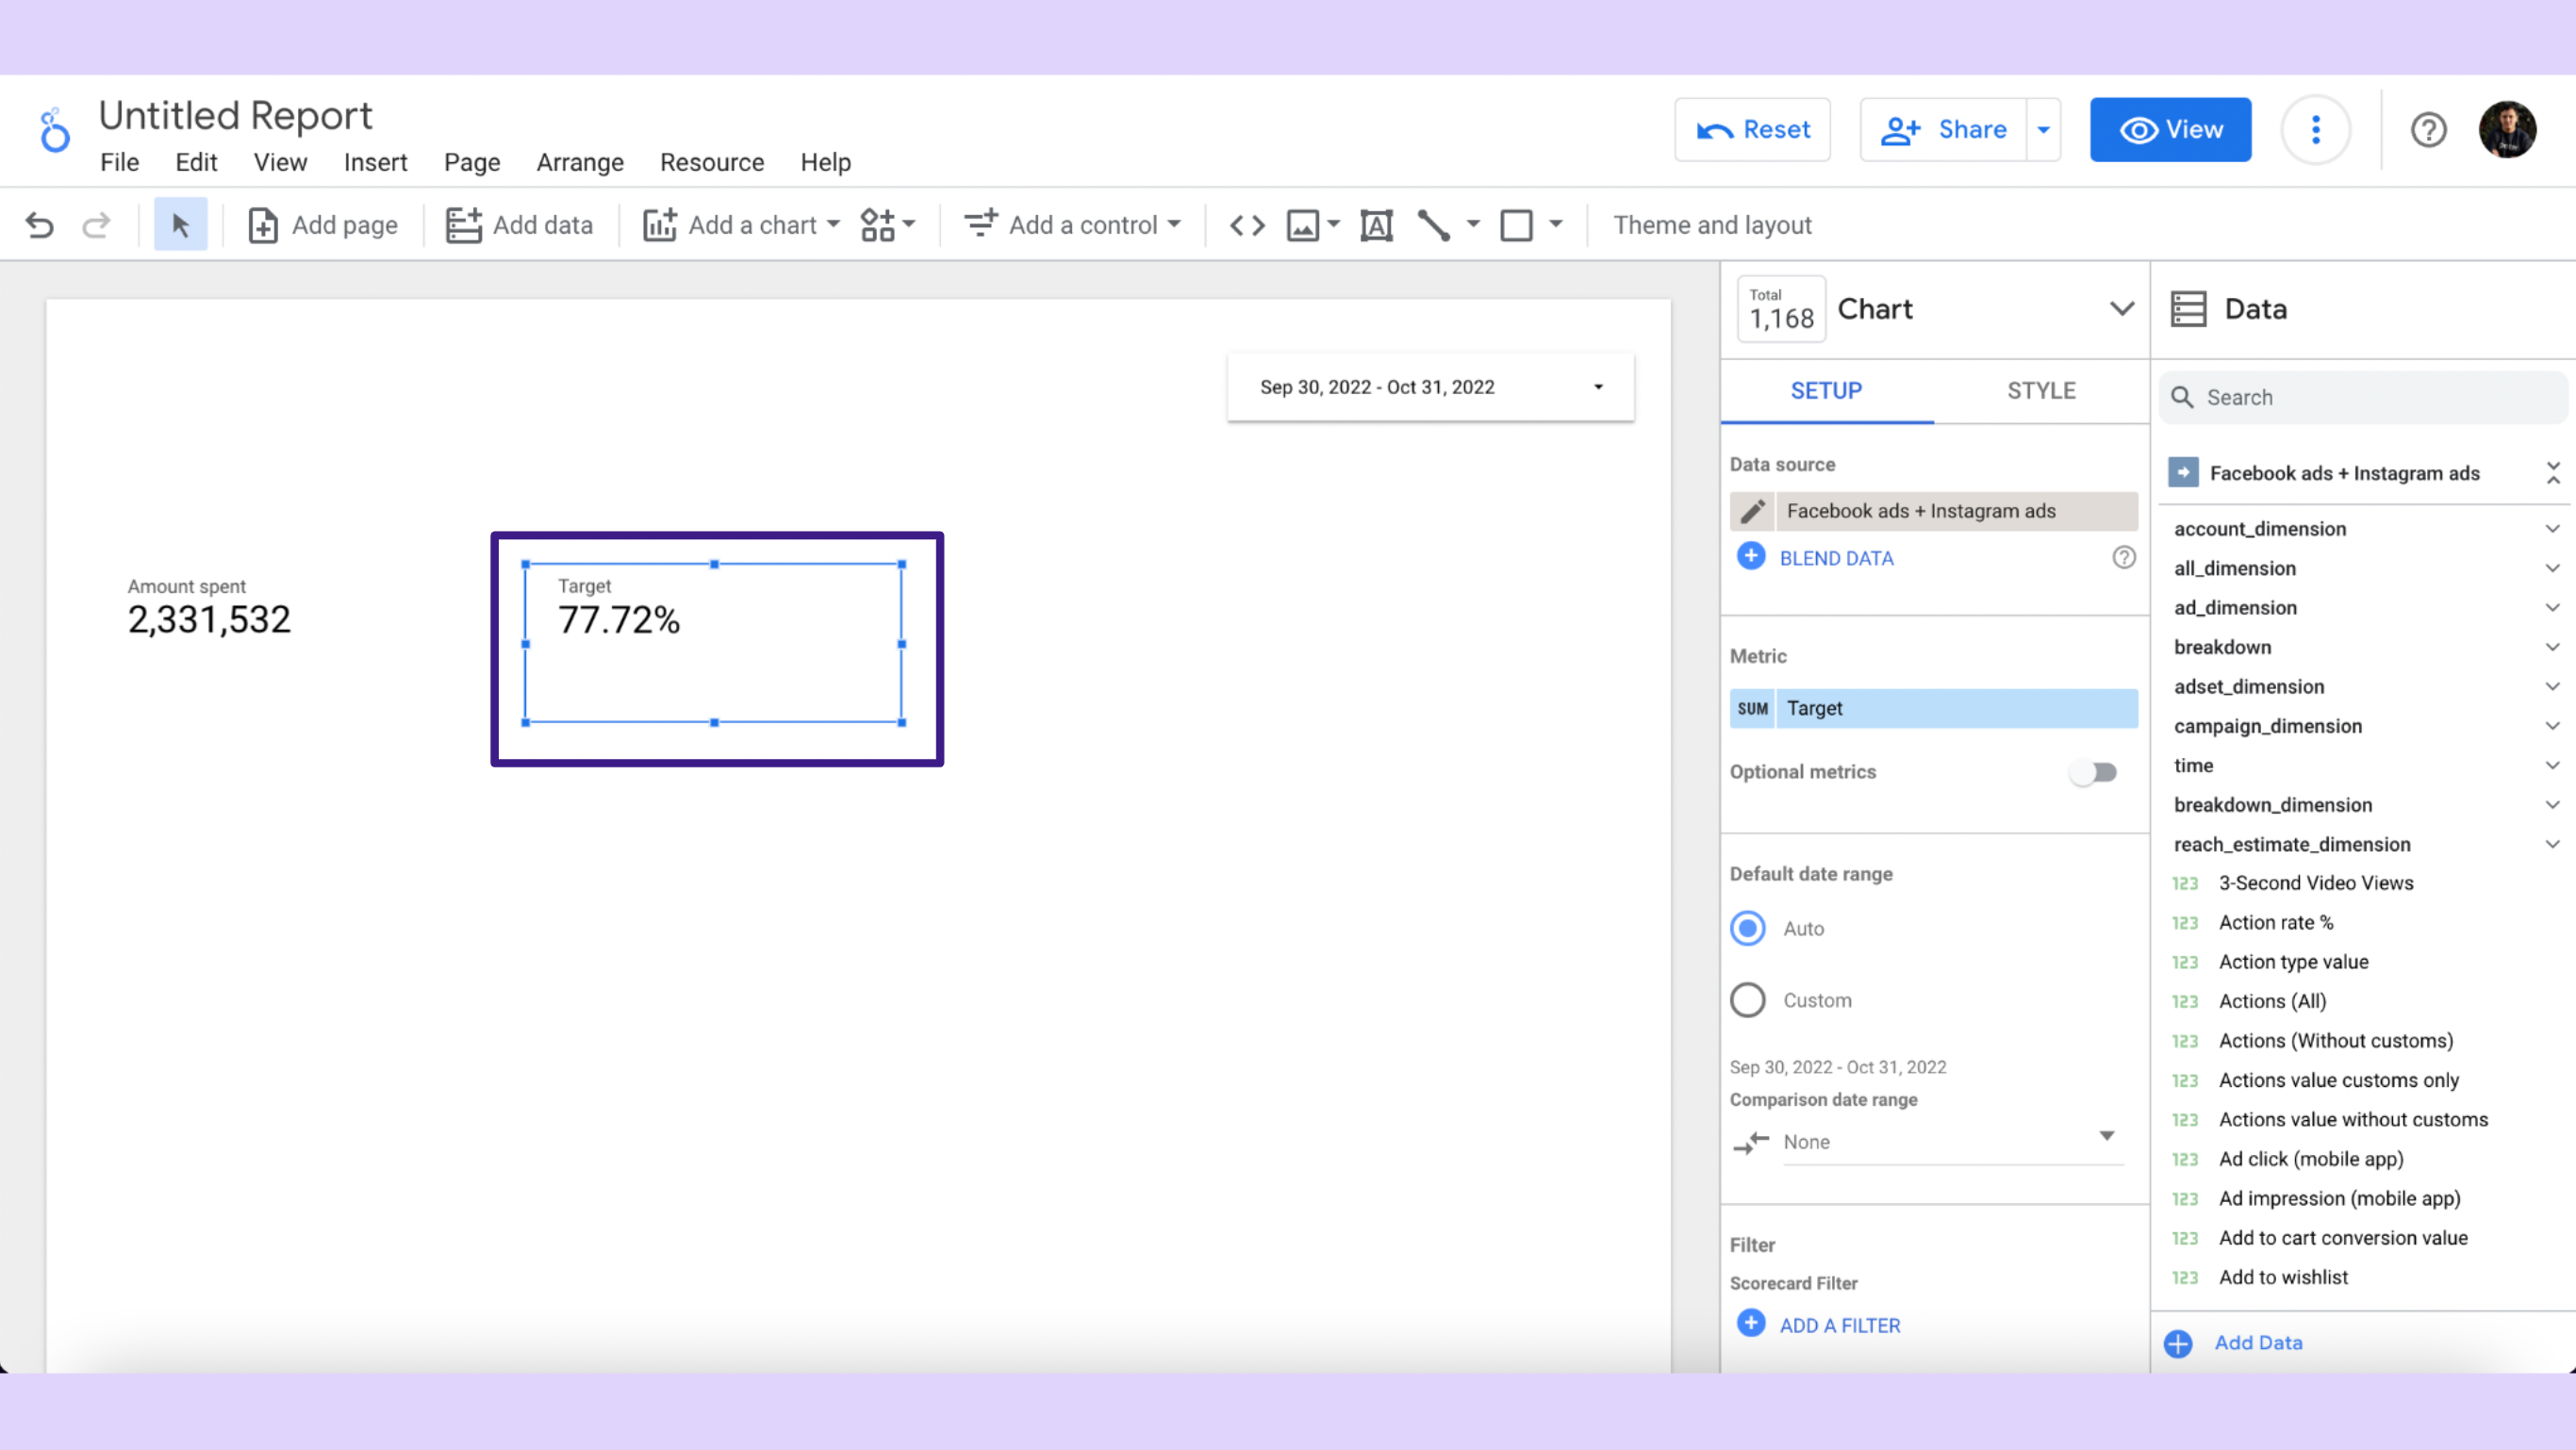
Now you will see that the result of our calculated metric is shown as a percentage of the total.
Now remember that if you want to replicate the formula, you can copy the chart and change it or you can copy the formula, create a new Data Studio calculated field, and paste it.
Editing and Managing Existing Calculated Fields
Similar to how a well-maintained garden requires pruning, calculated fields also necessitate regular management and editing. This involves finding them in your report and updating their formulas and settings to ensure they provide accurate and relevant data for your analysis.
Finding Calculated Fields in Your Report
Finding calculated fields in your report is like finding Waldo in a crowd. They are marked with a distinctive ‘fx’ symbol. To locate them, simply look for this ‘fx’ symbol next to field names within the data source or chart editor.
Updating Formulas and Settings
To do this, you can edit calculated fields by accessing the field editor in Data Studio and simply click the ‘fx’ symbol beside the field’s name.
Remember, when changing the data type of a calculated field, ensure that the new data type is compatible with the existing data to avoid any conflicts.
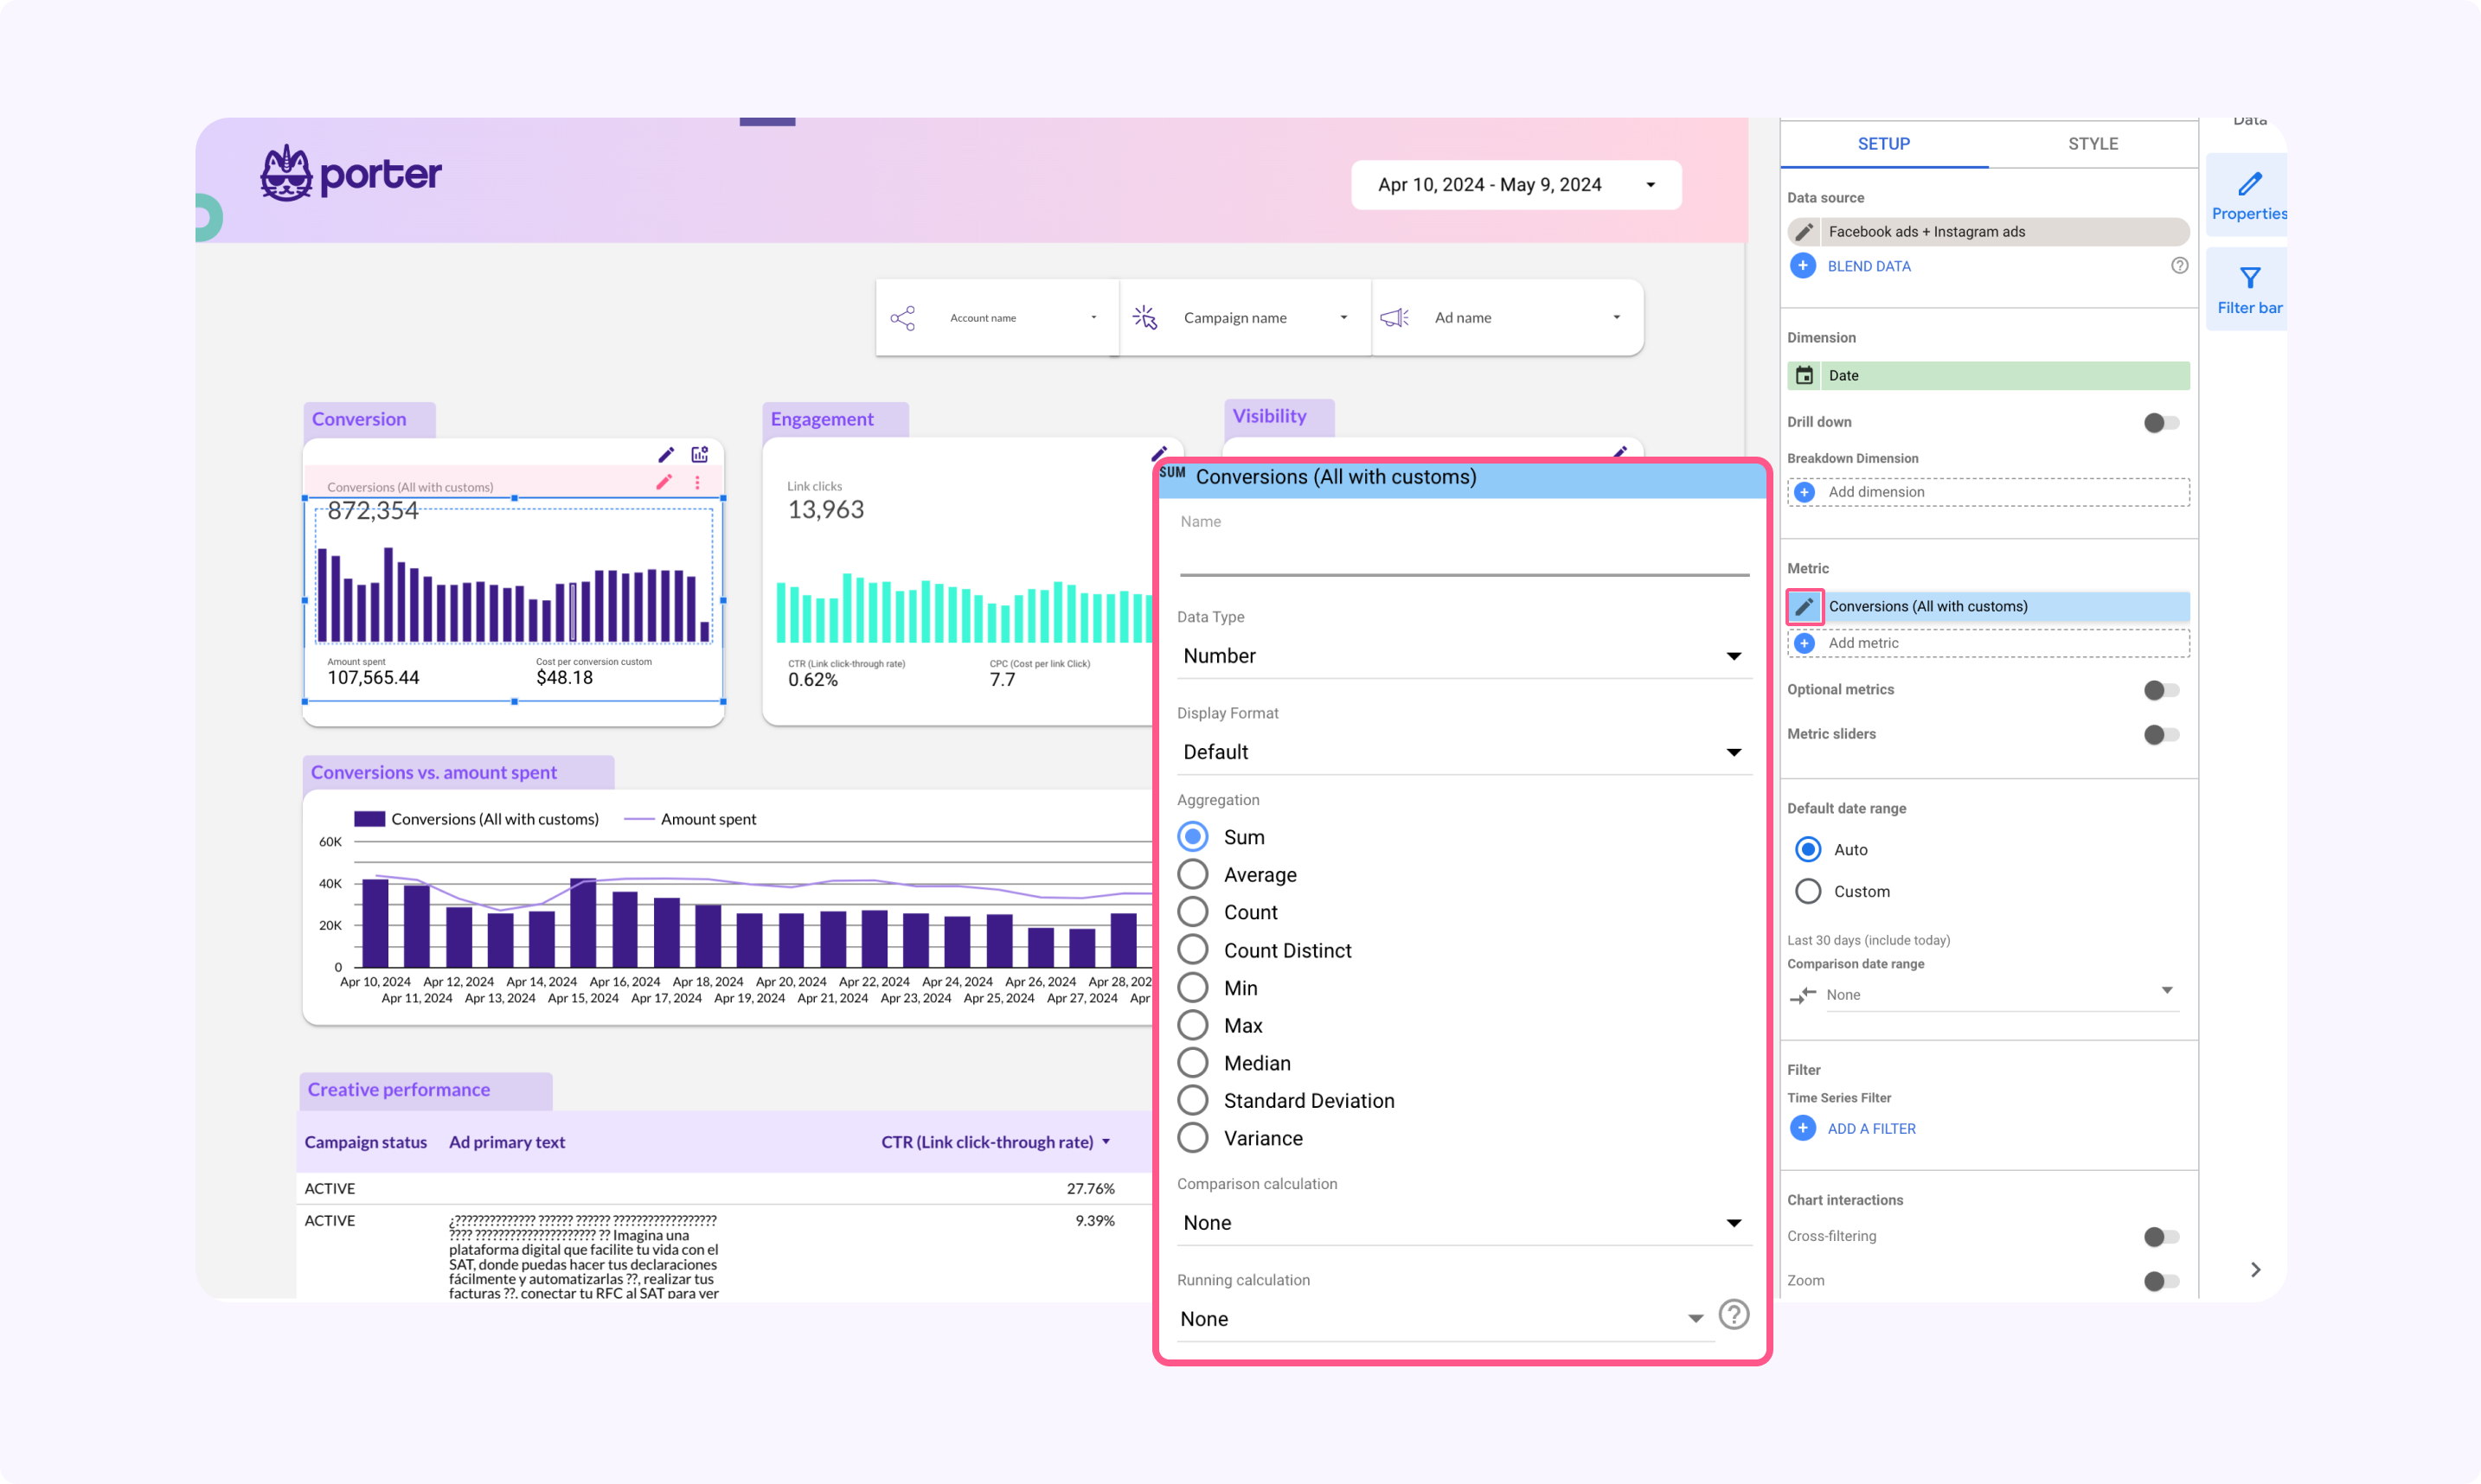
How does aggregation work in custom fields?
Looker studio fields have 8 different types of aggregations:
Average
Count
Count Distinct
Max
Min
Sum
Auto
None
You can change it by clicking on the ‘pencil’ previous to the name field and then choosing the type of aggregation you want.
For instance, you can use aggregations to count how many times a dimension is repeated, for example, I use ‘Count distinct’ in Hubspot or any other CRM to understand how many unique persons performed a desired result.
Utilizing Functions and Operators in Calculated Fields
Functions and operators serve as the magic wands for calculated fields, enabling data manipulation and analysis by performing specific actions on other fields through formulas.
Overview of Functions Available
Data Studio provides a wide range of data manipulation functions, including basic arithmetic, branching logic, and custom group creation.
Google Data Studio functions, such as CONCAT, LOWER, and REGEX_MATCH, enable users to perform tasks ranging from merging two distinct dimensions to converting text to uppercase or lowercase.
If you want to see examples of how to use Case statements with Regular Expressions, we made a complete tutorial on how to do it. Or you can see this step-by-step tutorial on how to tag social media content on Looker Studo using RegEX
Using Operators to Manipulate Data
Operators, on the other hand, are the gears that drive the engine of calculated fields. They allow you to perform simple arithmetic calculations like:
adding
subtracting
multiplying
dividing data
Moreover, logical operators such as ‘AND’, ‘OR’, and ‘NOT’ are utilized to perform logical operations on boolean expressions within calculated fields.
Common Use Cases for Calculated Fields
You can get answers to queries that couldn’t be addressed with the data in its current state by using calculated fields to answer those questions.
This encompasses anything from developing new custom metrics to changing several dimensions to doing various types of analyses on the data.
Making New Metrics
To make new metrics in Data Studio, you must add the Metric formula to the calculated field.
There are two ways to do that:
You can either combine your goals in a way like (Goal 1 + Goal
2)Or you can find the conversion rates stage by stage by finding the difference between them. All you have to do is divide the stage numbers like Stage 2 / Stage 1
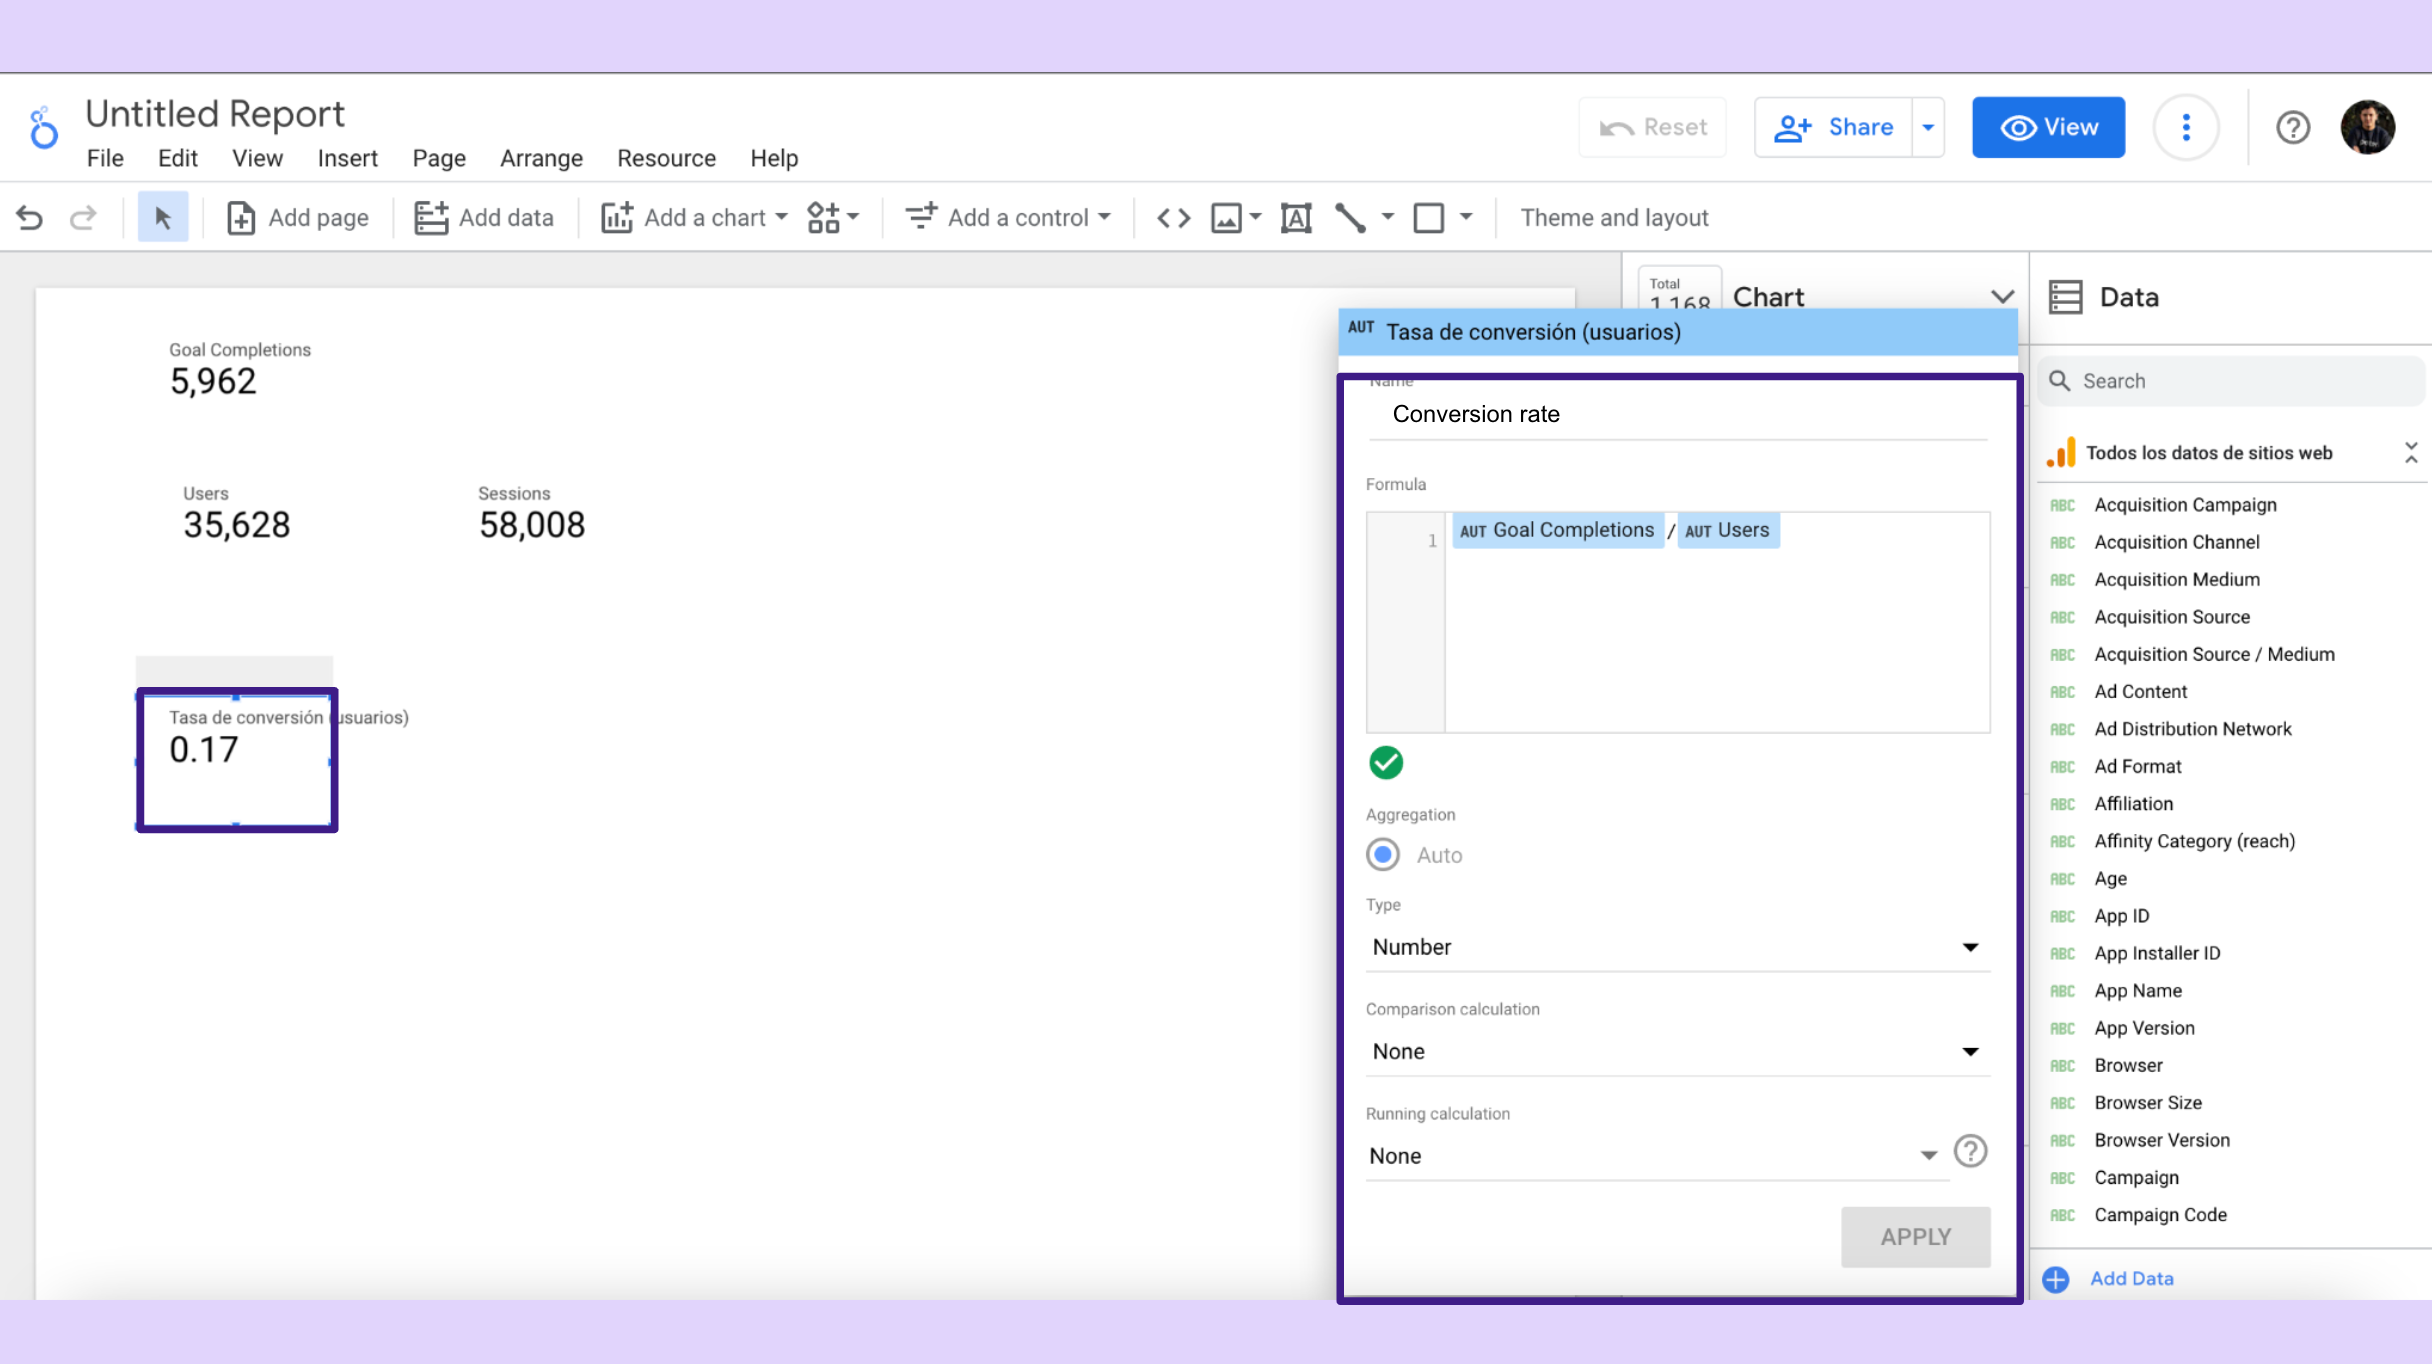
Tracking your progress
You can keep track of your progress toward goals with a scorecard by figuring out:
Goal Metric / Goal Value
Combining your dimensions
CONCAT function will help you combine more than one dimension. For example, you could combine Hostname and Landing Page Path to make your URLs clickable.
Erasing Trailing Slashers
This tip is only a short-term fix if your site’s URLs have a mix of trailing and non-trailing slashes, which causes your data to be split when you report on it.
You should first fix the problem by requiring URLs to have either a trailing or non-trailing slash to stop duplicate content. If you don’t, you’re just covering up the problem.
You can use REGEX REPLACE to eliminate the last slash from pages that end with one.
Keeping Consistent Case
The best way to fix this is to keep your URL’s case the same, which is similar to the way to fix the problem of trailing slashes in URL strings.
But if you want to combine dimensions by making them all lowercase, there is an easy formula:
LOWER (Landing Page)
Troubleshooting Common Issues with Calculated Fields
Similar to any data visualization tool, calculated fields can occasionally present challenges. But fret not, most of these issues can be resolved by following simple troubleshooting steps.
Addressing Null Values and Errors
Null values in calculated fields are like invisible obstacles – they can lead to missing or inaccurate data in your reports. Using functions like IFNULL or NARY_MAX can replace these null values with zeros, ensuring accurate mathematical operations and cleaner data visualization. To resolve errors like system exceptions, remember that calculated fields’ data type needs to be compatible with the existing data.
Ensuring Compatibility Across Data Types
In the world of calculated fields, one size does not fit all. Ensuring that calculated fields are compatible with various data types is crucial to prevent limiting how fields can be utilized.
When changing a field’s data type, consider the compatibility with its use in charts to prevent issues that may arise in how the field is utilized.
Advanced Techniques for Blending Data with Calculated Fields
Calculated fields transcend simple data manipulation; they can be employed in sophisticated techniques for data blending, resulting in a more holistic data view.
Blending Multiple Data Sources with Calculated Fields
Blending multiple data sources with calculated fields is tricky, cause you can’t do it in the data blending view.
However, you can create chart-specific calculated fields, also known as chart specific calculated field, are capable of operating on data from blended sources, providing a means to execute calculations on combined datasets.
Here you can see a step-by-step example of how to use REGEX, calculated fields, and data blending to build cross-channel reports on Google Data Studio
Summary
To sum up, calculated fields in Data Studio are the secret weapon to transform your data into actionable insights. They allow you to create new metrics and dimensions, enhance your e-commerce analytics, optimize your marketing campaigns, and blend multiple data sources. So, why wait? Start leveraging the power of calculated fields today and unlock a treasure trove of insights!
Frequently Asked Questions
Can you do calculations in Google Data Studio?
Yes, you can perform calculations, create categories, and transform your data in Google Data Studio using calculated fields.
What are calculated fields in Data Studio?
Calculated fields in Data Studio allow you to generate new metrics and dimensions by applying formulas to existing data. This helps you derive valuable insights from your data.
How do I create a calculated field?
In Data Studio, you can create a calculated field by inputting a field name and formula using existing metrics and dimensions.
When should I use data source calculated fields?
You should use data source calculated fields when you want to apply consistent calculations across multiple reports using the same data source, and when you need to treat them like regular fields for filtering.
How can I blend multiple data sources with calculated fields?
To blend multiple data sources with calculated fields, you can create calculated fields to align data that does not match perfectly between tables and ensure that chart-specific calculated fields can operate on data from blended sources. This will help you to seamlessly integrate and analyze data from different sources.

