


Google Ads has become one of the most effective ways to promote your brand or business.
However, regularly reviewing your performance is essential to ensure you effectively reach your target audience and maximize your Return on Ad Spend (ROAS).
Data Studio (formerly Looker Studio) is a visualization and dashboarding tool to get insights into your data and view your campaign performance in real time.
You can use Data Studio to create custom reports, compare your Ad performance across multiple dimensions, and even export your data to other tools.
In this article, we’ll show you how to review your Google Ads performance on Data Studio.

How to Connect Google Ads to Google Data Studio
Before you can review your Google Ads performance on Data Studio, you’ll need to connect Google Ads to Data Studio. Here’s how to connect Google Ads to Data Studio:
1. Sign in to Data Studio.
The first step is to head to the Data Studio site and check if the Gmail or Gsuite account connected is the one you want to use to create a dashboard to review your Google Ads Performance.
2. In the top left, click Create then select Data Source.
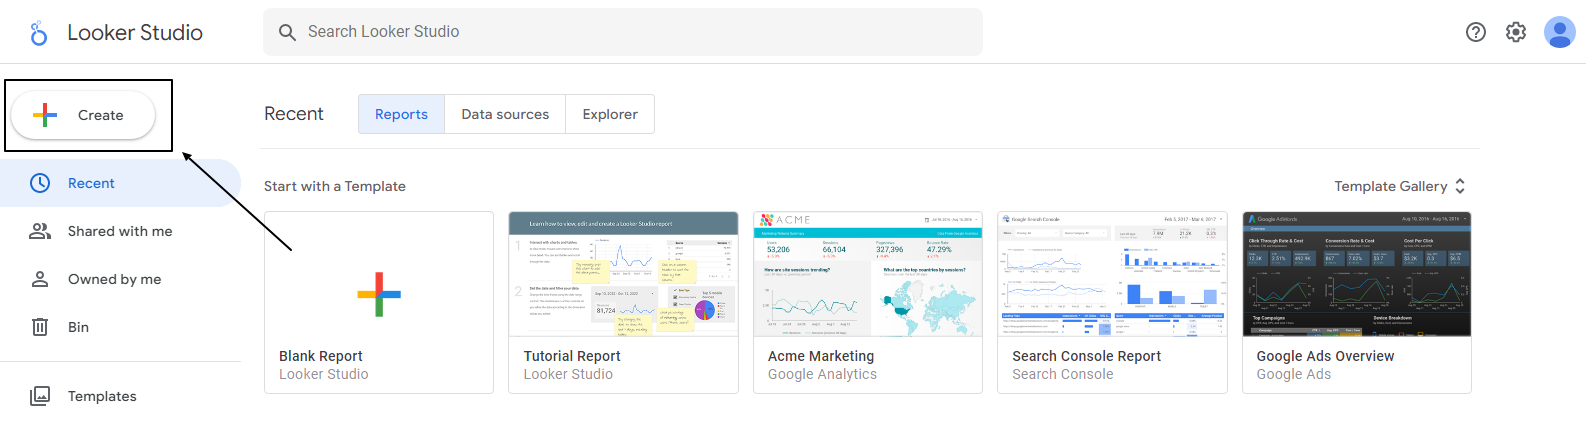
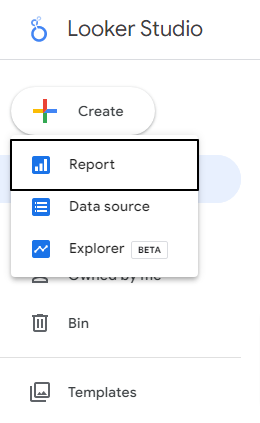
Next, click the Create icon in the top left of your screen, then click Report from the dropdown. A blank report will be created for you, and you’ll be prompted to select the data source you want to review the performance of.
3. Select the Google Ads connector.

Click the Google Ads connector then you’ll need to grant Data Studio access to your account.
4. If prompted to grant Data Studio access to your account, click AUTHORISE.

The next step is to click AUTHORISE to give Data Studio authorization to connect to your Google Ads.
5. Click ALL ACCOUNTS
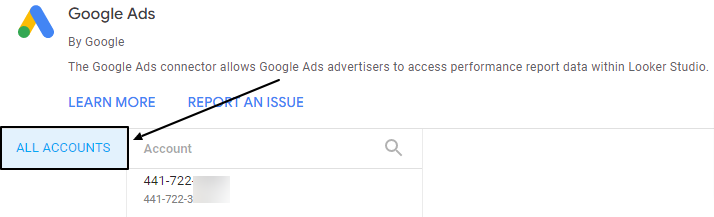
Click ALL ACCOUNTS.
6. Select an account. You can search by account ID or by name.
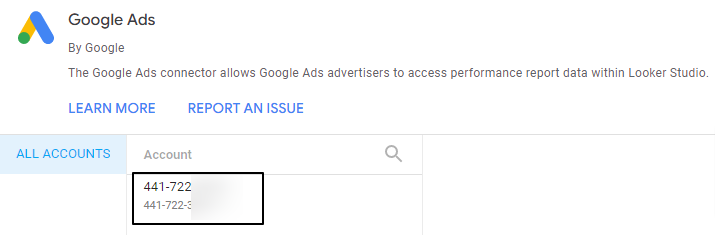
Then, select the Google Ads account you want to connect to. Here, I’ll select the first account. You can search by account ID or name if you have many accounts.
7. Select Overall Account Fields.
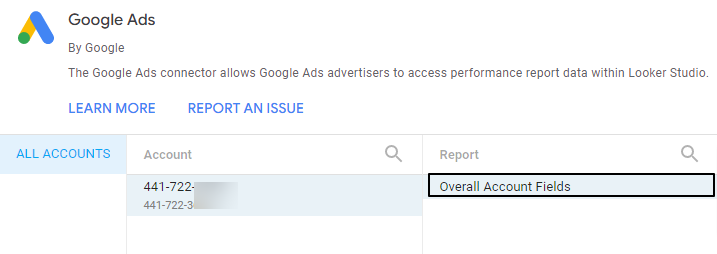
Then, click Overall Account Field.
8. In the lower right, click ADD.
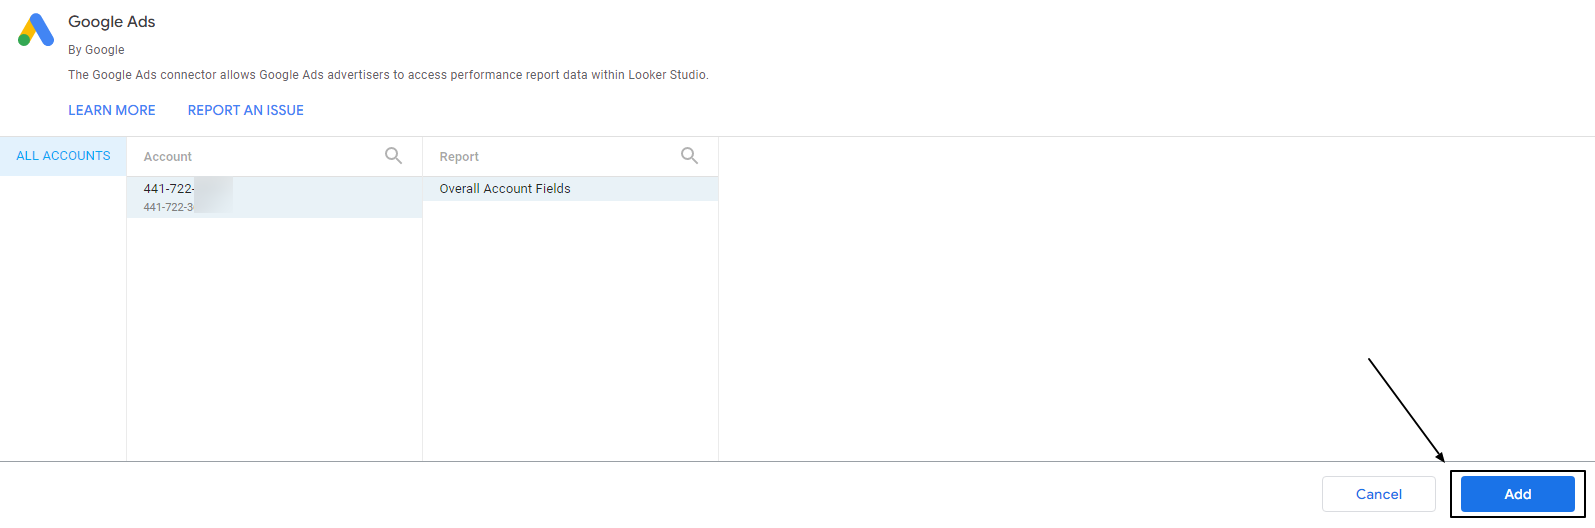
Click Add in the lower right of your screen. Now, you’ll get a popup prompting you to add the data source to the report; click ADD TO REPORT.
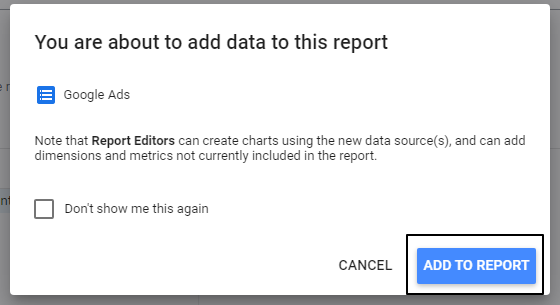
The Google Ads account is now connected to Data Studio.
Data Studio Report Templates & Dashboard for Reviewing Google Ads Performance
In this section of the article, I’ll take you through some custom Data Studio report templates and dashboards for Reviewing Google Ads Performance.
1. Overview With Drill Down Dimensions
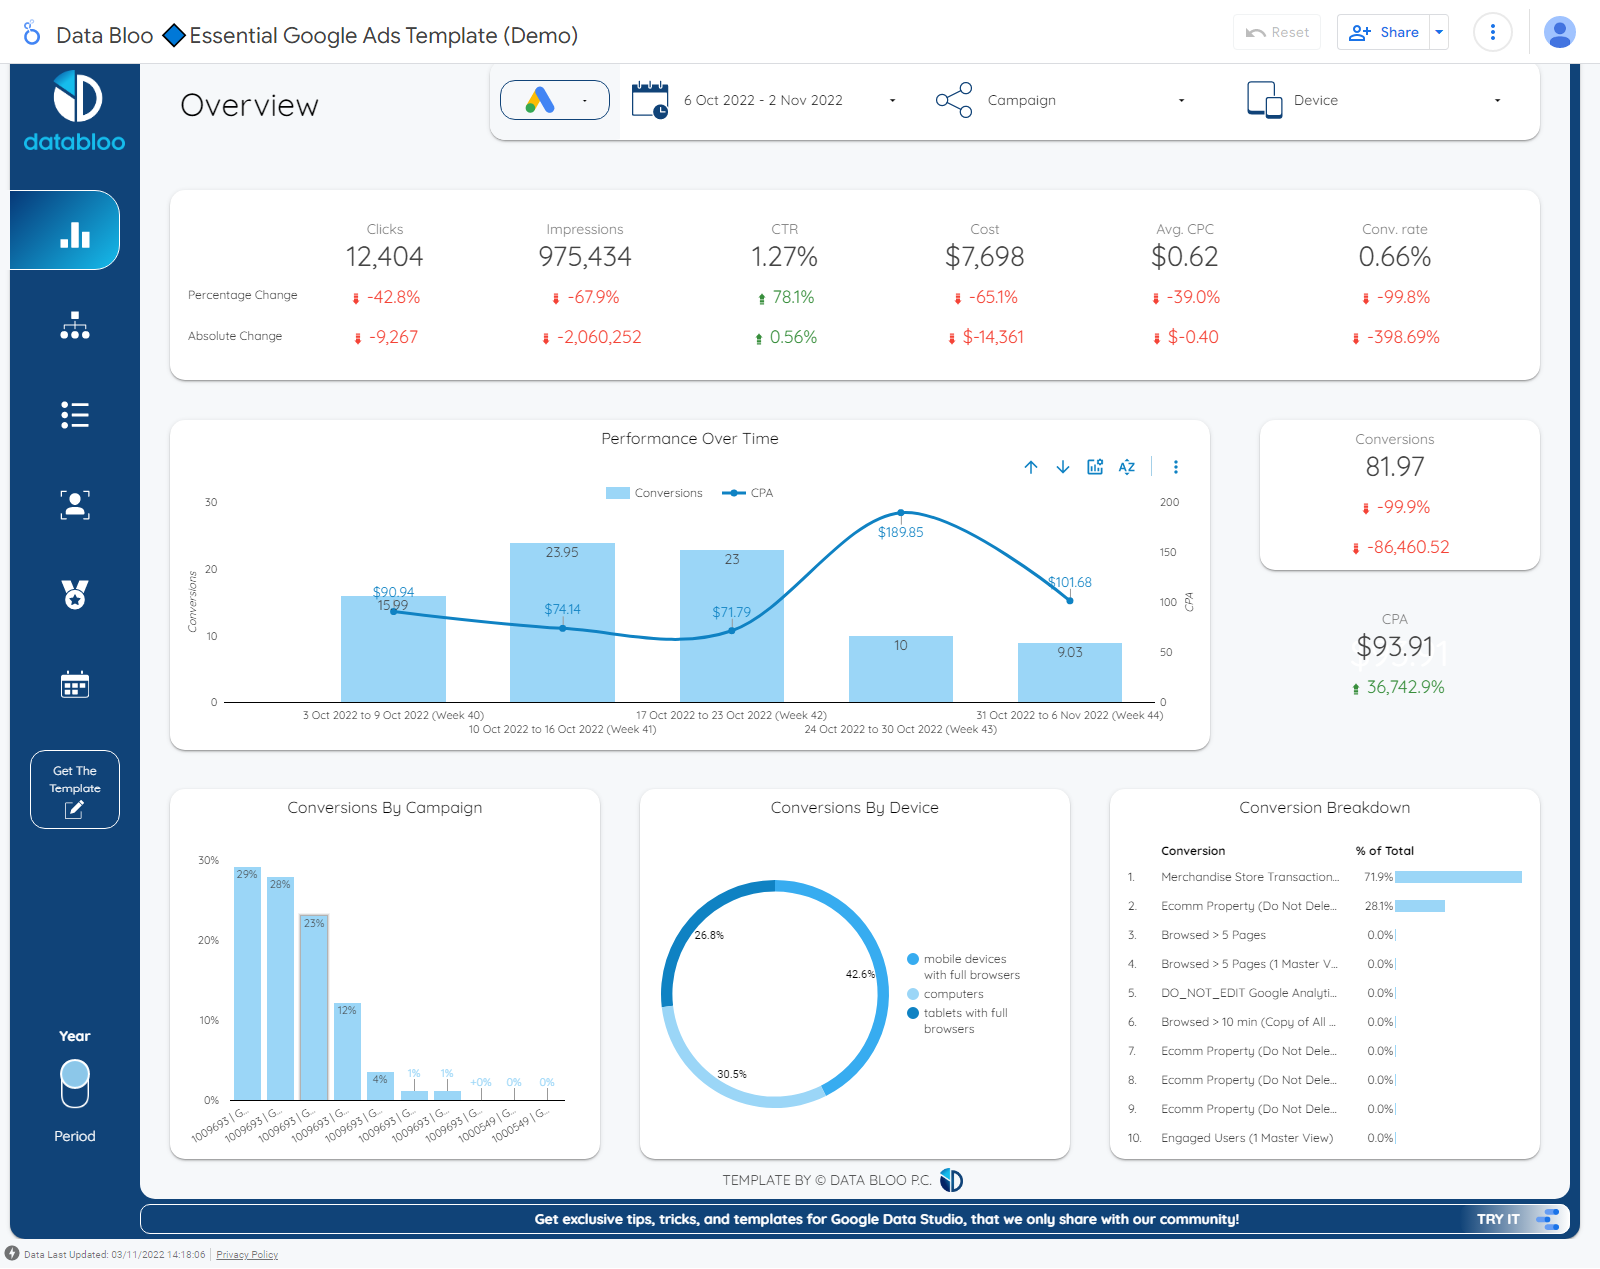
Developed by Data Bloo | Get Dashboard
Data Studio’s addition of Drill Down Dimensions within Charts has made simple charts more interesting.
This feature enables you to add a hierarchy to your charts so the user can obtain more information from a single chart.
With the Drill Down option, this template allows you to see more amazing details in the data.
2. Campaign Performance Insight
Developed by Porter Metrics | Get Dashboard
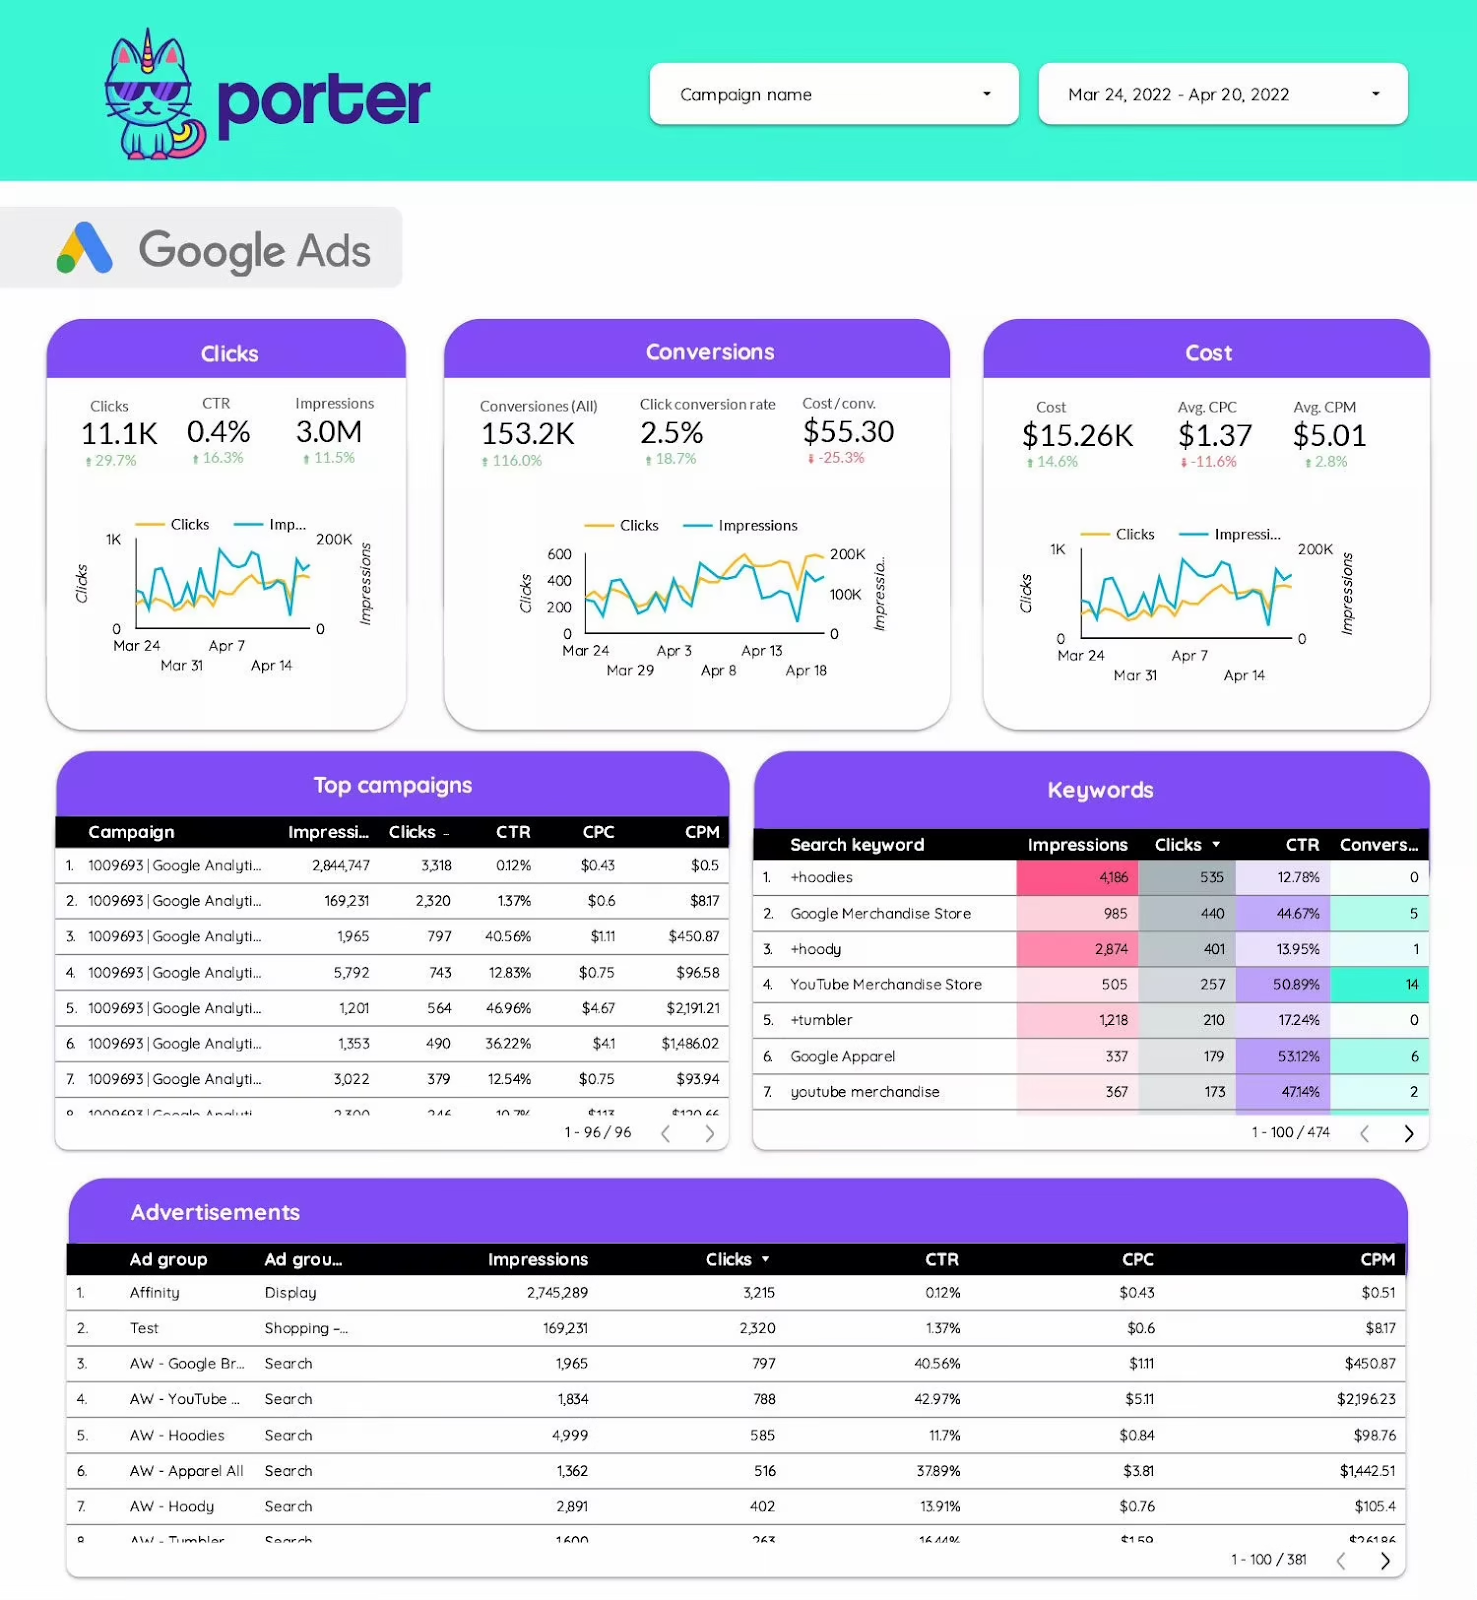
This PPC report will help you understand how Pay-Per-Click campaigns are performing.
The dashboard allows you to analyze and visualize data from different campaigns by adding or dropping a campaign name with the Campaign name control at the top of the dashboard.
The report also contains a dashboard for Facebook and TikTok Ads in case you’re interested in visualizing your Ad performance over various channels.
3. Keyword Performance Insight
Developed by Porter Metrics | Get Dashboard
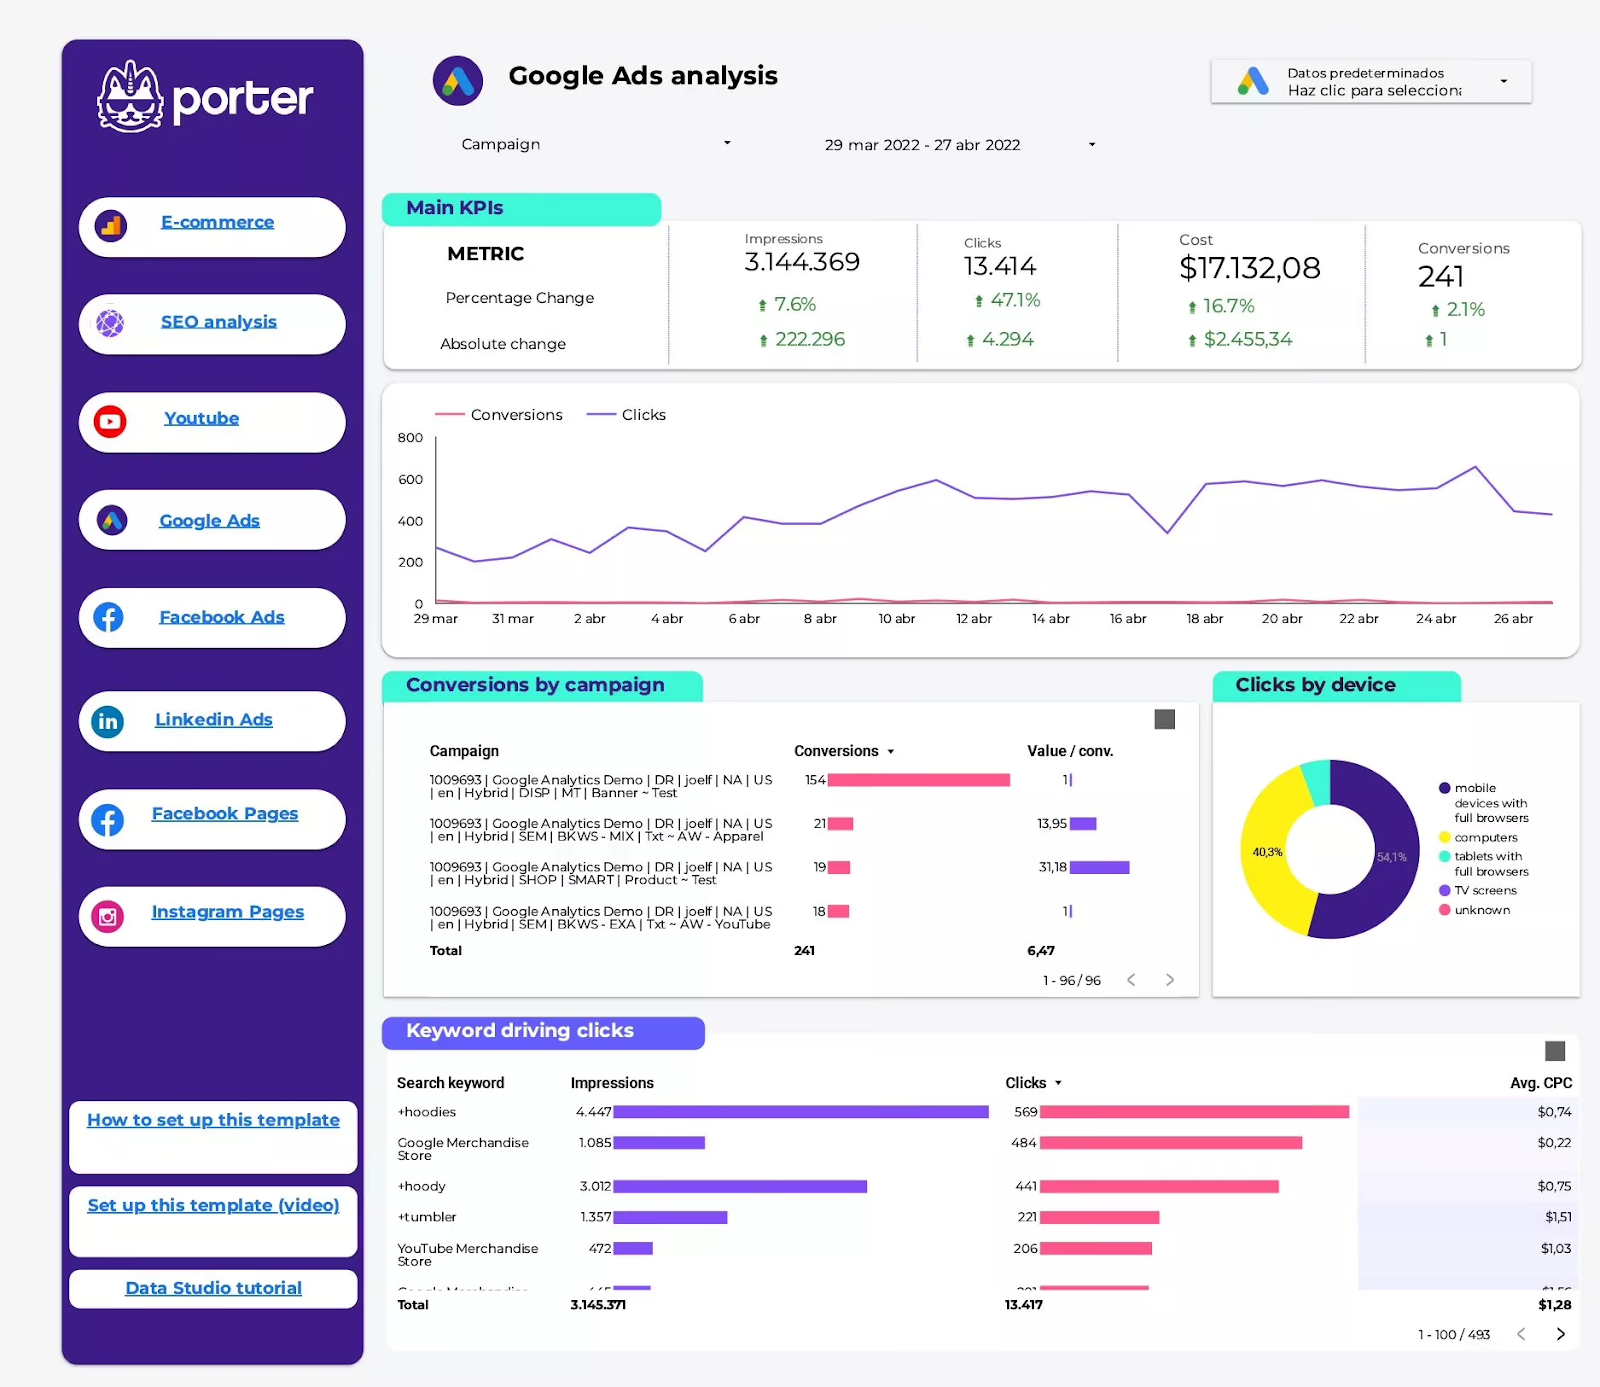
This dashboard offers a section tagged Keyword driving clicks which lets you know the keywords generating clicks, their impressions, clicks, and average CPC.
The complete report contains dashboards on eCommerce, SEO analysis, YouTube, Google Ads, Facebook Ads, LinkedIn Ads, Facebook Pages, and Instagram Pages that offer a complete reporting experience for your digital marketing efforts.
4. Geographic and Demographic Performance Reports

Developed by Databloo | Get Dashboard
This Geolocation Performance page will indicate the specific region your audiences belong to. It will also provide a case-by-case analysis of the conversation rate for each region.
5. Impression Share and Competition Trends

Developed by Databloo | Get Dashboard
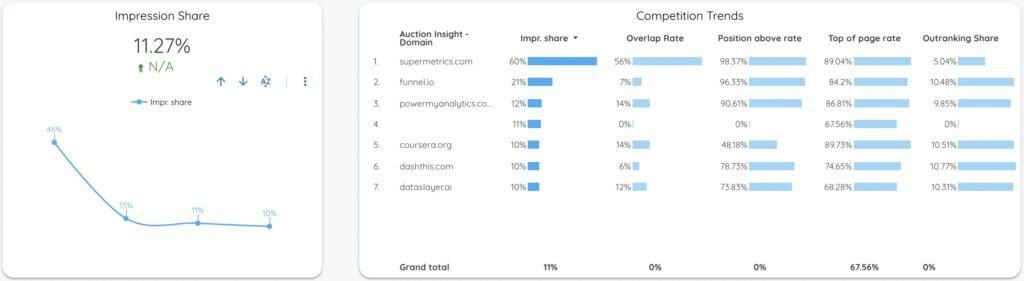
Measuring the competition is one of the most critical reporting components of a PPC data studio template.
This section of Databloo’s report offers insightful information about your competitors and their focus on paid advertising campaigns.
You can easily find a summary of other brands that bid on the exact keywords as you and your Impression Share over time.
6. Performance Report by Conversion Type or Time
Developed by Databloo | Get Dashboard
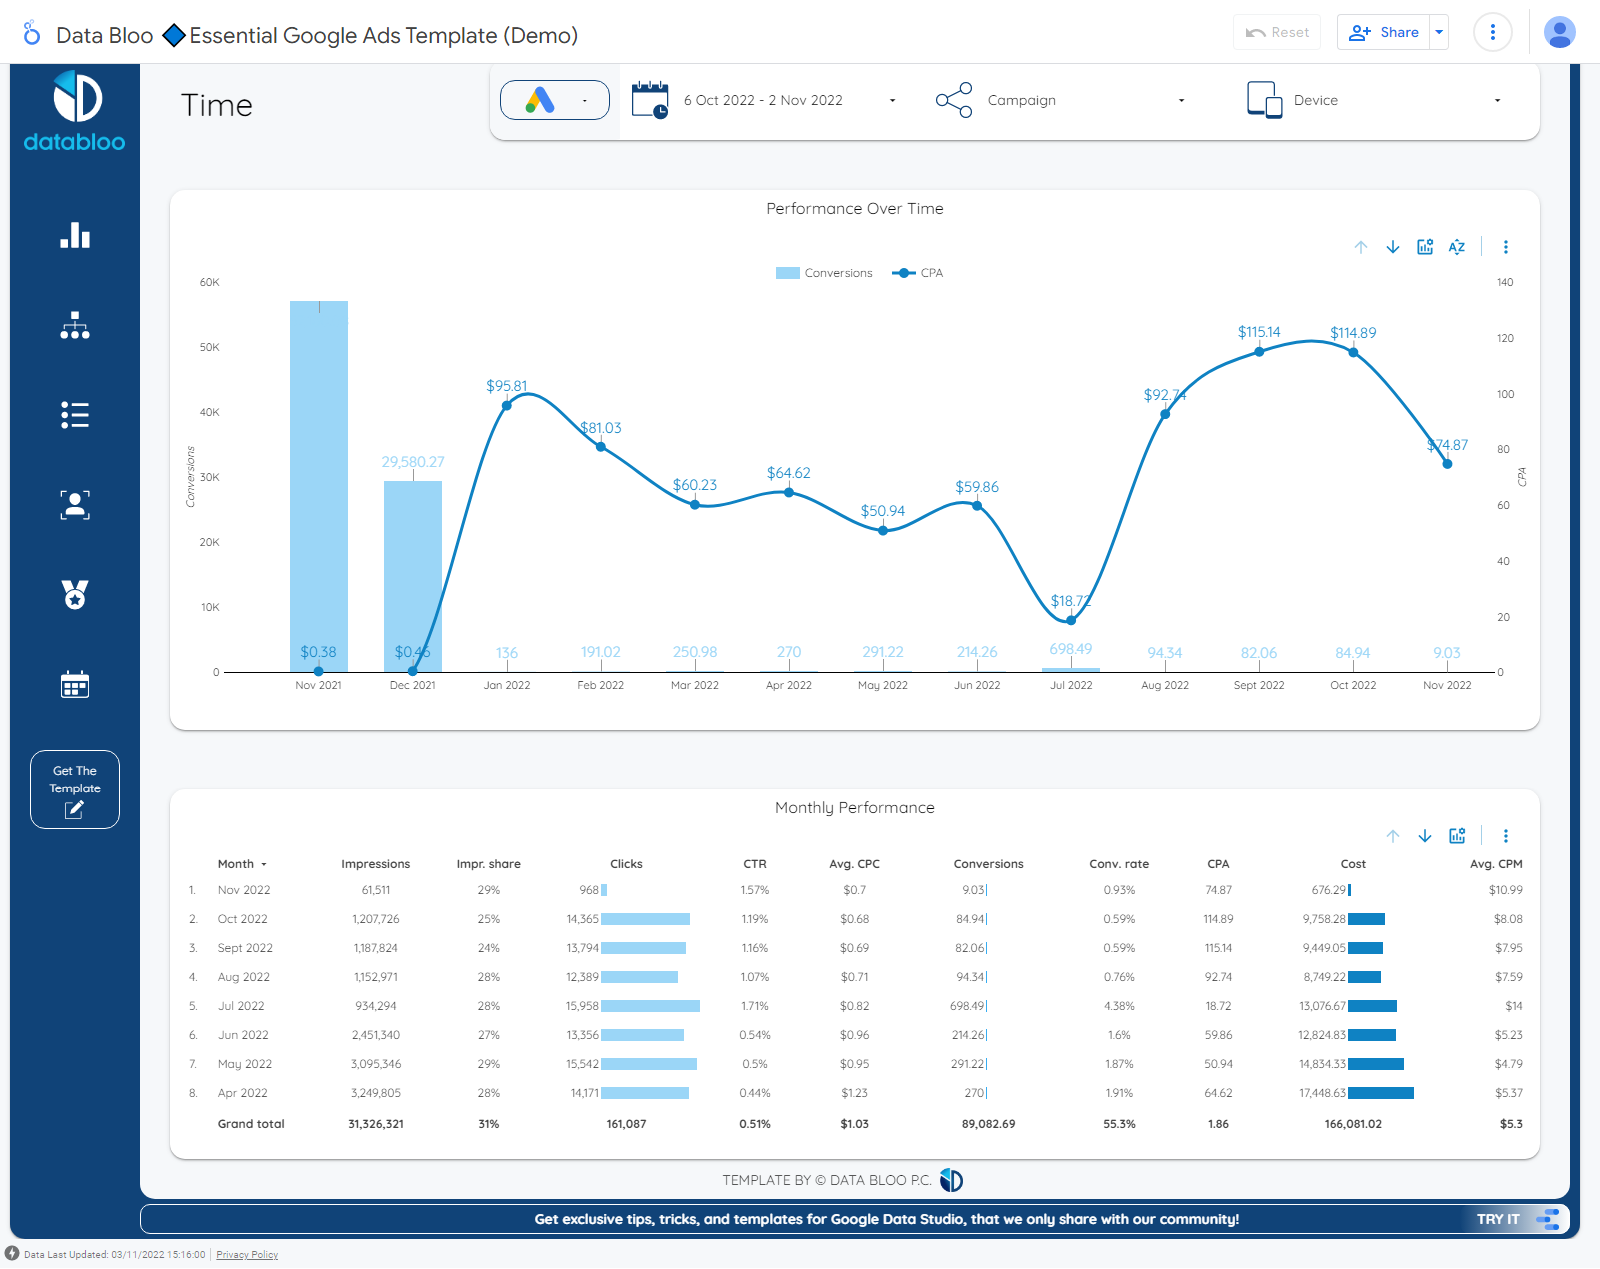
This dashboard offers insight into the trends of conversions and CPA over time using a combo chart.
The dashboard also summarizes the monthly performance with metrics like impressions, impression share, clicks, CTR, average CPC, conversions, conversion rate, CPA, COT, and average CPM.
7. Ad Group Performance Report

Developed by Porter Metrics | Get Dashboard
This dashboard can help you filter your Google Ads data based on Campaign type, Campaign, Ad group, date range, Ad group type, Ad type, and Advertising channel with the controls on the top of the dashboard.
You can use this dashboard to automate your client and agency reporting. The report also contains dashboards for Google Analytics, Google Ads, Facebook Ads, Google Search Console, Instagram, and Youtube reporting.
If you’re particularly interested in the Google Ads dashboard, you can make a copy of that dashboard alone.
8. Dates Range Filter For Google Ads
Date range filters are essential features on your dashboard, especially if you need to update the dates frequently on your data reports.
The Advanced Data Filter can automatically configure the date range for you. Here’s how you can add a date range filter:
Step 1: Go to the File tab in the menu and click Report Settings.

Step 2: Select the data source on which you want to apply the settings.

Step 3: Scroll down, change the default date range to Custom and select the date range you would like to implement on your report.

If you’re new to filters, check out this article on How To Create Filters On Google Data Studio. You’ll learn how to add date range filters to the top of your dashboard in the article.
Important KPIs to Track your Google Ads Performance
Google Ads has a lot of metrics that are worth monitoring to track your Ads performance. However, the KPIs below will clearly indicate whether your ads are doing well or not.
1. Click-through Rate
This KPI measures the effectiveness and relevance of your ad. The CTR reveals the frequency of ad clicks.
The number of clicks divided by the number of impressions is multiplied by 100 to determine the CTR of an advertisement. Here’s the formula:
Click-through rate = Number of clicks / Number of impressions X 100.
For example, if your ad appeared 500 times and 20 people clicked on it, your CTR is 4%.
2. Keyword Performance
The core of your Google Ads campaigns revolves around conducting in-depth keyword research and comprehending search intent.
To get the most out of your ads, you must also keep an eye on the effectiveness of your keyword strategy.
To start, monitor your keywords’ clickthrough rate, quality score, clicks, and valuable conversion metrics. Based on what you find, remove keywords that aren’t performing well.
You should also identify the irrelevant keywords you don’t want to appear and include them in the negative keyword list.
3. Cost per click
You pay Google a set sum of money whenever a user clicks on your advertisement. This is known as CPC or cost per click. The CPC metric is intriguing because a well-optimized campaign should eventually decrease the cost per click.
You can calculate your average CPC by dividing the total cost of your clicks by the number of clicks. Here’s the CPC formula:
Average cost per click = Total spend / Number of clicks.
For example, if you spend $200 and get 500 clicks, your average CPC is $0.4.
4. Quality Score
Quality Score measures the quality of your ads, landing pages, and keywords. Better ad positions and lower prices can result from higher-quality ads.
By including the Quality Score column in a report, you can view your Quality Score.
The expected clickthrough rate, ad relevance, and landing page experience are all included in the Quality Score, which is presented on a scale from 1 to 10.
You’re more likely to see higher Quality Scores if your ads and landing pages are more relevant to the user. Here are some resources on the quality scores from Google:
5. Cost Per Conversion
Cost per conversion (“Cost / conv.”) reveals the average cost of each of your conversions. You can calculate this metric by dividing your total cost by the amount in your “Conversions” column.
Only eligible interactions (like ad clicks or video ad views) are considered in the calculation, so any clicks that cannot be tracked for conversions are not included.
6. Conversion Rate
Conversion Rate (“Conv. rate”) informs you of the average frequency of conversions following a click or other ad interaction.
To determine this metric, divide “Conversions” by all eligible interactions (such as ad clicks and video ad views).
7. Search Impression Share
The percentage of impressions your ads receive compared to the potential number of impressions is known as the Search impression share.
Search Impression share = Search impressions / total eligible search impressions.
The impression share is a great way to determine whether raising your bid or budget will result in more people seeing your ads.
8. Search Impression Share Lost Due to Budget
Search Impression Share Lost Due to Budget is the percentage of time your ad didn’t appear because your budget is too low.
Your ads may run in the morning, but depending on the budget delivery method you’ve chosen for the campaign, your daily budget may run out and prevent you from placing bids in the afternoon.
Or you might miss chances to get impressions all day long. In either case, a value of 30% means that because of your budget, your ad didn’t show up in 30% of customer searches that contained your keyword(s).

Google Ads Optimization Routine
The work of optimizing Google Ads is never finished. You must keep an eye on your campaigns every day and every week. Even better, you ought to conduct an in-depth evaluation once per month.
It takes a lot of time to optimize a Google Ads account. Tools like Google Data Studio help you save time because of this. Below are some routine tips on Google Ads optimization.
1. Daily Google Ads Optimization
By performing daily optimization, you can make sure everything is running smoothly. The following are a few things to follow in this context.
- Watch for significant fluctuations.
- Monitor your budget distribution
- Increase negative keywords
2. Weekly Google Ads Optimization
When performing weekly optimizations, you should focus more on trends that can help you understand how well your Google Ads campaigns perform. Here are some weekly optimization tips:
- For your Search Network campaigns, be sure to review the weekly “search terms” report.
- After confirming the keyword status, make sure to review the effectiveness of your ads.
- Make sure to review the Competitive Analysis report.
- You should monitor the pages on which your Display Search Network ads appear.
- Track your Google Shopping ads’ weekly ROAS (Return On Ad Spend).
- If you’re testing any ads, check how they’re doing at least once a week to see how things are going.
- Ad extensions should not be overlooked. Site links, callouts, or snippets are frequently rejected.
You can monitor your ads’ metrics, such as CTR, Cost, and Conversions, over a day, a week, or an hour.
You can also use these reports to speed up your delivery during low-cost or high-CTR periods or set up automatic rules to pause your ads during these periods.
You can lower your Google Ads costs by increasing your advertising when there is little competition.
3. Monthly Google Ads Optimization
Although you might believe that weekly and daily checks are sufficient for optimizing your Google Ads account, it is crucial to perform routine monthly checks.
You can find any issues you might have missed during your short-term Google Ads optimization reviews by conducting a general Google Ads audit once a month.
You should concentrate on your targeting and geographic performance in addition to the performance of your bids and keywords as part of this broader Google Ads optimization process.
You can enhance the performance of your account by stopping or deleting underperforming campaigns, ad groups, or keywords and adding new ones in their place.
Optimization Tips
Along with the Google Ads optimization routine, you should keep the following tips in mind when optimizing your Google Ads performance.
1. Consider location-focused “What’s Near Me” alternatives
You can concentrate on location-based ads in your Google Ads advertising campaigns, particularly if you have a physical store. Users look for services or goods close to them, so you can create advertising content that targets areas near your physical store or stores.
2. Use phone calling in mobile ads
The telephone is still a popular way to inform customers about your services and products and offer support before and after the sale. Instead of texting a company, consumers prefer to call for a faster response.
In this situation, while using Google Ads to advertise, you should make your phone number and phone call feature available in your ad content for campaigns for mobile devices.
3. Target and bid on competitors
You shouldn’t just consider your competitors’ online presence when targeting them with Google Ads. By conducting in-person research on the businesses that perform this function, you can create targeting and offers for these businesses and use this information to broaden the scope of your ads.
4. Find your landing pages that do well
If you’ve previously created Google Ads campaigns, you can review your successful landing pages and discover which ones generate the most conversions.
Google Data Studio allows you to examine your pages that draw a lot of traffic and keep visitors on the page for an extended period.
Additionally, you can use this process to analyze the pages on which your social media ads perform best. Use these high-performing landing pages in your Google Ads campaigns after analyzing your landing pages.
Regardless of how compelling your ad content and targeting are, you will only get enough results from your landing pages if they perform well. Because of this, landing pages are crucial to advertising campaigns.
5. Focus on keywords with a certain condition
The most crucial element of Google Ads advertising campaigns is keywords. This makes it an issue deserving of special consideration.
Focus on keywords that include a specific condition or action rather than specific and product-containing word groups.
It will help improve your performance. While shoe-related terms will be your primary keyword focus, you can further hone your keywords by adding a specific circumstance and action.
You can also improve your results by using keywords with conditions and search volumes, such as “summer shoes,” “walking shoes,” and “wedding shoes.” You can also use long-tail keywords to take this to the next level.
6. Use long-tail keywords
In Google Ads ad campaigns, long-tail keywords also boost conversions. Long-tail word groups produce good results in Google Ads campaigns because they are used by users closer to purchasing, reaching a particular decision stage in the buying process.
Imagine you are in the textile business. In this case, a keyword like “red dress” is appropriate for all-purpose search results.
However, by using it as a long tail and in different alternatives like “red wedding dress,” “red summer dress,” and “red kimono with straps,” you have the opportunity to connect with users who conduct more focused and detailed searches.
You should also check out some of the optimization tips Google featured in an article for more insight into optimizing your Google Ads performance.
Conclusion
With this comprehensive article on how to review your Google Ads performance on Data Studio, you now know how to connect Google Ads to Data Studio, important KPIs to track your Google Ads performance, an effective Google Ads optimization routine, and some practical optimization tips.
You also have access to some top custom Data Studio report templates & dashboards for monitoring Google Ads metrics. You should check the templates and dashboards, then make a copy to start reviewing your Google Ads performance on Data Studio.
Last, you should go through the best practices recommended by Google to improve your campaign performance, drive growth with measurement, and explore insights and tools.
Frequently Asked Questions
How do I use data studio with Google Ads?
To use Data Studio with Google Ads, you need to connect your Google Ads account to Data Studio. Here’s how:
- Sign in to Data Studio.
- In the top left, click Create then Report, and select Data Source.
- Select the Google Ads connector.
- If prompted to grant Data Studio access to your account, click AUTHORIZE.
- Click ALL ACCOUNTS.
- Select a Google Ads account.
- Select Overall Account Fields.
- In the lower right, click ADD.
- Now, you’ll get a popup prompting you to add the data source to the report; click ADD TO REPORT.
The Google Ads account is now connected to Data Studio.
How do you measure ad performance?
There are various metrics you can use to measure your Google Ads performance. However, here are some of the most effective metrics:
- Average click-through rate (CTR)
- Conversion rates
- Keyword Performance
- Quality Score
- Cost per conversion
- Impression share
- Search impression share lost due to budget
- Cost per mille (CPM), also known as cost per thousand impressions
- Cost per click or CPC
- Cost for acquisition or action (CPA)
- Return on marketing investment or Return on Ad Spend (ROAS)