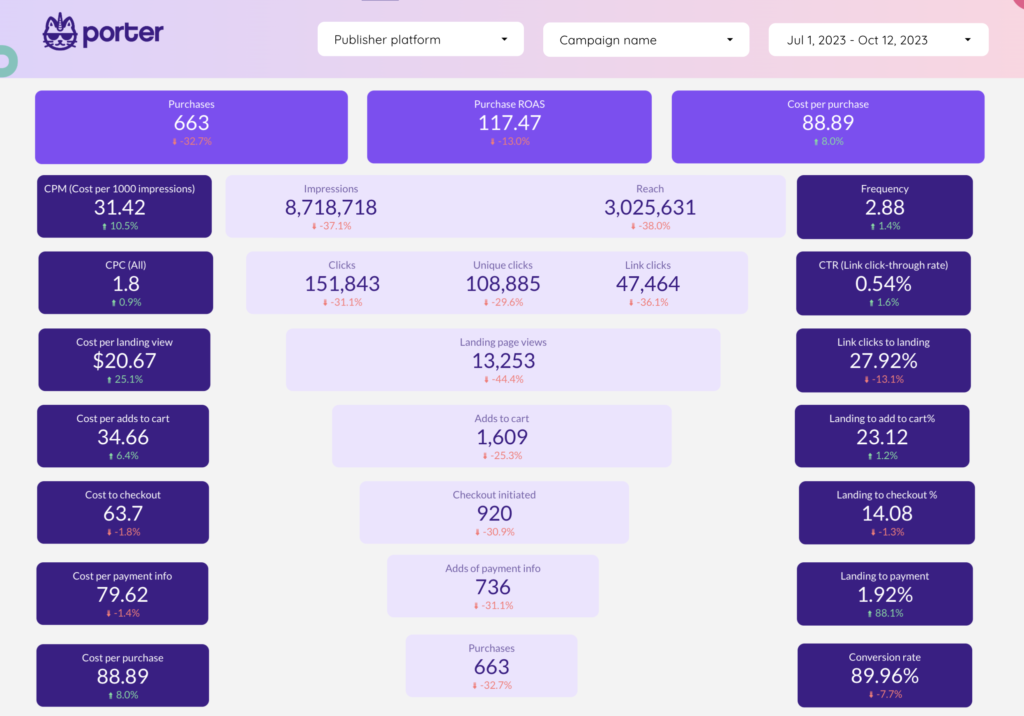
Top 10 KPIs That You Should Be Tracking in 2023

10 Social Media KPIs You Should Be Tracking in 2024
Social media is a powerful tool for marketing, but you need to know what’s working and what needs to be improved. As we move into a new year, it’s important to be aware of the latest trends in social media. This includes not only the platforms themselves but also the metrics that you should be tracking. This article will provide you with 10 KPIs that every social media manager should be tracking in 2024. What are KPIs? Key performance indicator (KPI) is a term that means an indicator that shows how well a business or campaign is performing. It can
The Ultimate Guide to Choosing a Marketing Reporting Tool
Chiefmartech says there are over 200 marketing analytics solutions, and most also offer marketing reporting automation and data management features, so finding actual the best marketing reporting tool is tough. I’ll share my perspective as a marketing analytics tech founder. I dive deep into all reporting tools, considering their features and limitations, which only become clear after you use them. I created a framework to help you evaluate and choose a Supermetrics alternative. With it, we evaluate: Features A marketing data pipeline is the process of data extraction, data aggregation, data normalization, transformation, and visualization to let digital marketers and
How to use Google Looker Studio complete tutorial (2024)
In this Google Looker Studio tutorial, we will go through all the steps needed to automate your reports and tell stories with actionable visualizations: I also made a complete YouTube video tutorial you can watch: Why does Google Looker Studio matter? We’ve already published an article about why businesses—especially marketers—should learn Google Looker Studio, data visualization, and Business Intelligence. We encourage you to read it here: Why marketers should learn Google Looker Studio? We built Porter and have hundreds of customers thanks to Google Looker Studio. Our business is built around it. We love it. And we hate it sometimes,

How to Create Calculated Fields on Looker Studio (2024)
Calculated fields enable you to create new metrics and dimensions from existing data, allowing you to create insightful reports based on your use case and specific data sources. The result? More insightful analysis and better decision-making with the help of chart-level calculated fields. In this tutorial, you will learn how to create custom fields, formulas, and practical applications. You can also see our step-by-step video: Key Takeaways Understanding Calculated Fields in Looker Studio What are calculated fields? Calculated fields allow you to create your own metrics and dimensions using operators (+, -, /,*) and act formulas, transforming existing data into
How to Use Regex on Looker Studio: Regular Expressions with Examples for Marketers
In this article, we’ll show you how to use REGEX on Looker Studio (previously Google Data Studio) with real step-by-step examples. From one marketer to another: I’ll try to make this easy and quick to implement for you. Personally, I think that using Regular Expressions is a must if you want to create useful reports in Looker Studio. For instance, I use them to analyze my SEO and Google Analytics traffic reports in terms of content categories. I check these reports every week, so I’m confident you’ll find them useful, too. You can also learn how to use regex on
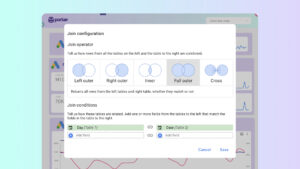
How to blend data on Looker Studio (real examples)
In this tutorial, we’ll learn how to blend data on Looker Studio, and we’ll see step-by-step examples of how to do it. We made a video that will show you how to do it: What is data blending? Data blending is the process of merging two or more tables from the same or multiple sources. This allows you to create custom tables and calculations When we create reports in Google Looker Studio, it is very common to want to combine different data sources to create more complete visualizations. One example is the total amount spent on ads from
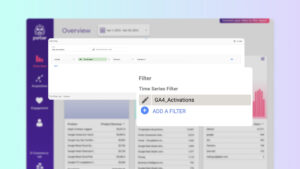
How to create filters on Looker Studio
In this comprehensive guide you will learn how to create filters on Looker Studio, based on real examples. I’ll show you how to create basic filters without knowing anything about coding or design. Here you have a step-by-step video on how to create a filter in less than 4 minutes: How do I add a filter to a Looker Studio chart? To add a filter and customize your Looker Studio report, open your report, click on ‘Resource’ and select ‘Manage filters’. 6. Remember to add a name to your filter and click SAVE to create the filter. (Optional) If you’re
7 best Marketing reporting and dashobards tools we tested in 2024
Review the best Marketing reporting tools by features, pricing, user experience, and reviews
7 best Digital agency reporting and dashobards tools we tested in 2024
Review the best Digital agency reporting tools by features, pricing, user experience, and reviews
7 best Business reporting and dashobards tools we tested in 2024
Review the best Business reporting tools by features, pricing, user experience, and reviews
7 best White-label reporting and dashobards tools we tested in 2024
Review the best White-label reporting tools by features, pricing, user experience, and reviews
7 best Social media reporting and dashobards tools we tested in 2024
Review the best Social media reporting tools by features, pricing, user experience, and reviews
7 best Google Looker Studio reporting and dashobards tools we tested in 2024
Review the best Google Looker Studio reporting tools by features, pricing, user experience, and reviews
7 best Google Sheets add-ons reporting and dashobards tools we tested in 2024
Review the best Google Sheets add-ons reporting tools by features, pricing, user experience, and reviews
7 best E-commerce reporting and dashobards tools we tested in 2024
Review the best E-commerce reporting tools by features, pricing, user experience, and reviews
7 best B2B marketing reporting and dashobards tools we tested in 2024
Review the best B2B marketing reporting tools by features, pricing, user experience, and reviews
7 best DTC reporting and dashobards tools we tested in 2024
Review the best DTC reporting tools by features, pricing, user experience, and reviews
7 best Funnel reporting and dashobards tools we tested in 2024
Review the best Funnel reporting tools by features, pricing, user experience, and reviews
7 best Local SEO reporting and dashobards tools we tested in 2024
Review the best Local SEO reporting tools by features, pricing, user experience, and reviews
7 best SEM reporting and dashobards tools we tested in 2024
Review the best SEM reporting tools by features, pricing, user experience, and reviews

