Free course: Google Data Studio for digital marketers
In about one hour, learn to answer questions and tell stories with your marketing data—all on Google Data Studio.
In about one hour, learn to answer questions and tell stories with your marketing data—all on Google Data Studio.

SaaS marketer and consultant, Google Data Studio instructor at Platzi, MDA Latam and Head of Product and Marketing at Porter
Learn to monitor your social media efforts and its impact for your business.
Get familiar with the Google Marketing and Cloud ecosystem by connecting and visualizing your accounts’ data.
Create your free Google Data Studio account and get to know the user interface and capabilities.
Understand why data visualization and Google Data Studio matters more than ever for every marketing team, agency or startup.
See how other companies use Google Data Studio to report their marketing.
Get to know the Google Data Studio connectors library to acknowledge its potential and limitations when it comes to connect your favorite marketing apps.
Learn to create and account and do your first connection to a Google Sheet.
Metrics and dimensions are the main components to structure a query and answer your questions with data. We share some examples to make sure you learn to use them properly.
In a few minutes, learn to display your first charts, build your dashboards, and interpret the metrics you’re visualizing on Google Data Studio, the most important analytics tool in any digital marketing stack.
Understand who's your audience based on actual website traffic data; break down your audience by demographics, interests, devices, and more.
Learn to visualize your most important traffic and conversion acquisition channels, based on the last-click attribution model, the Google Analytics default option.
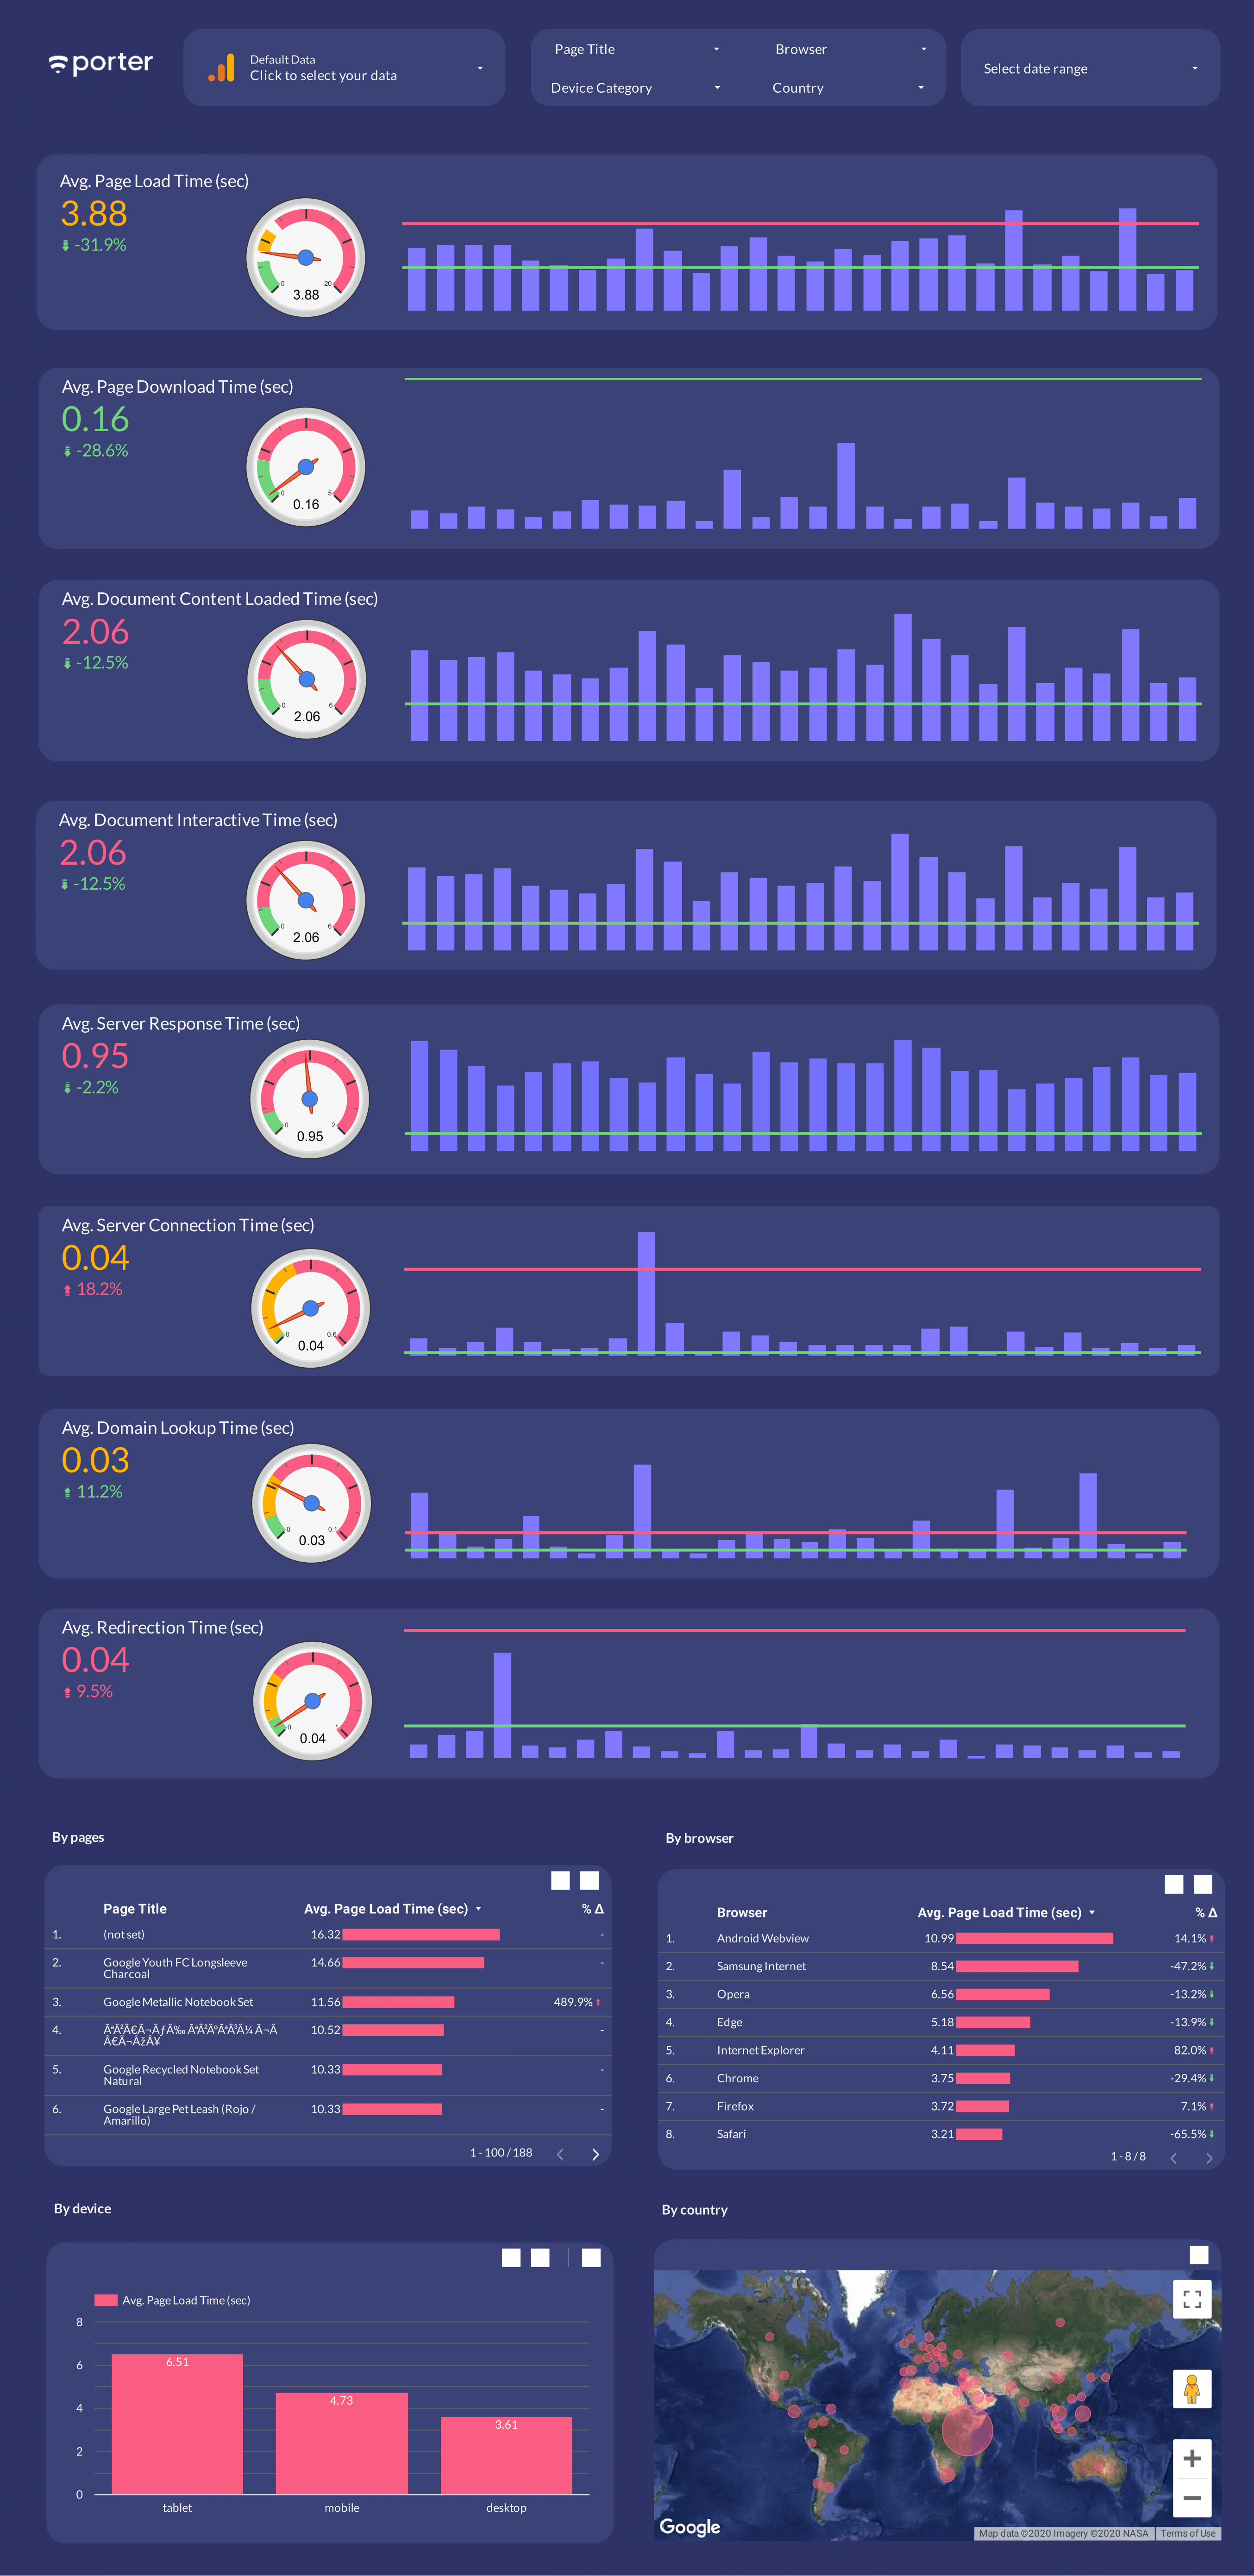
Monitor UX metrics across your webpages to find friction points; understand how your visitors are navigating your website.
Build an intuitive dashboard to know how your store is performing; visualize top products, revenue, acquisition channels, traffic, conversion rates, and more.
Perhaps, the most versatile and useful connector. By learning to connect Google Sheets, you'll be able to quickly create a report from any dataset.
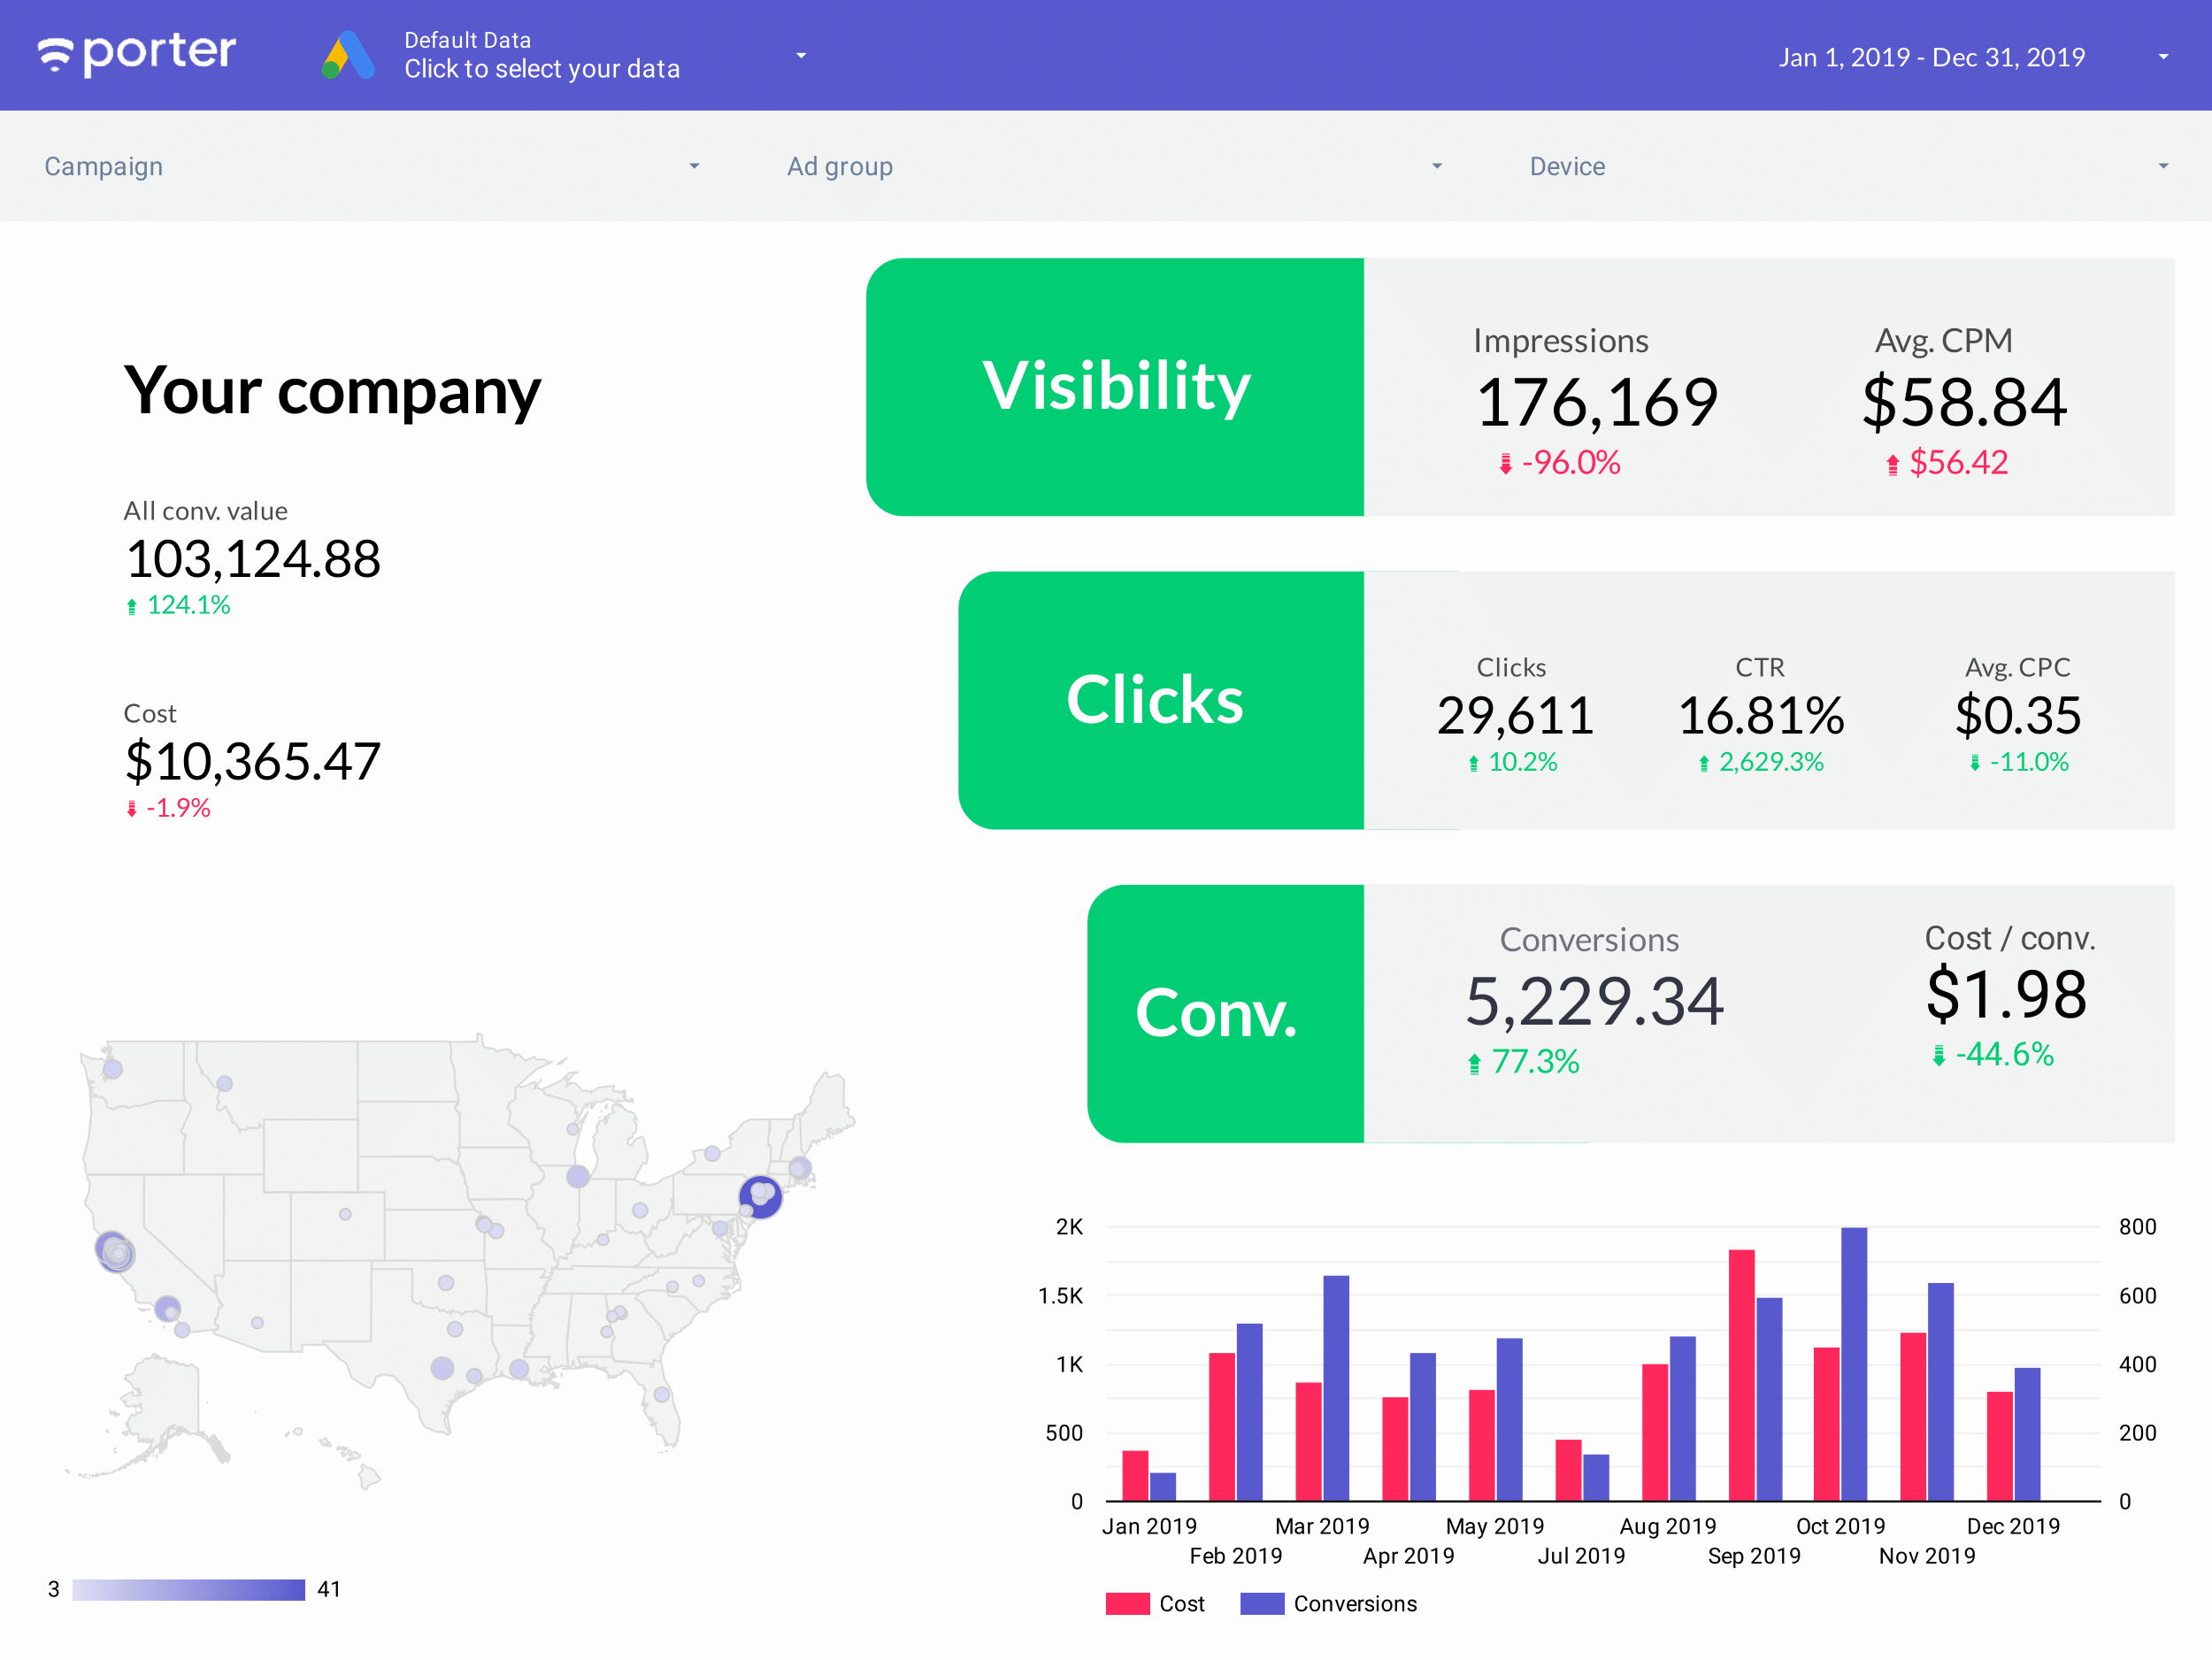
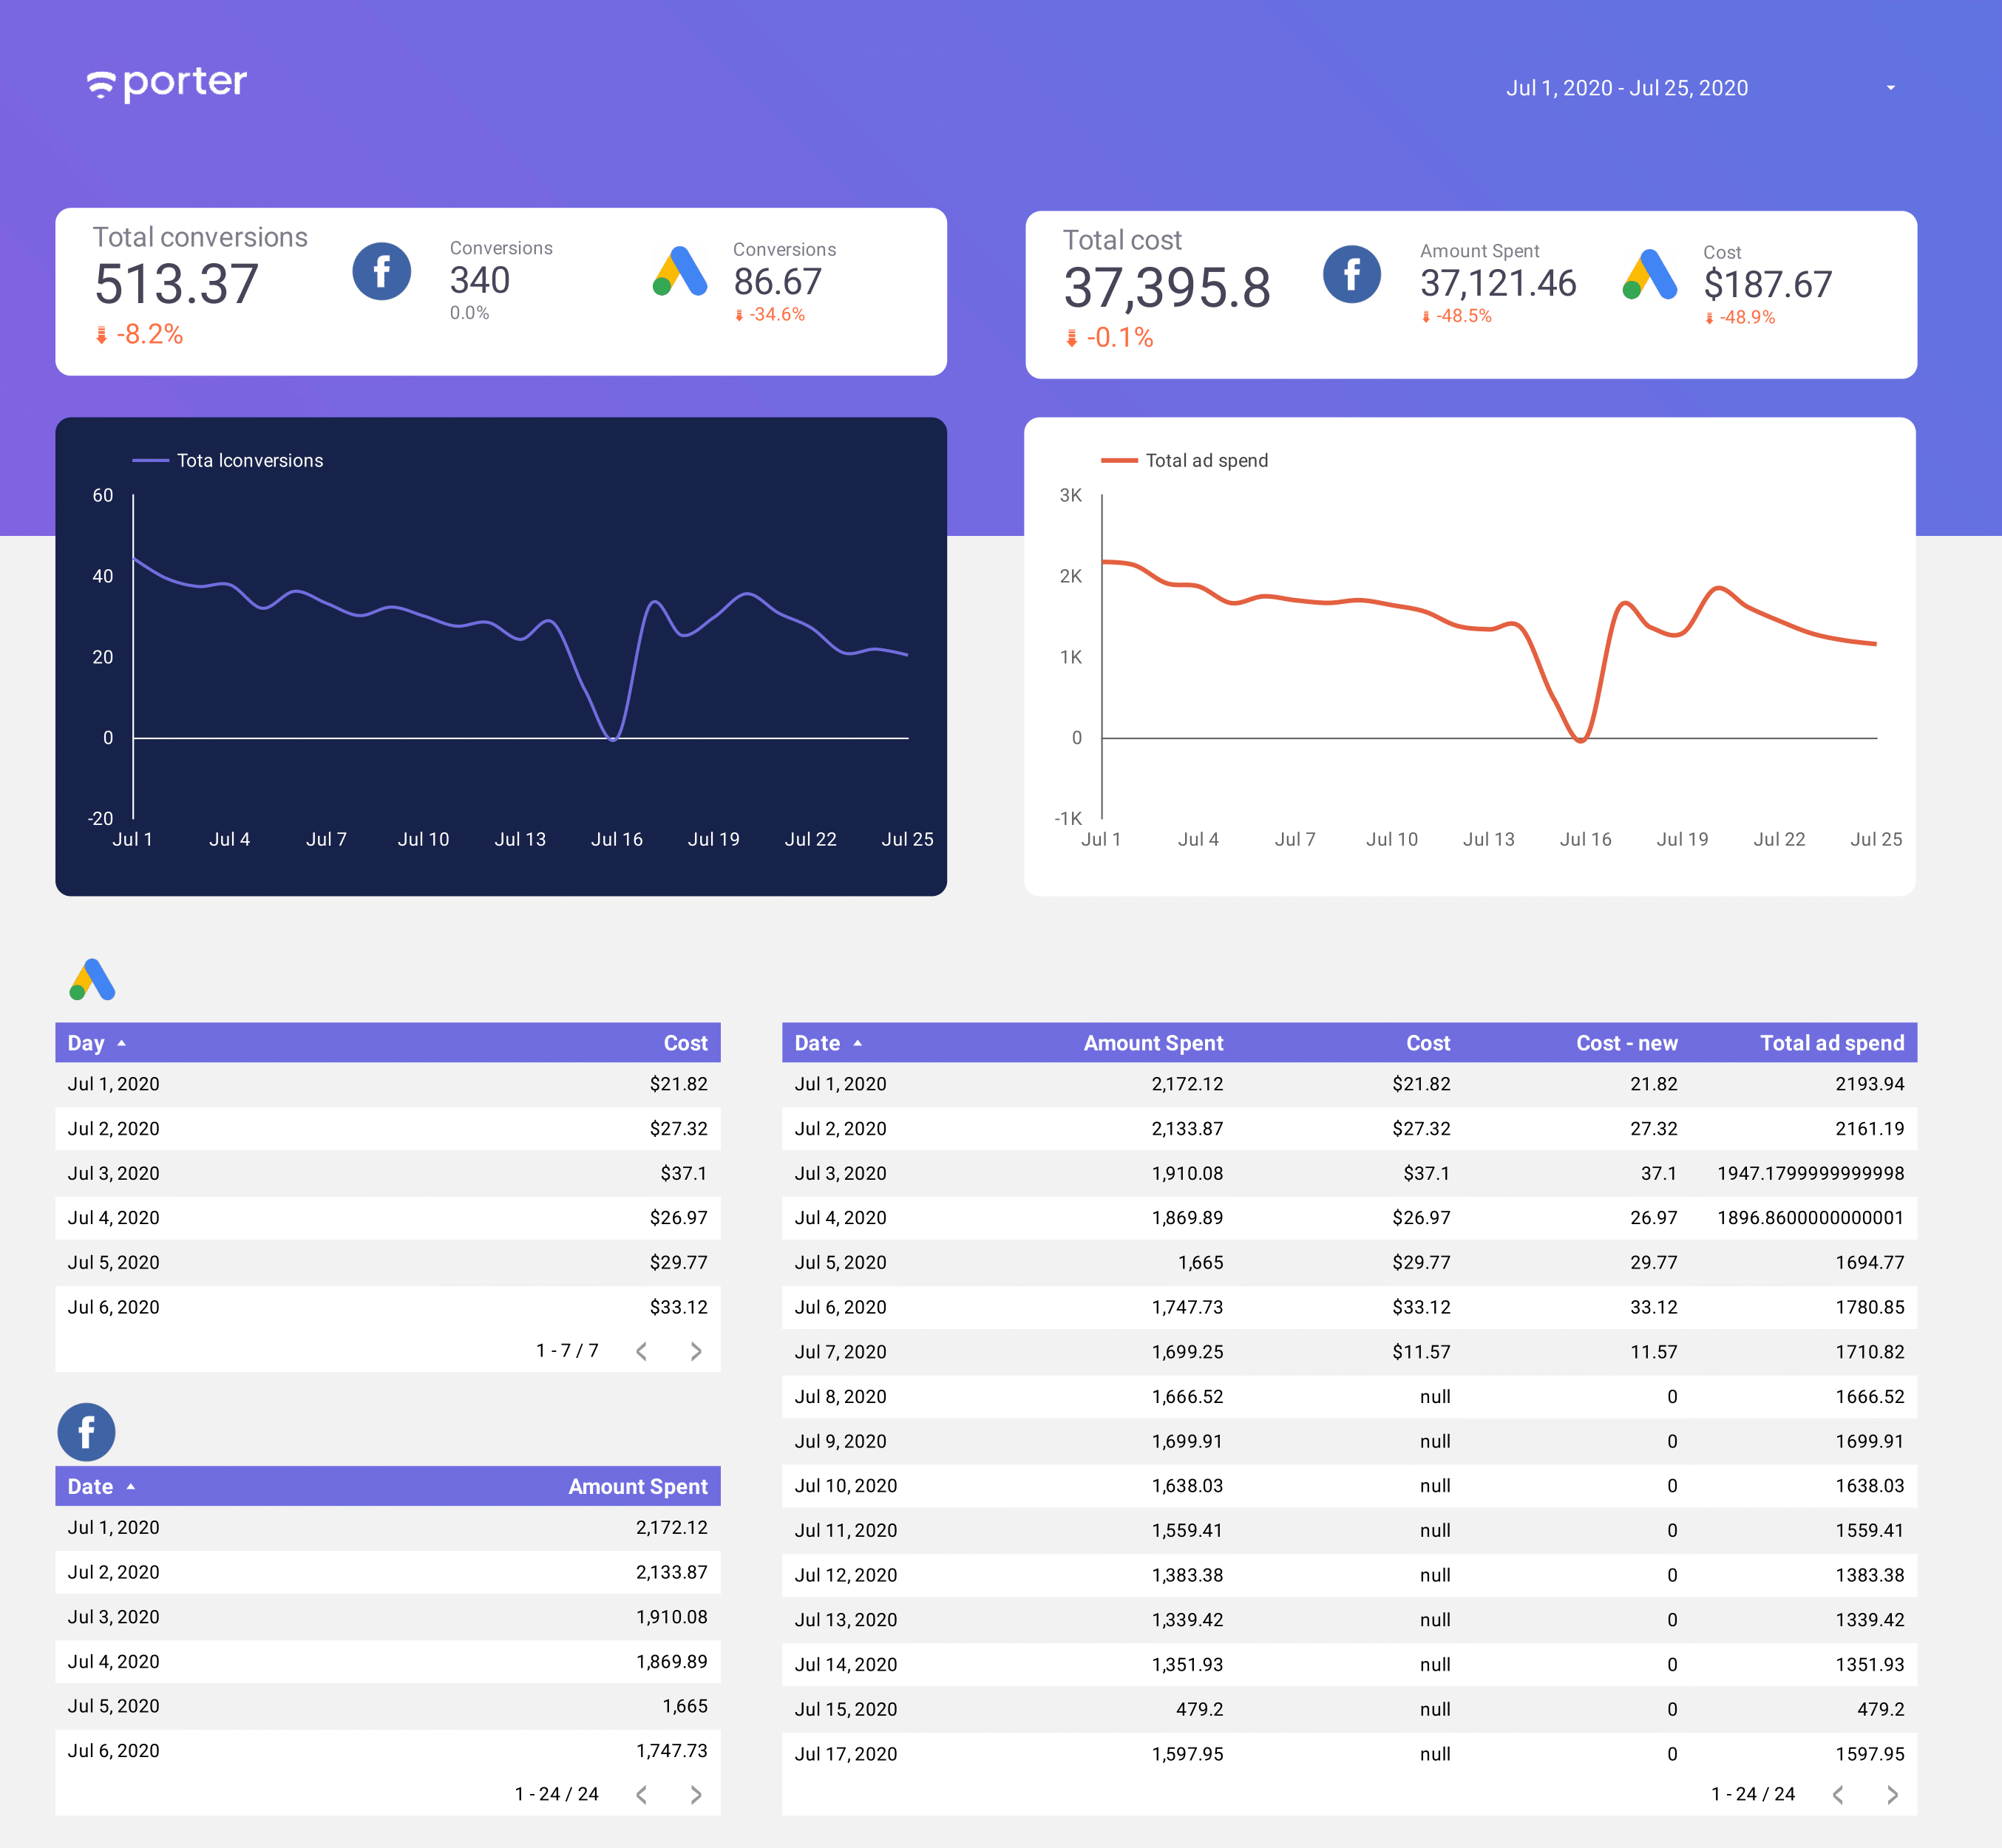
Learn to visualize your Google Ads funnel, find optimization opportunities, and present better your performance results with your team and customers.
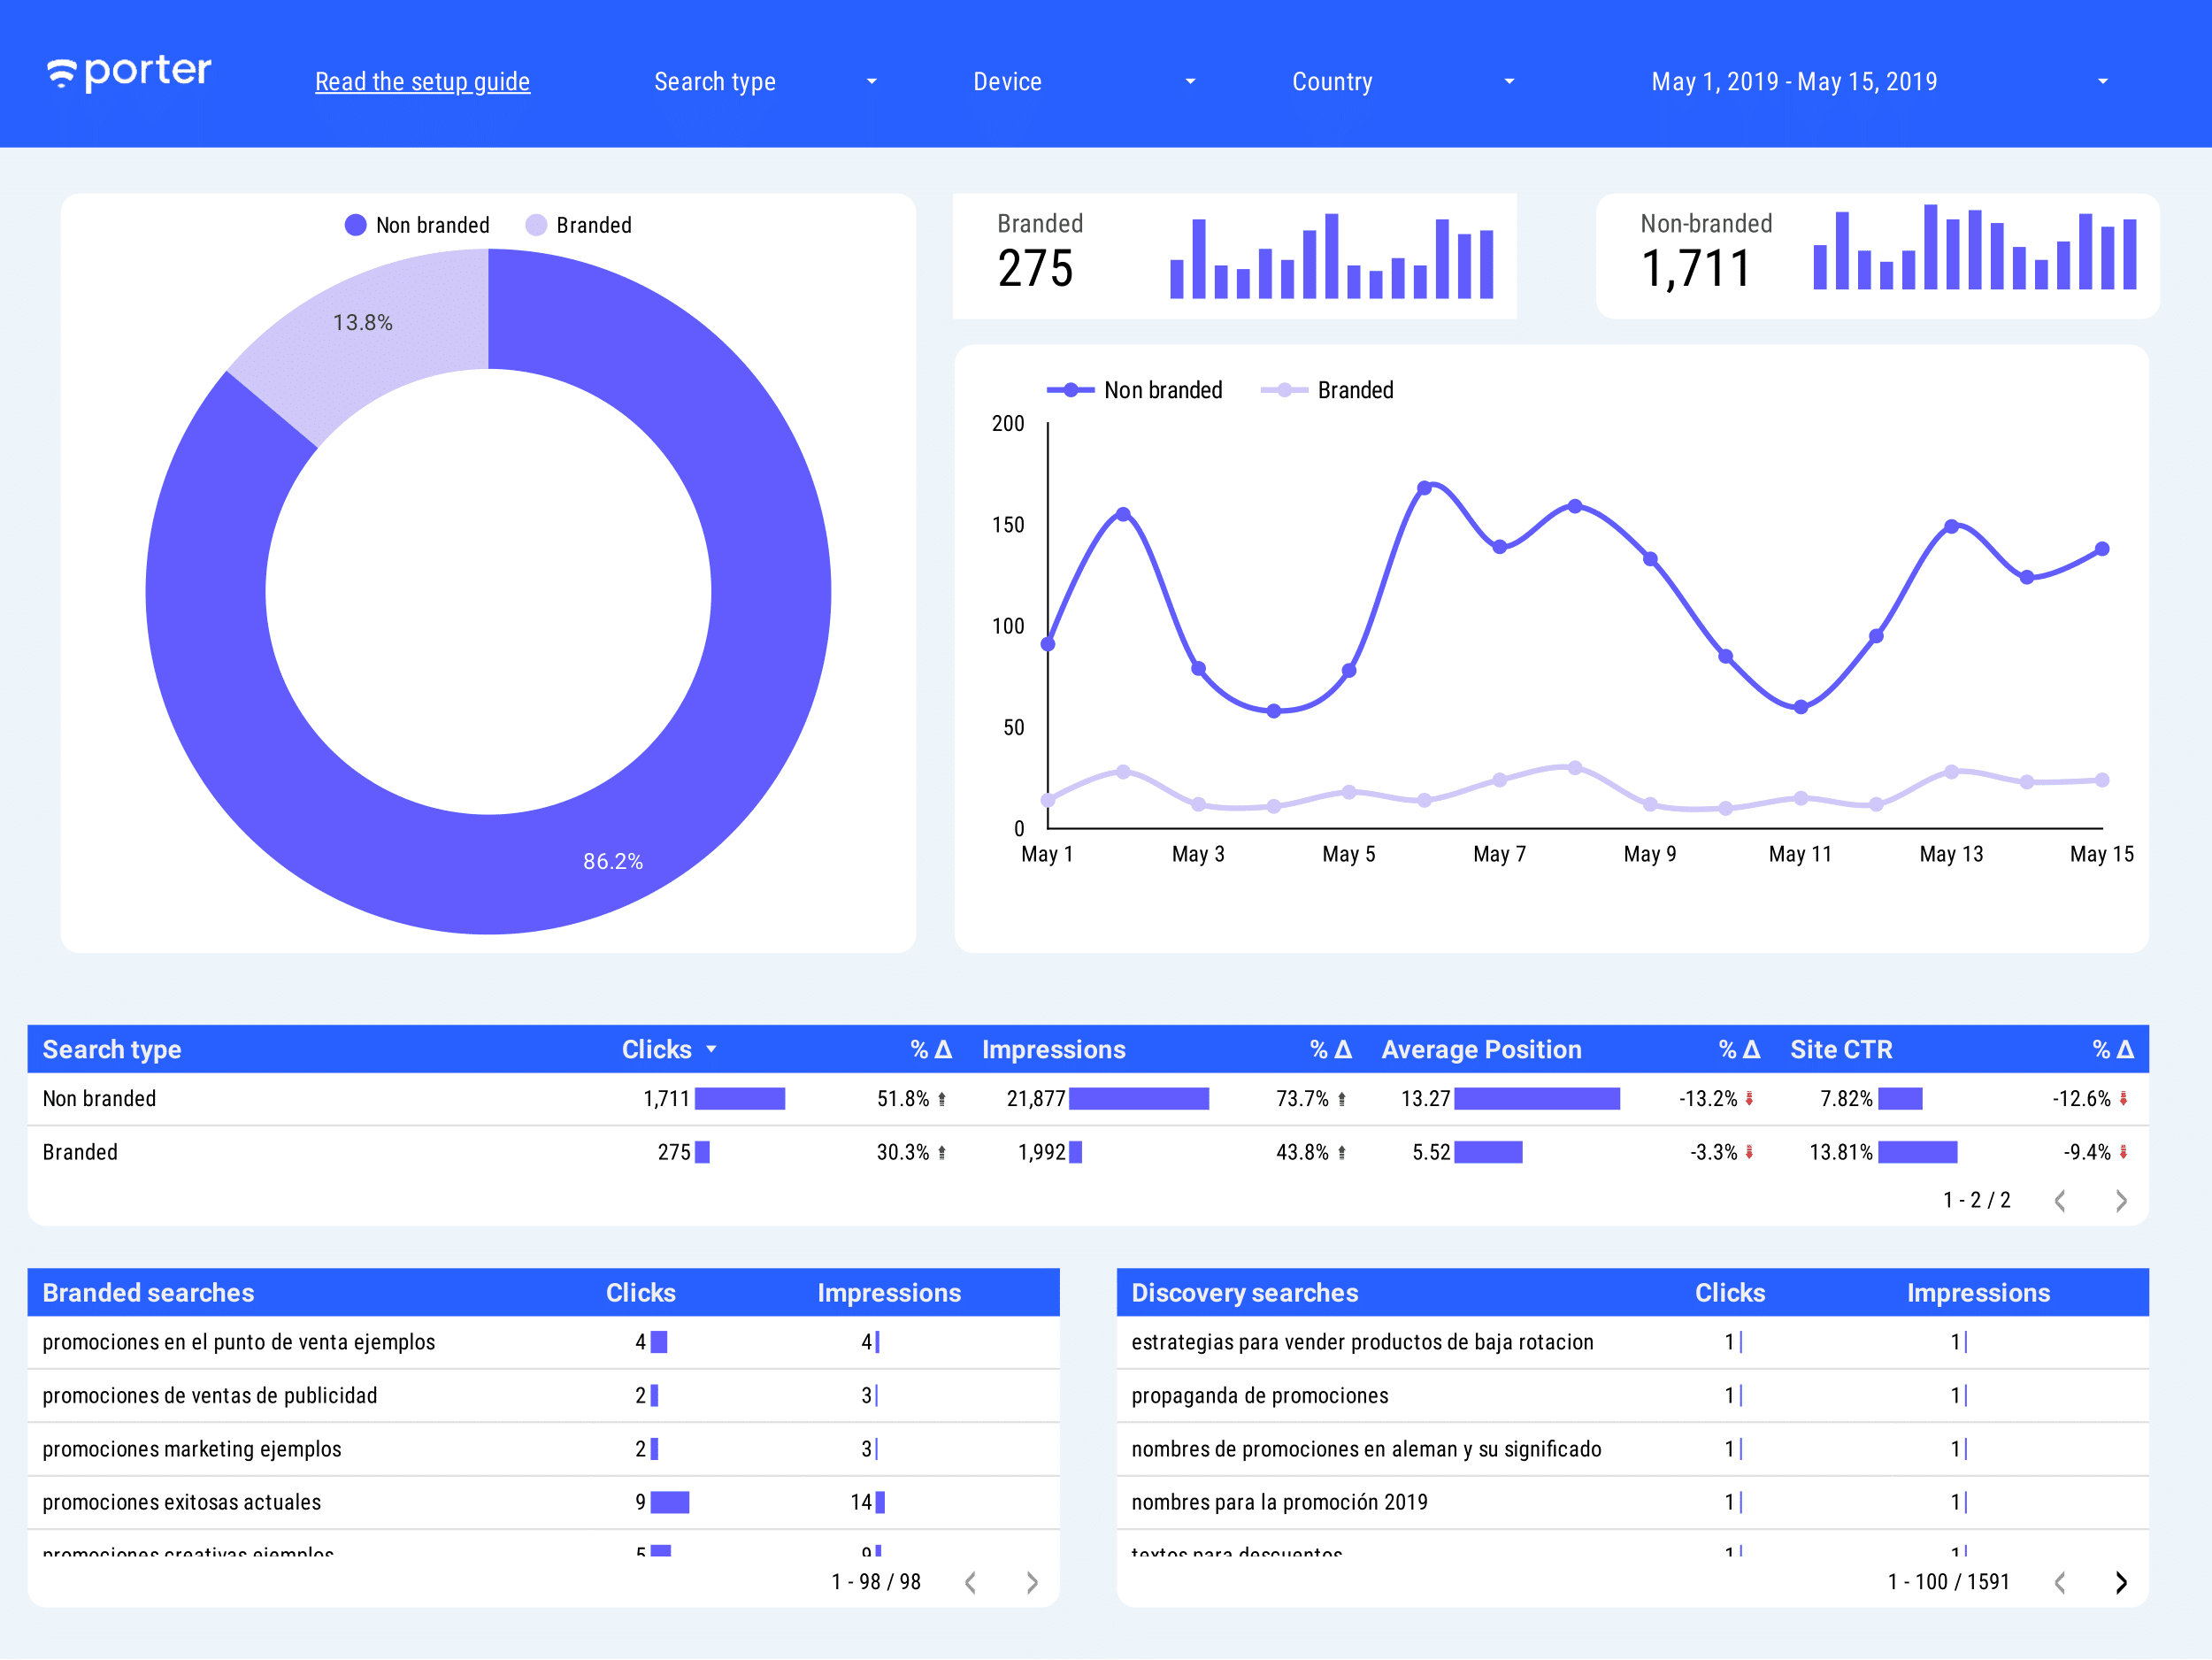
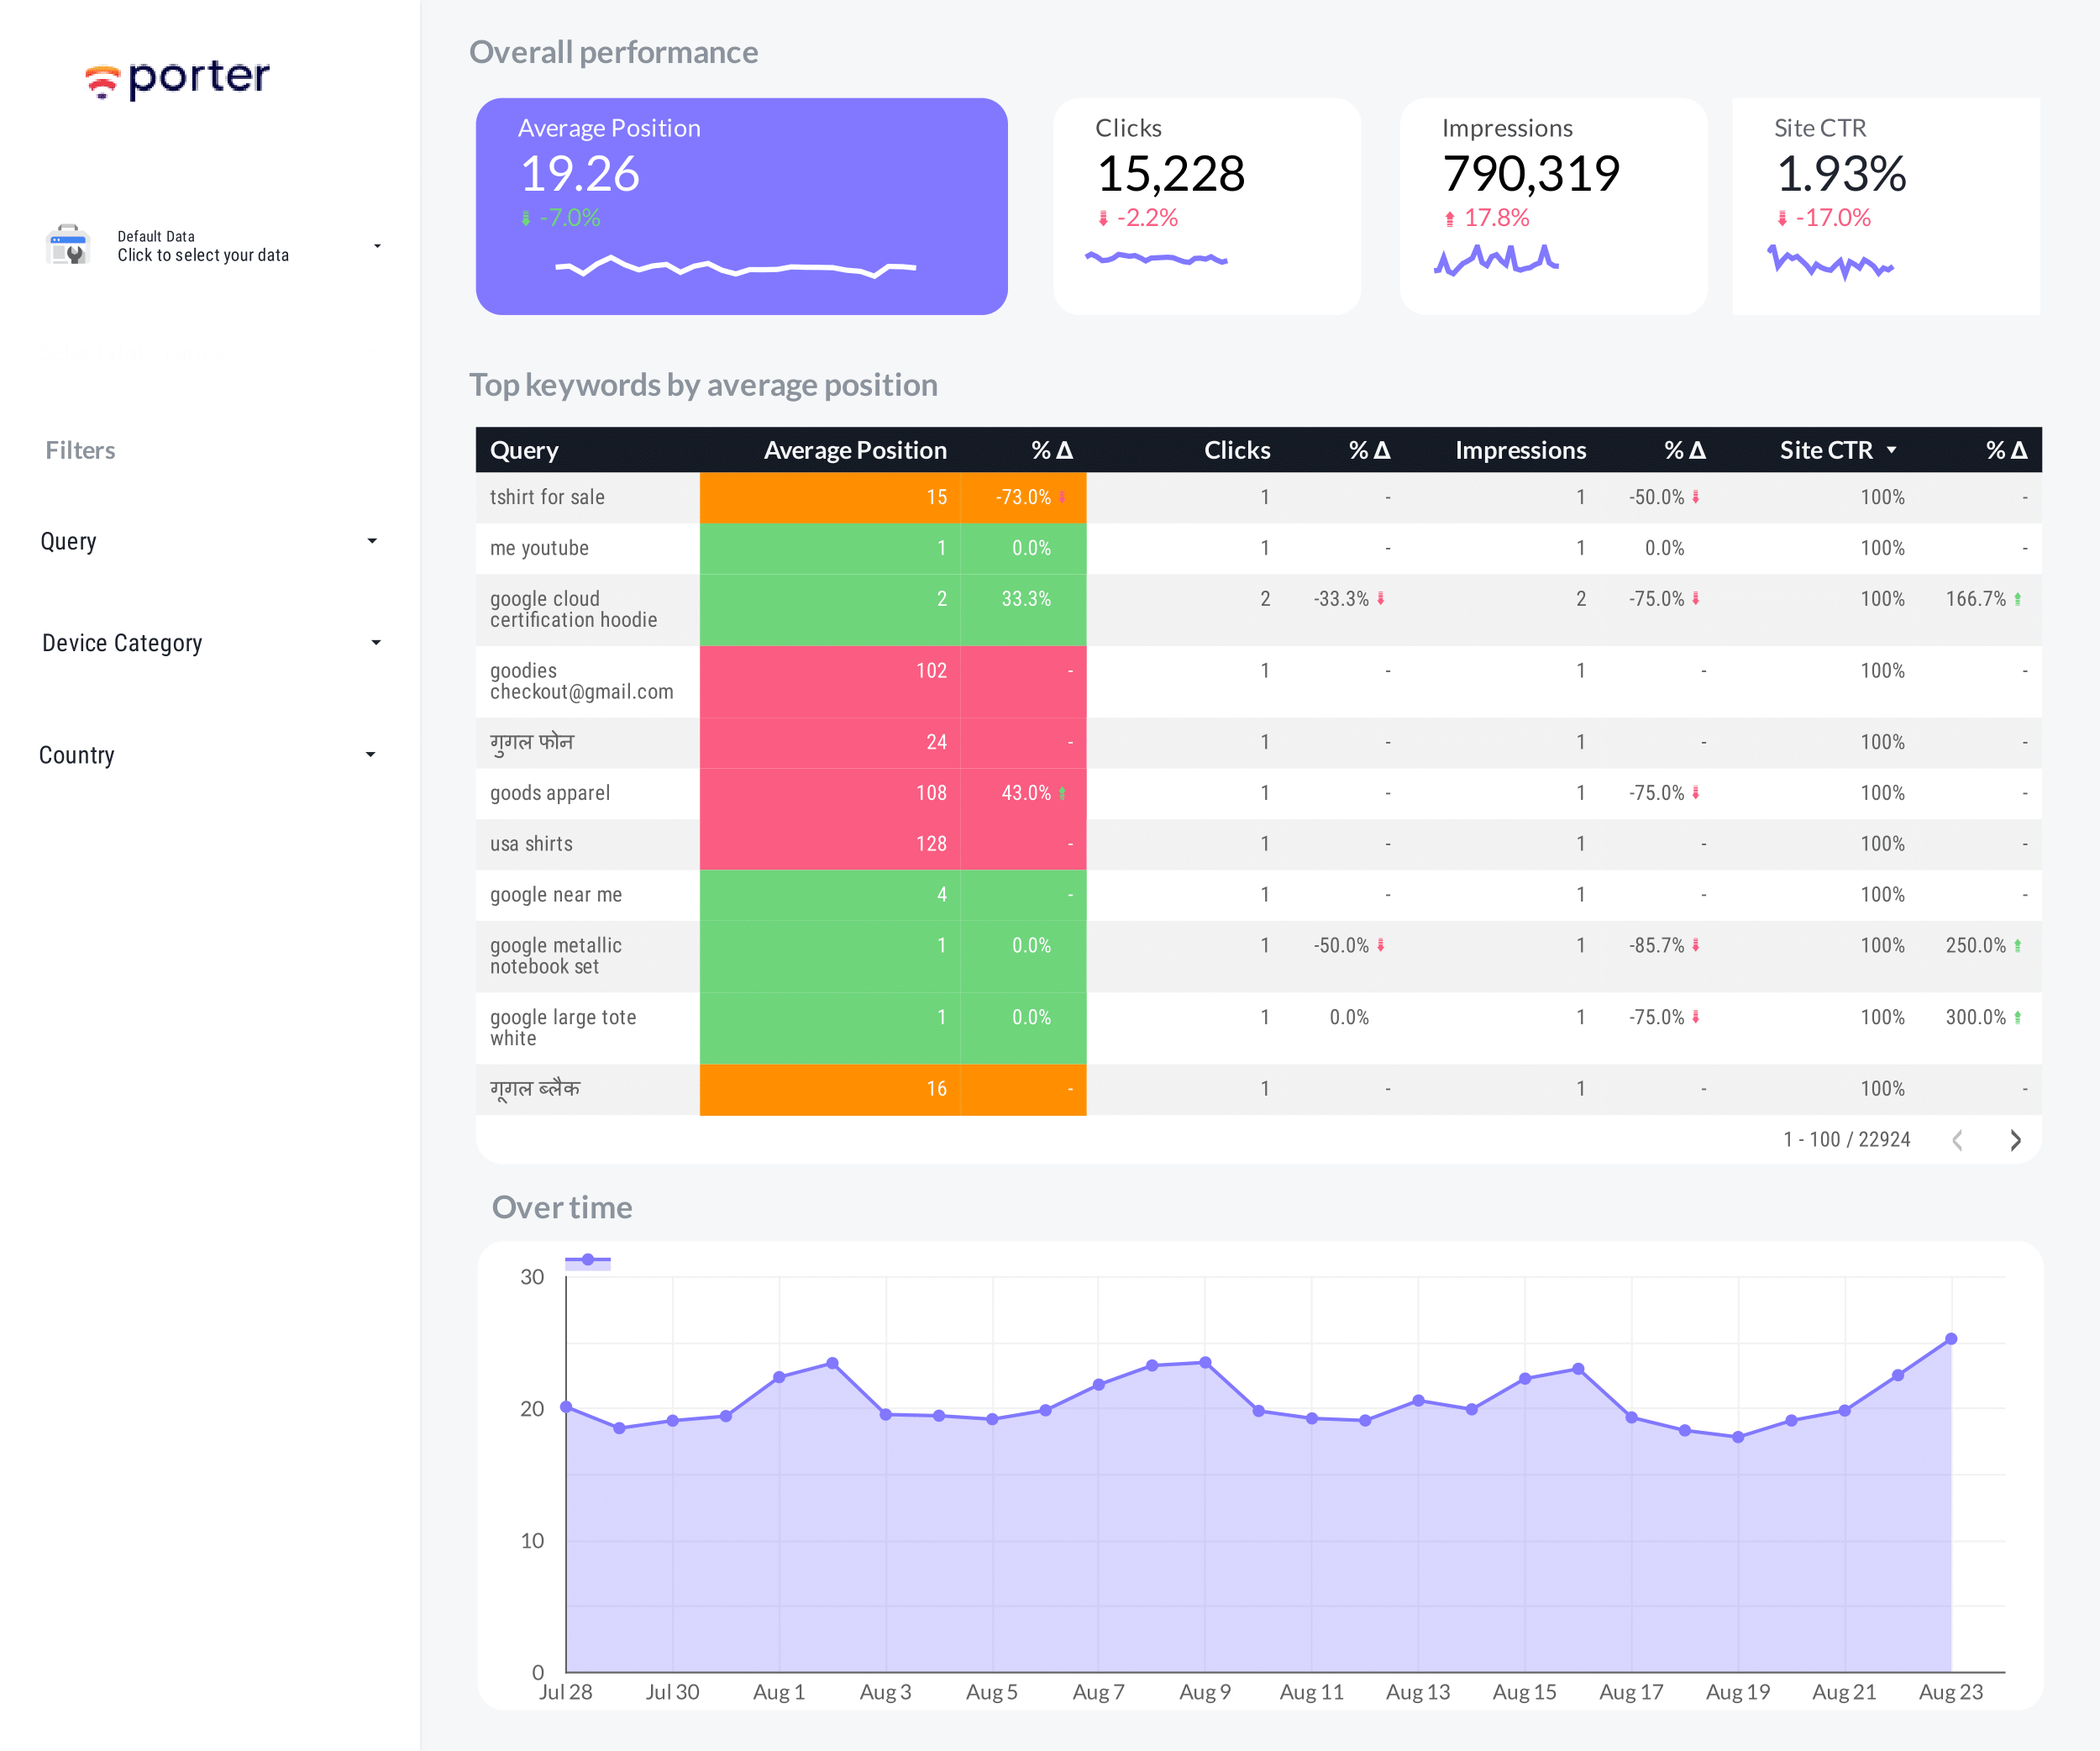
Google Search Console is possibly the most underrated SEO tool. While it's free it offers valuable data to identify optimization opportunities. With Google Data Studio you will be able to find cannibalization potential, build your own ranking tracker, and present reports people actually understand and care about.
Learn to measure and share your Youtube marketing efforts with channel, video engagement, and audience metrics with the free Youtube connector for Google Data Studio.
Learn to connect SQL and Big Query tables to Google Data Studio in a few minutes.
Go beyond the tables the Facebook Ads Manager offers and learn to visualize and analyze your Facebook Ads data.
Quickly connect your Facebook Ads accounts to Google Data Studio by using Porter's connector.
Make sense of the hundreds of metrics and fields that you can visualize from Facebook Ads.
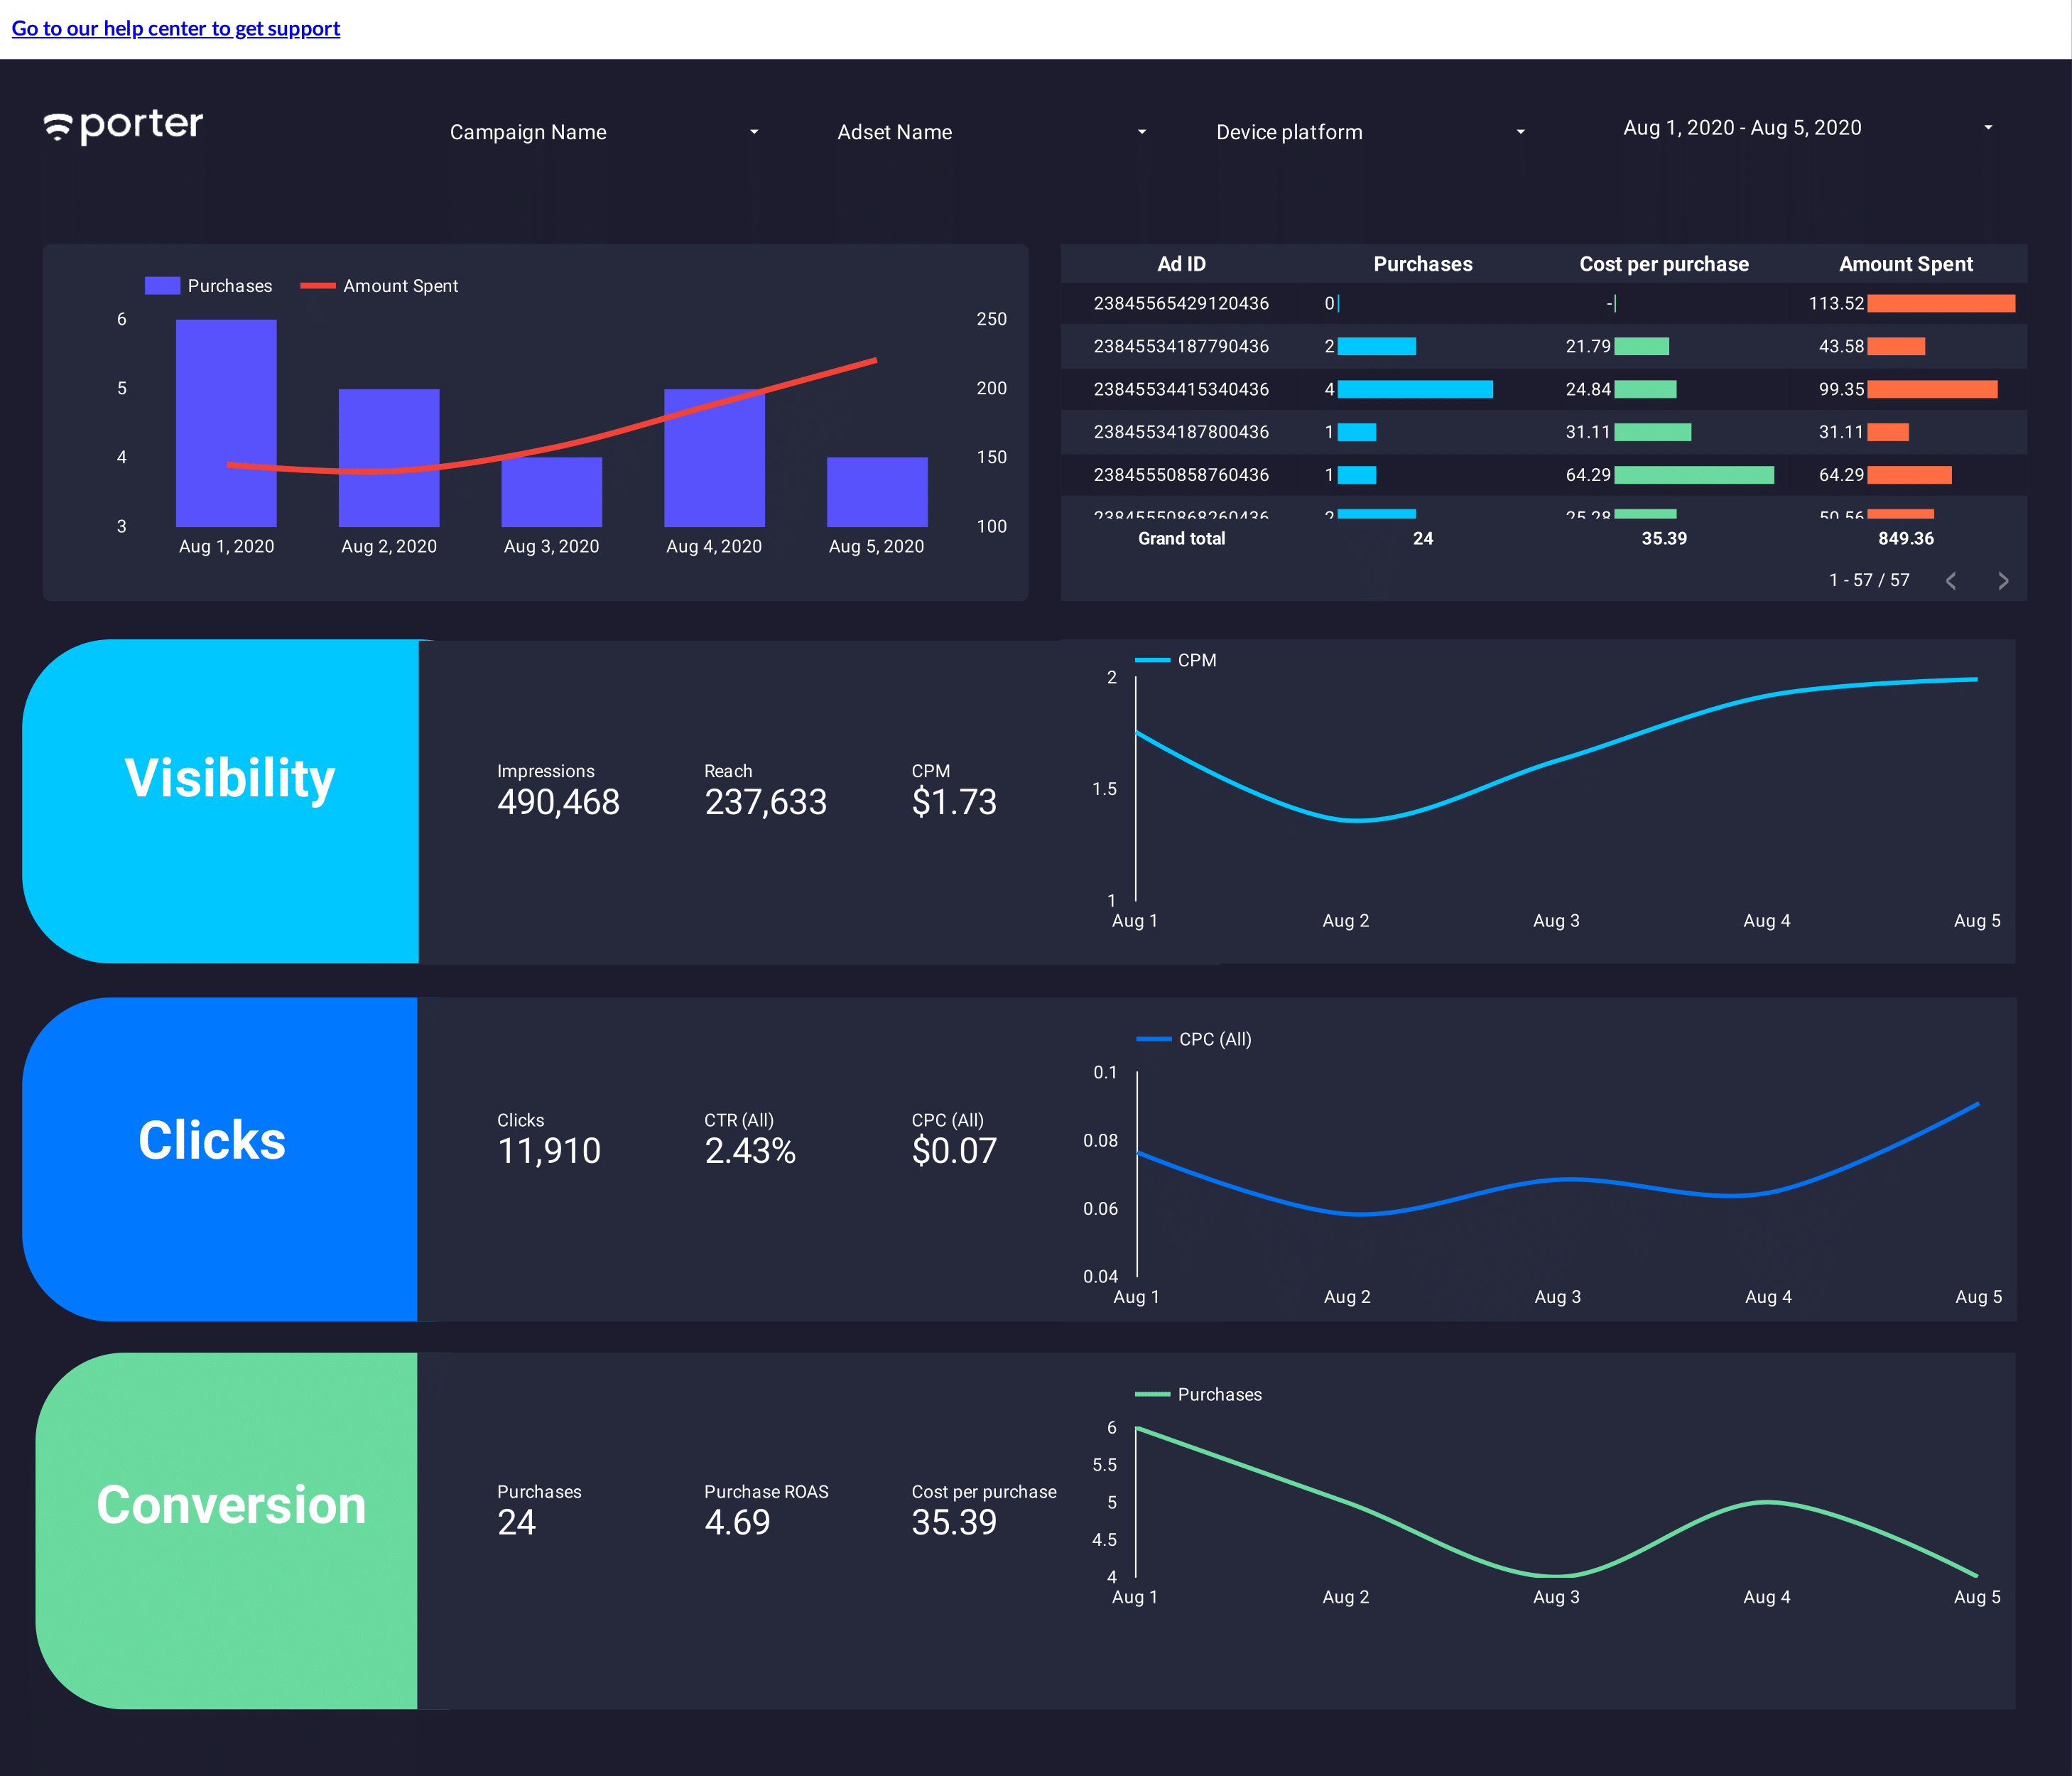
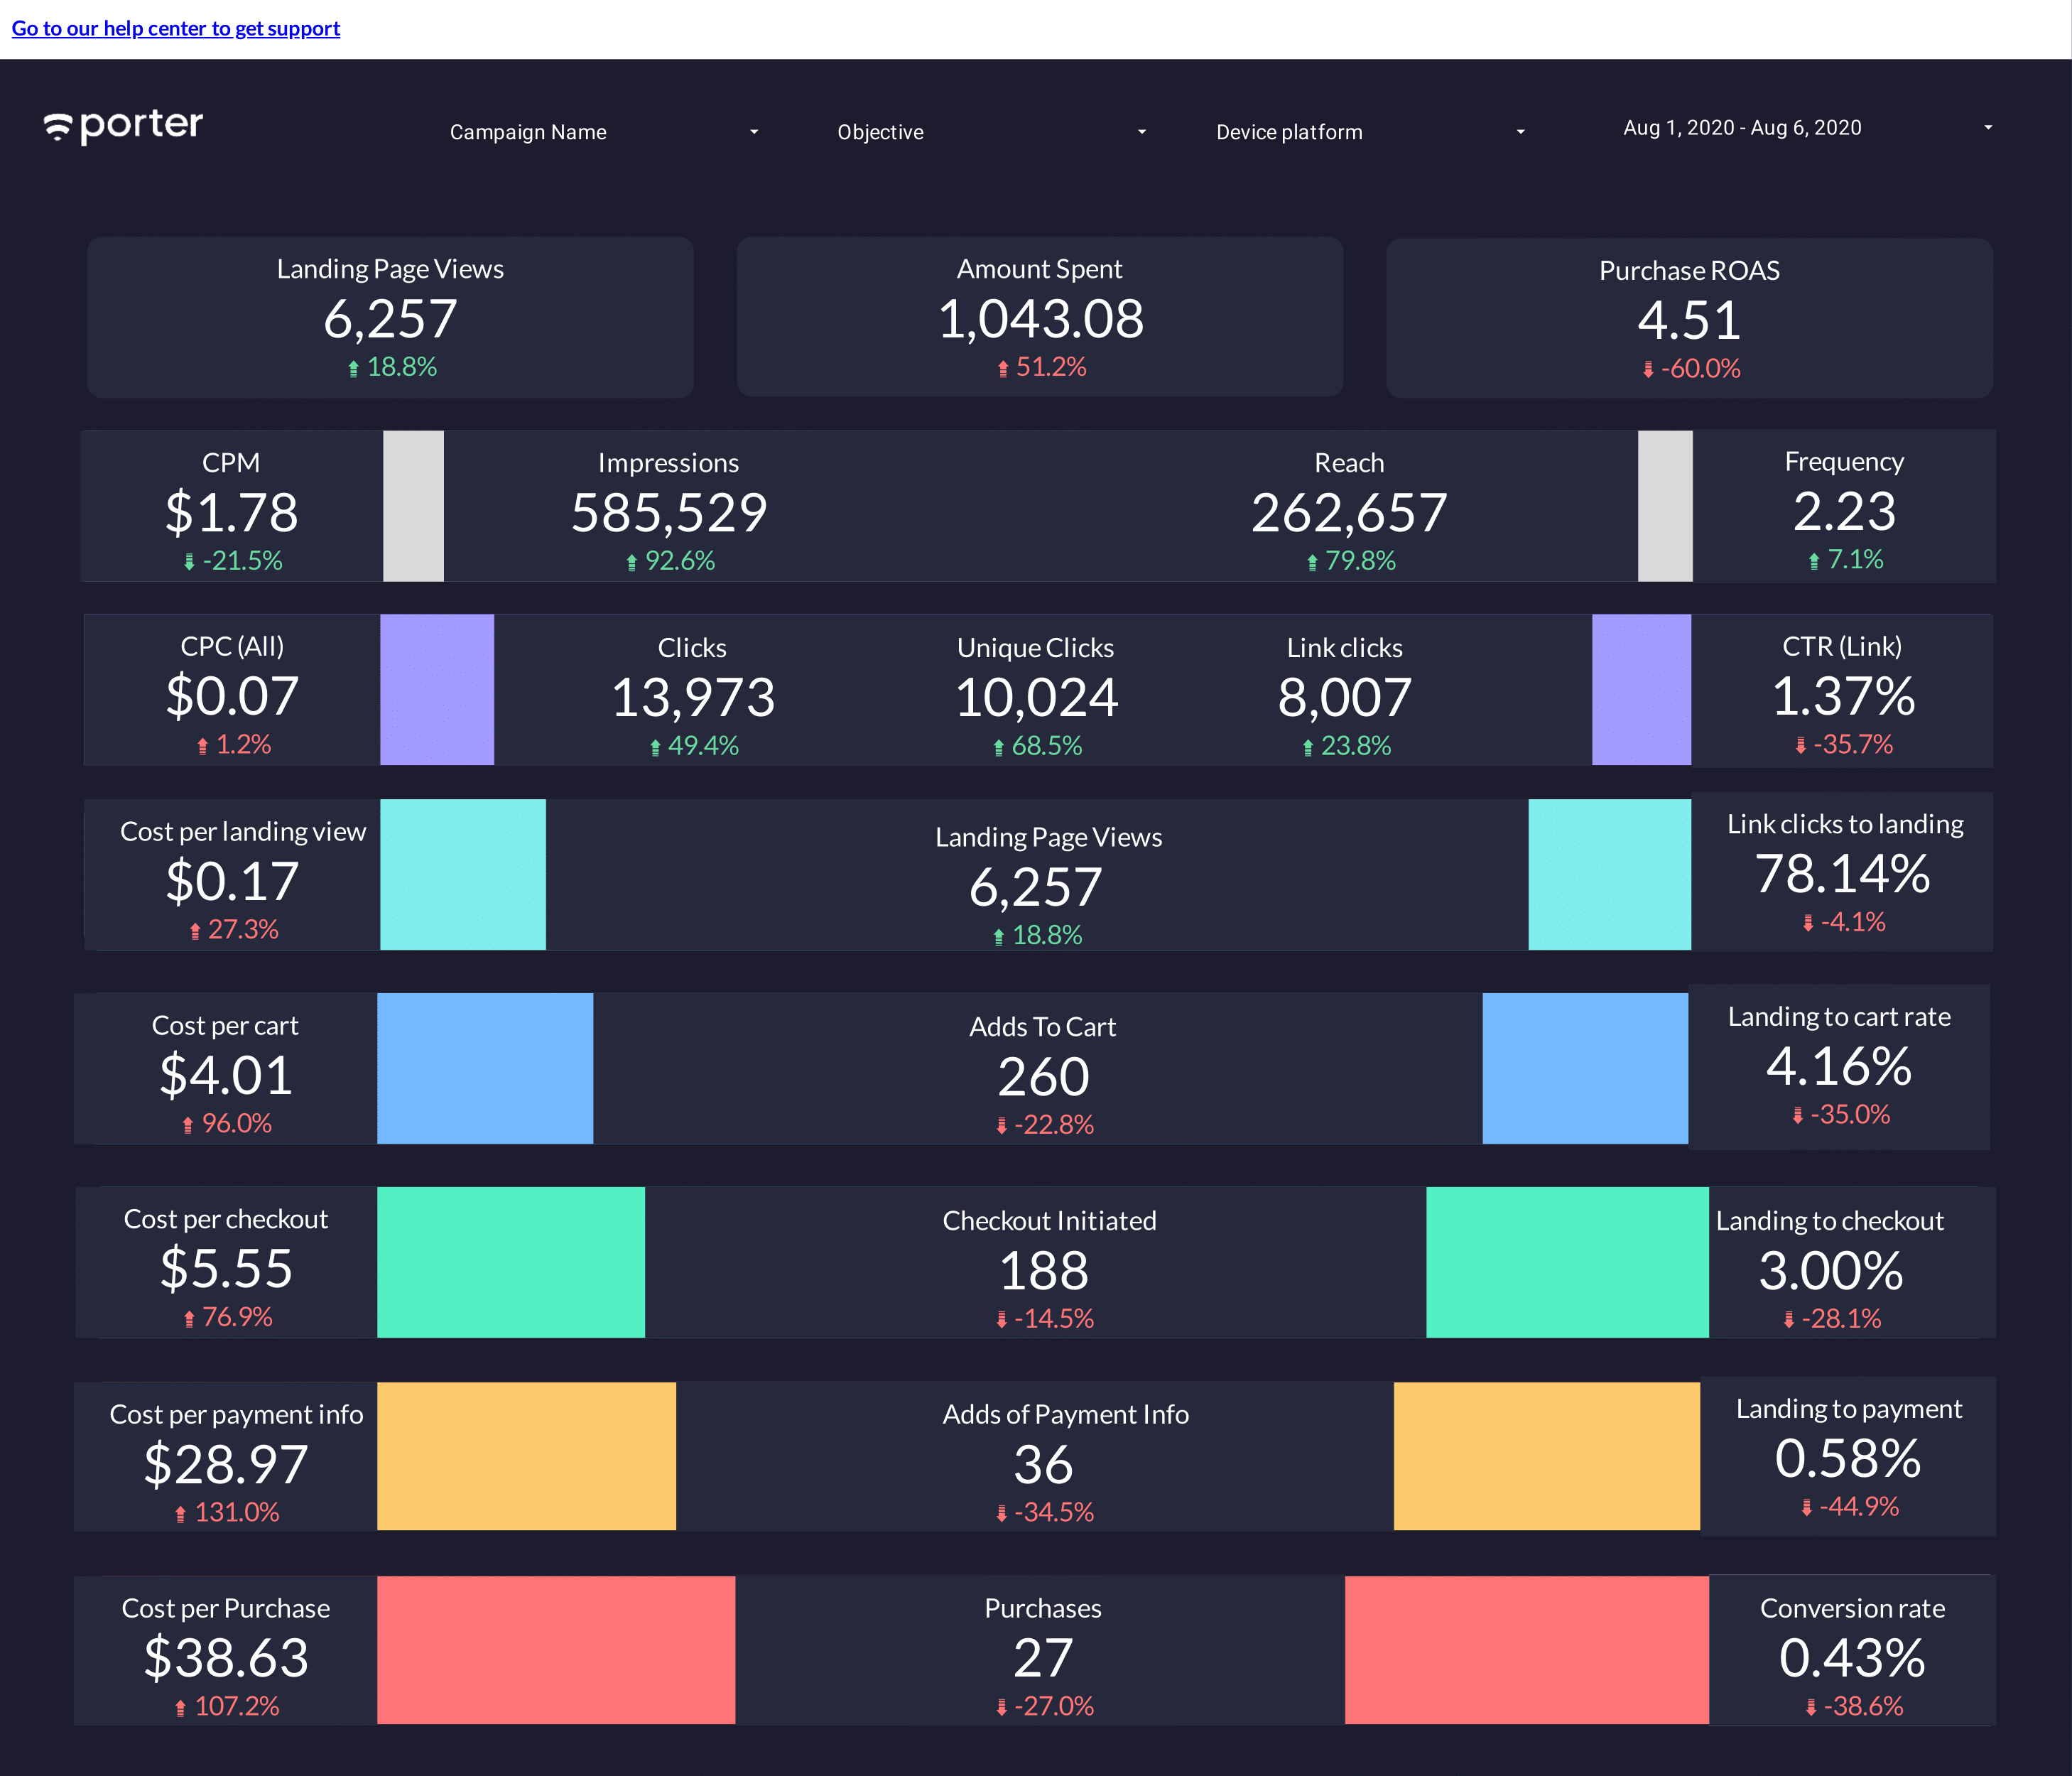
Visualize your e-commerce efforts by tracking standard events and metrics like ROAS, purchases, cost per purchase, and more.
Quickly build reports to review your lead generation performance on Facebook Ads.
Quickly find out your most engaging paid posts.
Analyze profile, audience, posts, and video performance.
Track your profile and posts visibility. Figure out if your Instagram influencer campaigns are working.
Learn every Google Data Studio feature, to create reports like a pro.
Break down your data through buttons, checkboxes, and queries. Learn to make your reports dynamic and interactive.
Just like Google Sheets, add colors to easily visualize if your metrics performance.
Learn to clean your data with internal filters for each visualization.
Schedule the delivery of your reports, convert to PDF, and restrict the access to only the users you want.
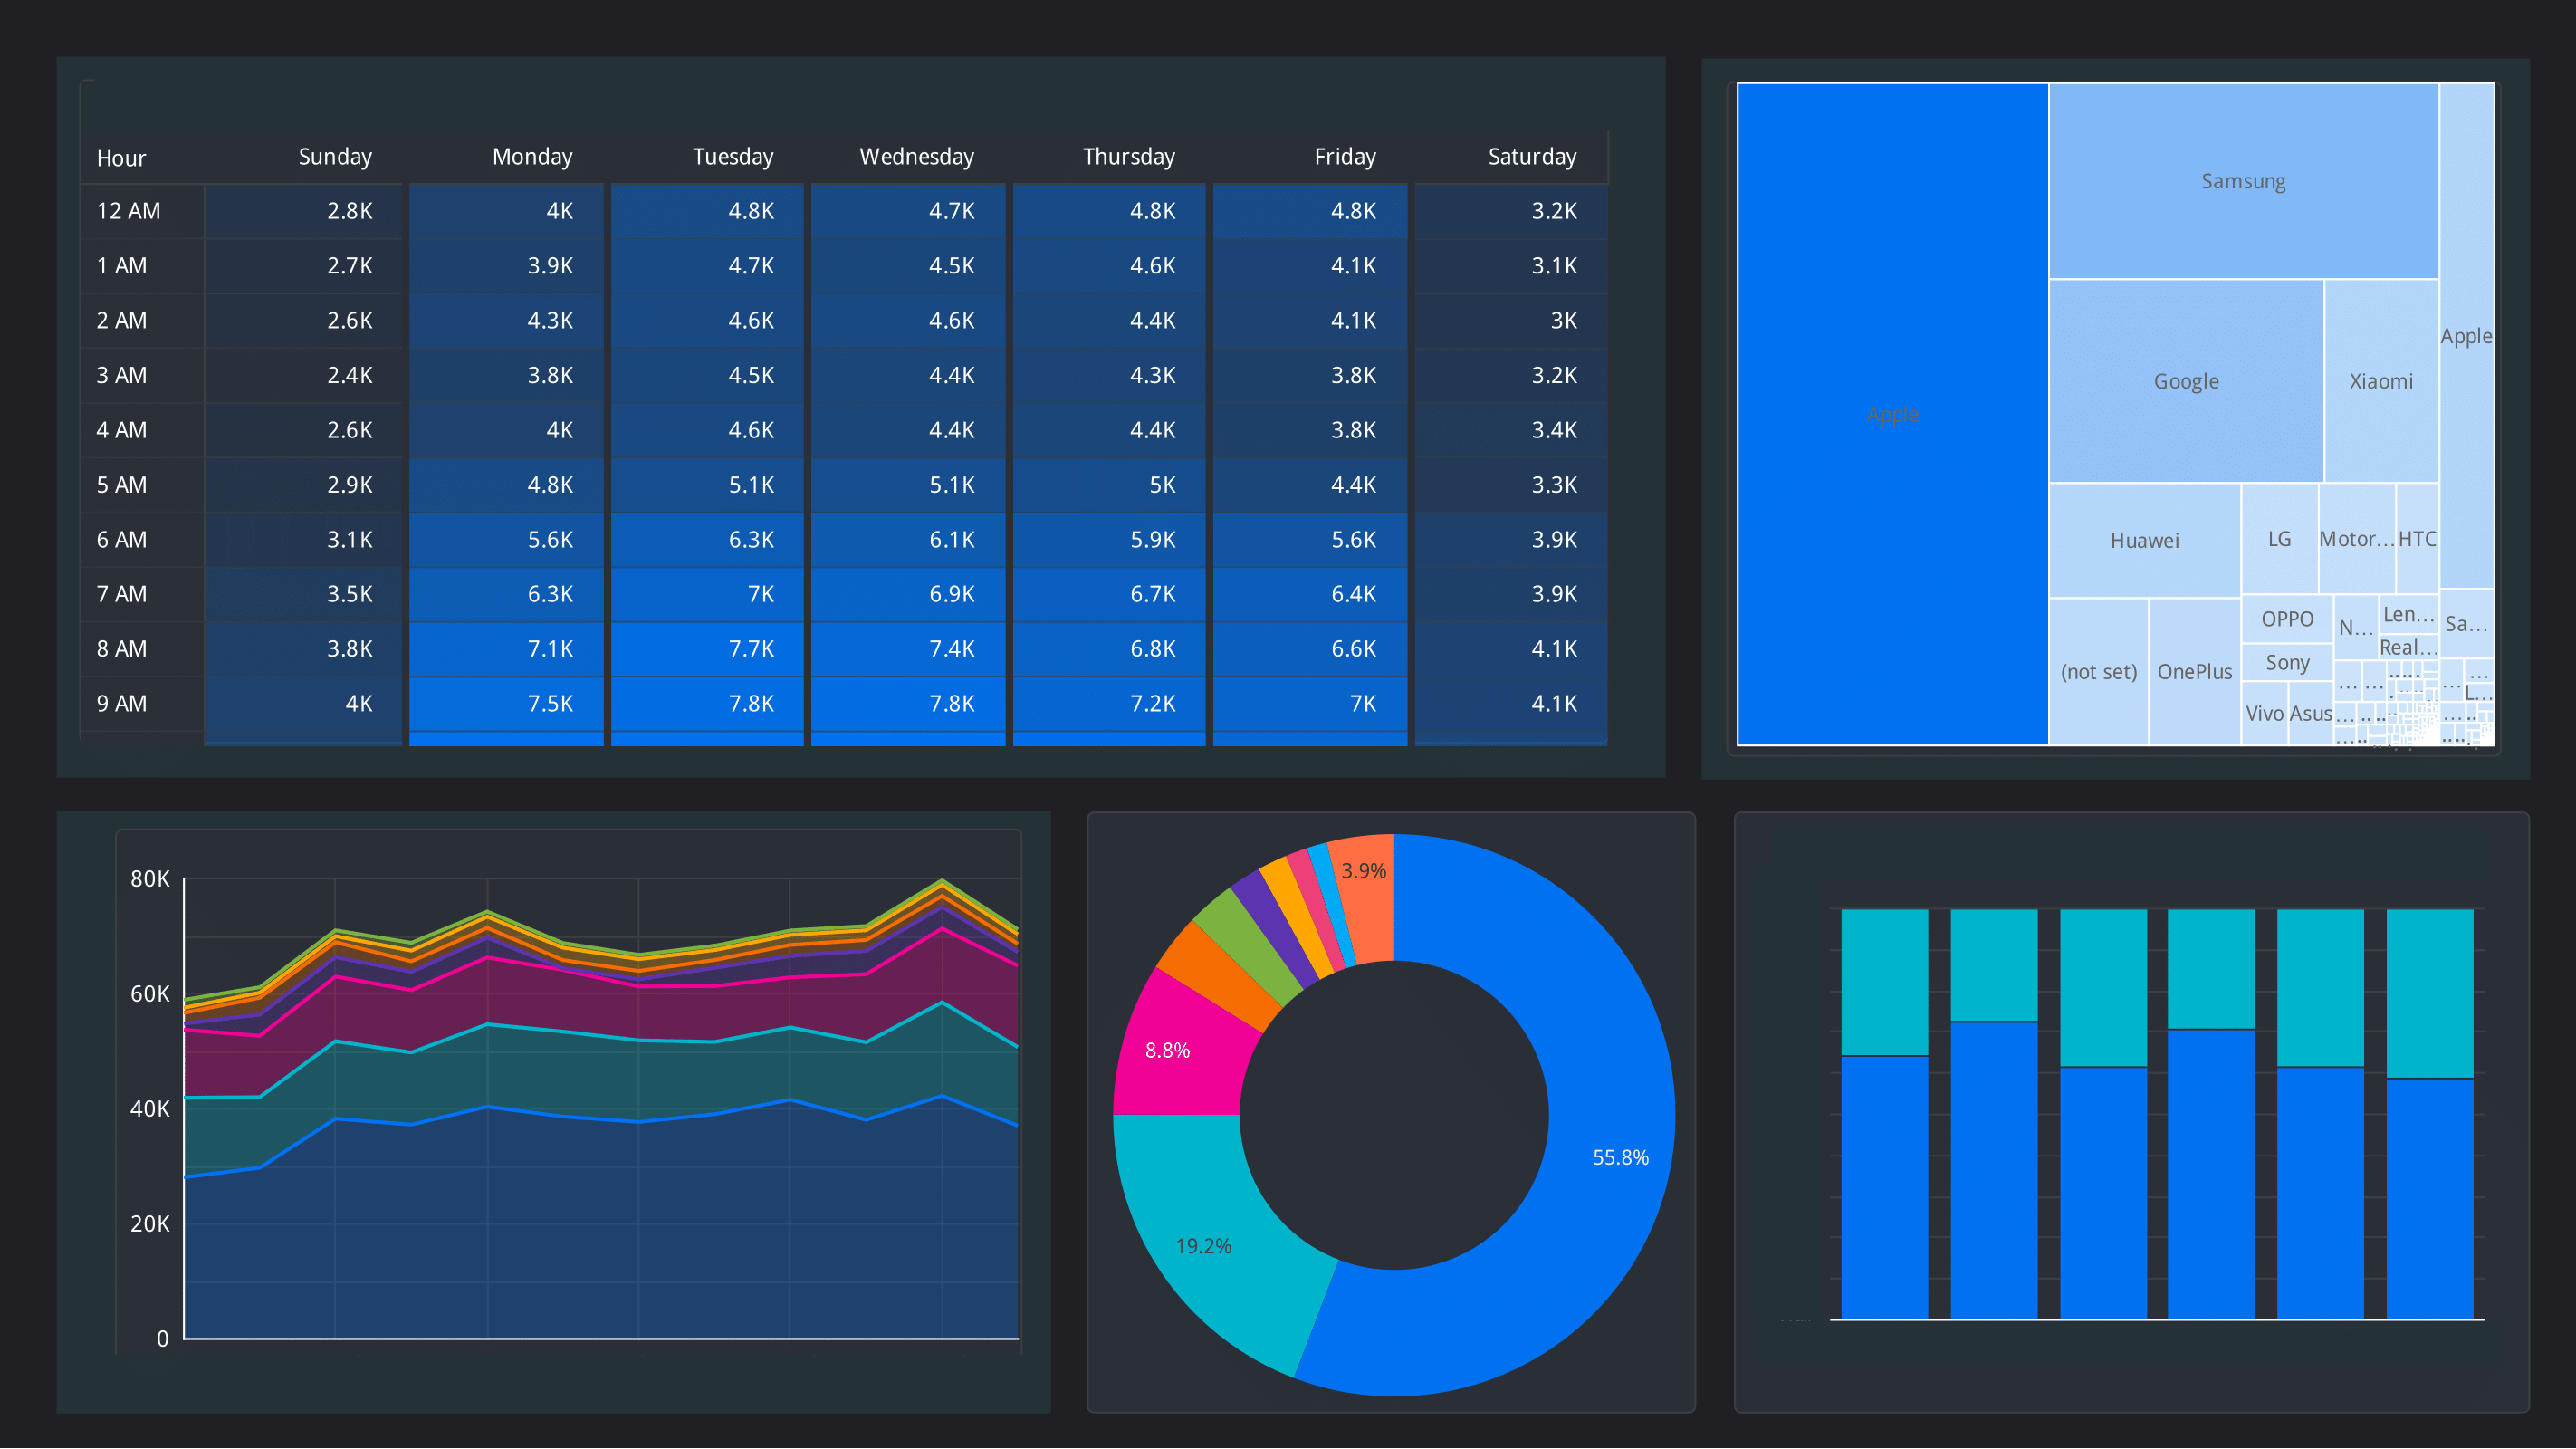
Learn to visualize your data by hour of the day, day, day of the week, week of the year, month, quarter, and more—all in the same charts.
Learn to toggle between metrics and dimensions within the same visualization.
Perhaps, the most powerful feature on Google Data Studio. Create custom metrics and dimensions with the Google-Sheet-like editor.
Install Google Analytics on your Data Studio reports just like you do on your website.
Learn to combine multiple data sources within a chart or creating custom formulas. Learn quick ways to solve common errors when joining databases.
Learn to choose and build the right chart for your data.
Learn to implement the most common ways to visualize data and track performance over time.
Learn to use—and when not to use—composition charts.
Understand your performance and audience by geography.
Tables are the simplest and sometimes most useful way to visualize, compare, and analyze data. Pivot tables give better context as you can compare two dimensions, unlike regular tables.
Scatter plots look so advanced you will look like a data scientist. In this lesson, you will learn to easily create them and interpret them.
Leverage the visualizations that developers have made available for the Google Data Studio community.
Learn to add colors and styling to your visualizations—and learn some design tips and tricks along the process.
Regular Expressions let you do more advanced and specific queries. For instance, how would you search for all that have more than three words, or how to identify legit email inputs? That’s what regular expressions are for.
Learn to create new breakdowns and dimensions by finding values that match with given criteria. With REGEX_MATCH, you will learn to break down Google organic queries into branded and discovery searches—and many more use cases!
Learn to clean your data by removing a set of characters from a string. For instance, instead of showing https://yourpage.com/about/ to end users, you could only display "/about/" by removing the domain.
Transform your data by replacing values with a simple command and regular expressions.
Practice what you preach with real marketing data analysis projects.
Learn to de-abstract funnels and flywheels concepts by visualizing them on a dashboard.
Use the REGEXP_MATCH function to join your posts into topic clusters on Facebook Ads and Facebook Insights.
Calculate and visualize Cost per Acquisition, retention, Lifetime value, Marketing Cost Share per sale, and more indicators with custom formulas.
If you sign up, you won’t only make our marketing team happy, you will also learn actual data visualization and analysis applied in digital marketing, one of the most demanded skills nowadays.


