


When you’re a beginner, or an expert, tracking your KPIs can be confusing. If you’re not measuring your KPI, how can you know what they’re? How can they tell me everything I need to know?
Shopify could have been one of the first to adopt the KPI metrics or analytics. They single-handedly improved the e-commerce venture for small businesses competing against big brands online for audience attention and sales.
These metrics are now used not only as key performance indicators but also as success indicators. Tracking the proper KPIs can help you make data-driven decisions to grow your business.
This post will learn the top 10 KPIs every online retailer must track.
What are KPIs?
There are varieties of key performance indicators (KPIs) that can be used to measure the success of a business.
Some common KPIs include financial measures such as profitability and revenue growth, operational measures such as efficiency and customer satisfaction, and employee-related measures such as turnover and engagement. The KPIs most relevant for a particular business will depend on its strategic goals and objectives.
KPIs (Key Performance Indicators) are essential because they help measure progress towards goals and objectives.
By tracking KPIs, businesses can identify areas that need improvement and make necessary changes to increase efficiency and effectiveness.
Additionally, KPIs can benchmark performance against competitors or industry averages.
Why are KPIs important?
KPIs are at the core of your business’s growth or decline. Your business or campaign flourishes where you choose to pay attention to the information embedded in the data.
Where the reverse is the case, you’ll experience a gradual decline in performance and a subsequent demise of your valued online store. The growth of your business is always directly linked to optimising your online marketing efforts.
This means you need to analyse the correct KPIs if you aim to save time and quickly set targets for teams to achieve.
It is also necessary if you must set up milestones to gauge progress, and insights that help people or businesses stay on track, then you must track, visualise and consistently monitor your KPIs.
What are some good KPIs examples?
Every time a business launches out to secure more wins, there are often a handful of things we are confident every business owner wants to know.
These will often revolve around metrics highlighting the number of leads in the funnel, the conversions, and details about how their brand performs in terms of reach and brand awareness.
So, we took the liberty of highlighting some great KPIs you might want to keep an eye on for your business’s sake. These KPIs may not make it to our list of Shopify KPIs to track this year.
But I’d like to invite you to consider them honourable mentions that may or may not be on your Shopify Analytics but are worth knowing. Either way, a few more KPIs to monitor for business growth won’t hurt anyone – will it? Lol!
So here goes. Keep an eye on these and be obsessed about improving their numbers if you want to experience exponential business growth.
The first few CRM-focused metrics which can also qualify for KPIs are Engagement rate, Marketing Qualified Leads (MQLs), Sales Qualified Leads (SQLs), Cost per Lead (CPL), Customer Retention, and Cost per Customer Acquisition.
Tracking these will keep you on your toes and in competition.
Sales-focused KPIs are also great, which is why in addition to the marketing and advertising focused-KPIs, you should also keep an eye on sales volume, average order value, customer satisfaction scores, net promoter scores, and Marketing ROI as well as Sales Revenue.
These are great metrics and KPIs you must keep tabs on at all times if you want to optimise for growth as you progress.
How do you choose KPIs?
KPIs are not hard to select. It’s easy to pick because it’s based on identifying a few progress points that indicate you are steadily moving towards your goals. Suppose your goal was to increase the number of visitors accessing your online store.
Your KPIs will revolve around monitoring metrics and dimensions linked to qualified traffic. So most likely, you will keep an eye on growing your numbers around reach, impressions, clicks, click-through rates, bounce rates, average time spent on product pages, etc.
The critical thing to remember here is that you must pick a goal or target you want to achieve in business -ensure the goal aligns with your growth stage so you don’t waste resources and energy on motions that won’t move your growth metrics.
I mean that you avoid selling when you are just starting out. Starting is a great time to focus on brand awareness and tell people what your business and your brand do.
Once you pick a reasonable goal, selecting useful KPIs to monitor to get to that goal will be pretty easy and smooth because then you’ll only have to go through a list of metrics and dimensions your platform provides to understand what they mean and if they align with your goals so you can include them on your analytics dashboard.
Savvy? Now that you understand how to choose KPIs, let’s look at why it is crucial to analyze those essential KPIs.
Why is it important to analyse Shopify KPIs?
Analysing your KPIs is something you should do while setting up and running your online store. It will help you to understand what your online store is doing right and where there may be room for improvement.
It is necessary to analyse Shopify KPIs as you need to know what makes your site attractive or not. Consistently analysing your Shopify KPIs remains crucial for your store’s success if you desire informed growth in the right direction.
You might think it isn’t necessary to analyse Shopify KPIs as they already have all the data they need, but if you look at it carefully, you’ll realise that that’s not so true after all.
This article will help you see whether or not you should be keeping tabs on those essential KPIs on your analytics dashboard or whether it’s better off saving them for something else altogether.
Shopify KPIs to track
1. Conversion rate
The conversion rate of a Shopify store is the percentage of visitors who take the desired action on a page. This desired action could be anything from subscribing to a newsletter to making a purchase.
This KPI measures how many visitors to your site actually end up making a purchase. A high conversion rate indicates that your site effectively converts visitors into customers, but a low conversion rate indicates that your current marketing strategy isn’t working.
The conversion rate metric is arguably the best key performance indicator every e-commerce business must track because it directly affects the business’s bottom line.
Without conversions, there’s no business, hence, the need to track and improve it continuously.
How to increase the conversion rate of your Shopify store?
There are several ways to increase your Shopify store’s conversion rate. One way is to ensure that your store is easy to navigate and search. Another way is to offer discounts or free shipping to encourage customers to buy from your store.
You can also create a sense of urgency by offering limited-time discounts or by running a sale. Finally, you can ensure that your product descriptions are clear and concise and that your products are priced competitively.
How to track your e-commerce store conversion rate
A few key metrics are essential when evaluating your store’s conversion rate. These include the number of visitors, the number of sales, and the average order value.
You can use a simple spreadsheet to track these numbers over time and see how your store is performing or use Google Analytics to track them.
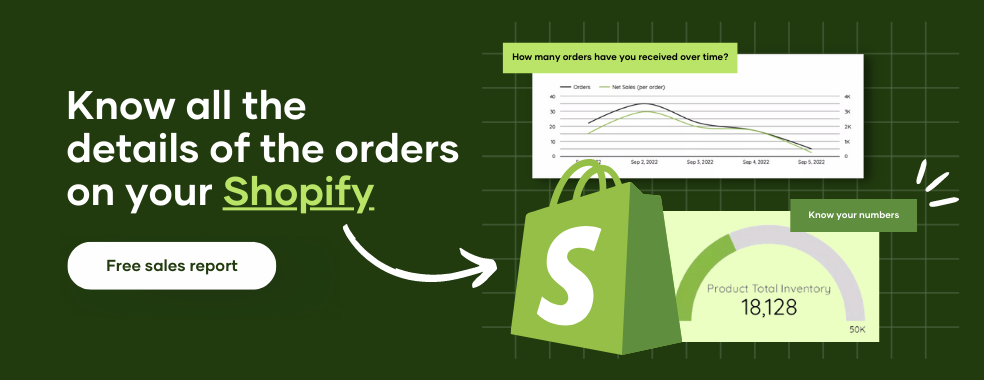
An easier and faster way is to use this free reporting tool that creates beautiful Shopify or e-commerce reports in less than 90 seconds.
2. Average order value
The average order value (AOV) is a key performance indicator (KPI) that measures the average amount of money spent per order in a Shopify store.
This KPI measures the average amount that each customer spends per order.
A high AOV indicates that customers are spending more per order, which can be due to various factors such as the quality of products, effective marketing, or strong customer loyalty.
Conversely, a low AOV may indicate that the store needs to increase the average order size or generate more sales. AOV is calculated by dividing the total revenue of a store by the number of orders placed.
For example, if a store had 100 orders totaling $1,000 in revenue, the AOV would be $10. A high AOV indicates a store selling high-value items and upselling customers on additional products.
A low AOV could indicate a store selling lower-priced items or is not effective at upselling customers. Increasing the AOV is a crucial goal for many Shopify stores as it can decrease the cost of acquiring each customer (CAC)
3. Store traffic
The store traffic KPI is a key metric that measures the number of visitors to an online store. This metric is essential for assessing the store’s overall performance and determining whether marketing and advertising efforts are practical.
A high traffic volume indicates that the online store is popular and visible, while a low traffic volume may indicate that the online store is not reaching its full potential leading to poor sales.
The general rule of thumb in marketing is that the more people see your products, the higher the chance of making a sale. For an online store, this means a lot of traffic needs to be generated for sales to be made.
How to increase your store traffic
There are many ways to increase traffic to your Shopify store. One way is to use social media to promote your store and products. You can also use online advertising, such as Google Ads, to drive traffic to your store.
Another way to increase traffic is to optimise your store for search engines so that people can find you when they search for keywords related to your business.
4. Shopping cart abandonment rate
The shopping cart abandonment rate is the percentage of online shoppers who add items to their cart but do not complete the purchase.
Several factors can affect this rate, including website design, shipping costs, and payment options. By understanding the reasons for abandoned carts, businesses can take steps to reduce the rate and increase sales.
On average, 70% of online shopping carts are abandoned before the purchase is complete. This happens for many reasons, including high shipping costs, unexpected fees, and complicated checkout processes. This can be a significant problem for eCommerce businesses, resulting in lost sales and revenue.
Businesses can do a few things to reduce shopping cart abandonment, such as offering free shipping, providing transparent upfront pricing, and simplifying the checkout process. By taking these steps, businesses can increase sales and improve customer satisfaction.
5. Inventory level
Inventory levels are a key performance indicator (KPI) for many businesses. A high inventory level can tie up working capital and increase storage costs.
It can also indicate that a company is not selling its products as quickly as it would like, which can impact profitability. Therefore, it is essential to closely monitor inventory levels and take steps to keep them at a healthy level.
As a Shopify store owner, keeping track of your inventory levels is essential. This is because your inventory is one of your most important assets.
By tracking your inventory levels, you can ensure that you have enough inventory on hand to meet customer demand. Additionally, you can avoid stockouts and lost sales by keeping track of your inventory levels.
6. Shipping costs
Shipping costs are one of the most important KPIs for Shopify stores and online retailers. By tracking shipping costs, store owners can ensure that their products are being shipped efficiently and reasonably.
By tracking your shipping costs, you can ensure that you are not overspending on shipping and passing on the correct cost to your customers. It could also help you to negotiate better rates with your shipping partners and to find ways to optimise your shipping process.
Shipping costs can also be a good indicator of customer satisfaction, as customers are more likely to be satisfied with their purchase if they feel they got a good deal on shipping.
How to track shipping costs
Keeping track of your shipping costs is essential if you’re selling products through your Shopify store. This will help you determine how much to charge for shipping and whether or not you’re making a profit on your sales.
There are a few different ways to track your shipping costs. First, you can use the Shopify shipping calculator. This tool will estimate shipping costs based on the weight and dimensions of your product.
You can also use a third-party shipping calculator, such as UPS or FedEx. These calculators will give you more accurate shipping costs, but they may be more expensive to use.
You can contact your local post office and ask for a shipping quote. This is often the most accurate way to get a shipping cost, but it can take longer to get a quote.
A cost-effective method is to use Porter, a no-code reporting tool that directly tracks your shipping cost inside your e-commerce store.
Whichever method you choose, tracking your shipping costs is an integral part of running a successful Shopify store or e-commerce business.
7. Customer lifetime value (CLV)
Customer lifetime value (CLV) is a key performance indicator (KPI) that businesses use to measure the profitability of their customers. CLV is the total amount of money a customer spends with a business over their relationship.
E-commerce businesses use CLV to assess a customer’s financial worth and make decisions about marketing, product development, and other investments.
CLV is an important metric for businesses because it helps them understand how much profit they can expect to generate from a customer throughout their relationship. By knowing the CLV of their customers, businesses can make strategic decisions about where to allocate their resources to maximize profits.
How to calculate your customer lifetime value
To calculate customer lifetime value for a Shopify store, you’ll need to know your average order value, churn rate, and customer acquisition costs.
This is the total revenue from all orders divided by the number of orders. Next, calculate your churn rate. This is the number of customers who stop using your shop divided by the total number of customers.
Finally, calculate your customer acquisition costs. This is the cost of acquiring new customers divided by the number of new customers. With these three numbers, you can calculate your customer’s lifetime value.
CLV= AOV X Churn rate X Customer acquisition cost
8. Customer acquisition cost
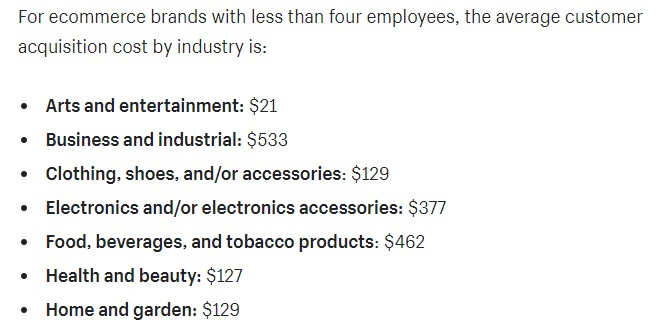
In business, customer acquisition cost (CAC) is a key performance indicator (KPI) that represents the average amount of money a company spends to acquire a new customer.
CAC is a critical metric for companies to track because it directly impacts the profitability and growth of the business. Customer acquisition costs vary widely from industry to industry but typically range from several hundred to several thousand dollars.
Online retailers must carefully manage their CACs to ensure they are spending enough to acquire new customers but not so much that it negatively impacts their bottom line.
How to calculate Shopify customer acquisition cost
To calculate your Shopify customer acquisition cost, you’ll need to gather data about your marketing and sales efforts.
First, determine your total marketing budget for the period you’re interested in. Then, divide that number by the number of new customers you acquired during that period. This will give you your customer acquisition cost.
9. Number of orders
The number of orders placed on a Shopify store is an important KPI to track. This number can give insights into how well the store is performing and whether or not customers are happy with the products and service.
The number of orders KPI measures the number of orders placed on your e-commerce site in a given period. It is a valuable metric for assessing the health of your company’s sales pipeline and can be used to track changes in customer demand over time.
You can use the built-in order tracking feature to track the number of orders placed on your Shopify store. This feature allows you to see the total number of orders placed in your store and the number of orders placed on each product.
You can also use a free reporting tool to track the number of orders placed on your store alongside other key performance indicators like average order value, add to cart, cart abandonment rate, etc.
10. Add to cart rate
The add-to-cart rate is the percentage of visitors to a website who add items to their shopping cart. This metric is essential for e-commerce businesses as it indicates how well they convert browsers into buyers.
A high add-to-cart rate means that shoppers are finding what they want on the site and are comfortable completing a purchase, while a low rate may indicate that customers are not finding what they’re looking for on the site.
How to Set Realistic Shopify Store KPIs
As a Shopify store owner, setting KPIs (key performance indicators) for your business to measure success and track progress is essential.
But it’s also important to ensure those KPIs are realistic, or you’ll likely become discouraged when you don’t meet them.
So how can you set realistic KPIs for your Shopify store?
Here are a few tips:
- Do your research before setting any KPIs – it’s important to do your research and understand your target audience, your product, and your industry. This will help you better understand what’s realistic to achieve.
- Set achievable goals – Once you understand your business well, it’s time to set some goals. Make sure those goals are achievable, or you’ll just be setting yourself up for disappointment.
- Track your progress – As you work towards your KPIs, tracking your progress is crucial to see how well you’re doing. This will help you adjust your goals as needed.
- By following these tips, you can be sure to set realistic KPIs for your Shopify store that will help you measure success and track progress.
Measuring Shopify KPIs: How to get started
When measuring your Shopify store’s performance, you need an analytics tool to help you track important metrics. Shopify easily tracks all of this data in their built-in analytics tools.
To get a detailed breakdown of other custom metrics, you may need to pay for Shopify apps that permit such reporting. This route can get expensive, especially if you’re starting your business.
An alternative is to use Google Analytics. This free tool from Google would help you track key metrics on your Shopify store. But when it comes to creating a report of tracked metrics, it might be difficult if you don’t know your way around the tool.
Track your Shopify KPIs with Porter
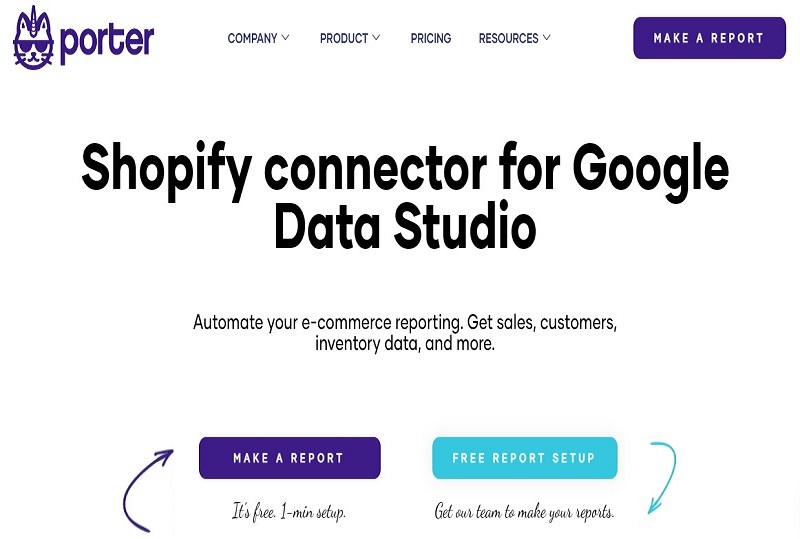
Porter is a fast and reliable no-code reporting tool for marketers. It allows you to prepare your Shopify reports in less than 90 seconds.
With porter, you get instant access to 80+ customizable templates for reports and 600+ custom metrics to allow you to track your store’s performance.
Unlike other tools requiring complex integrations, porter doesn’t require buggy integration. You can easily track key metrics in your Shopify store using Porter.
Conclusion – 10 Shopify KPI Metrics (Summary)
What doesn’t get measured can’t be improved. This saying holds for your Shopify store. There’s a reason why these metrics are named Key Performance Indicators – they’re an important way to understand how your store is doing and how you can continue to grow.
It is best practice to track your Shopify KPIs regularly and use that data to take actions that can improve your Shopify business going forward. These top 10 Shopify KPI Metrics include:
- Conversion rate
- Average order value
- Store traffic
- Shopping cart abandonment rate
- Inventory levels
- Shipping costs
- Customer lifetime value
- Customer acquisition cost
- Number of orders
- Add-to-cart rate
Tracking these metrics allows you to grow your e-commerce business faster while saving costs.
Frequently Asked Questions (FAQ)
How do I increase the conversion rate of my Shopify store?
There is no one-size-fits-all answer to this question. Still, some tips to help increase conversion rates on Shopify stores include optimising your store for mobile devices, offering free shipping, and creating targeted landing pages.
What are the key KPIs for e-commerce?
A few critical KPIs (Key Performance Indicators) exist for e-commerce businesses. These would include metrics like store traffic, conversion rate, average order value, and customer lifetime value.
Tracking these KPIs will give you a good idea of how your e-commerce business is performing and where you may need to improve.
What does the average Shopify customer acquisition cost?
There is no definitive answer to this question as it can vary greatly depending on factors such as the size and type of business, the products or services offered, the target market, the marketing strategy used, etc.
However, a recent study by Shopify found that the average customer acquisition cost for their platform was $58.
How do I drive traffic to my eCommerce store?
There are several ways to increase traffic to your online store. One way is to optimise your site for search engines so potential customers can find you when searching for keywords.
You can also use targeted advertising to attract visitors from specific demographics or locations. Another is to partner with other businesses in your niche to cross-promote your products or services.
Which indicators are important in an e-commerce campaign?
For every campaign, you should always have a goal. The goal of your campaign determines the kinds of KPIs you should track. Nevertheless, it is important for every campaign to track conversion rates, average order value, and store traffic.