Facebook Ads KPI tracker Report template for Marketing teams and agencies
Get the actual Facebook Ads KPI tracker on Looker Studio template used by Porter to monitor PPC performance.
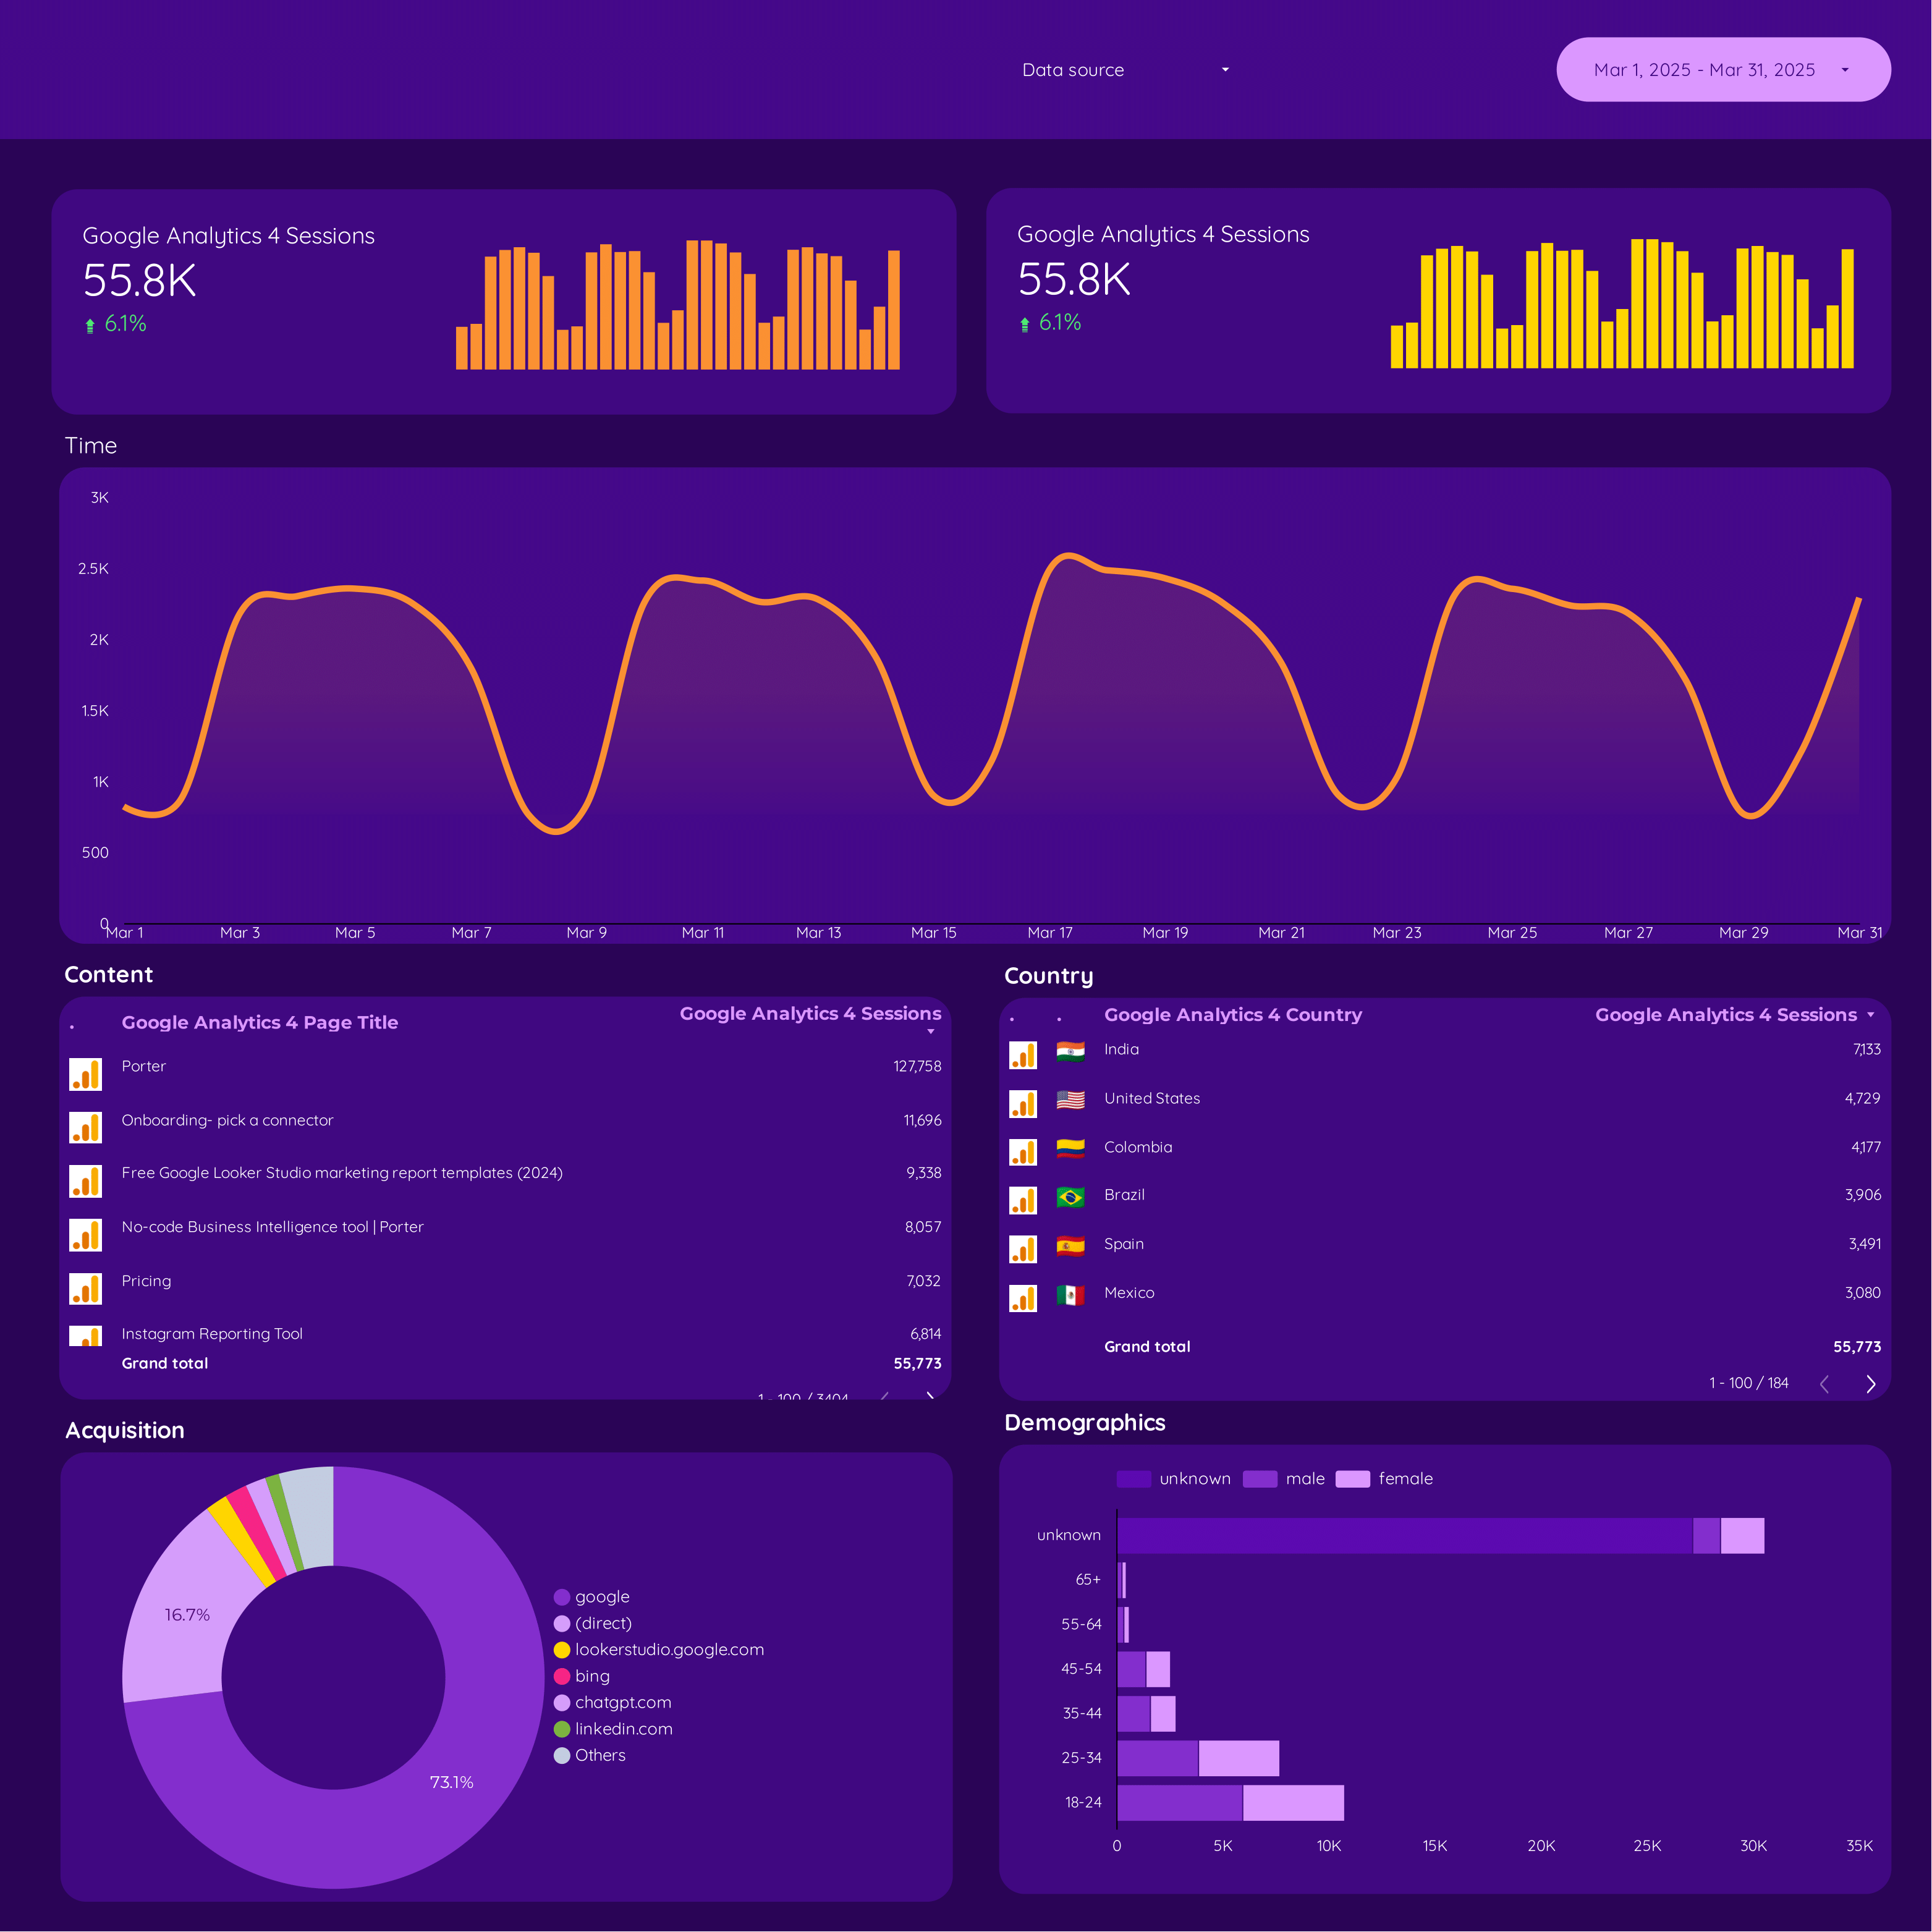
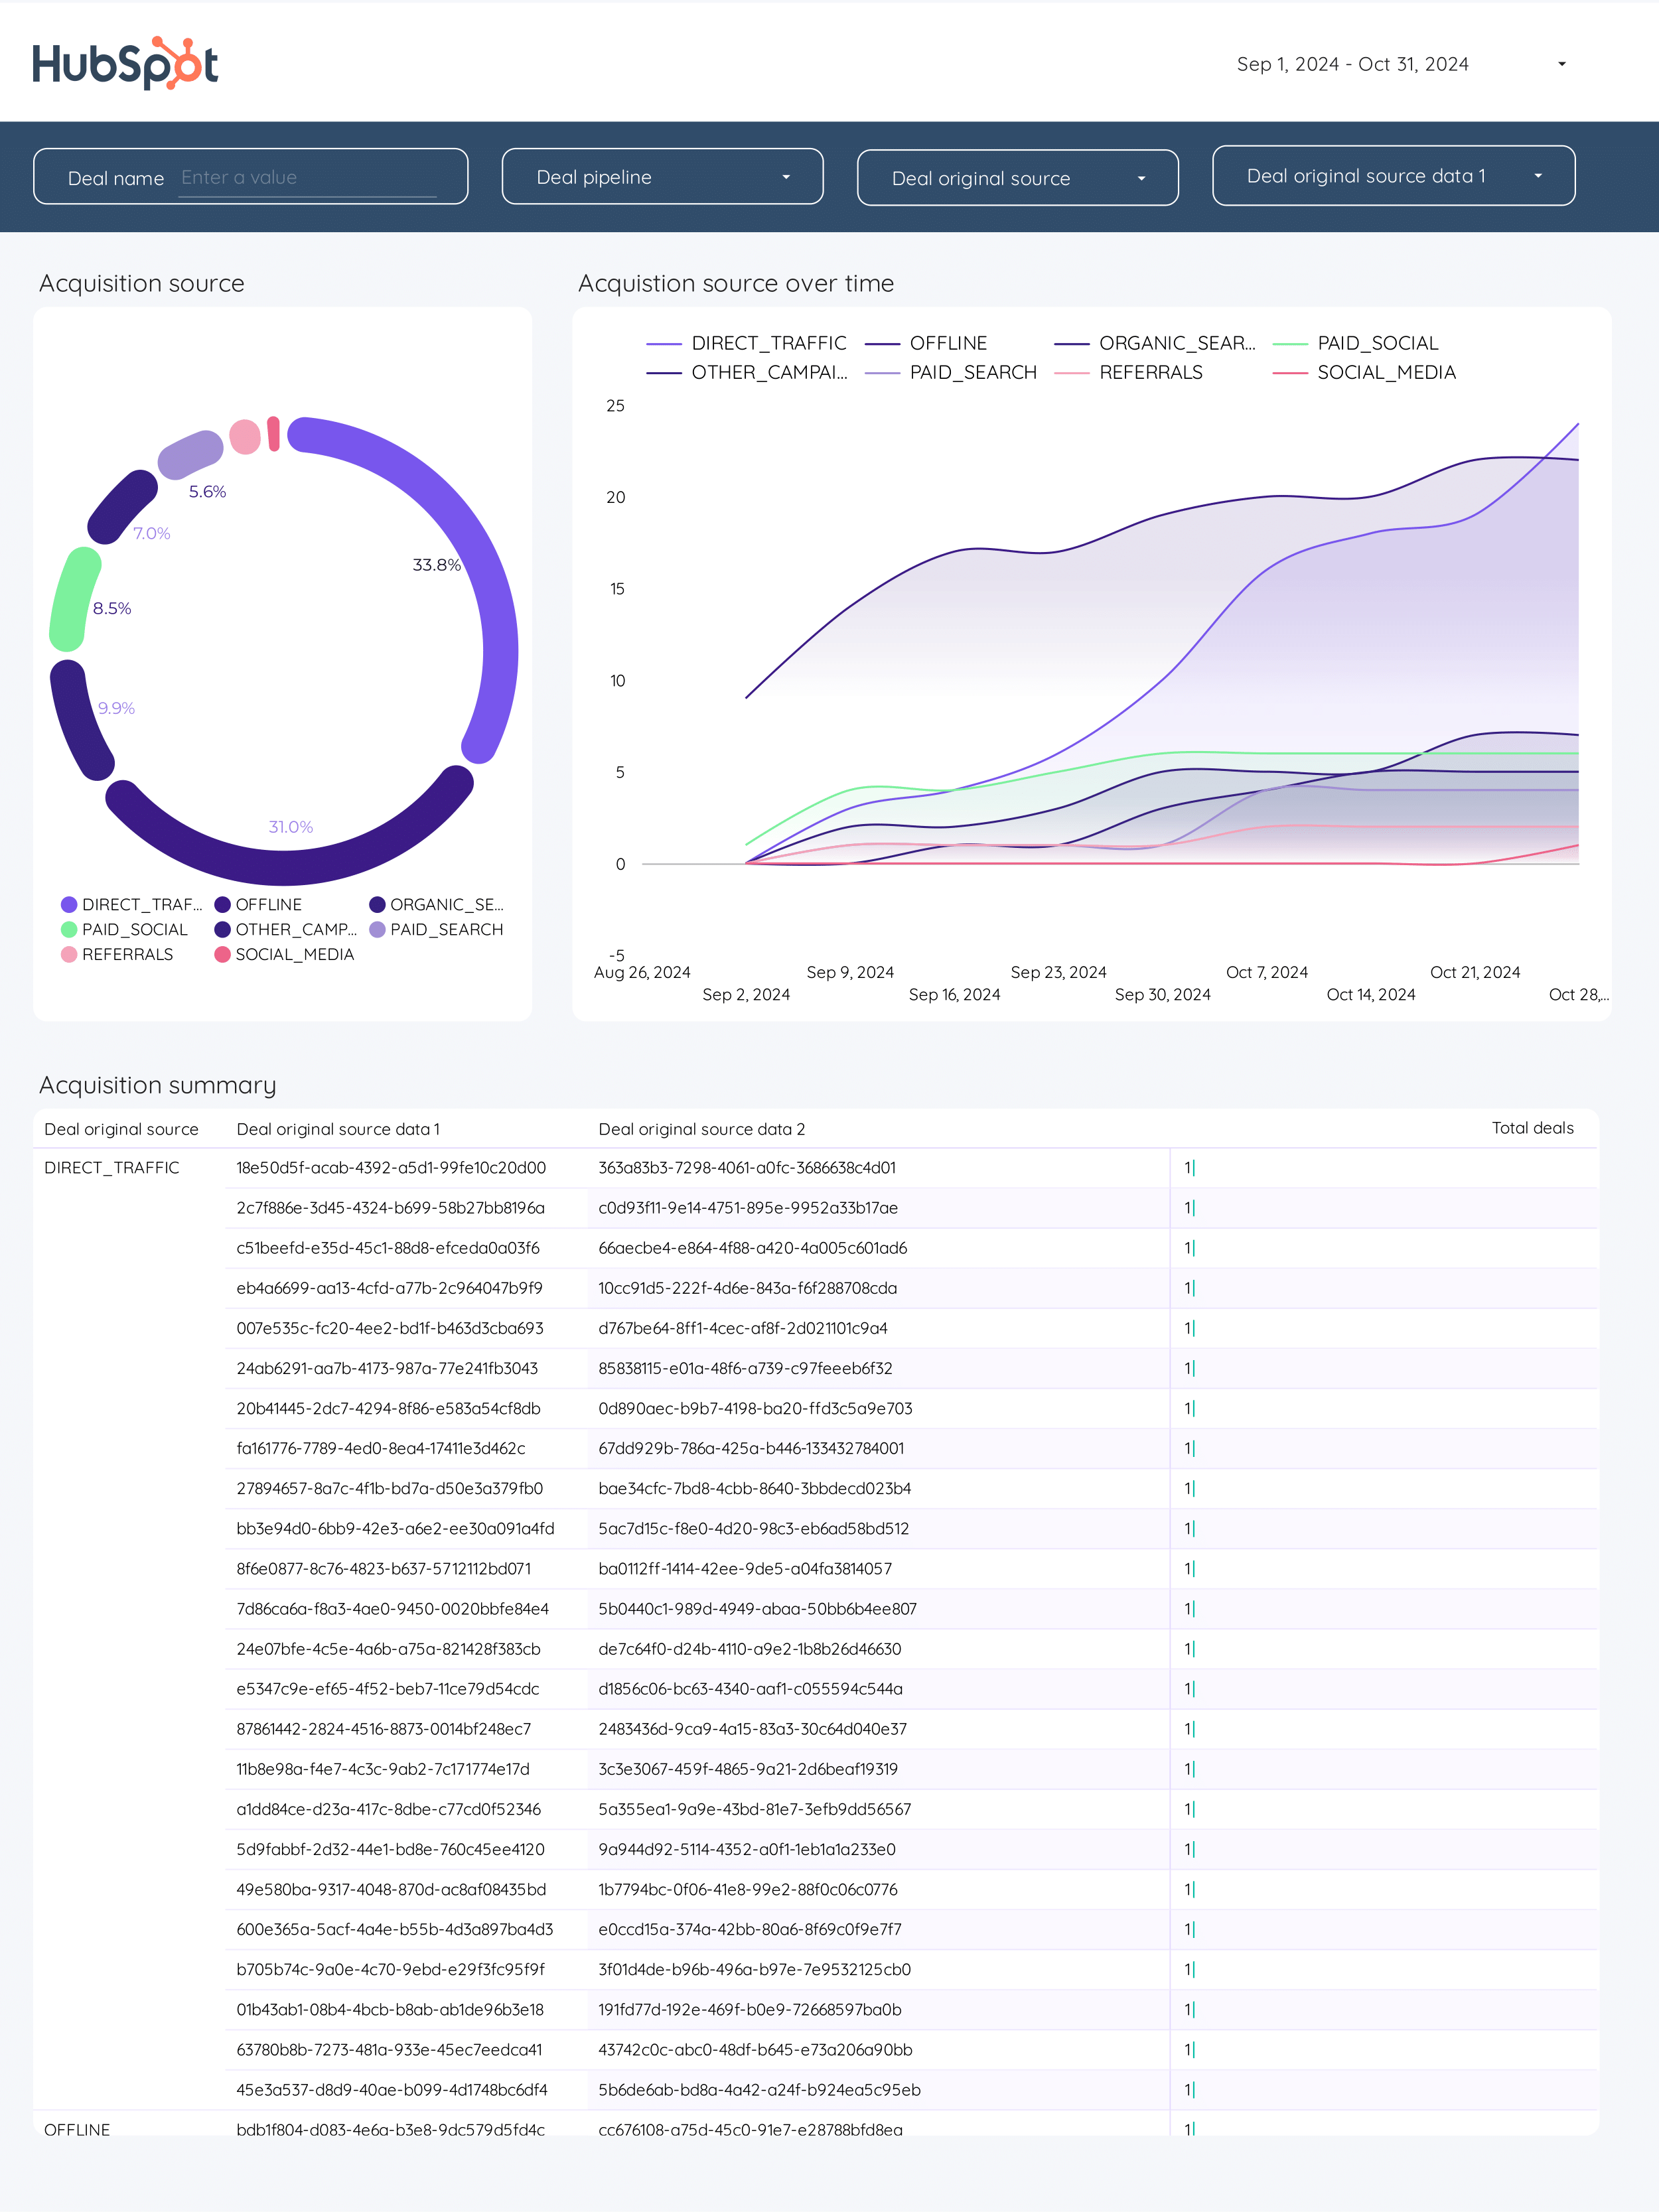
Google Analytics 4 E-commerce Report template for Marketing teams and agencies
Track essential metrics like purchase and engagement rates with the Google Analytics 4 E-commerce report template. Analyze dimensions such as campaign source and user type. Measure performance across various time frames. Perfect for marketing teams to consolidate data and optimize strategies.
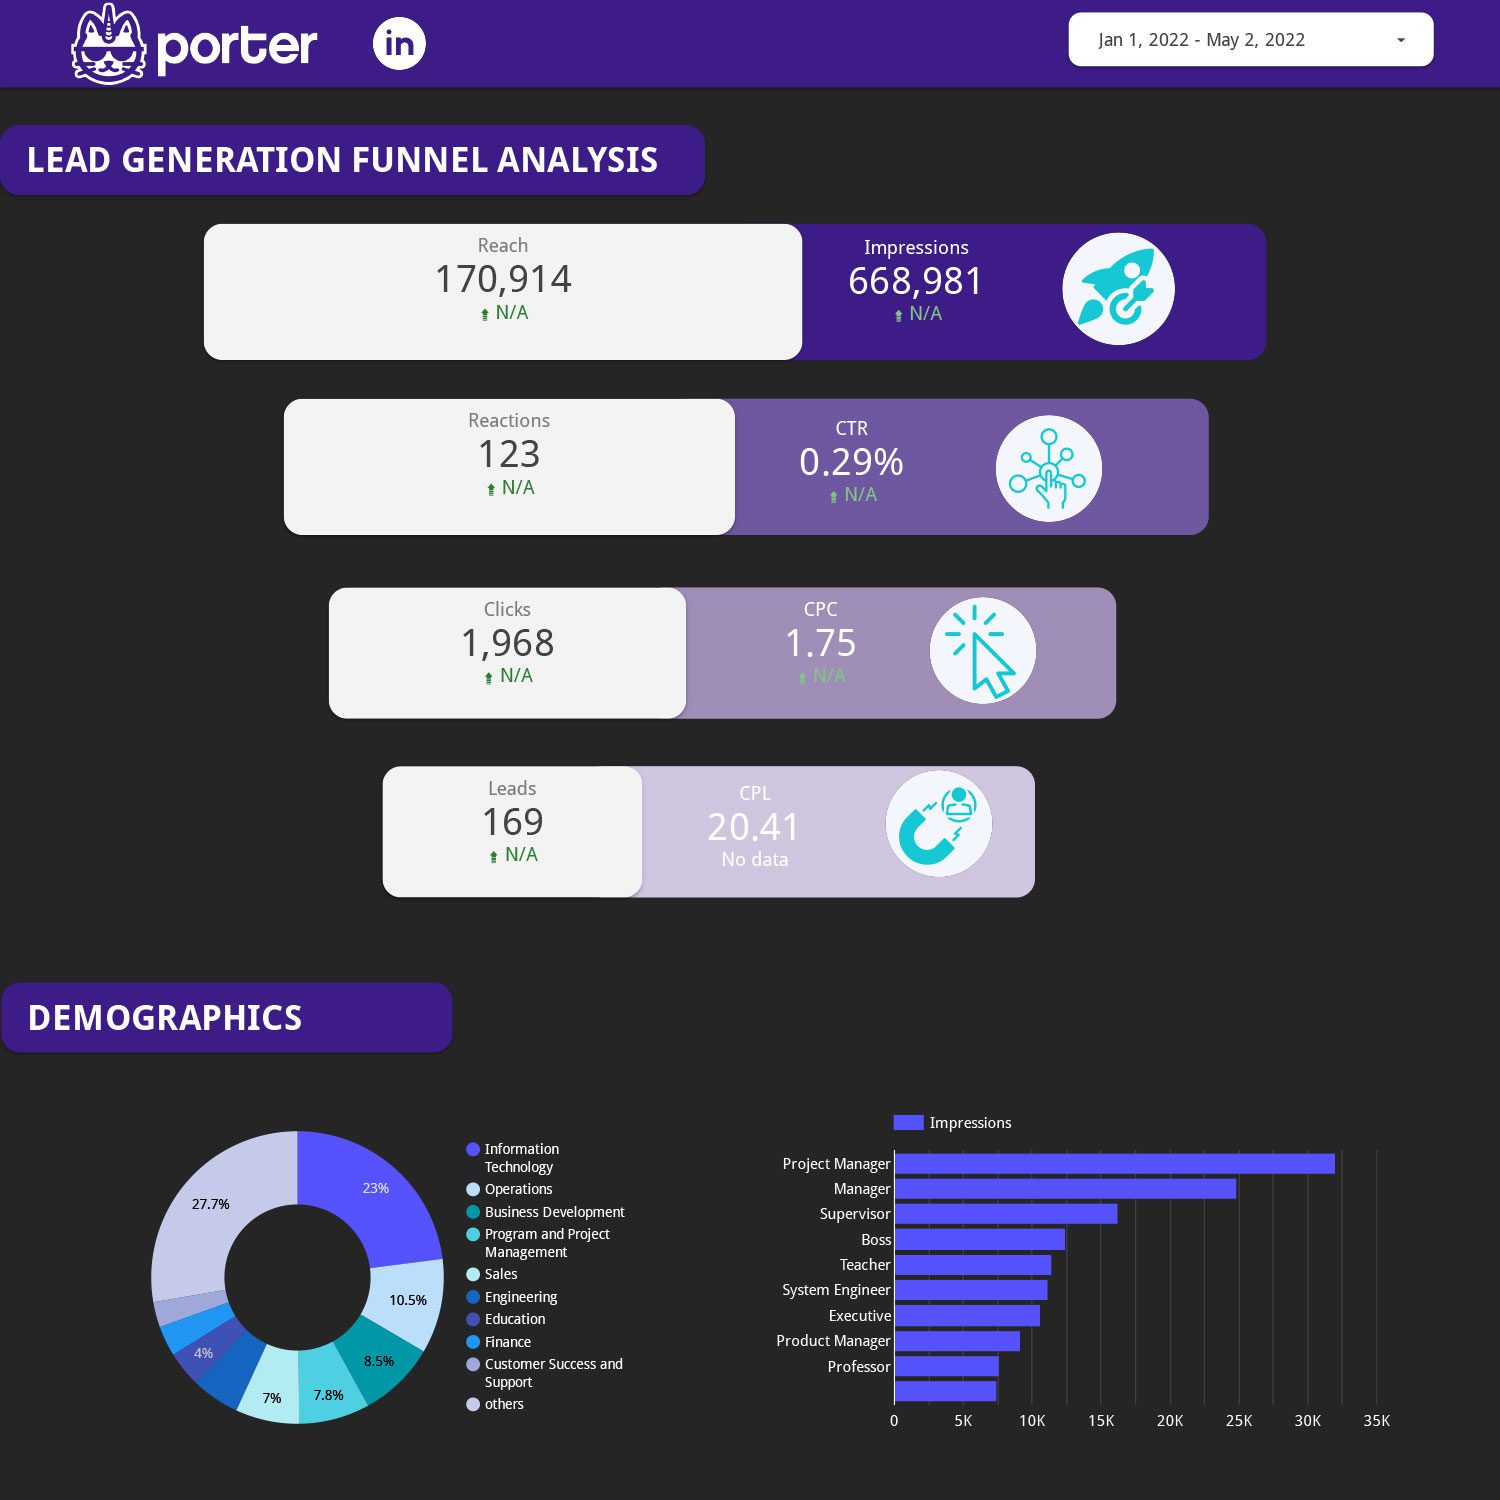
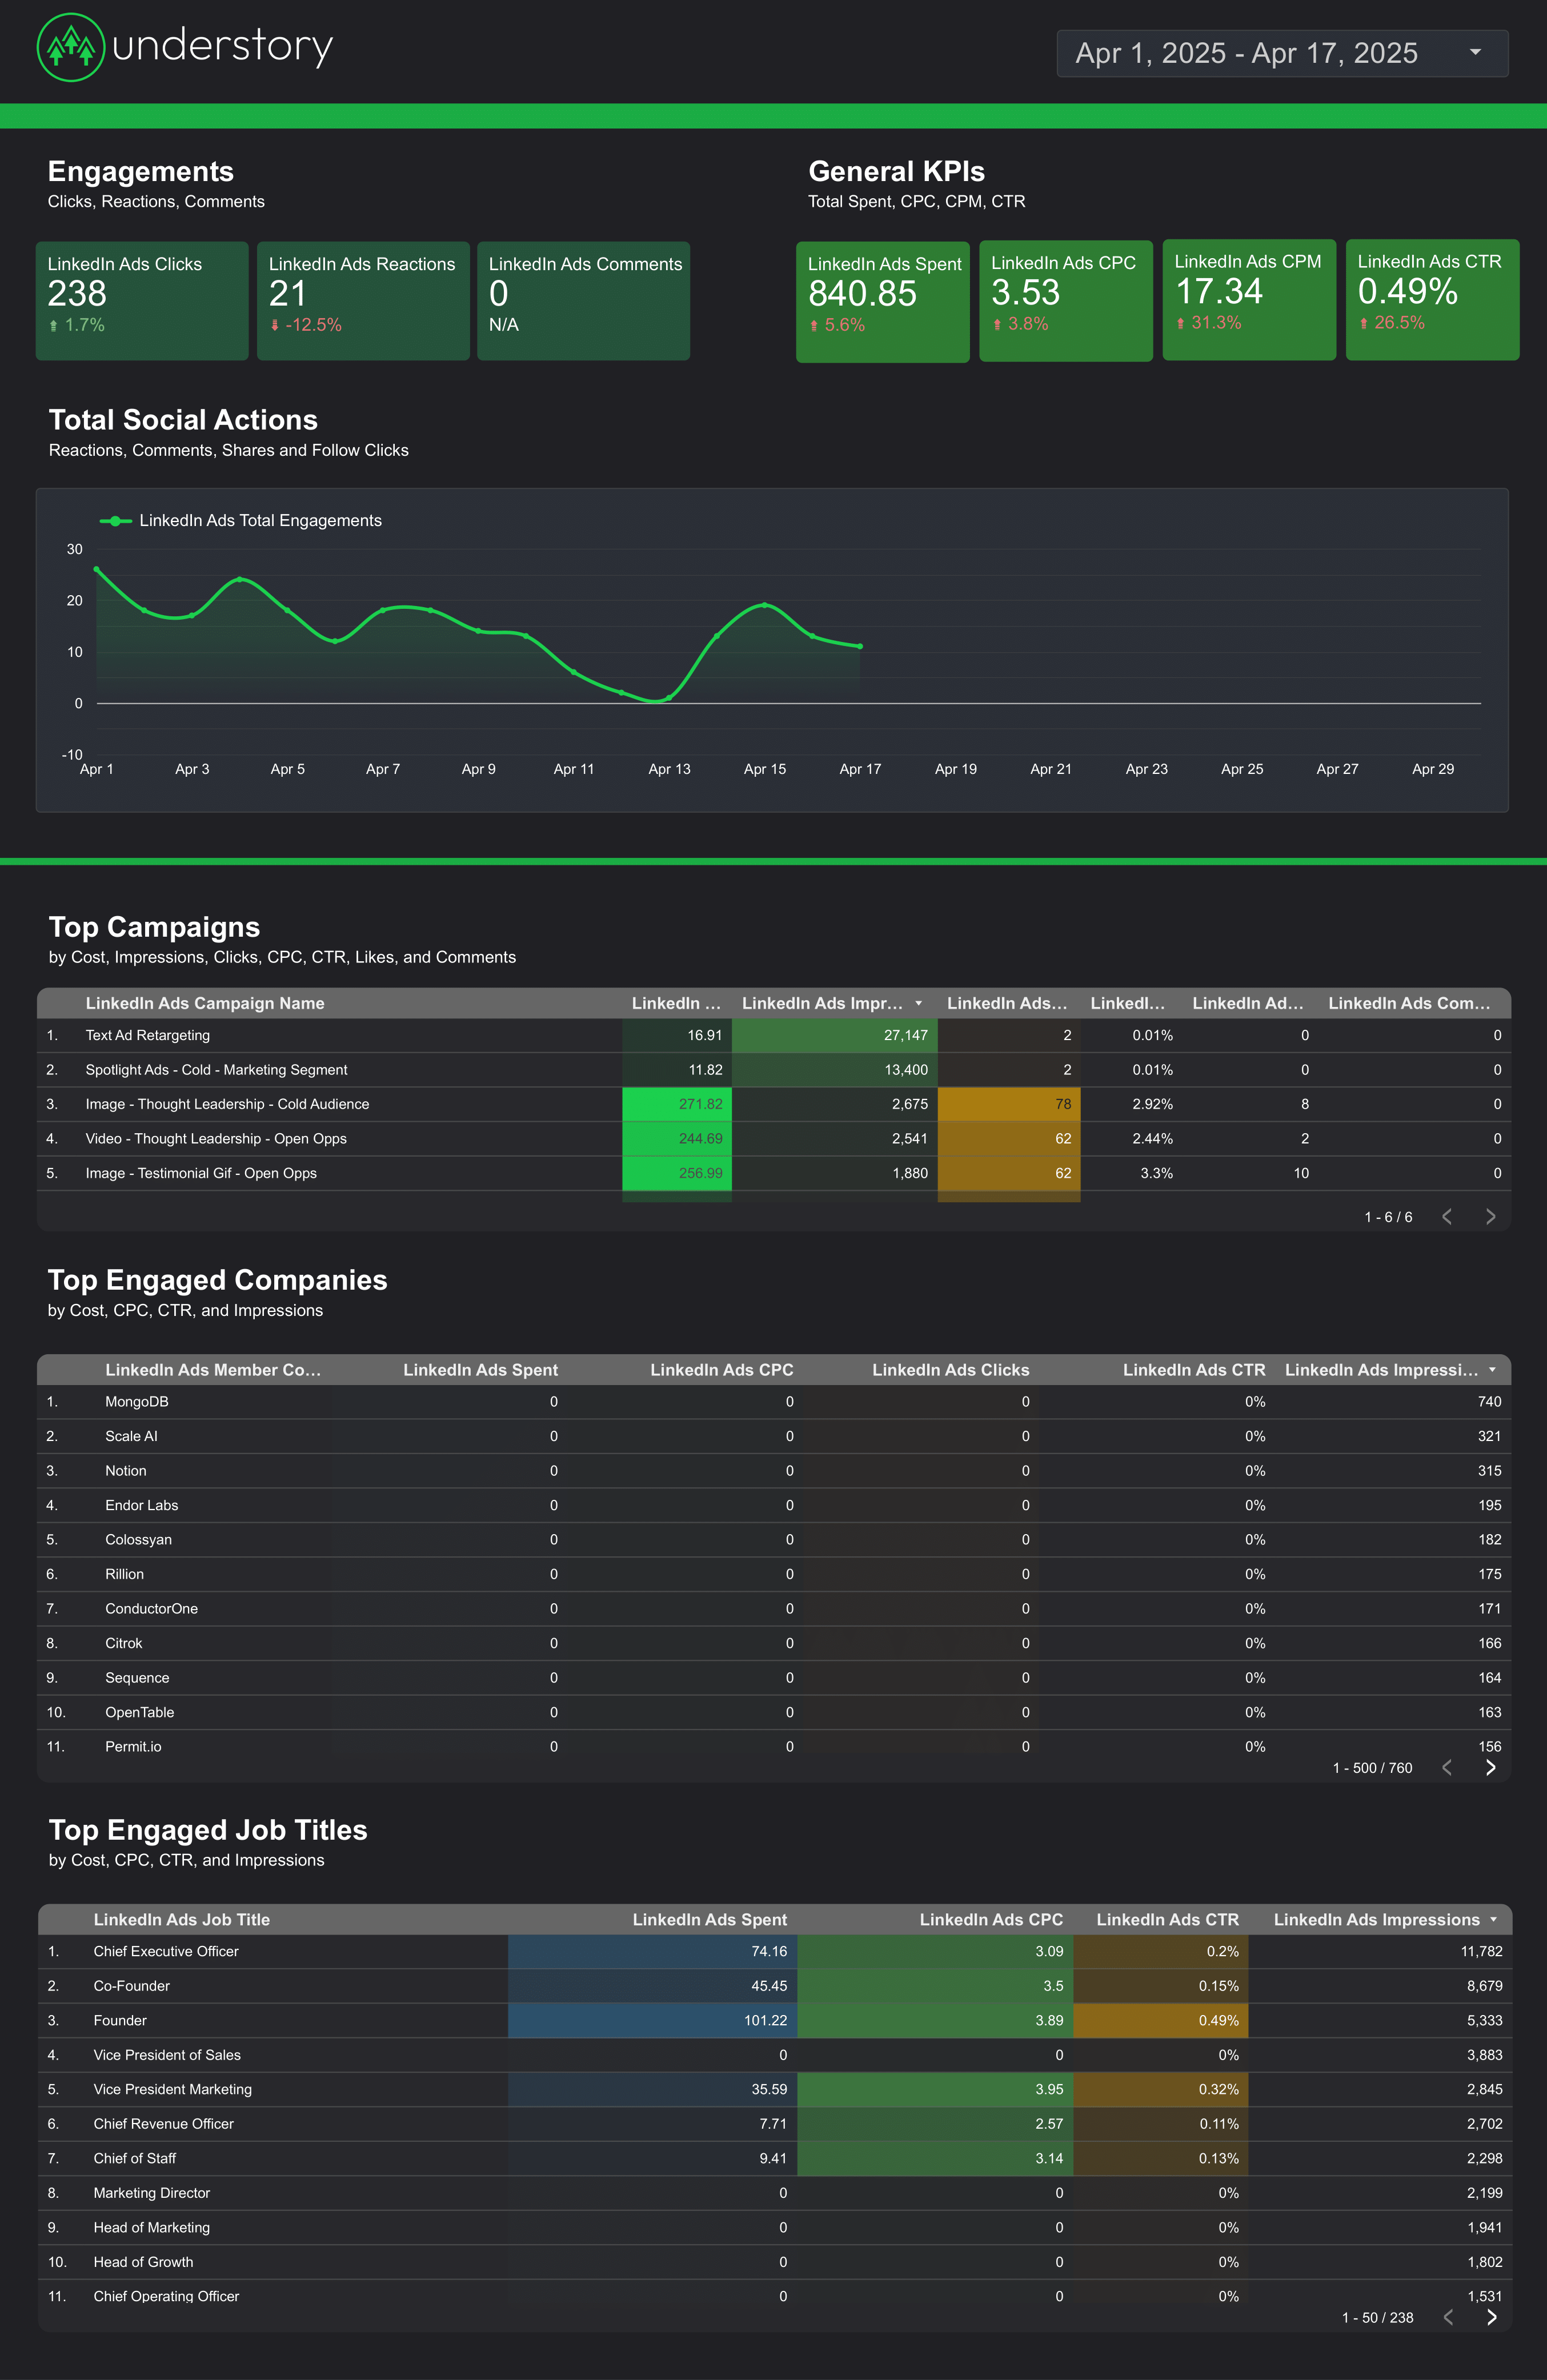
LinkedIn Ads Report template for Marketing teams and agencies
Optimize your LinkedIn Ads strategy with this report template. Track leads, conversions, and CTR. Analyze by campaign, job title, or industry. Ideal for B2B and PPC marketing teams to measure performance and refine goals. Consolidate data across various timeframes for actionable insights.
PPC KPIs Report template for Marketing teams and agencies
Get the actual PPC KPIs on Looker Studio template used by Porter to monitor PPC performance.

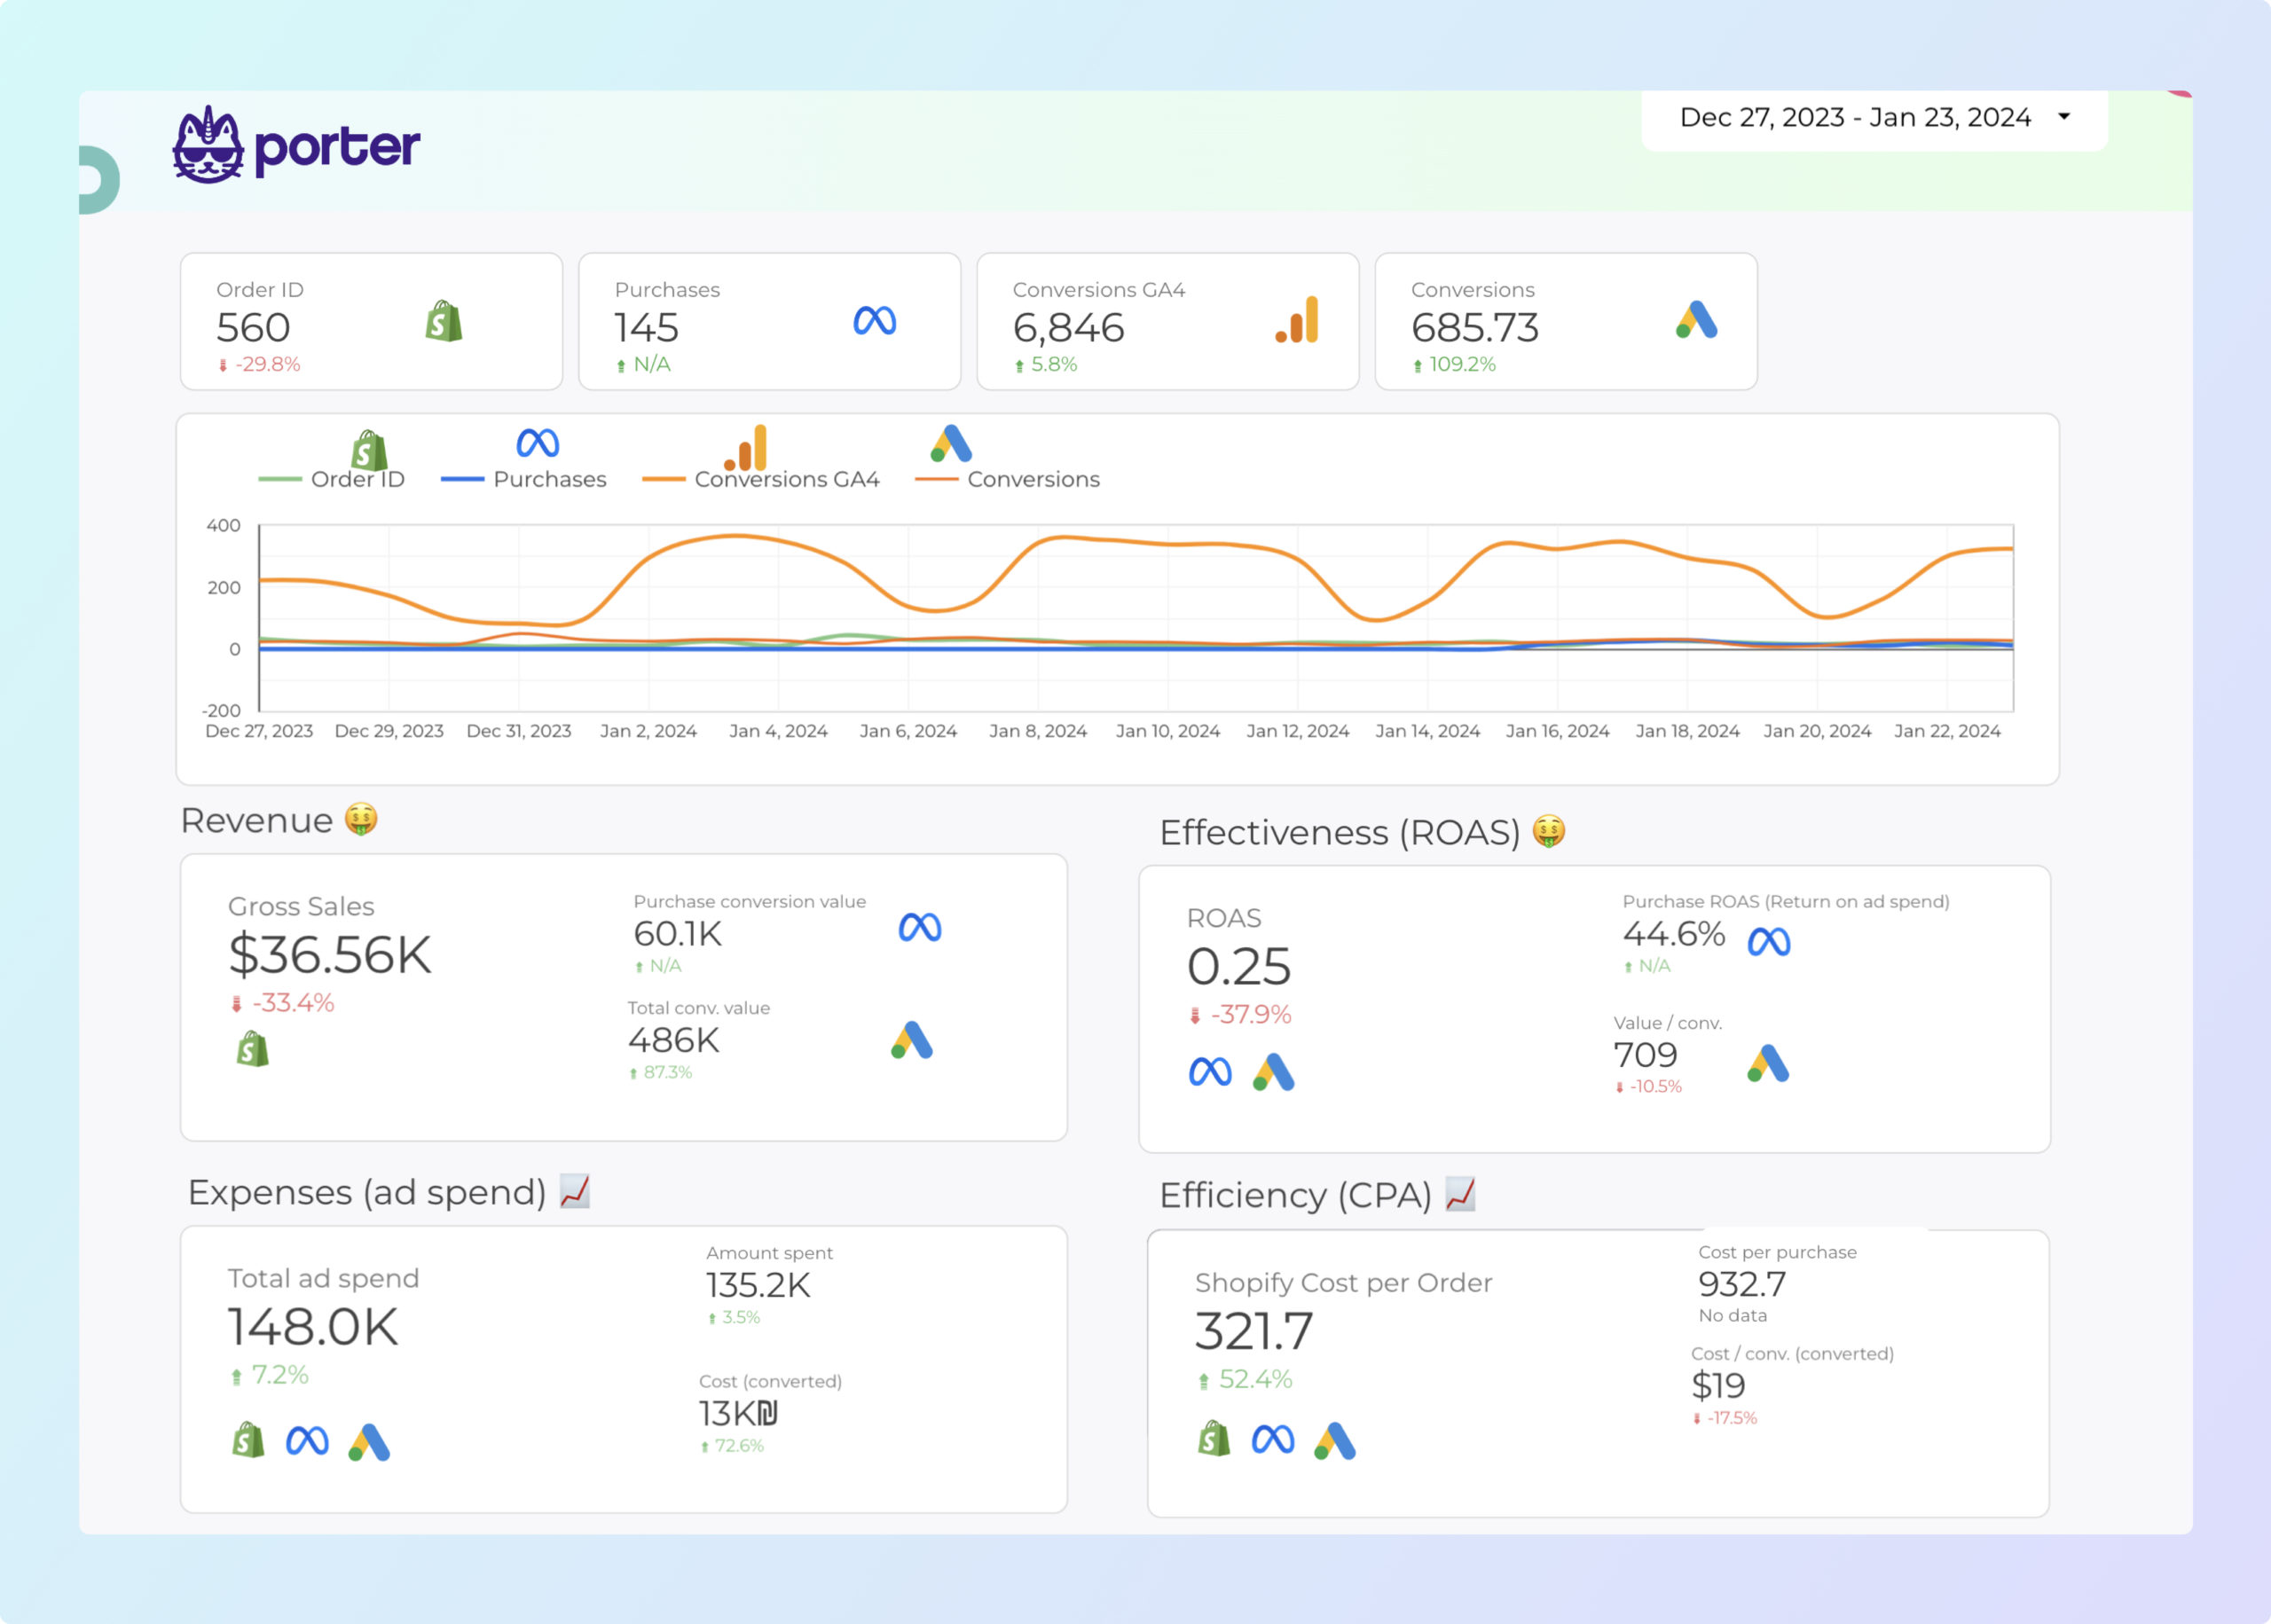
ROAS Report template for Marketing teams and agencies
Track PPC performance with this PPC ROAS report template. Measure CTR, CPA, and conversion rates. Analyze ad placement, audience, and creative formats. Integrate data from Facebook Ads and Paid Media. Segment by time and demographics for actionable insights. Ideal for marketing teams aiming to optimize their strategy and achieve specific goals.
Demand generation Report template for Marketing teams and agencies
Optimize B2B demand generation with this report template. Track conversion rates, cost per conversion, and click-through rates. Analyze social media shares and impressions. Integrate data from CRM, E-commerce, Facebook Ads, Google Analytics 4, and LinkedIn Ads. Segment by demographics and time for strategic insights. Ideal for marketing teams focused on performance.
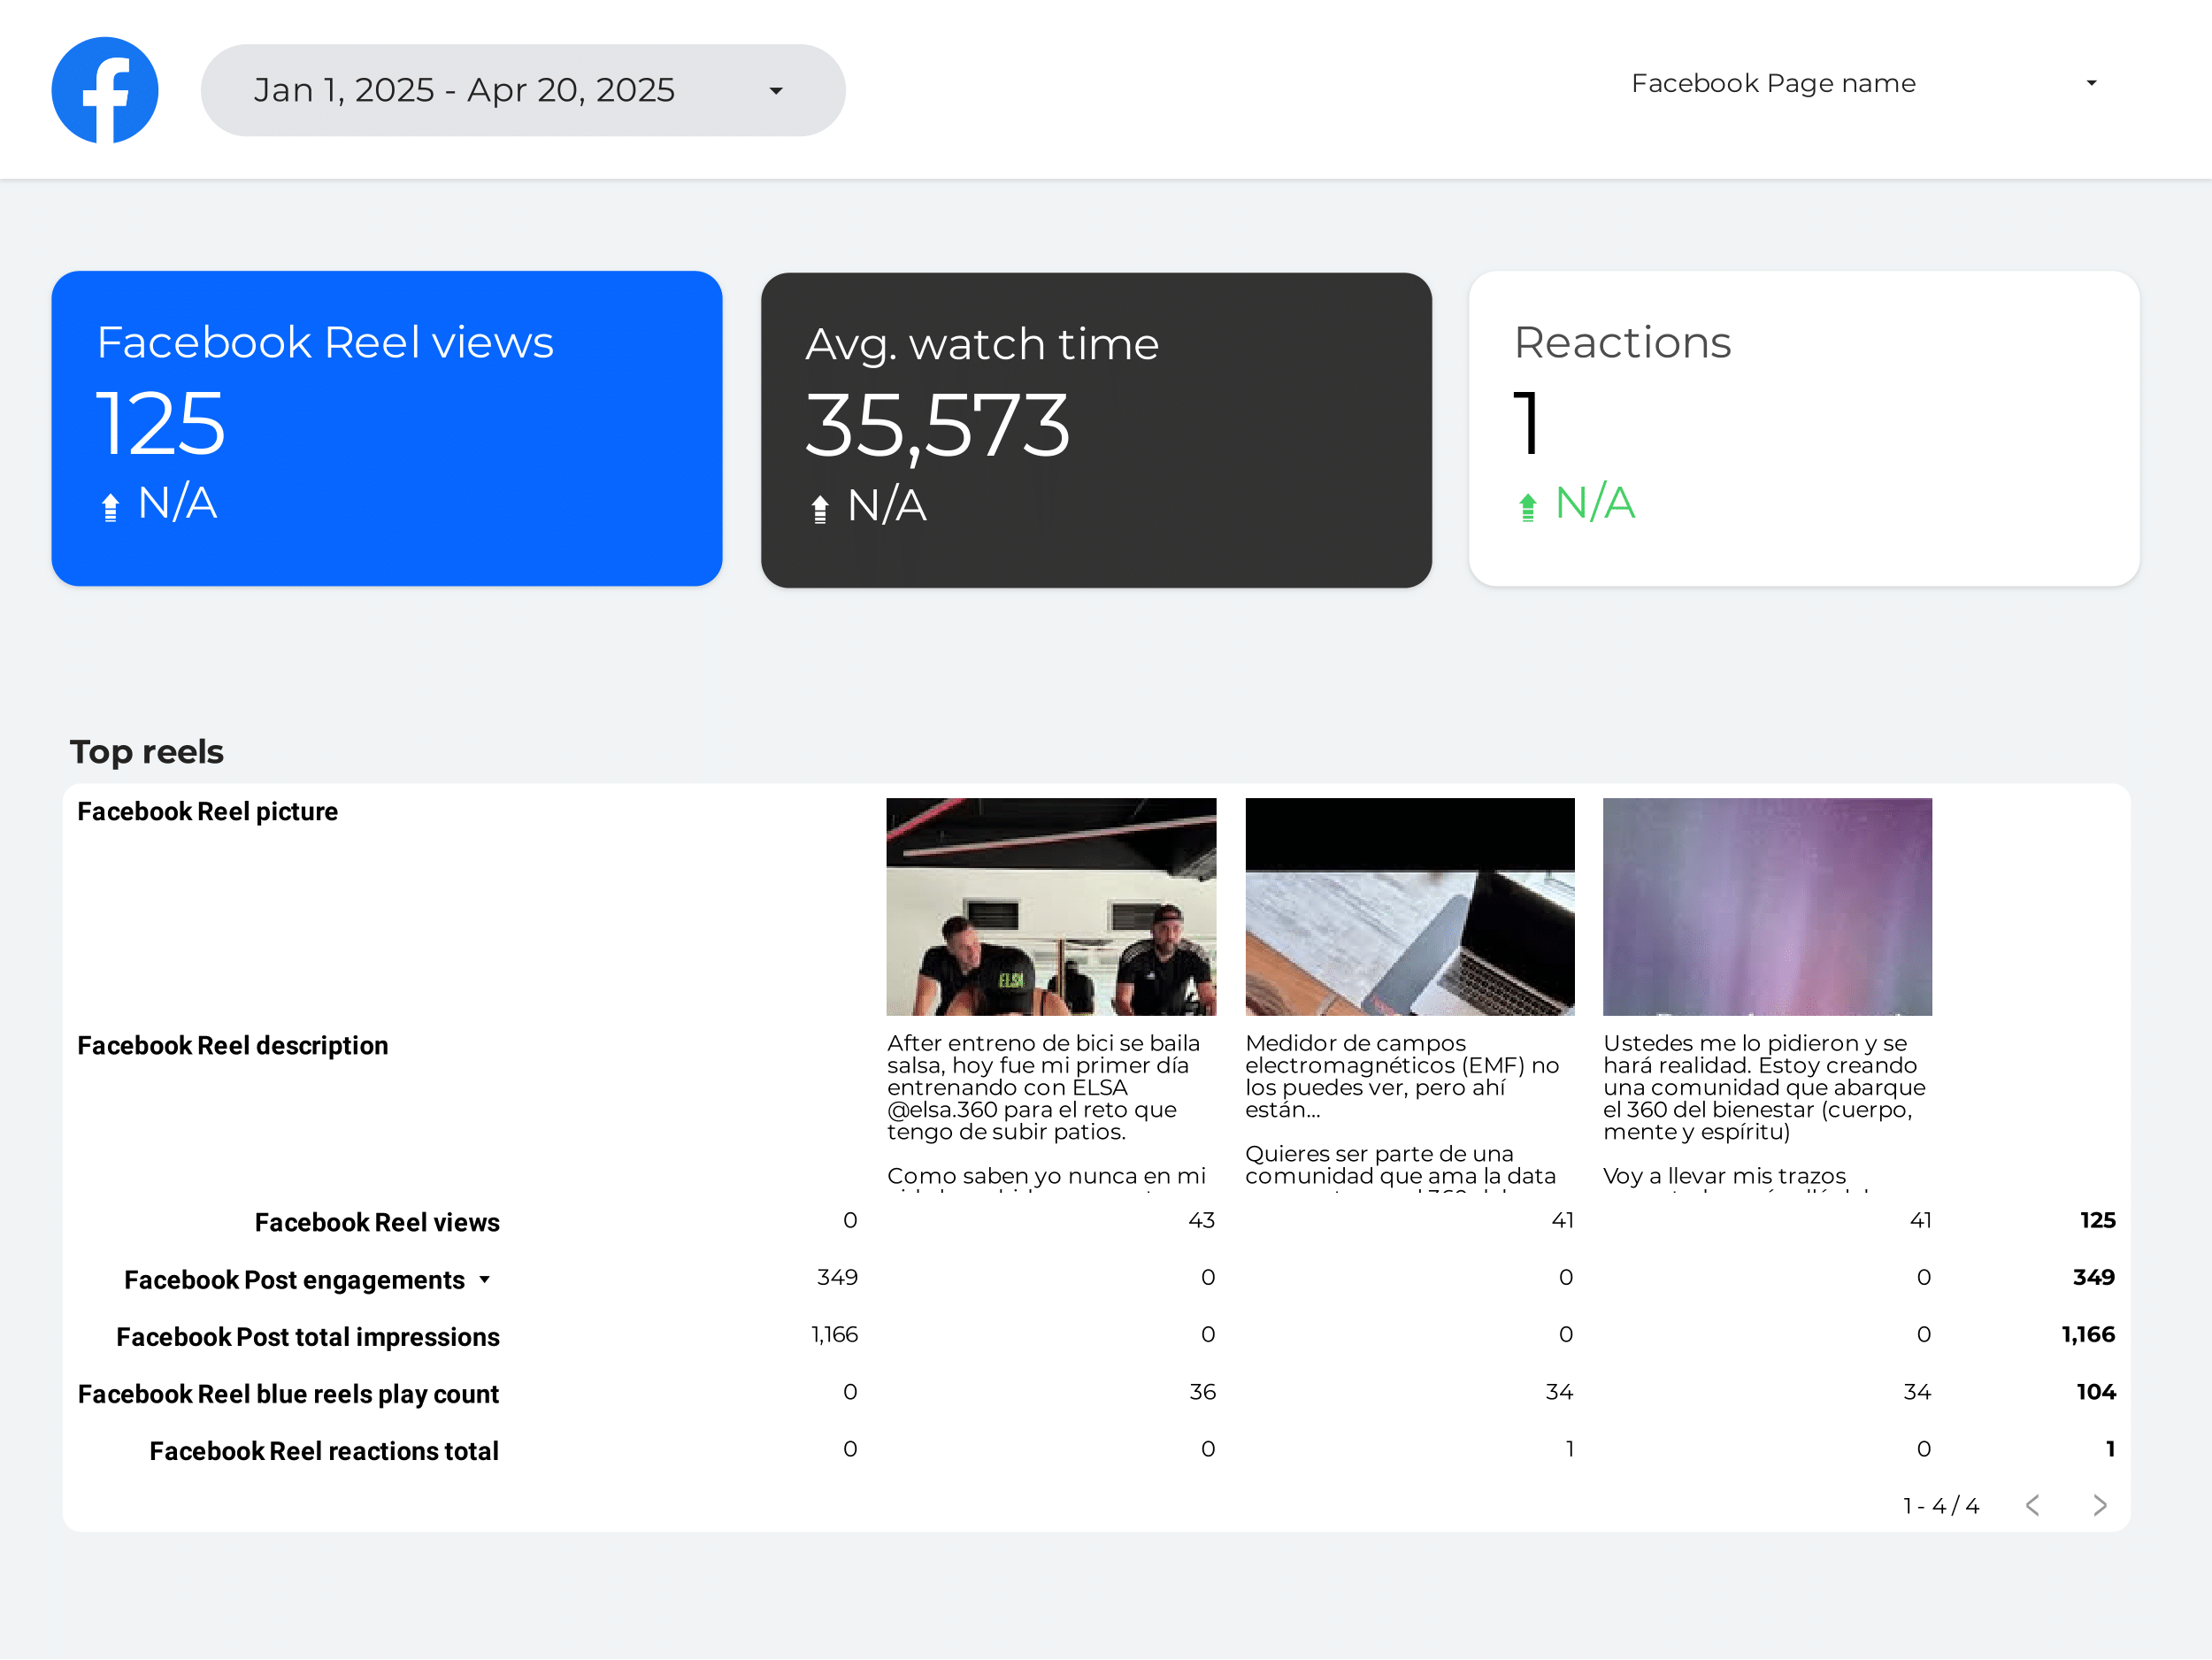
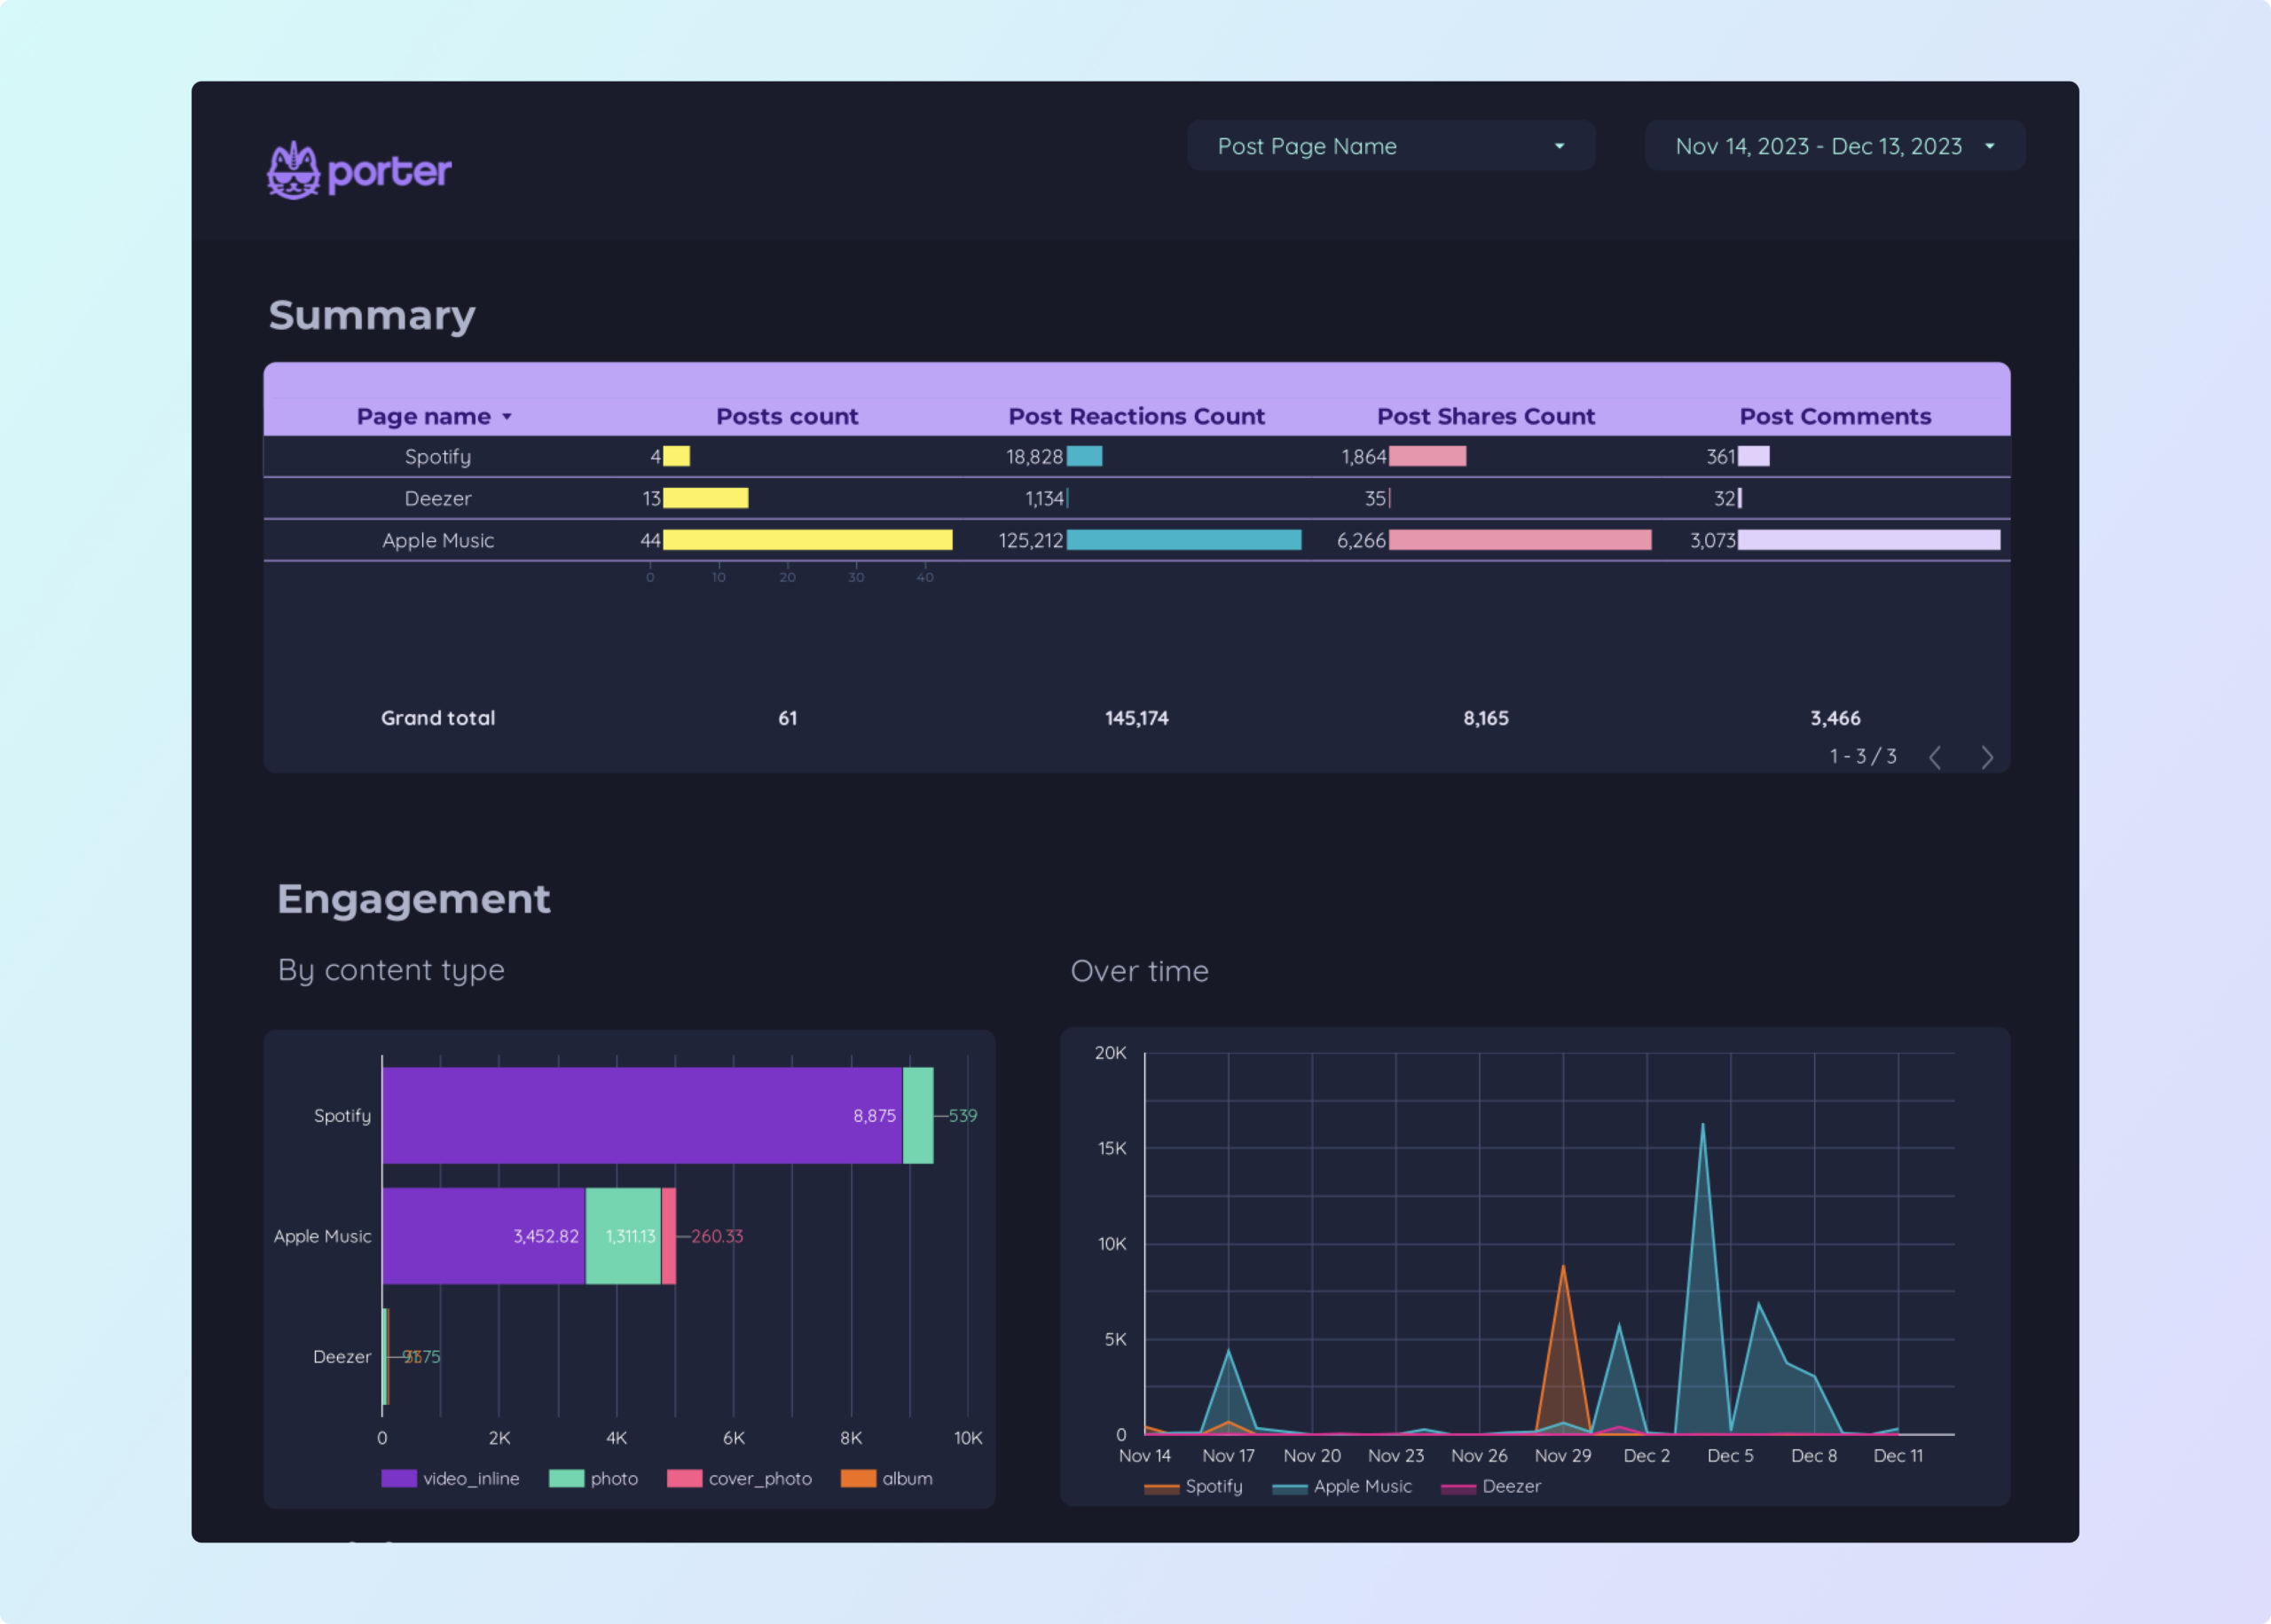
Facebook Insights Report template for Marketing teams and agencies
Optimize your social media strategy with this Facebook Insights report template. Track CTR, conversion rate, and engagement. Analyze metrics by age, gender, and location. View insights by hour, day, or month. Perfect for marketing teams to measure performance and achieve objectives.
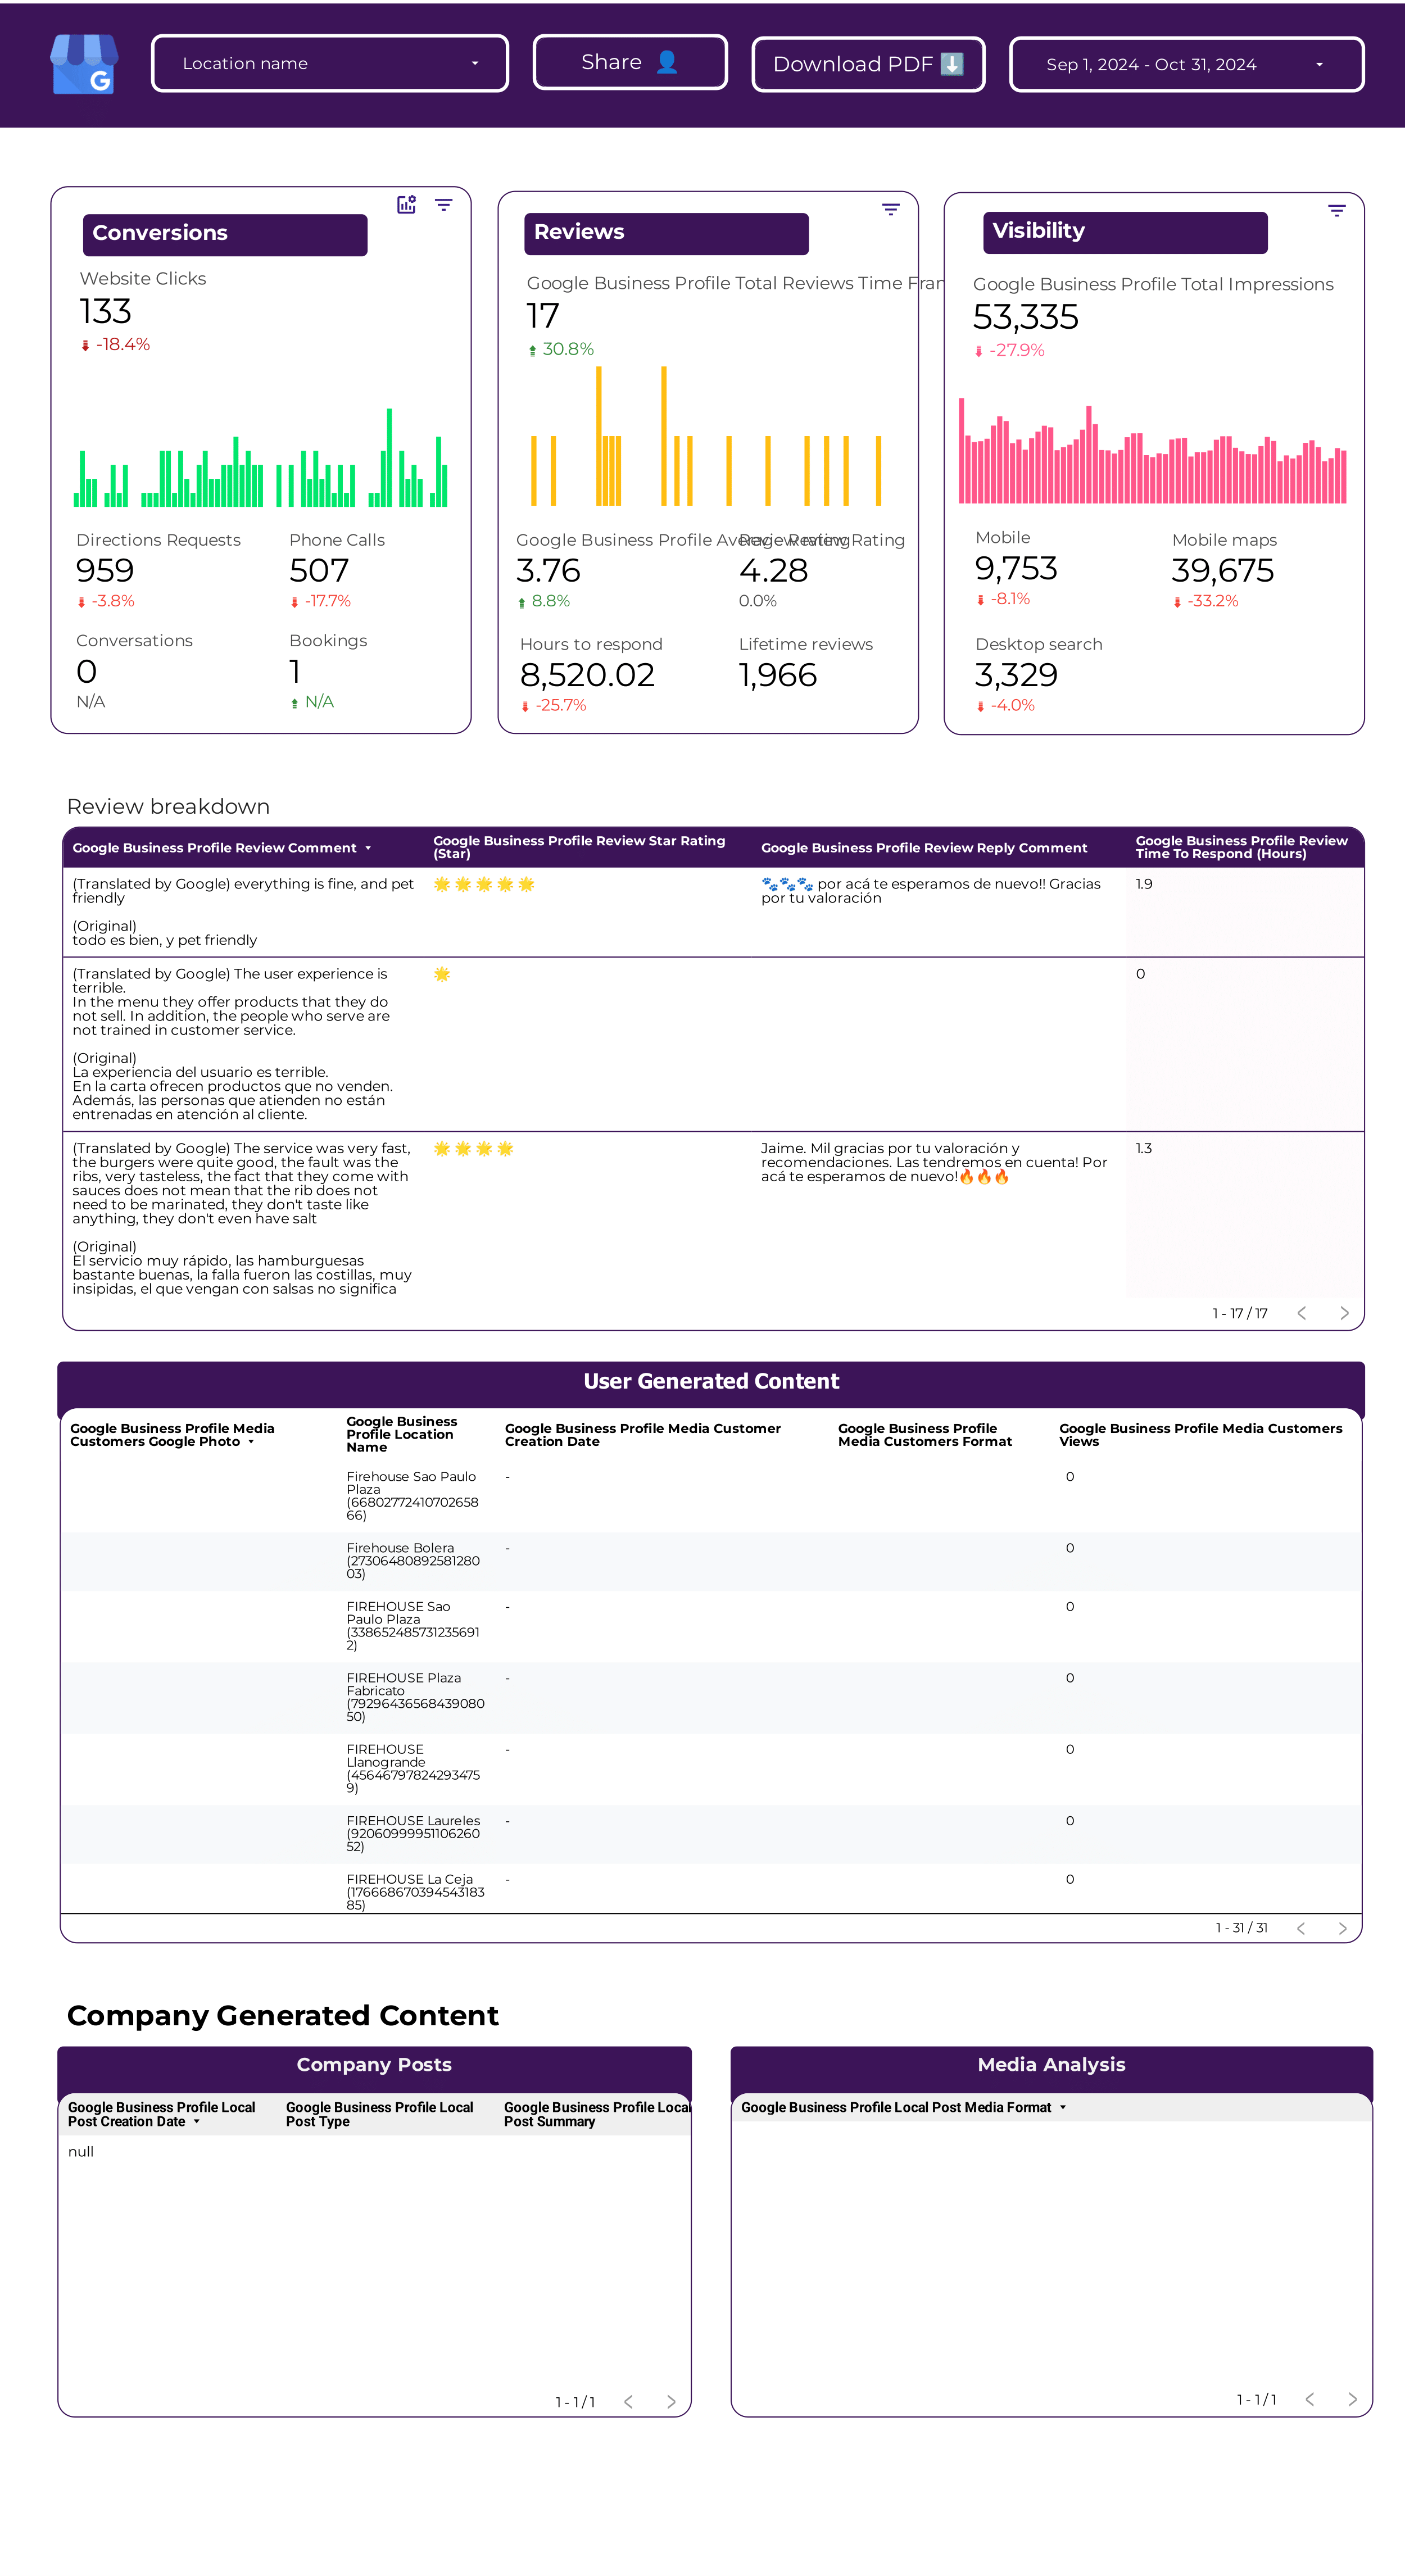
Google Business Profile Report template for Marketing teams and agencies
Optimize your local SEO strategy with this Google Business Profile report template. Track CTR, conversion rate, CAC, clicks, impressions, and reviews. Analyze data by location, age, gender, and time. Perfect for marketing teams aiming to consolidate performance insights and meet specific goals.
PPC monthly Report template for Marketing teams and agencies
Get the actual PPC monthly on Looker Studio template used by Porter to monitor PPC performance.
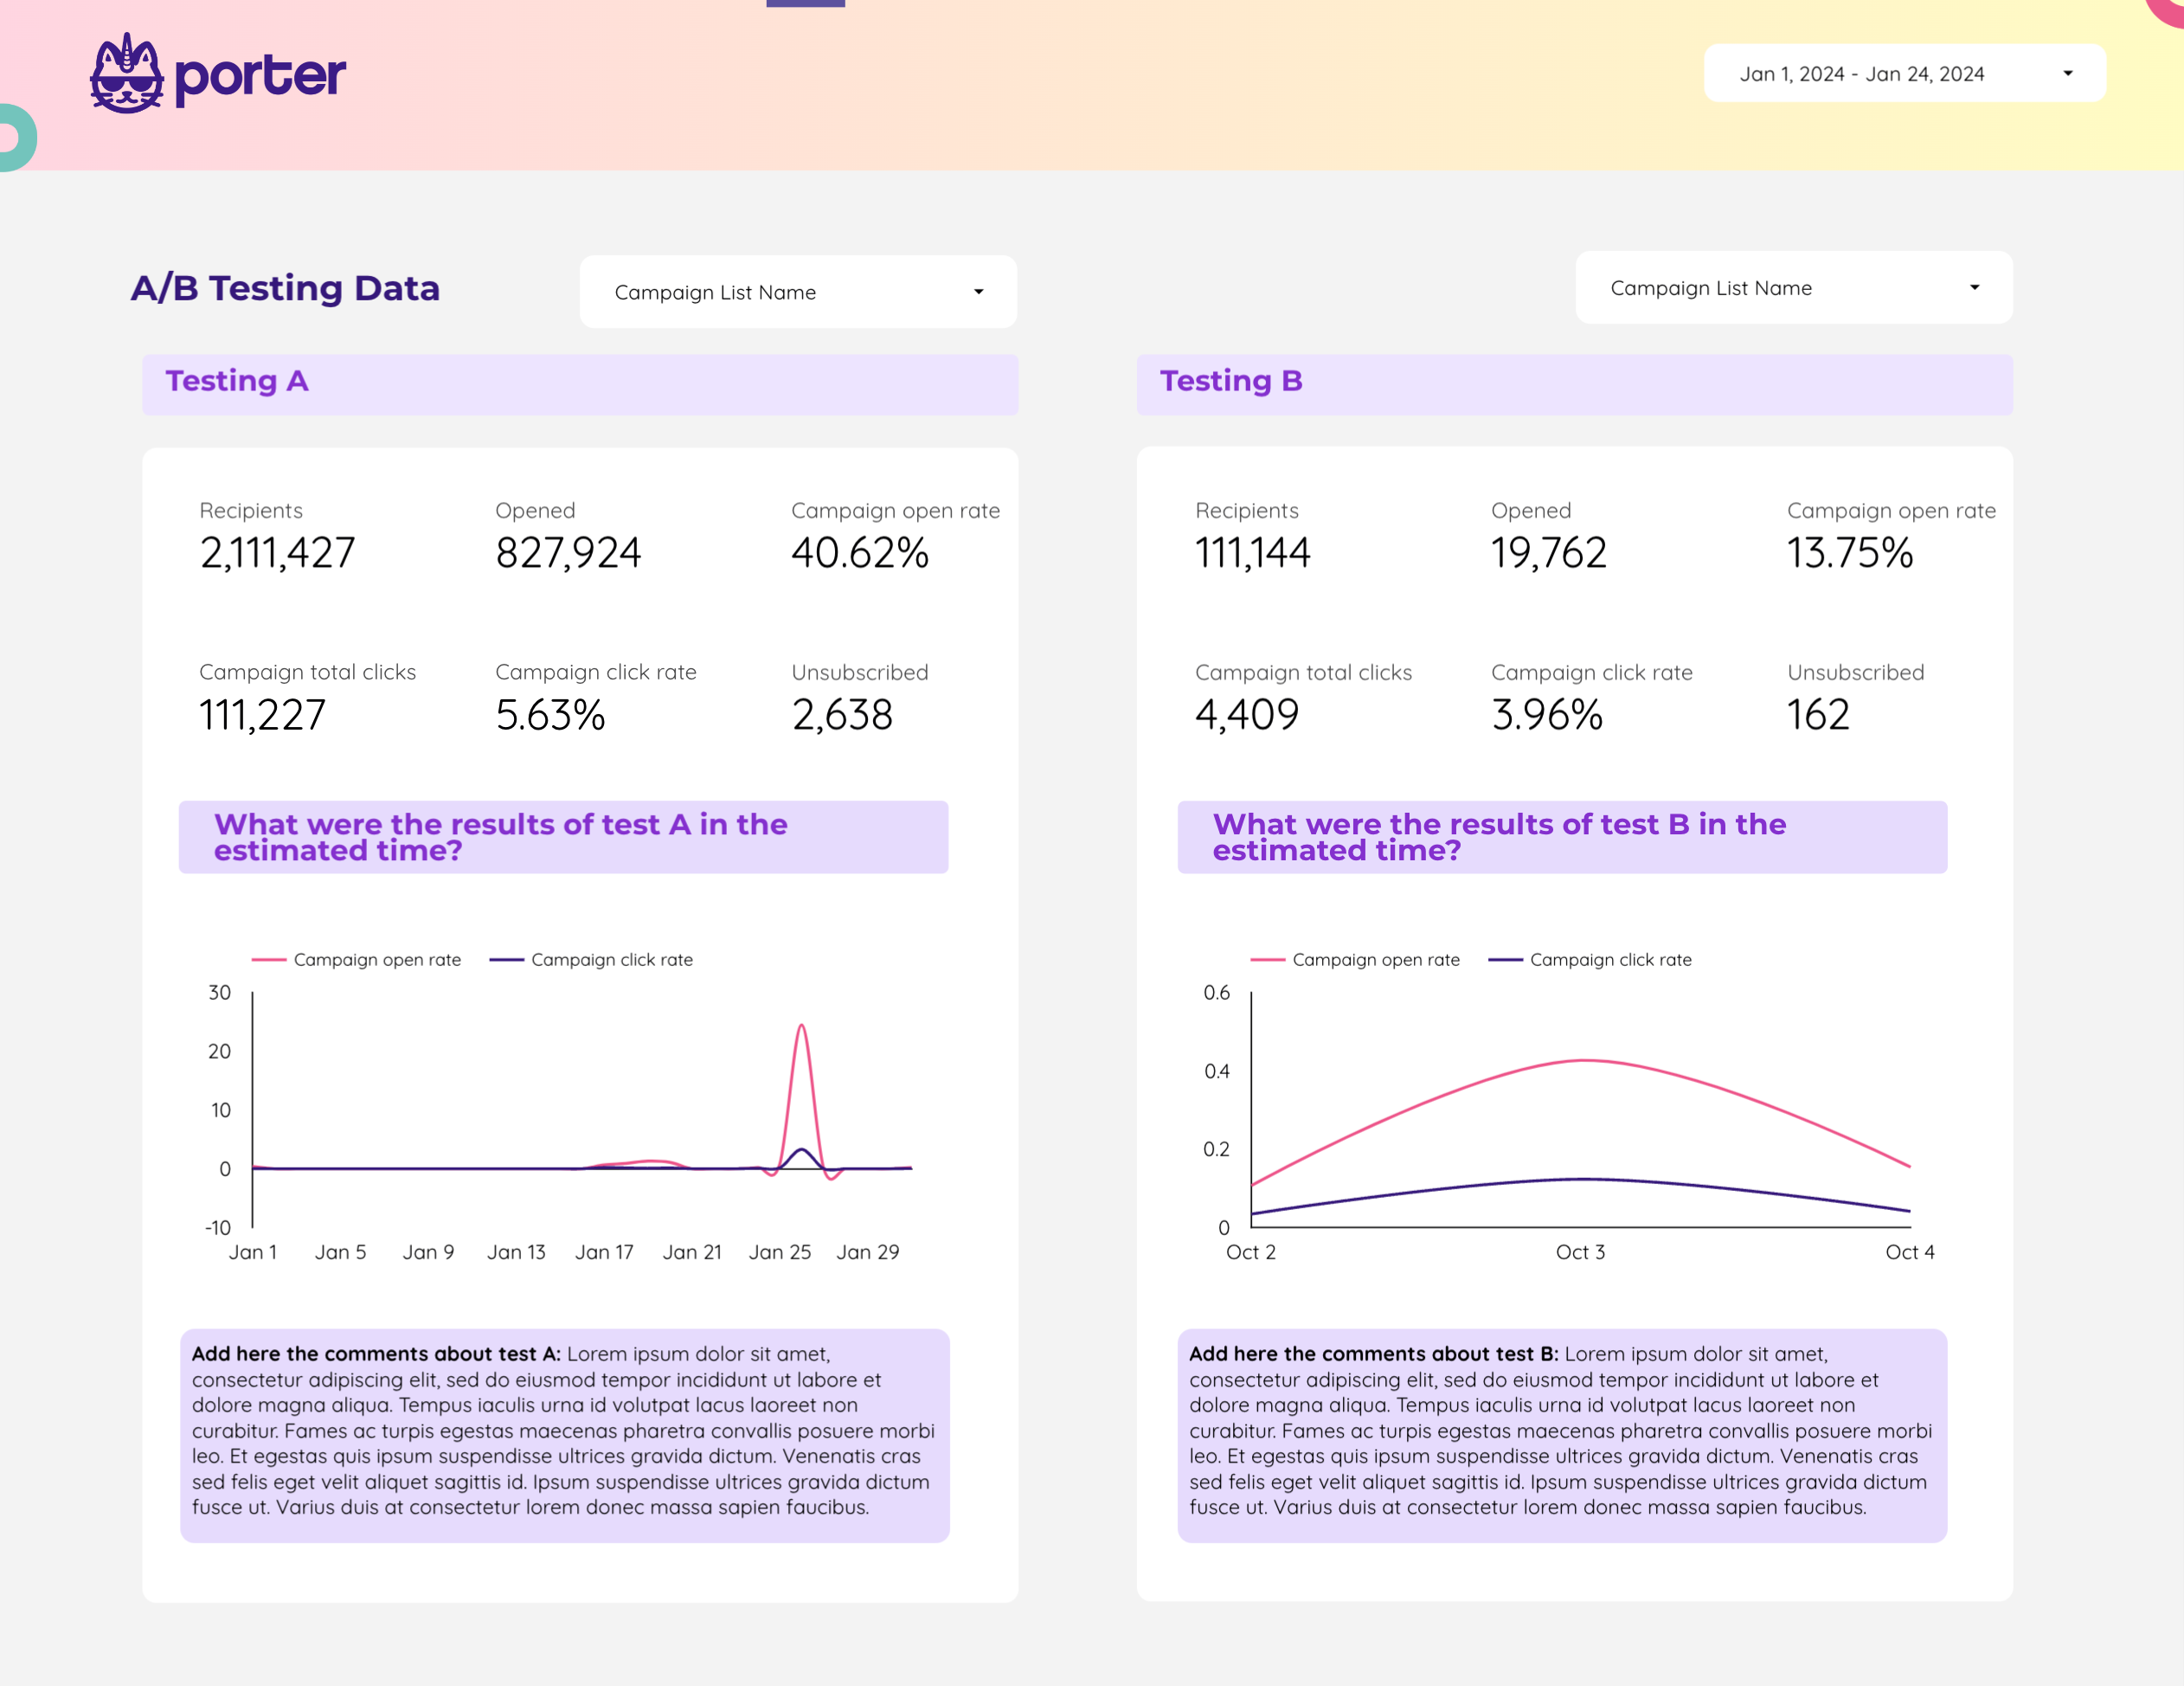
A/B testing Report template for Marketing teams and agencies
Optimize your campaigns with this A/B testing report template. Measure conversion rates, ROI, and click-through rates. Analyze target audience, demographics, and campaign messages. Consolidate data from Email Marketing and Copy for actionable insights. Ideal for marketing teams to track performance and refine strategies.
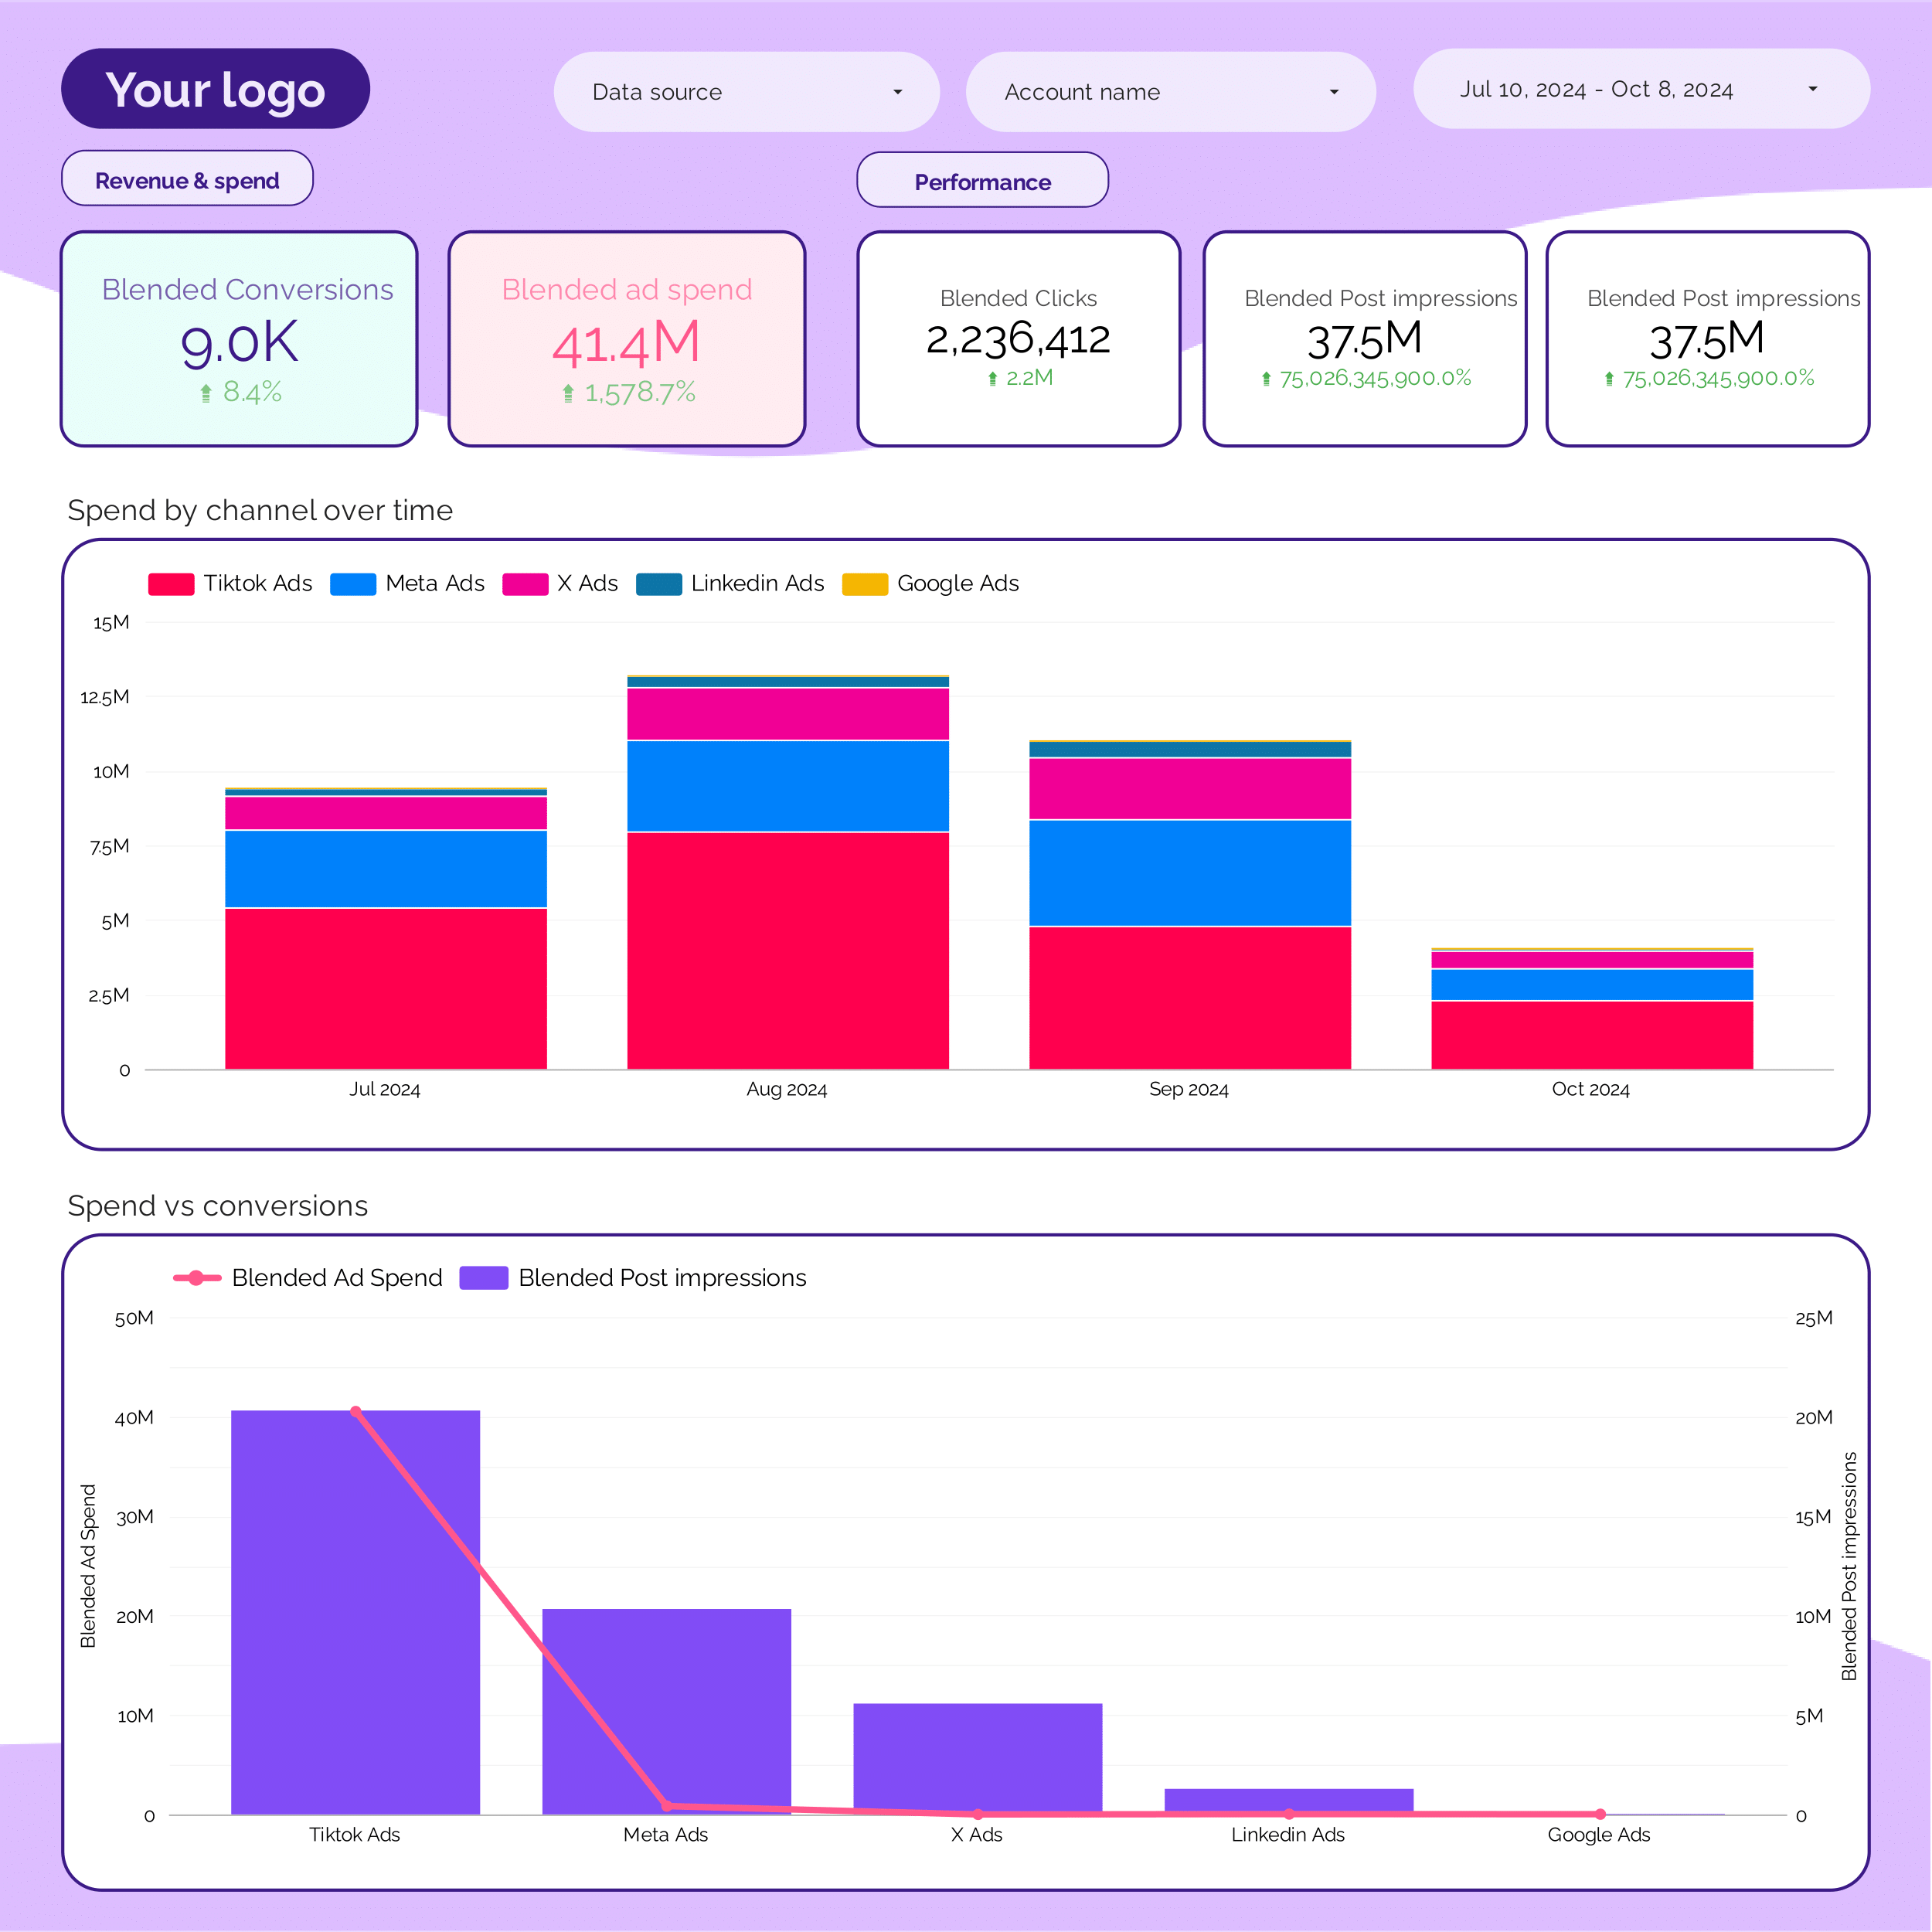
Dropshipping Report template for Marketing teams and agencies
Optimize your marketing strategy with this Dropshipping report template. Measure conversion rates, average order value, and customer lifetime value. Segment by demographics, interests, and time. Consolidate data from E-commerce, Google Analytics 4, Shopify, Google Ads, and Facebook Ads. Perfect for tracking key metrics and enhancing performance in the competitive e-commerce landscape.
Facebook Insights competitors Report template for Marketing teams and agencies
Track key metrics like CTR, conversion rate, and share of voice with the Facebook Insights competitors report template. Analyze performance across demographics, channels, and timeframes. Leverage social media and Facebook public data to refine your strategy. Perfect for marketing teams aiming to consolidate insights and achieve specific goals.
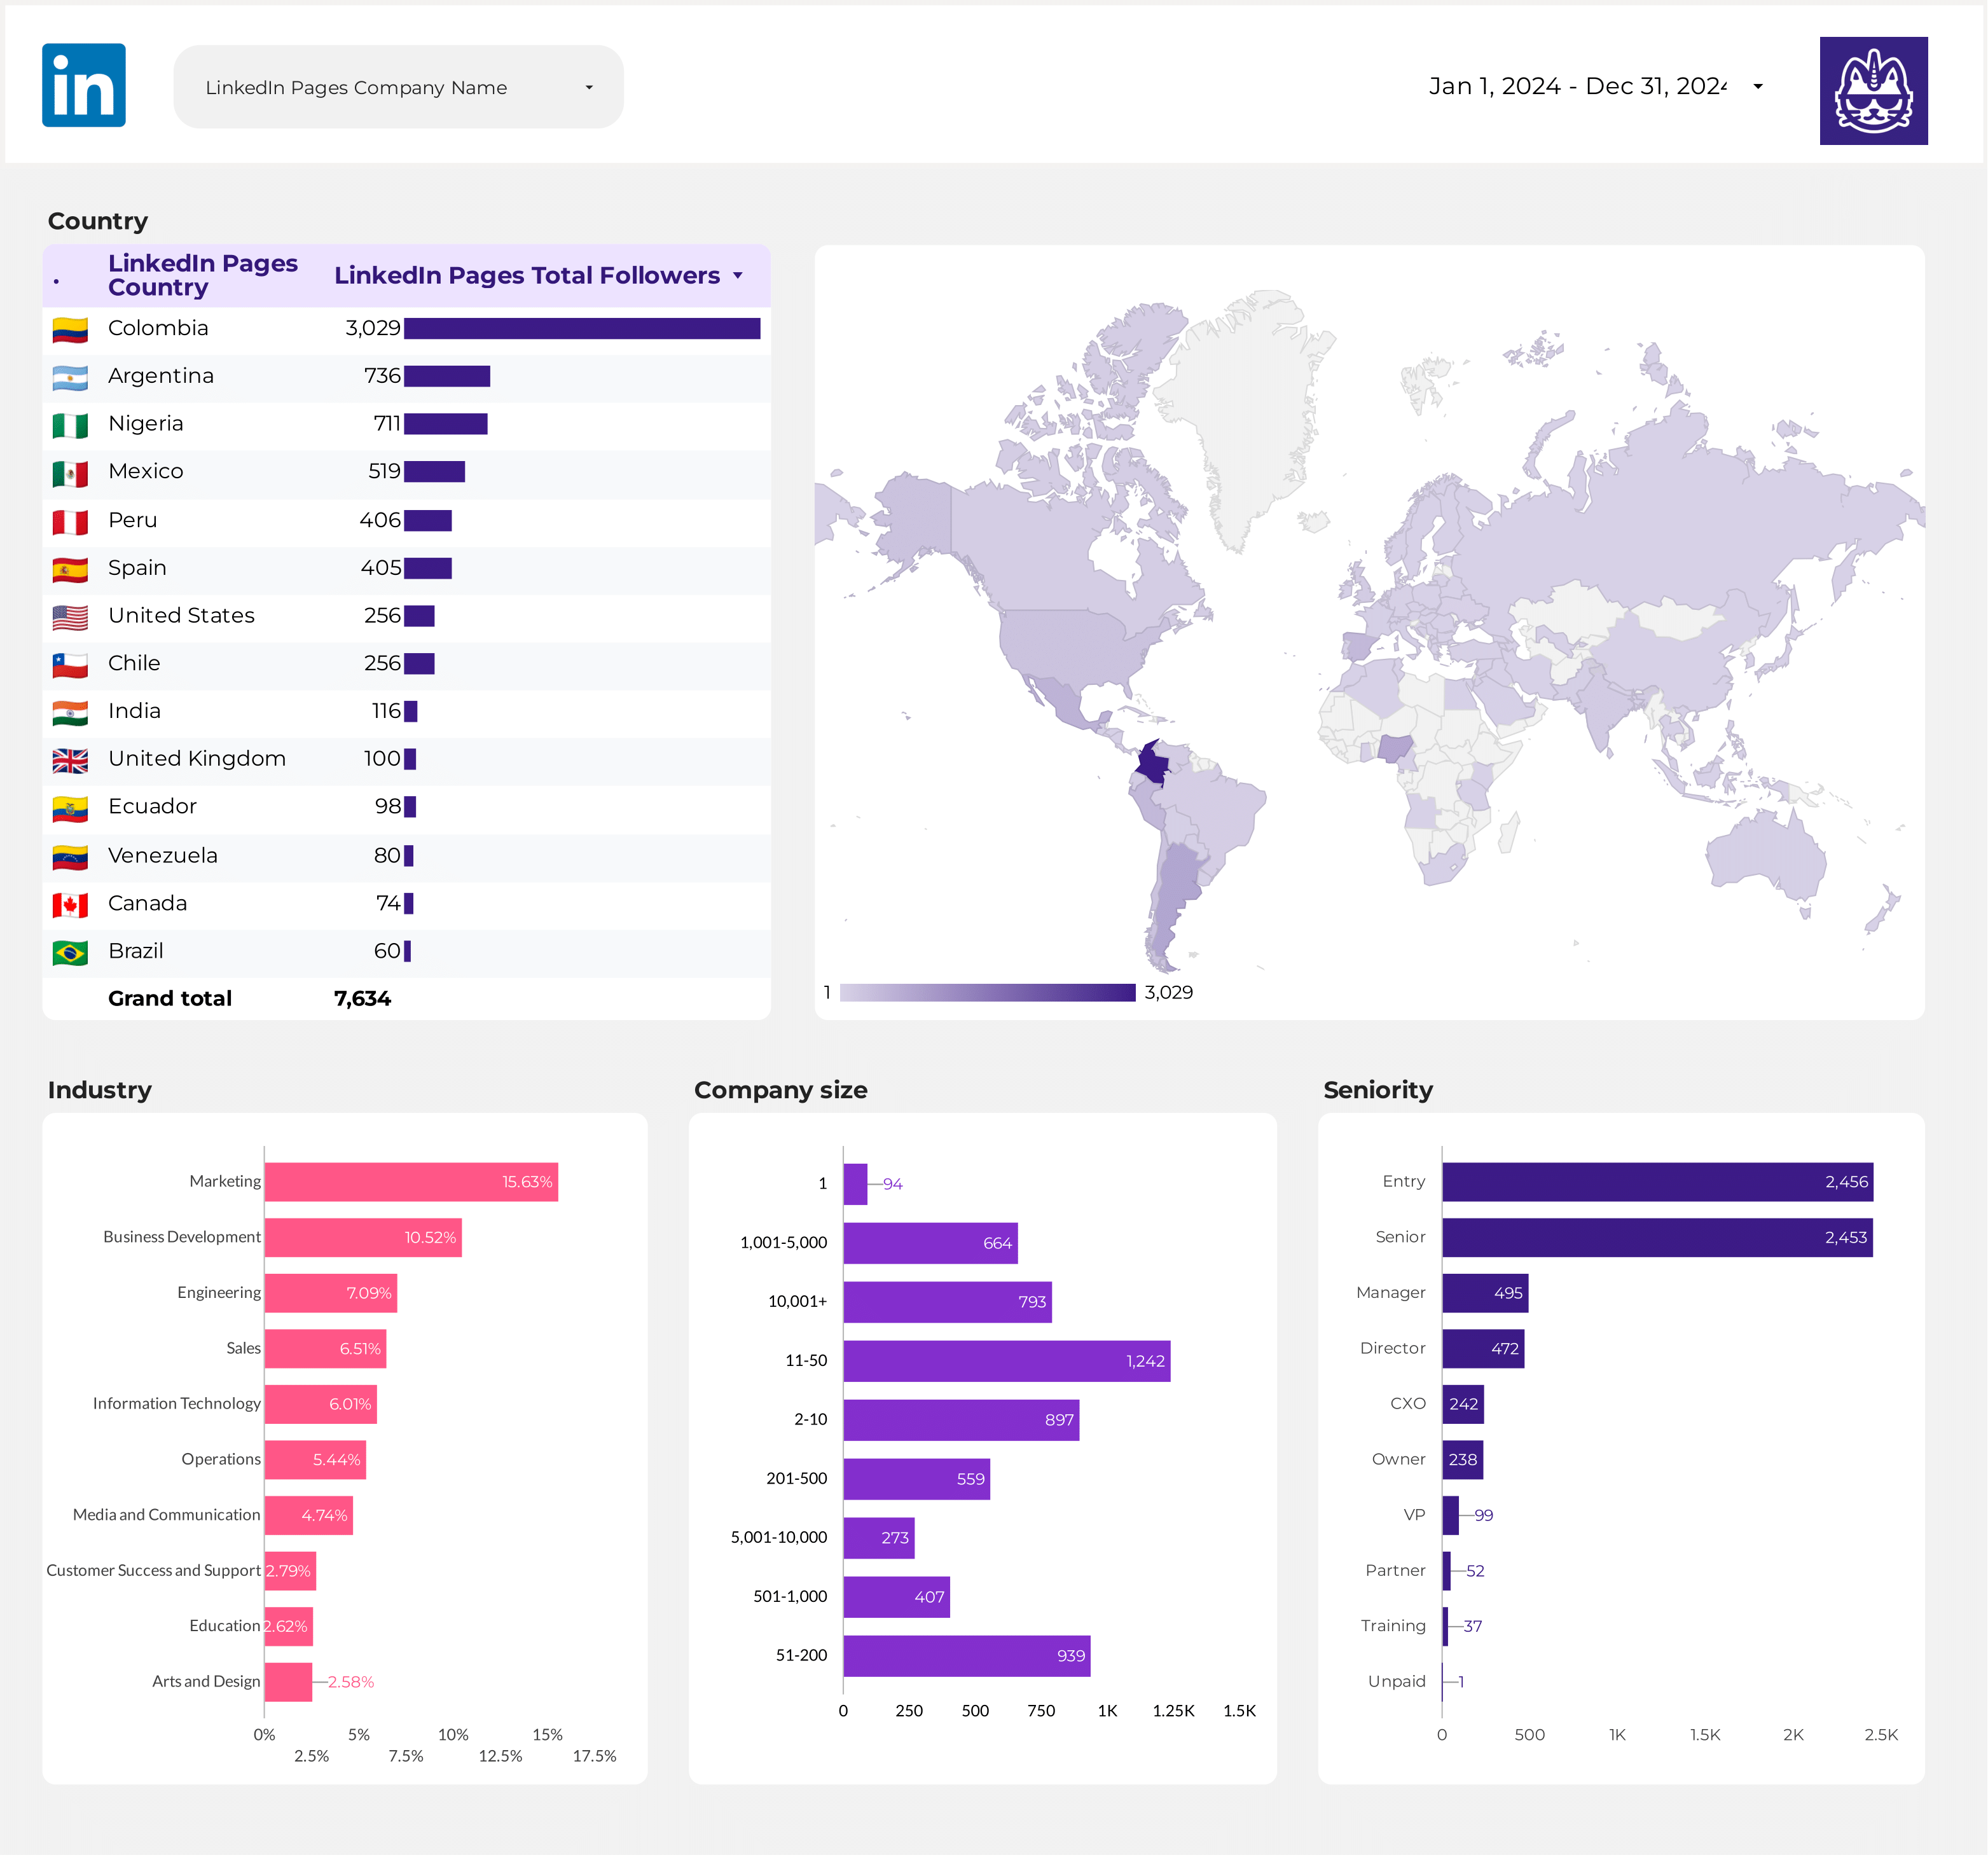
LinkedIn Pages Report template for Marketing teams and agencies
Optimize your LinkedIn Pages strategy with this report template. Track CTR, conversion rate, and engagement. Analyze metrics by audience, objectives, and channels. Measure performance across demographics and timeframes. Perfect for marketing teams to refine strategies and achieve LinkedIn goals.

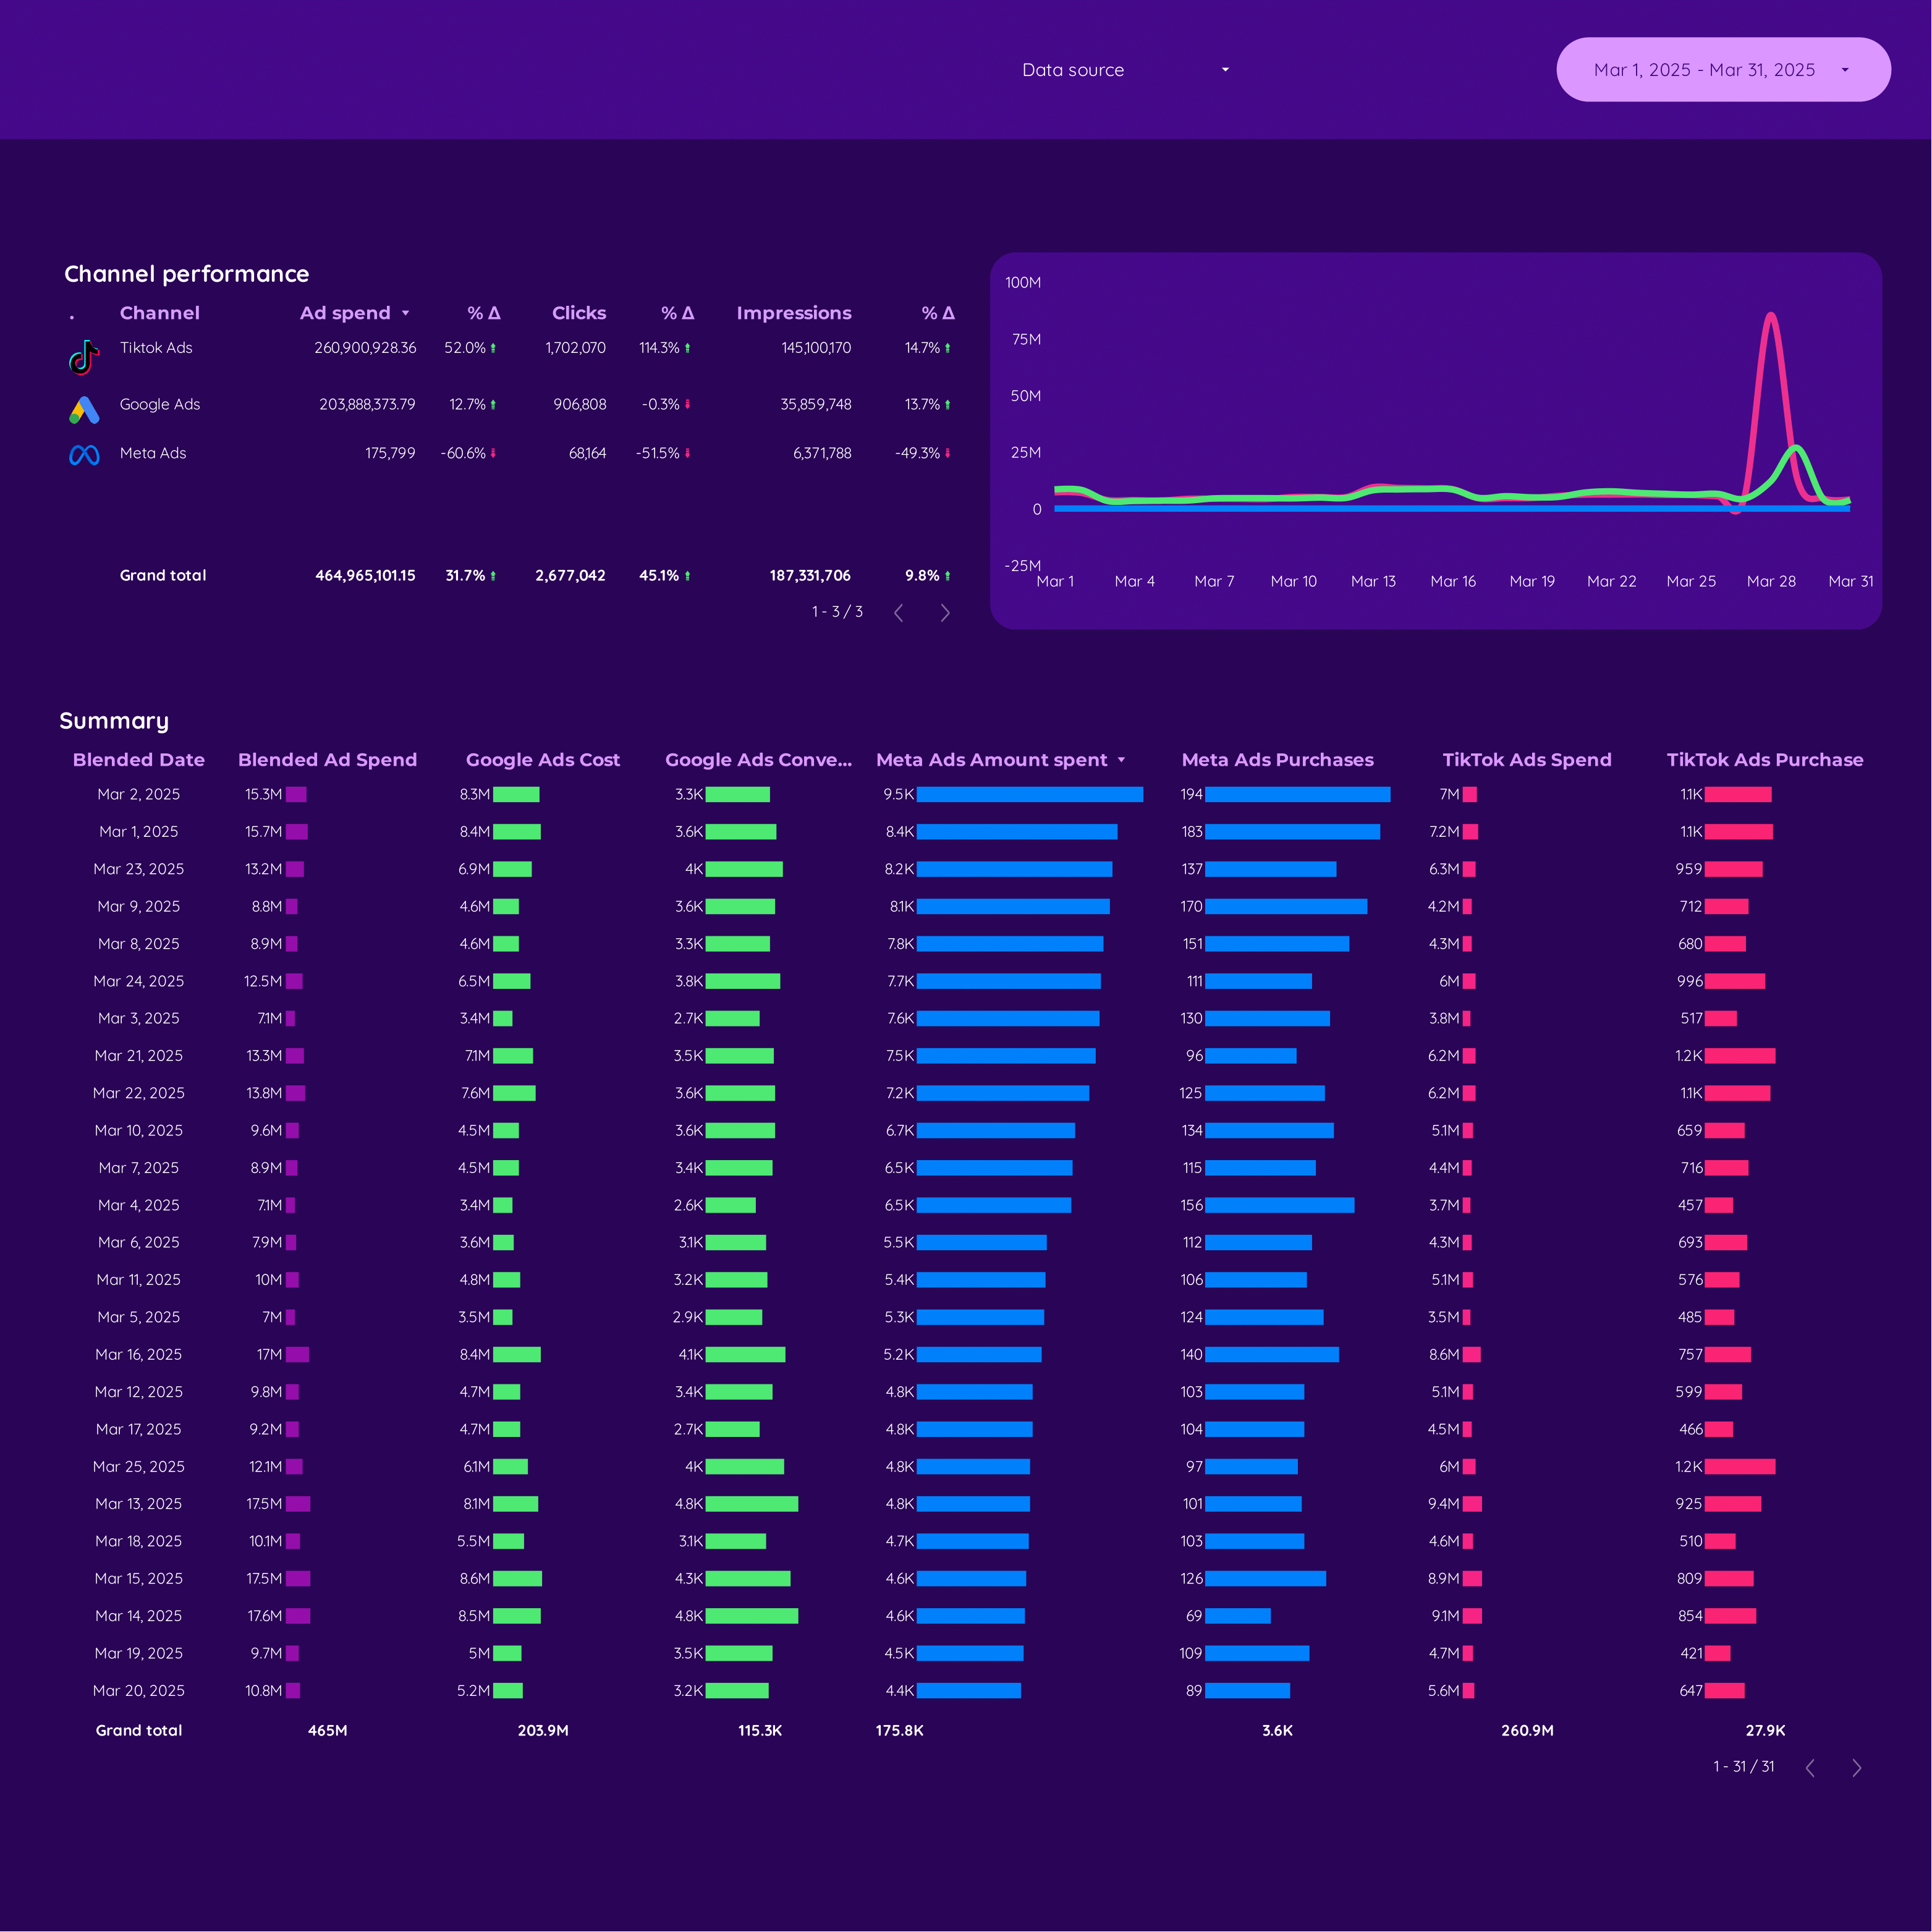
PPC multi-channel Report template for Marketing teams and agencies
Get the actual PPC multi-channel on Looker Studio template used by Porter to monitor PPC performance.
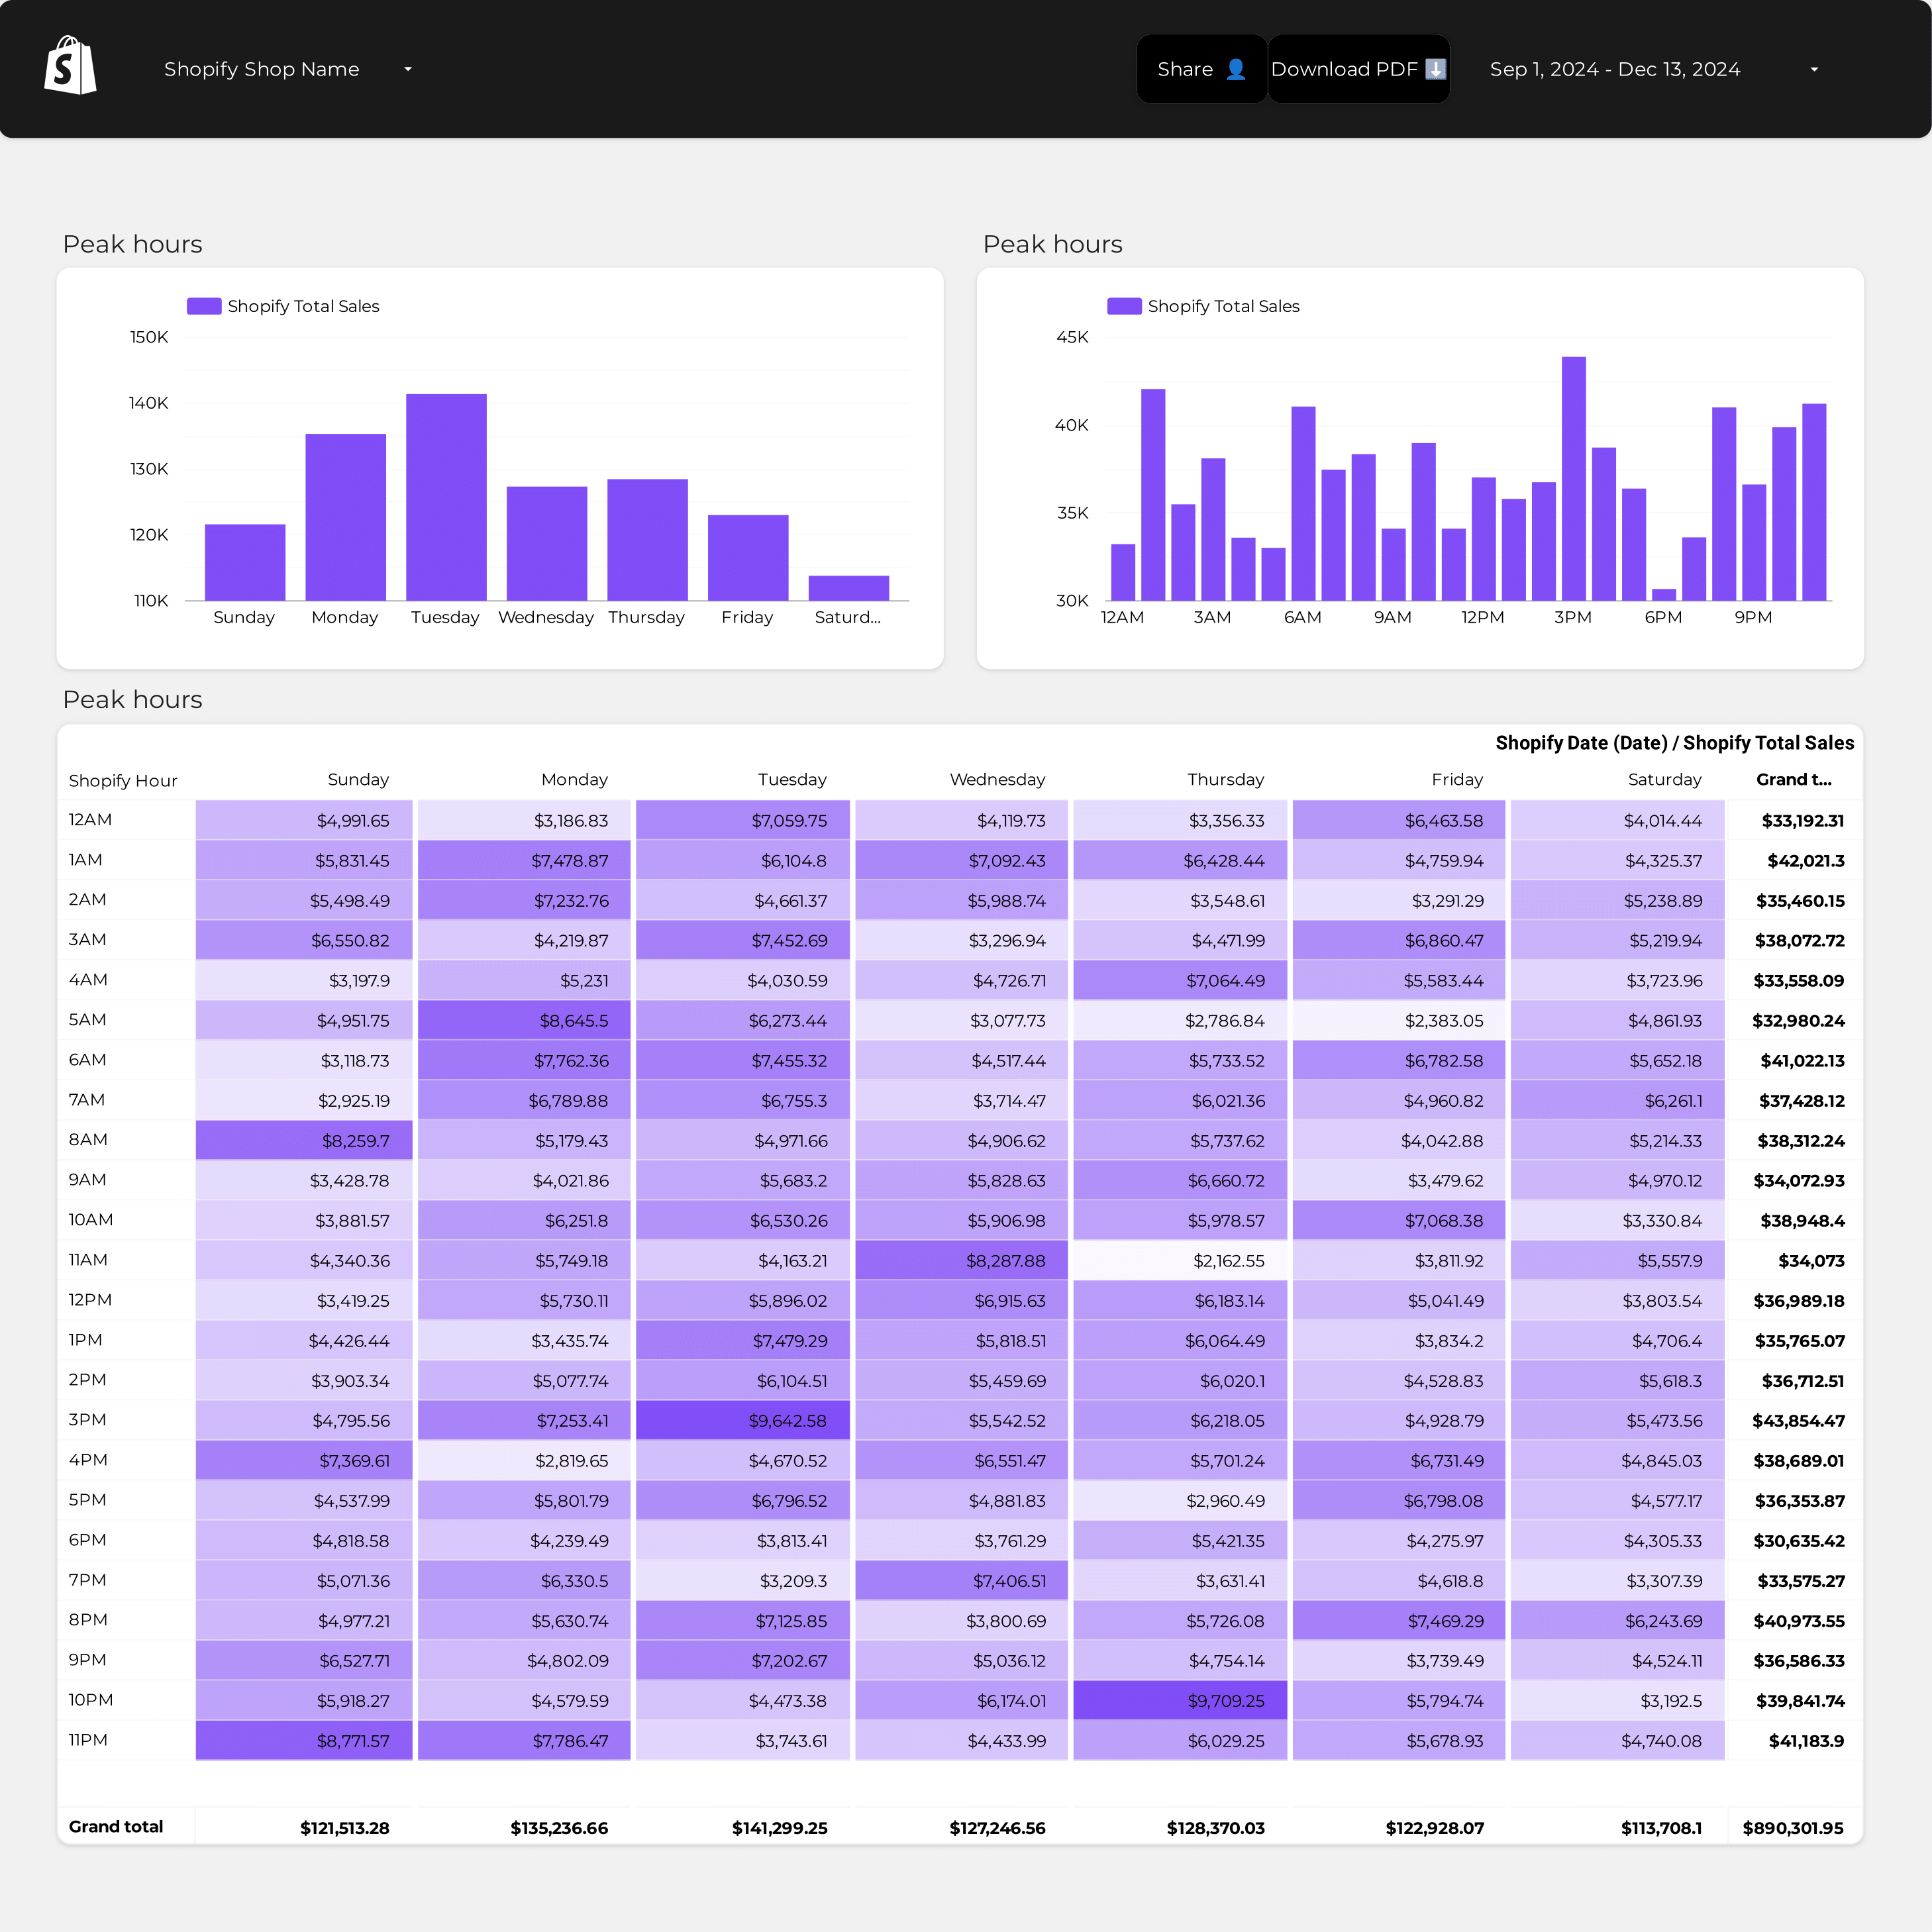
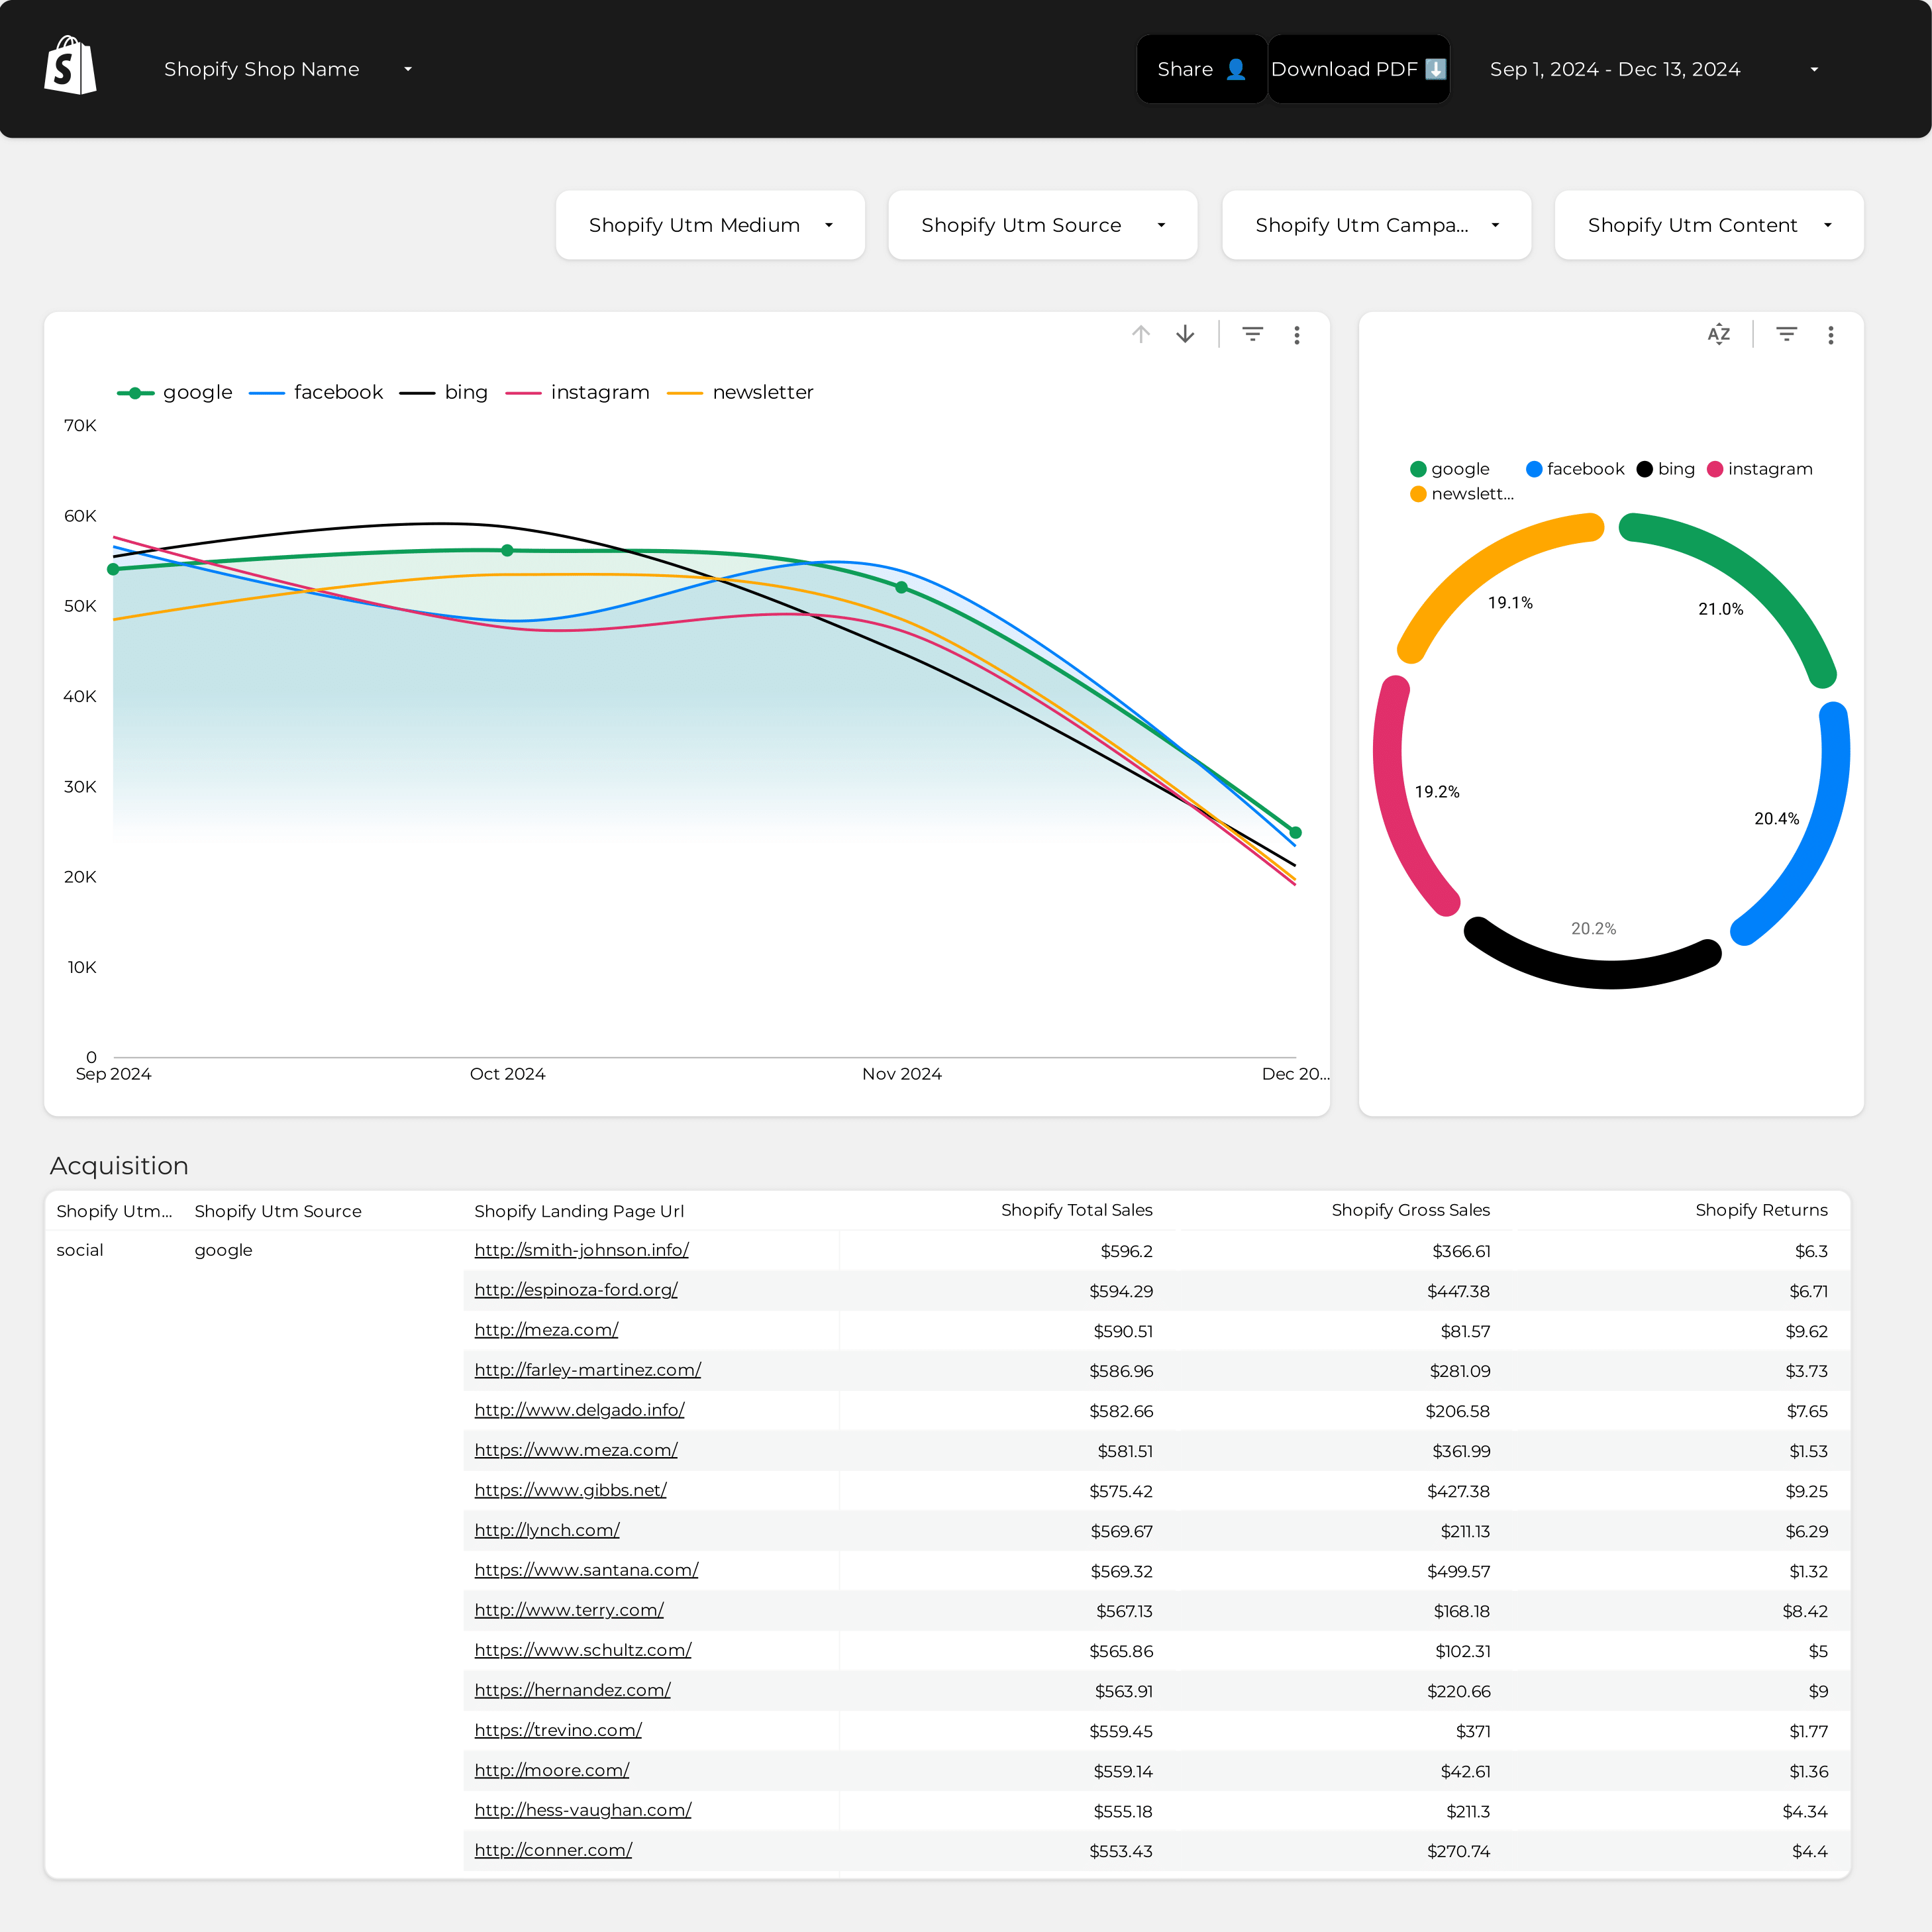
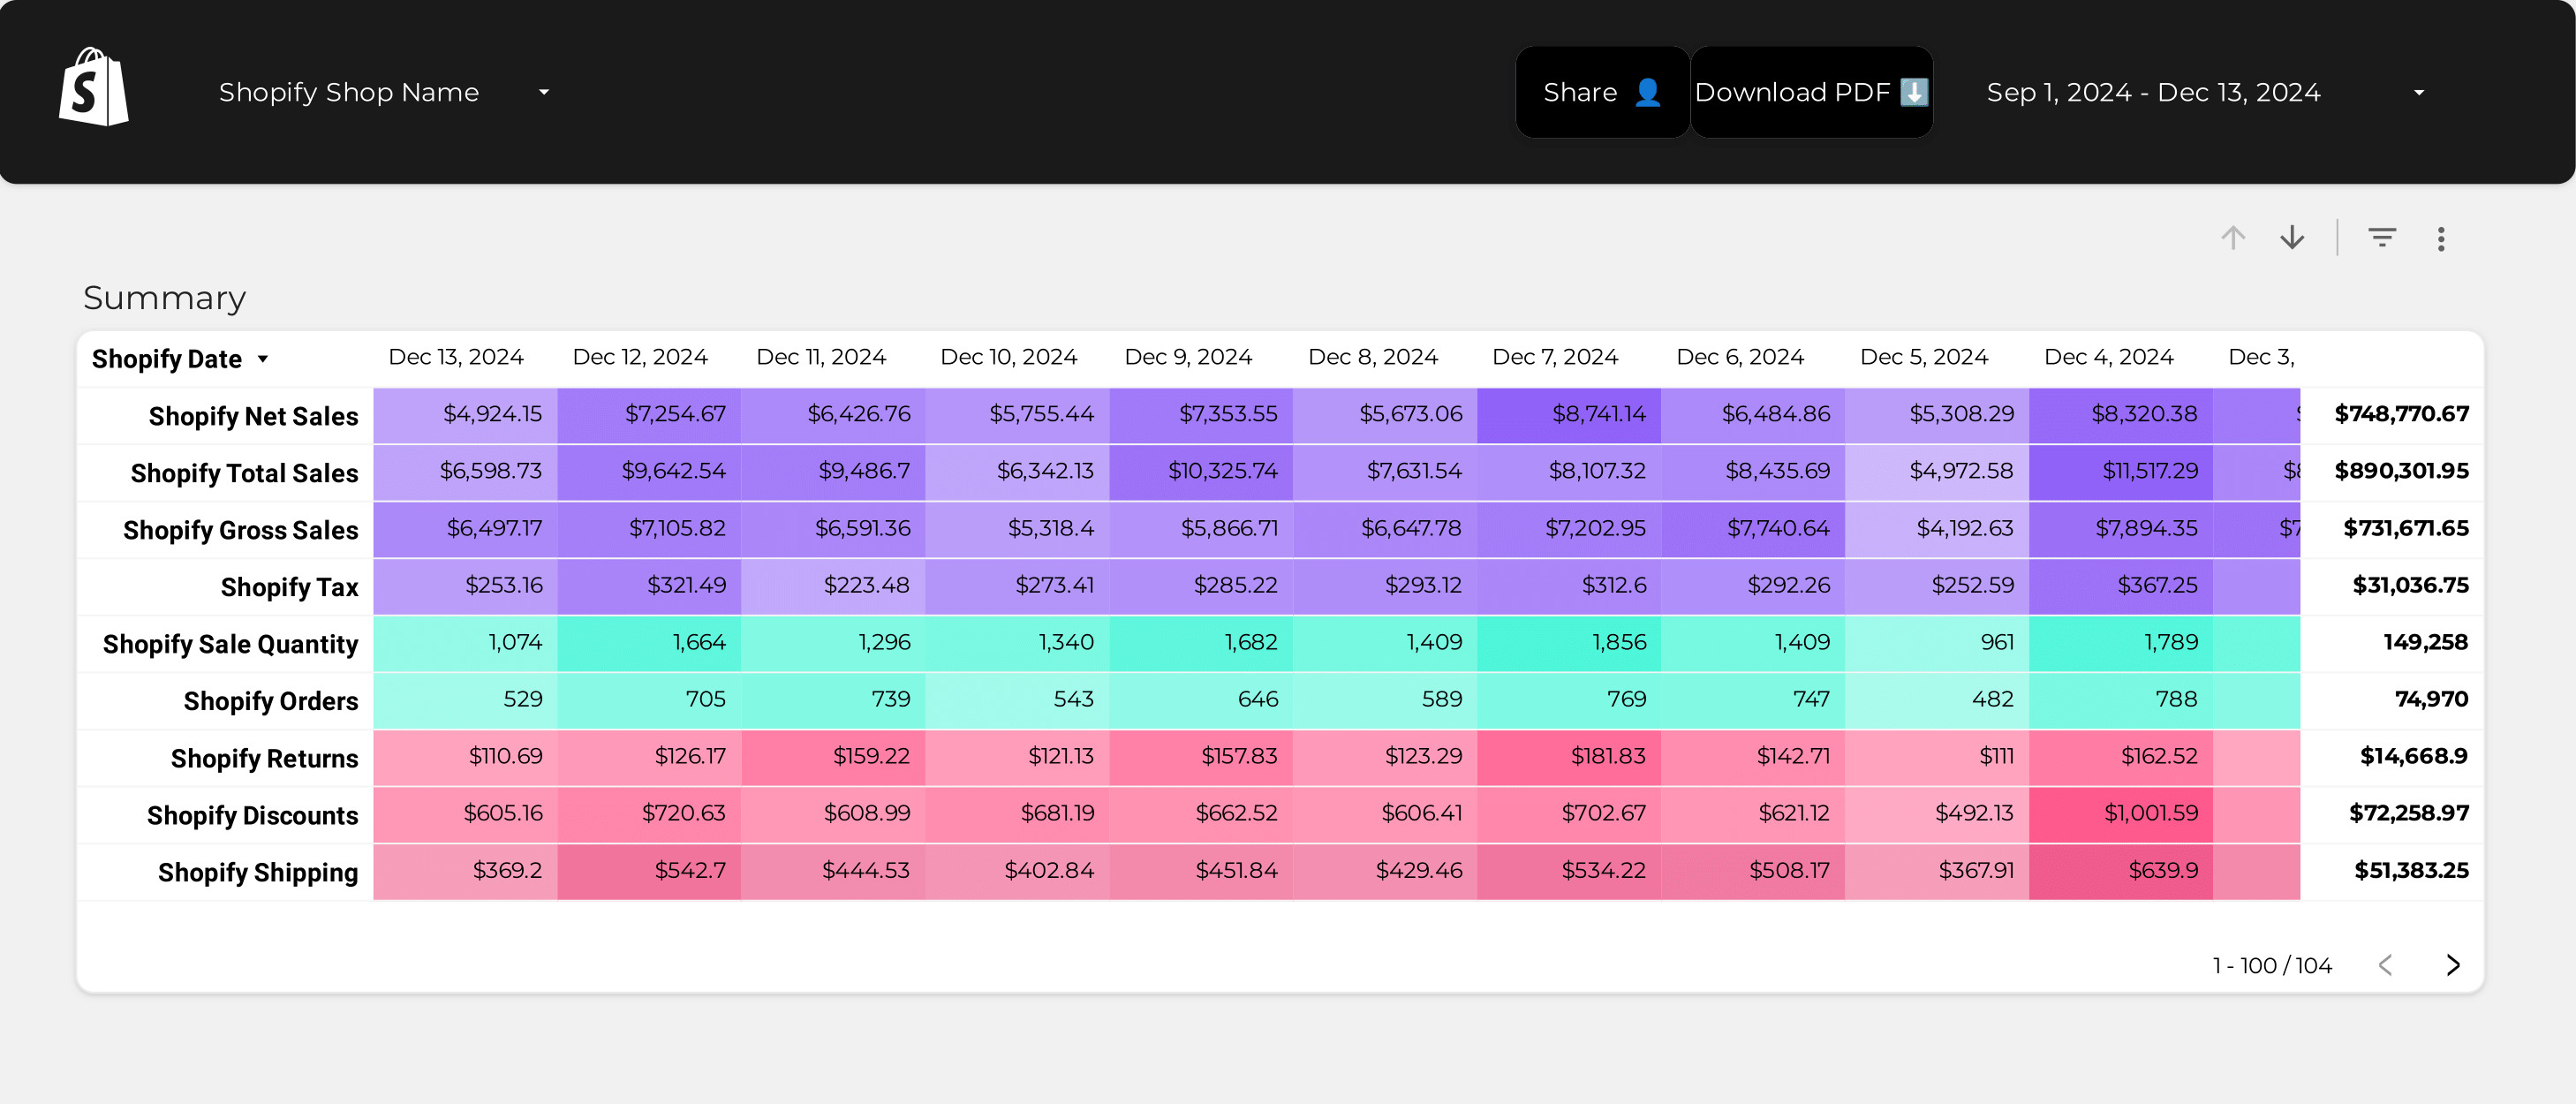
Shopify Store performance Report template for Marketing teams and agencies
Measure key metrics with the Store performance report template. Analyze total revenue, conversion rates, and traffic sources. Segment by audience, marketing channels, and campaign objectives. Consolidate data from E-commerce, Google Analytics 4, Shopify, Google Ads, Facebook Ads, and SEO. Perfect for marketing teams to track performance and optimize strategies.
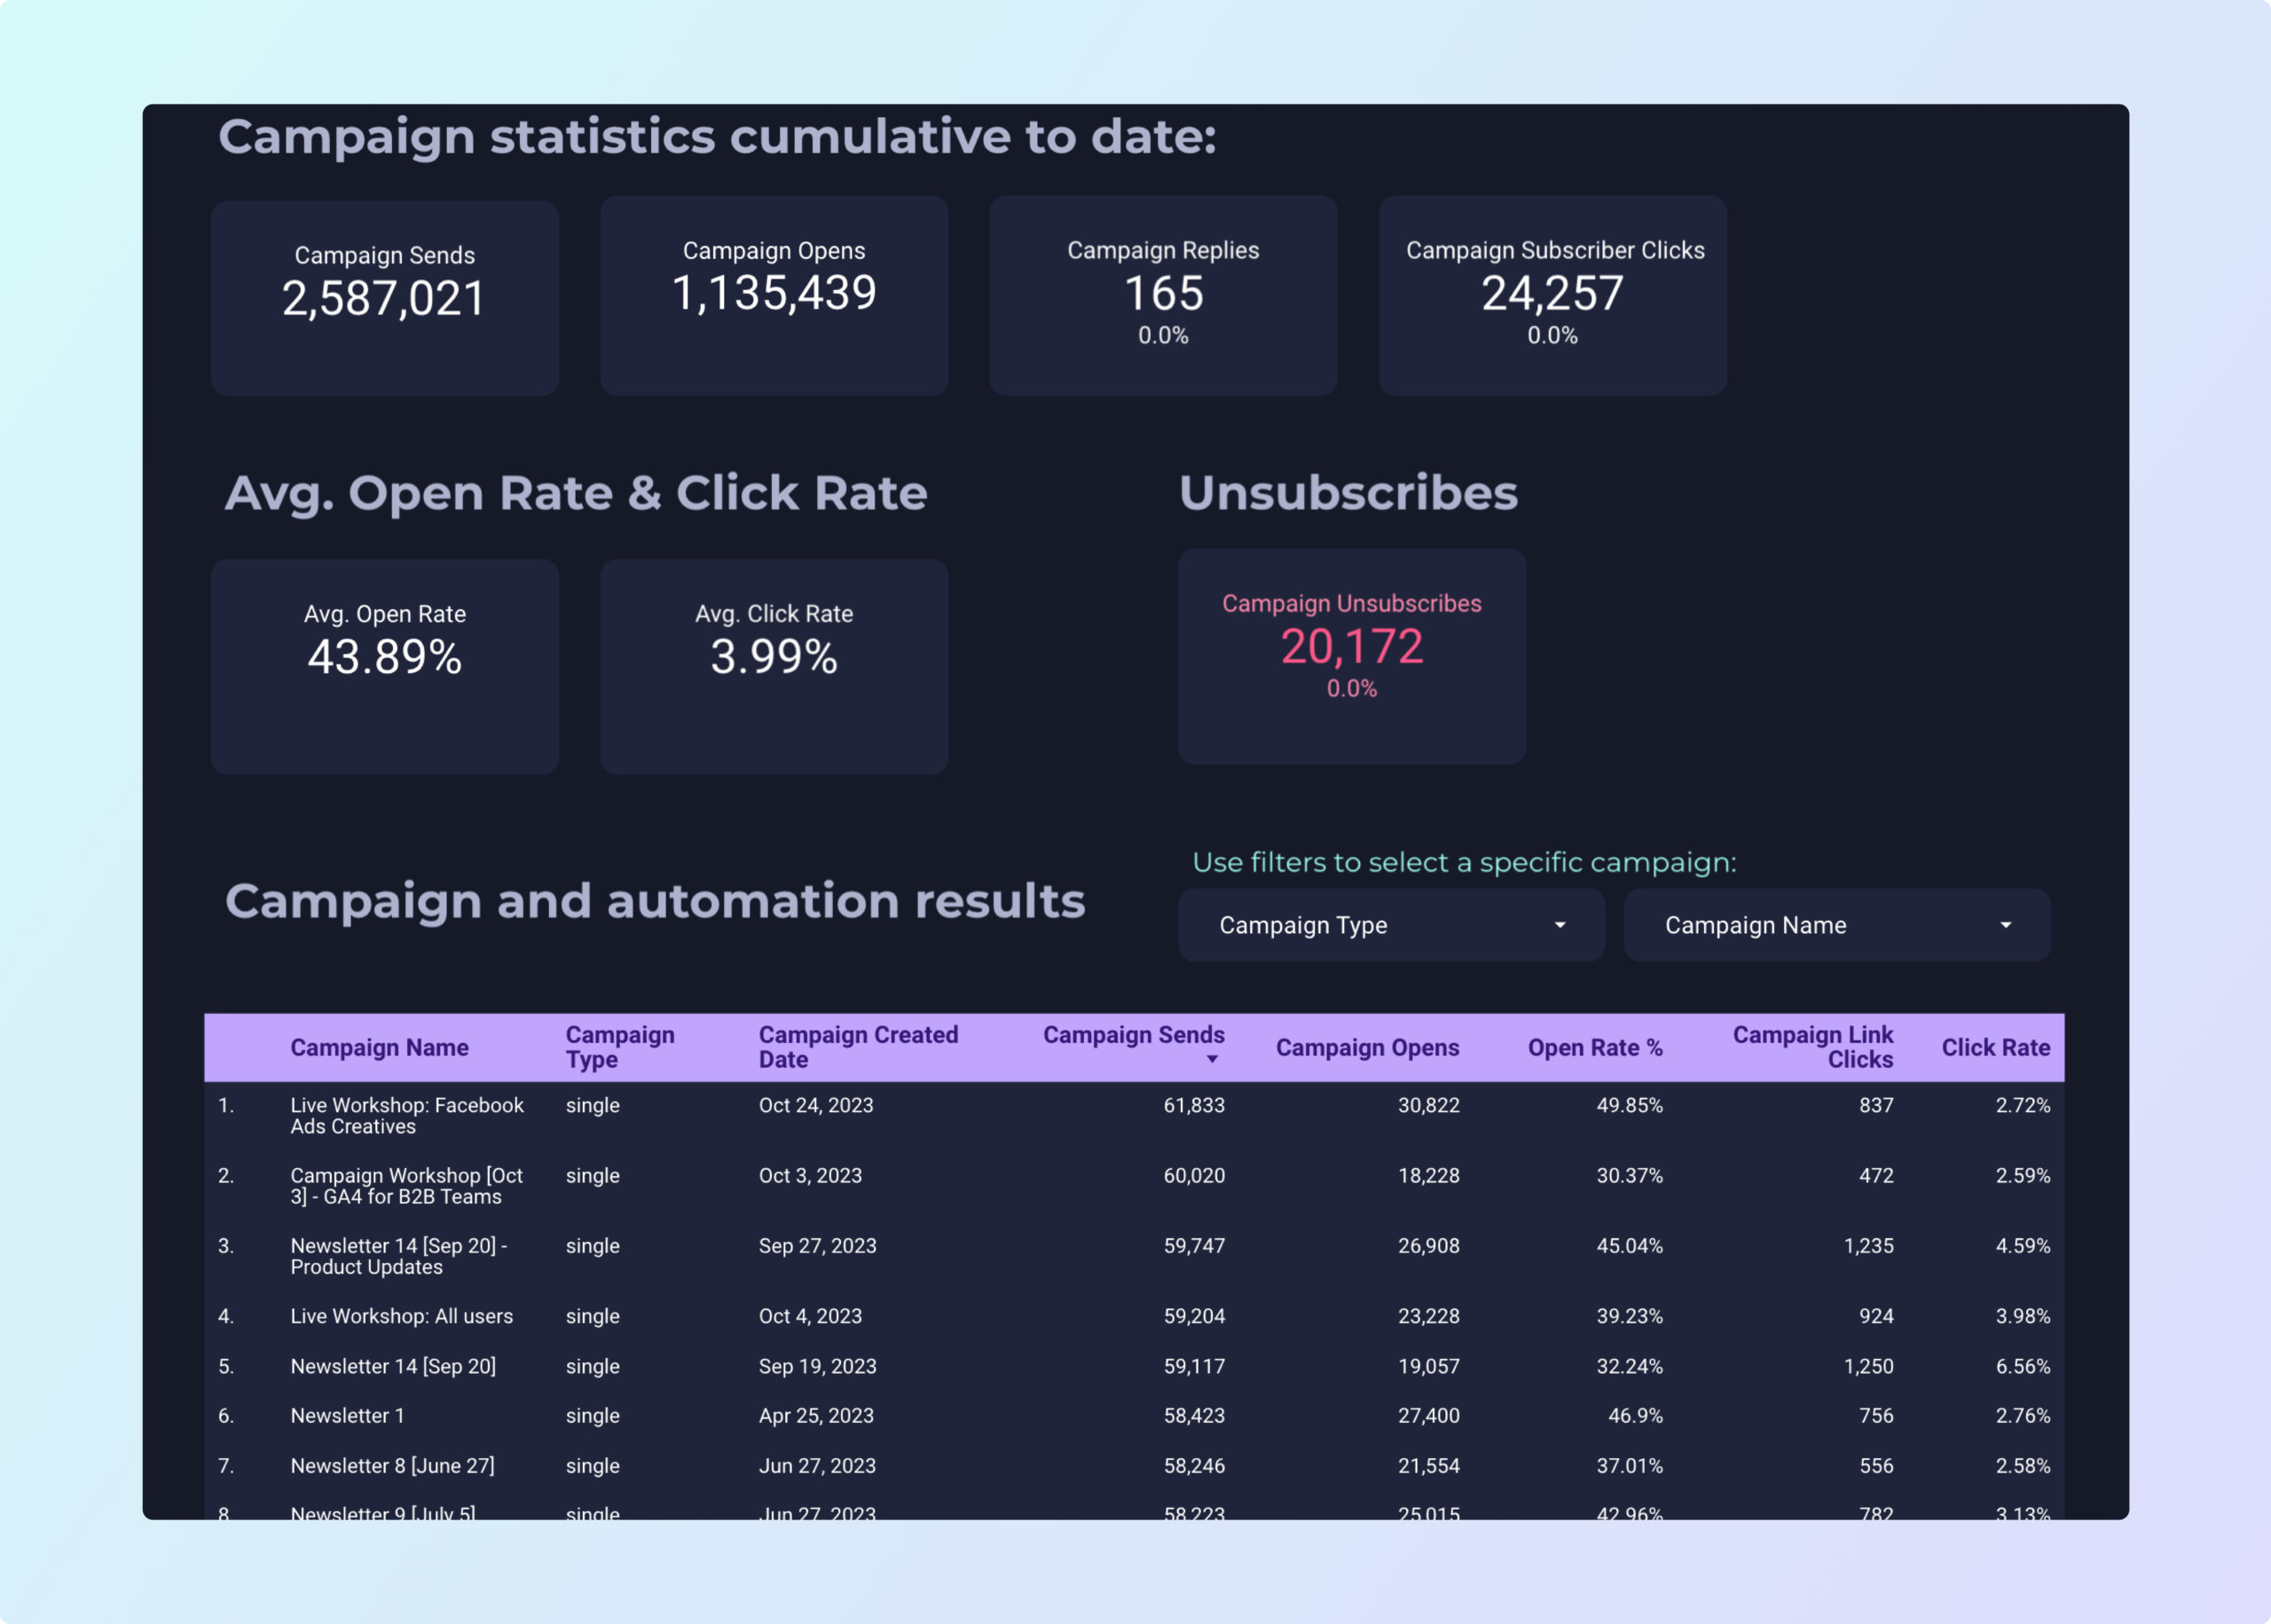
ActiveCampaign Report template for Marketing teams and agencies
ActiveCampaign report template: Track key metrics like click-through rate, conversion rate, and ROI. Analyze customer acquisition cost and average order value. Segment by audience, campaign objectives, and timeline. Ideal for B2B, CRM, and email marketing teams seeking actionable insights through automation.


