


To export Facebook Ads data to Google Sheets, download the Facebook Ads to Sheets add-on, connect your Facebook profile, select ad accounts, set a conversion window and date, metrics, dimensions (or breakdowns), and date ranges, and schedule hourly, daily, or weekly data refreshes to monitor your Facebook Ads campaigns performance and automate your marketing reports.
By the end of the tutorial, you’ll know:
- 4 free and paid ways to connect Facebook Ads to Google Sheets
- Schedule automatic data refreshes
- 4 Ways to Analyze Facebook Ads Data on Google Sheets
- Free Facebook Ads report templates for Sheets
- Available Facebook Ads metrics and dimensions
4 free and paid ways to export Facebook Ads data to Google Sheets
There are 4 free and paid ways to export Facebook Ads data on Google Sheets:
- Google Sheets add-ons (Paid, suggested for this tutorial)
- Automation tools (Paid)
- Web scraping with a Chrome extension (Paid)
- Manually exporting a CVS file (Free)
1st way: Facebook Ads add-on for Google Sheets
Step 1: Install the Google Sheets add-on
Install the Facebook Ads to Google Sheets add-on and open a new sheet.

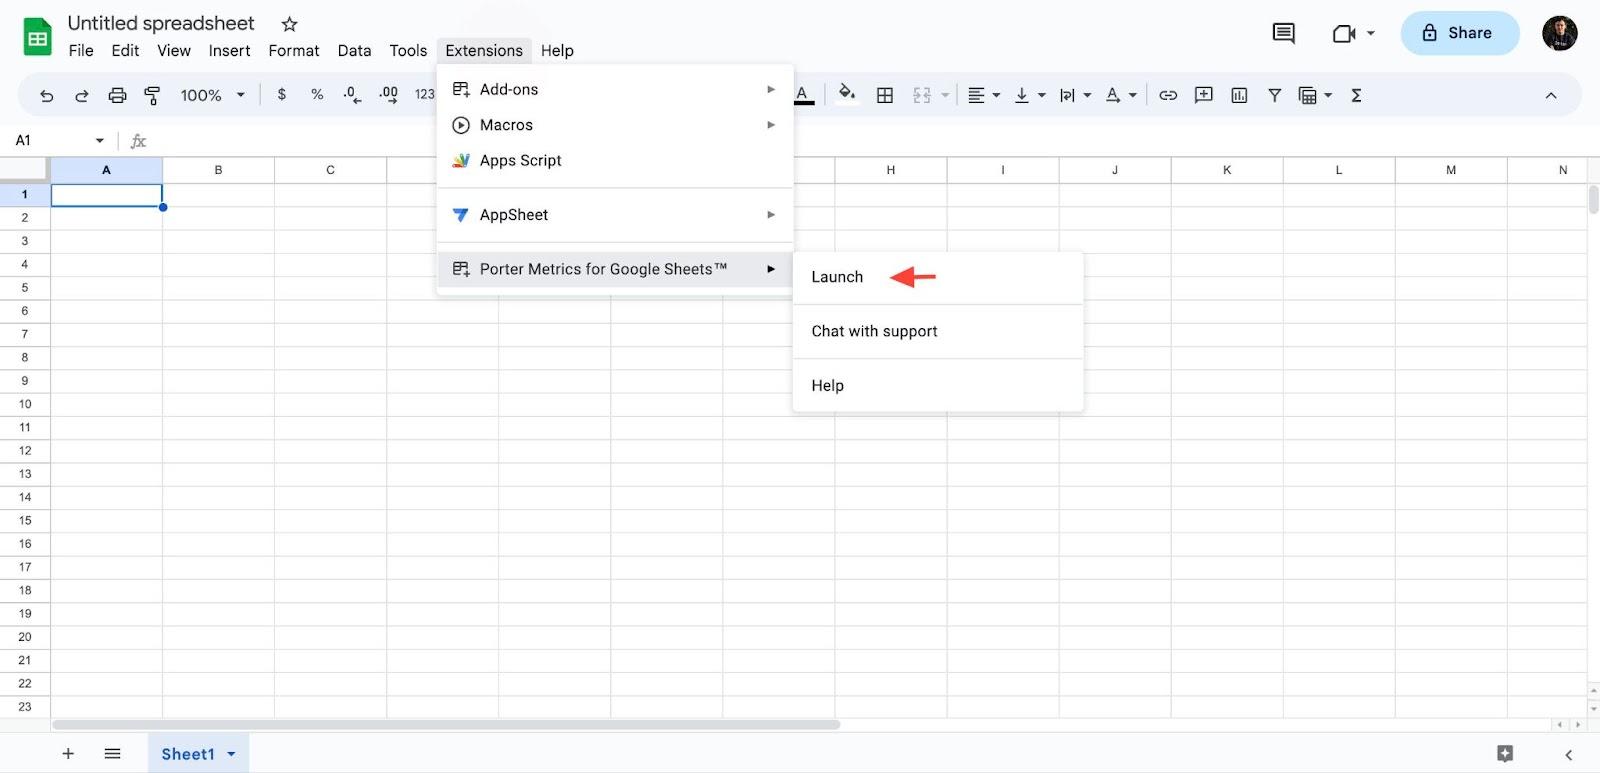
On your Sheet, go to Extensions – Porter Metrics add-on – Launch.
Step 2: Connect your Facebook profile
Choose the Facebook Ads integration and connect your Facebook profile. Porter will bring all the ad accounts associated.
Optionally, connect multiple Facebook personal profiles to retrieve other ad accounts’ data yours doesn’t have access to.

Step 3: Set up your Facebook Ads query
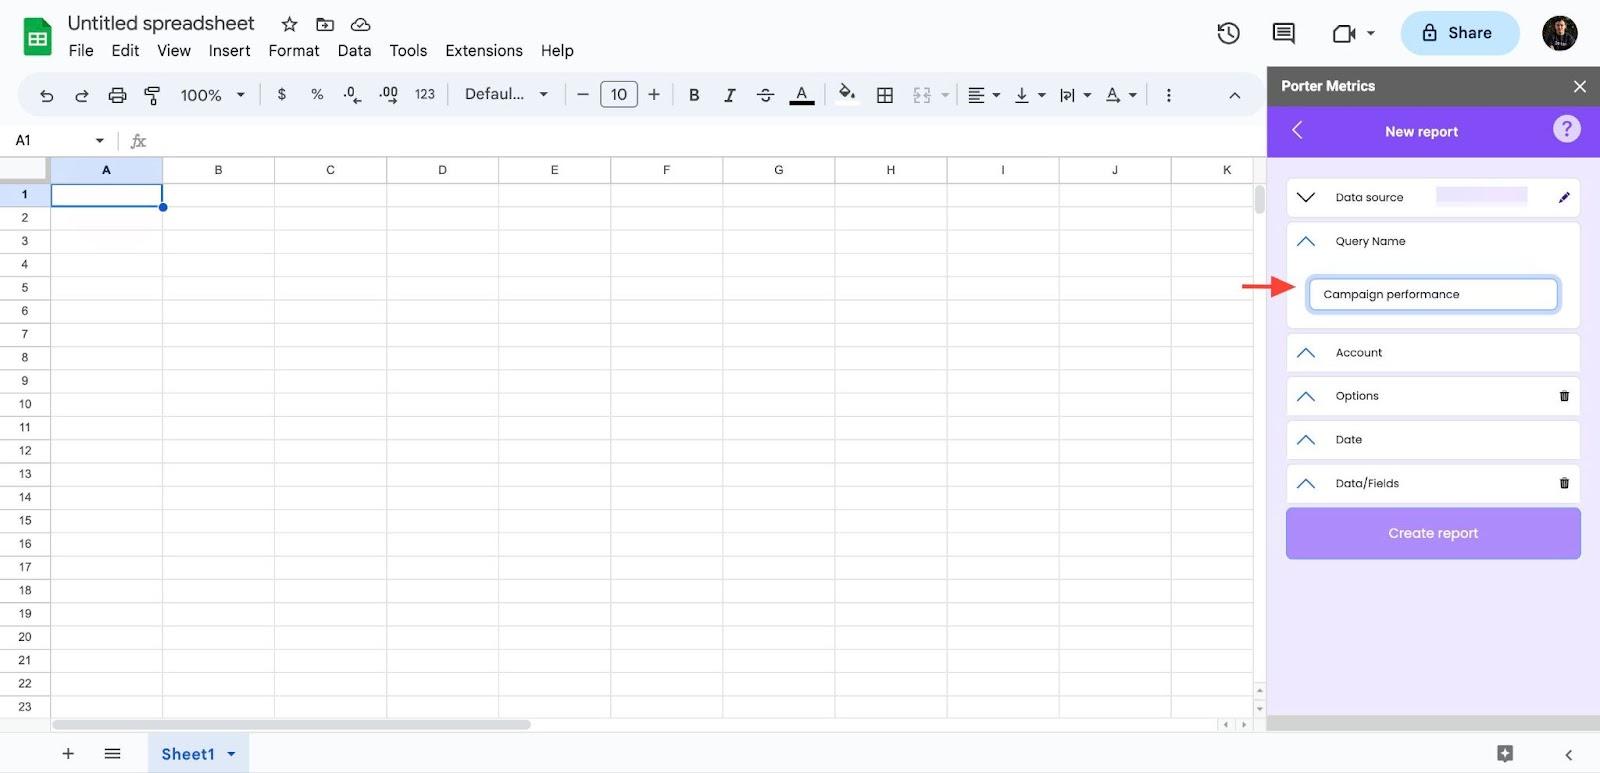
Name your query so you can save it for later and schedule automatic data refreshes. For this example, we’ll call the query “Campaign performance”.
Choose the Facebook profile and the Facebook Ads account(s) you’ll export to your report.
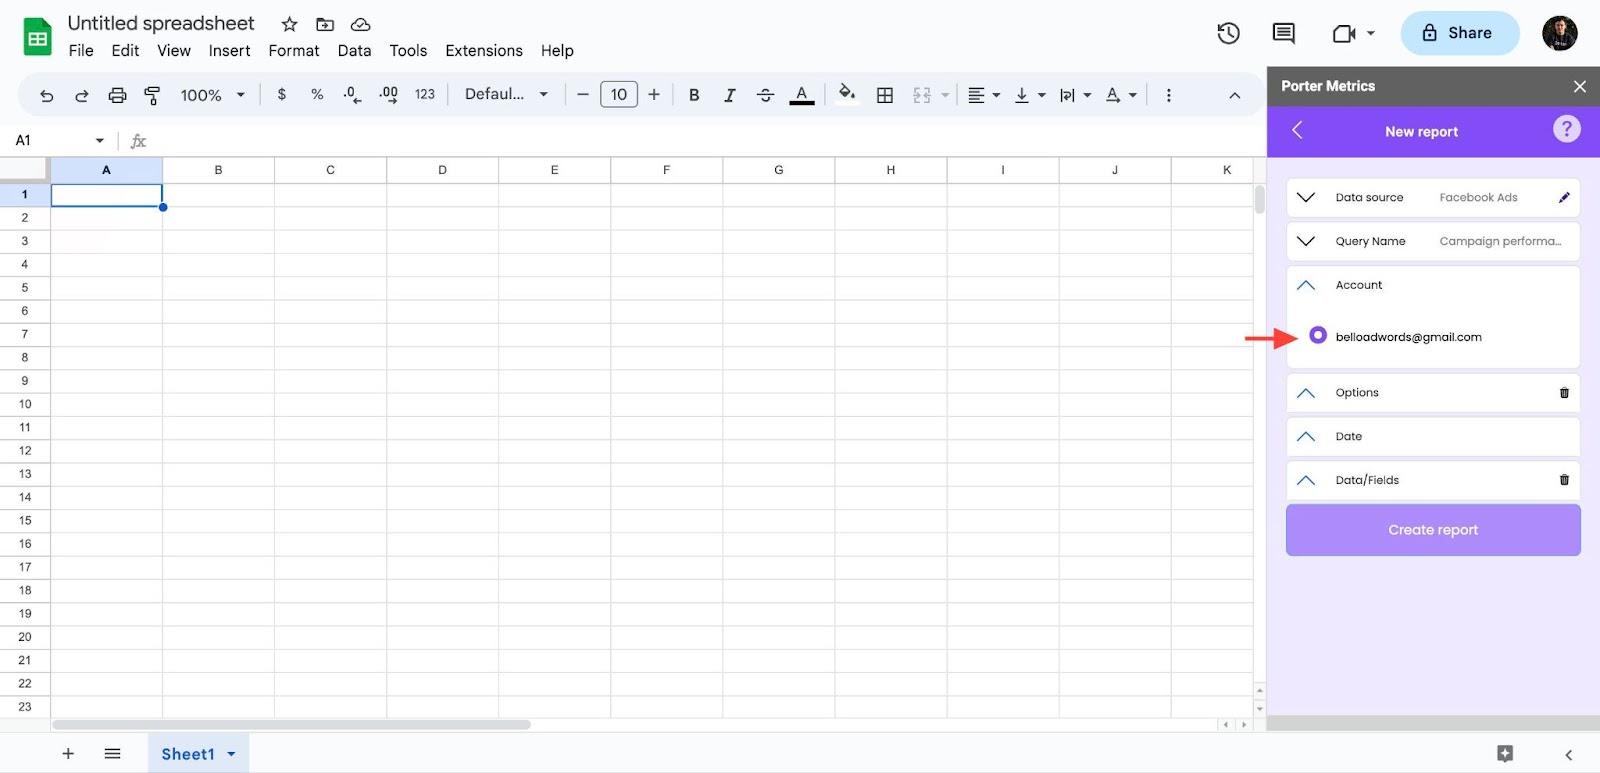
The Porter Metrics add-on lets you pull and combine data from multiple Facebook Ads accounts in a single query, quite useful for agency client monitoring or companies that manage multiple brands in different ad accounts.

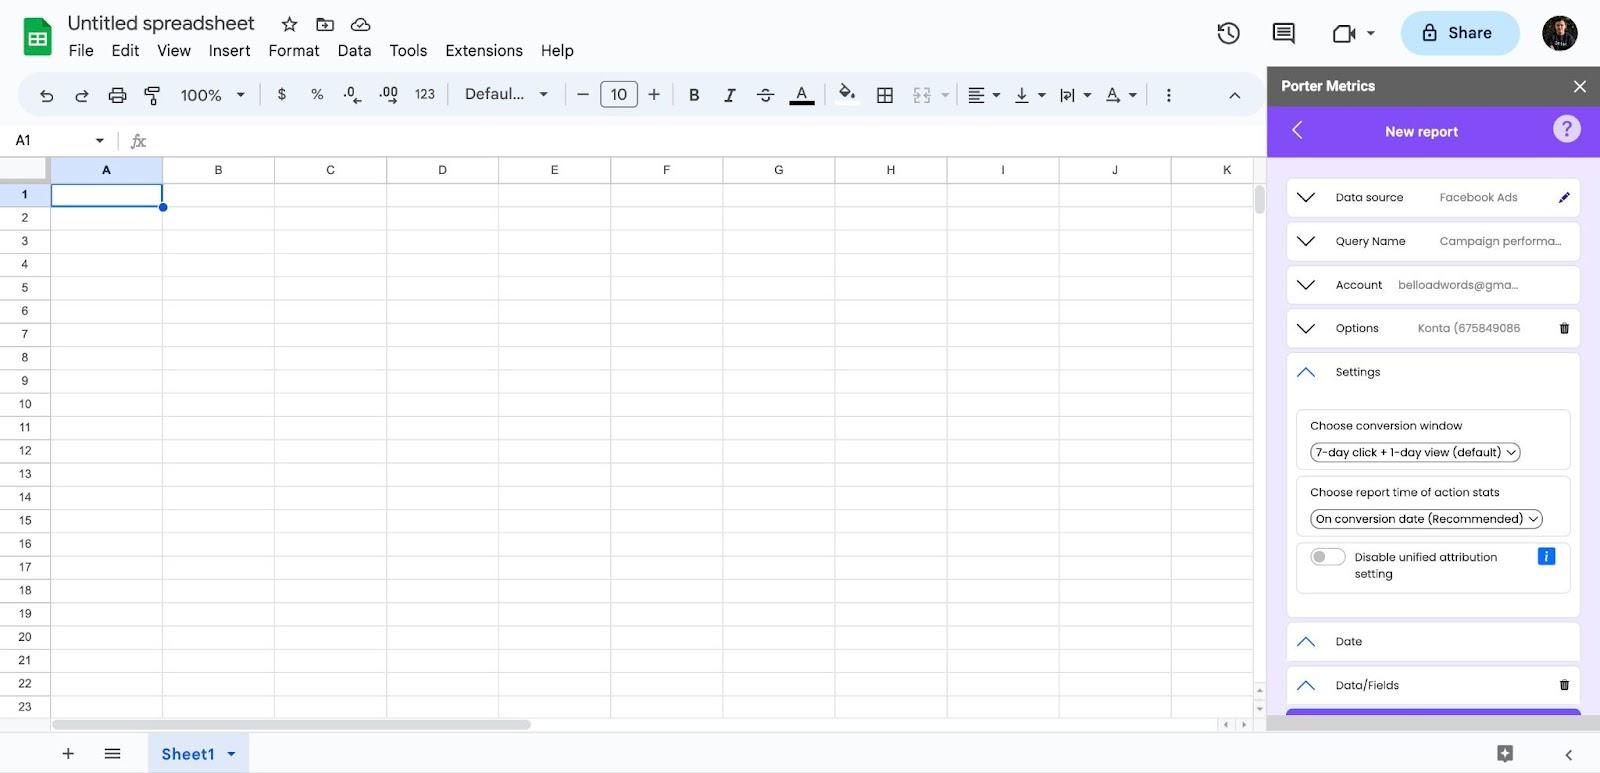
For the settings, choose the default 7-day + day view conversion window and On conversion date to pull the same data reported on the Facebook Ads Manager.
Set a dynamic or fixed date range for your report.

Dynamic date ranges refer to “Yesterday”, “Last month”, and “This Week” which will vary based on the current date; fixed date ranges are about defining a specific start and end date.
Choose metrics and dimensions.
Metrics refer to the numbers (Columns).
Dimensions are the way we can break down our data (Rows).
As metrics, select Amount spent, clicks, CTR, or even custom conversions.
As a dimension, break down by dates, campaign names, or platform (Facebook vs Instagram).
Access all the Facebook Ads metrics and dimensions available and suggested Facebook Ads KPIs.

Click on Create Report and wait some seconds to load your data on the selected cell.

For scheduling your data refreshes, we’ll continue with the Google Sheets add-on method. However, we’ll show you 3 other ways to get your Facebook Ads data on Google Sheets.
2nd way: Manually Downloading CSV files from the Facebook Ads manager
To export your Facebook Ads data to Google Sheets (free forever), download your Facebook Ads data as a CSV file from the Ads Manager and upload the CSV on Google Sheets.
However, this process is manual and you’ll need to repeat it every time you need a new query.
Schedule automatic data refreshes
To export your Facebook Ads data manually, follow these steps:
Go to the Ads Manager – Export data table.

Export as CSV to avoid formatting errors.

Go to Google Sheets – export.

Optionally, choose Replace on the current Sheet.
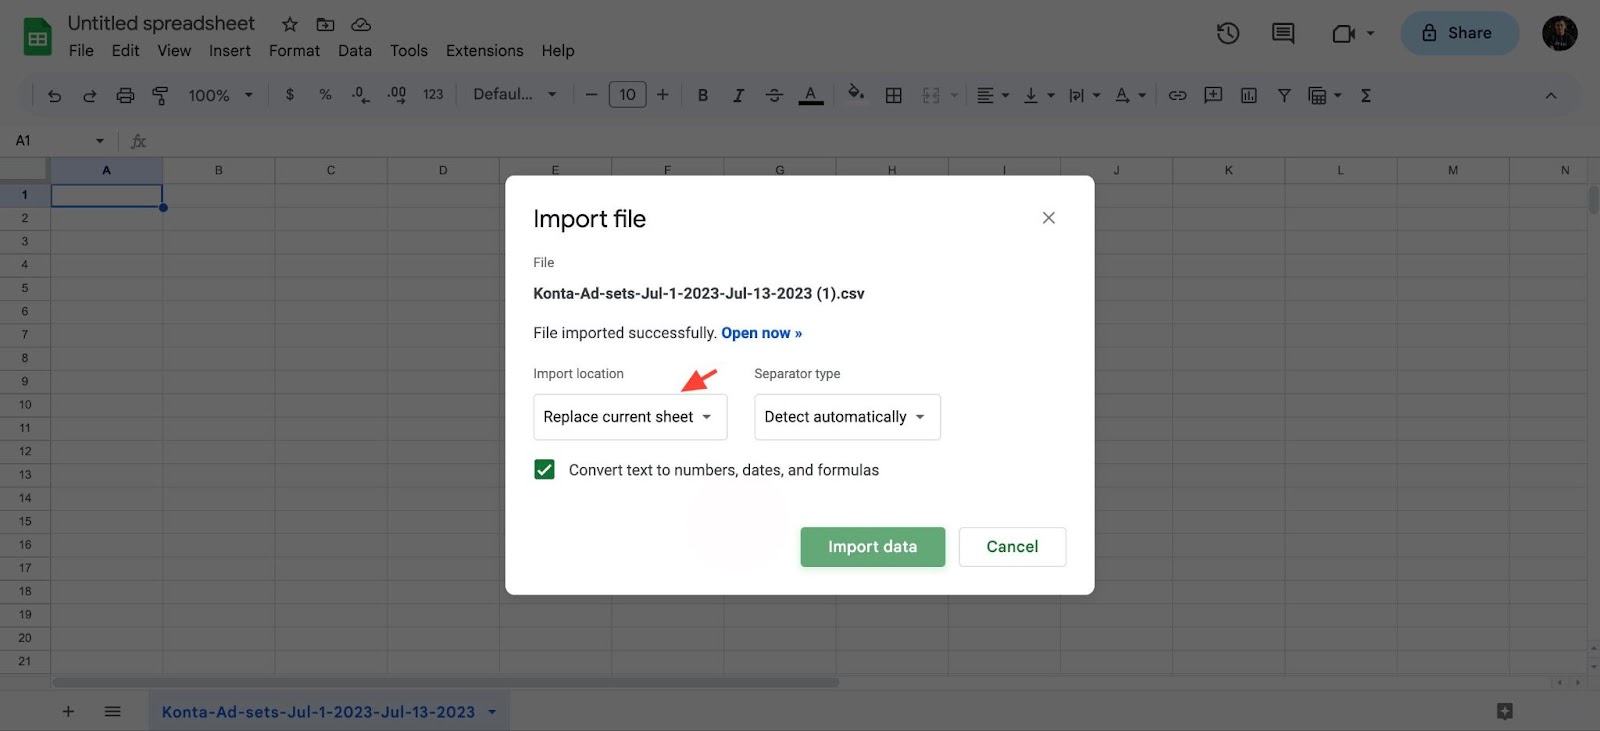
Finally, get your Sheets with the Facebook Ads data. Every time you need to update it, you’ll need to download it manually.

3rd way: Using automation tools like Zapier or Make
Optionally, export Facebook Ads data to Google Sheets via Zapier or Make.
These tools, though, are mainly made for tasks automation, not analytics and reporting, making them more limited or complicated to set up your marketing reports.
export Facebook Ads data to Sheets with Zapier
With Zapier, you could export data every time a new event is logged.
Recently, they released a data transfer feature that lets you export and export historical events data in bulk.
The three limitations of Zapier for marketing reporting are:
- Their pricing is based on tasks. Every new row of data will be charged as a task. A single chart to set a query could cost several Dollars.
- There’s no granularity: if you want to filter, clean or break down your data, you’ll need to run a new query and would need to pay for those data transfers too.
- No access to the analytics endpoints: you could export Facebook Ads data on Google Sheets on Zapier, but you couldn’t get the aggregated metrics and KPIs for reporting.
Zapier is built to automate a task based on a triggered event, but a Google Sheet extension is more useful to build queries and report data.
To connect Facebook Ads to Sheets with Zapier, read:
export Facebook Ads data to Sheets with Make
Unlike Zapier, Make also access reporting and analytics data from API endpoints. I.e. you can pull Facebook Ads metrics and reports with Make.
To connect Facebook Ads to Sheets with Make, read:
4th way: Scraping Facebook Ads data and sending it to Google Sheets
To connect Facebook Ads data to Google Sheets, you can use web scraping tools instead of retrieving it from the API, like the tools we’ve shown so far.
Web scraping is a good way to collect data when APIs are limited or restricted. The logic of web scraping is simple:
- Download a Google Chrome extension so the scraper can access the web pages you open in a browser
- Define the URLs and the specific content you want to scrap
- These tools run on a schedule (e.g. daily, weekly)
- Store the scrapped data on Google Sheets
Some examples of web scraping might include extracting every day the followers of multiple Tiktok accounts or followers of LinkedIn profiles every day and logging this data on a Sheet.
An advantage of exporting your data with scraping is that you can not only extract data from your internal accounts but track your competitors’ data, as soon as there’s a public web page to access it.
There are many web scraping tools, but we suggest Bardeen for its automation capabilities.
To connect Facebook Ads to Sheets with Bardeen, read:
Schedule Facebook Ads data refreshes on Google Sheets
To automatically refresh your Facebook Ads data on a schedule on Google Sheets, open the Google Sheets add-on go to your saved reports, set an hourly, daily, or weekly frequency, set a starting date, and set to overwrite, append, or create a new Sheet to pull your data.
Scheduling data refreshes on Google Sheets let you have your data automatically updated so you can monitor your Facebook Ads data hourly, daily, weekly, and monthly.
Go to your saved queries and go to options – Schedule.

Enable or disable your schedule to turn on and off the automation.
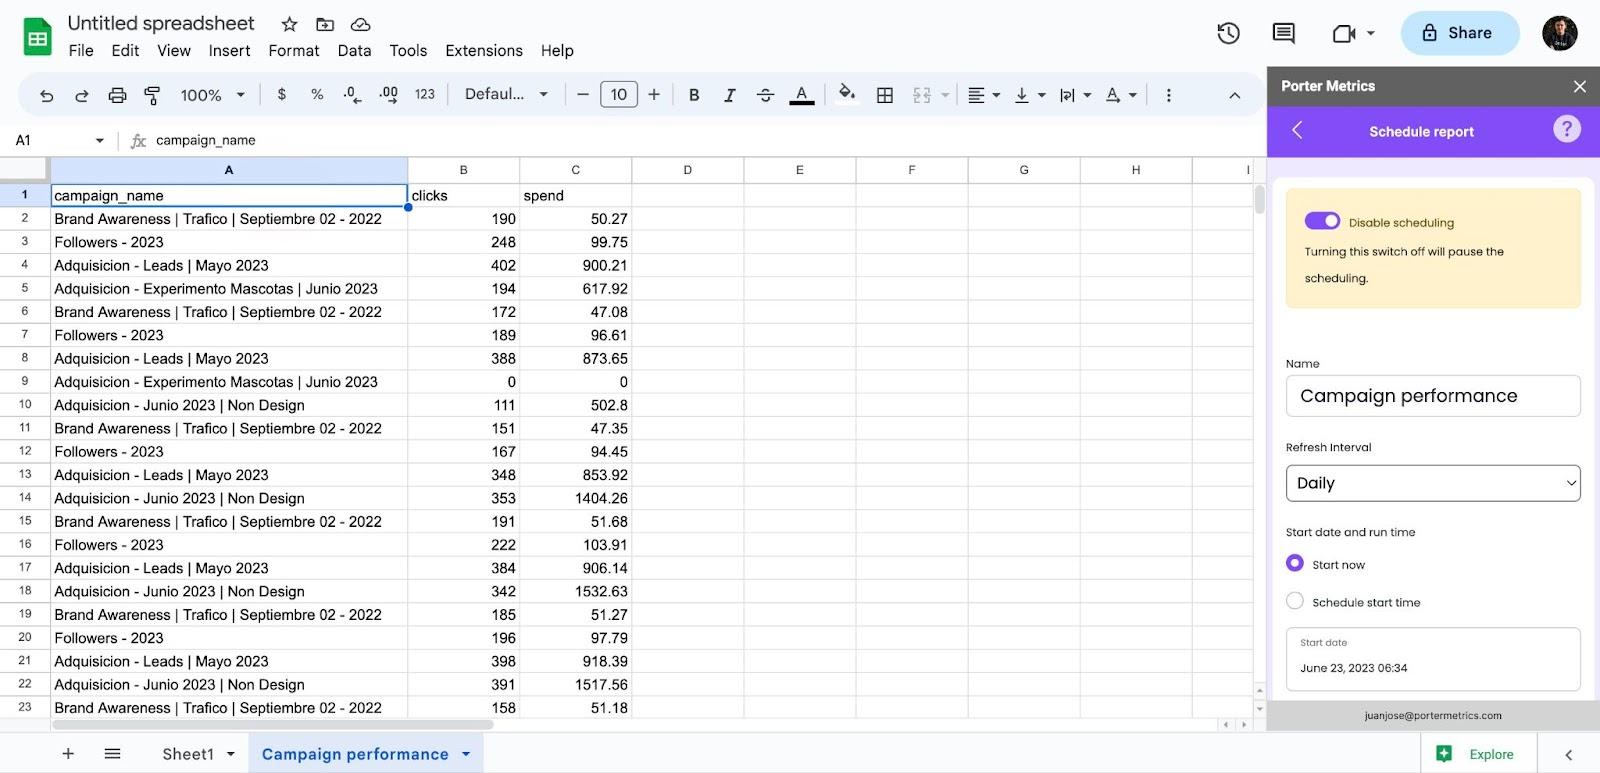
Set a refresh frequency (e.g. Daily).

Set a start date (e.g. Now or Tomorrow at the same time).

Choose an option to refresh your data.
- Replace previous export: new data overwrites old data.
- Append to export: new data will display in rows underneath the current data, useful to log and store historical data.
- Create a new sheet for every refresh: create a new Google Spreadsheet for every single query refreshed.

4 Ways to Analyze Facebook Ads Data on Google Sheets
We’ll share some tips to make your Facebook Ads data more useful for marketing data analysis.
Summarize, aggregate, and filter your Sheets data
To analyze your data on Google Sheets, you can use pivot tables, charts, formulas, and filters.
- Pivot tables: let you create more queries, aggregate, and sort your data.
- Charts: let you visualize your data through dashboards.
- Formulas: with formulas, blend data across multiple channels and calculate custom metrics.
- Filters: clean and exclude data based on conditions.
Set alerts and notifications
Send notifications to your team via email or Slack when data updates for daily, weekly summaries
With the refresh scheduling feature, you can automatically update your Google Sheets with your latest Facebook Ads data.
Then, use Zapier or Make and trigger a new automation every time a Google Sheets row is updated or created, and send its data to Slack or via email.
Suggested tutorials:
- Automatically send a Slack message for new Google Sheets activity.
- How to send an email when updates are made to Google Sheets rows.
Visualize Google Sheets data on other tools
Once your data is on Google Sheets, you can quickly connect it to other tools for further analysis and better reporting and presentations.
Data Visualization and Business Intelligence:
- Connect Google Sheets to Google Data Studio (formerly Looker Studio)
- Connect Google Sheets to Microsoft Power BI
Best for client and team dashboards and reports or performance monitoring.
Data presentations and slides:
Best for weekly/monthly team or client presentations.
Data warehouses (for dev teams):
Best for engineering teams to centralize companies’ data.
Track Facebook Ads goals
Add context to your data by comparing it against goals or using conditional formats.
Suggested tutorials:
- How-To: Conditional Formatting Based on Another Cell in Google Sheets
- How to use conditional formatting in Google Sheets
For Facebook Ads, common use cases of goal tracking include:
- Ad pacing monitoring
- Agency client overview
- CPA monitoring + markups or commissions
- Campaign performance
- Cross-channel paid media analysis
Goals will help you add context to your data so your team and clients are aligned and they can tell if your marketing performance is good.
Free Facebook Ads report templates for Sheets
Some Facebook Ads templates for Google Sheets include:
- Facebook Ads monthly report template (Soon)
- Budget and pacing monitoring template (Soon)
- Facebook Ads campaign monitoring template (Soon)
- Marketing goal tracker (Soon)
- Internal client monitoring report for agencies (Soon)
Google Sheets templates help you speed up your marketing reports setup.
To download a Google Sheet template, go to File – Marke a copy, and name the new copy.
To use them, notice first that the templates have two types of sheets: backend and frontend sheets.
Backend sheets contain the raw data that you can export and automatically refresh
with the Facebook Ads to Sheets add-on. It’s like the database.
To sync your data correctly and keep consistency, make sure to create the query from the first cell (A1) that matches the metrics and dimensions suggested in the template.
Frontend sheets contain the user interface with the dashboards, charts, and text, meant to be accessed by your team or clients.
Just like in software, frontend sheets are fed by the backend sheets.
If you update your frontend sheets, keep the cells with the formulas calling up the backend sheets data to avoid breaking your report.
Facebook Ads metrics and dimensions
As a reference, see the Facebook Ads fields list and suggestions for choosing Facebook Ads KPIs.
The Facebook Ads connector for Google Sheets offers all the +600 metrics and dimensions available on the Ads Manager.
Facebook Ads metrics
Conversion metrics
- Custom and standard conversions (e.g. landing page views, adds to cart, contacts, etc.)
- Leads, Cost per Lead
- Purchases, CPA, ROAS, purchase value for e-commerce
Standard events break down also by aggregation type and event location.
By Aggregation:
- Total: the total number of times an event was hit (e.g. Purchases)
- Unique: the number of unique users that hit an event (e.g. Unique purchases; aka “purchasers)
- Value: the economic value assigned to every conversion (e.g. Purchase value)
- Cost: the division of ad spend by the conversion (e.g. Cost per Purchase)
By event location (aka where the event was logged):
- Total: the total number of conversions regardless of where it happened (e.g. Leads)
- Offline: events logged in your POS or CRM, or non-traceable with the pixel (e.g. Offline leads)
- Website: events logged from your website (Website leads)
- On-Facebook: events logged on Facebook (e.g. Facebook leads)
- Mobile app: events logged on mobile apps (e.g. mobile app purchases)
The Facebook Ads API doesn’t bring the metric “Results”; instead choose any event set as the campaign objective.
Engagement metrics
Engagement metrics represent how users interact with your content.
- Clicks: all clicks, outbound clicks, Link clicks (Unique and total)
- Page and posts: engagement, likes, comments, reactions, saves, shares, views, responses, check-ins
- CTR and engagement rate: the relation of all clicks-related and engagement-related metrics with impressions and reach
- Video: Video plays; Video Average Play Time; Video Plays at 25%, 50%, 75%, 95%, 100%; 2-second and 3-second video plays
- Messages: New messaging connections, Messaging connection started from Messenger and WhatsApp
Visibility (or awareness) metrics
- Ad spend: amount spent, campaign budget, ad set budget
- Impressions, reach, and frequency
- CPM
- Estimated Ad Recall Lift (People) and Estimated Ad Recall Lift Rate
With these metrics, you could visualize your Facebook Ads funnel for e-commerce and lead generation.
Facebook Ads dimensions
To monitor your Facebook Ads performance, break down your data by dimensions.
The most common ways to break down your marketing data are by:
- Over time: for hourly, daily, weekly, monthly, quarterly, and annual reporting
- Account: break down by client, if you’re an agency, or by product, if you’re a business.
- Channel: channels correspond to the acquisition sources or mediums (SEO, ads, Facebook, etc) you get traffic and conversion from.
- Campaign: campaigns refer to a set of activities to sell products by defining a specific objective, offer, target audience, and content.
- Objective: break down your marketing efforts by funnel stage or objective, such as awareness, engagement, and conversion.
- Audience: to know to whom you’re marketing, you may break down data by geographic, demographics, and tech dimensions, such as city, gender, age, device, and platform.
- Content: to analyze by best-performing post, article, creative, etc.
For analyzing Facebook Ads data with breakdowns, some popular use cases are:
- Ad spend and pacing (Hourly, daily tracking)
- Campaign and ad set monitoring
- Best-performing creatives
- Peak hours with heatmaps
- Audience analysis (Gender, age, location, devices)
- Breakdown by platform: Facebook Adsvs Instagram Ads
Export your marketing data to Google Sheets
- Export Facebook Ads to Google Sheets
- Export Facebook pages to Google Sheets
- Export Instagram to Google Sheets
- export LinkedIn Pages to Google Sheets
- export Instagram competitors data to Google Sheets
- export Facebook competitors data to Google Sheets
- export Google Business Profile to Google Sheets
- export Google Analytics to Google Sheets
- export LinkedIn Ads to Google Sheets
- export TikTok Ads to Google Sheets
- export Twitter Ads to Google Sheets
- export Shopify to Google Sheets
- export HubsSpot to Google Sheets
- export WooCommerce to Google Sheets
- export Twitter Analytics to Google Sheets
- export Klaviyo to Google Sheets
- export Mailchimp to Google Sheets