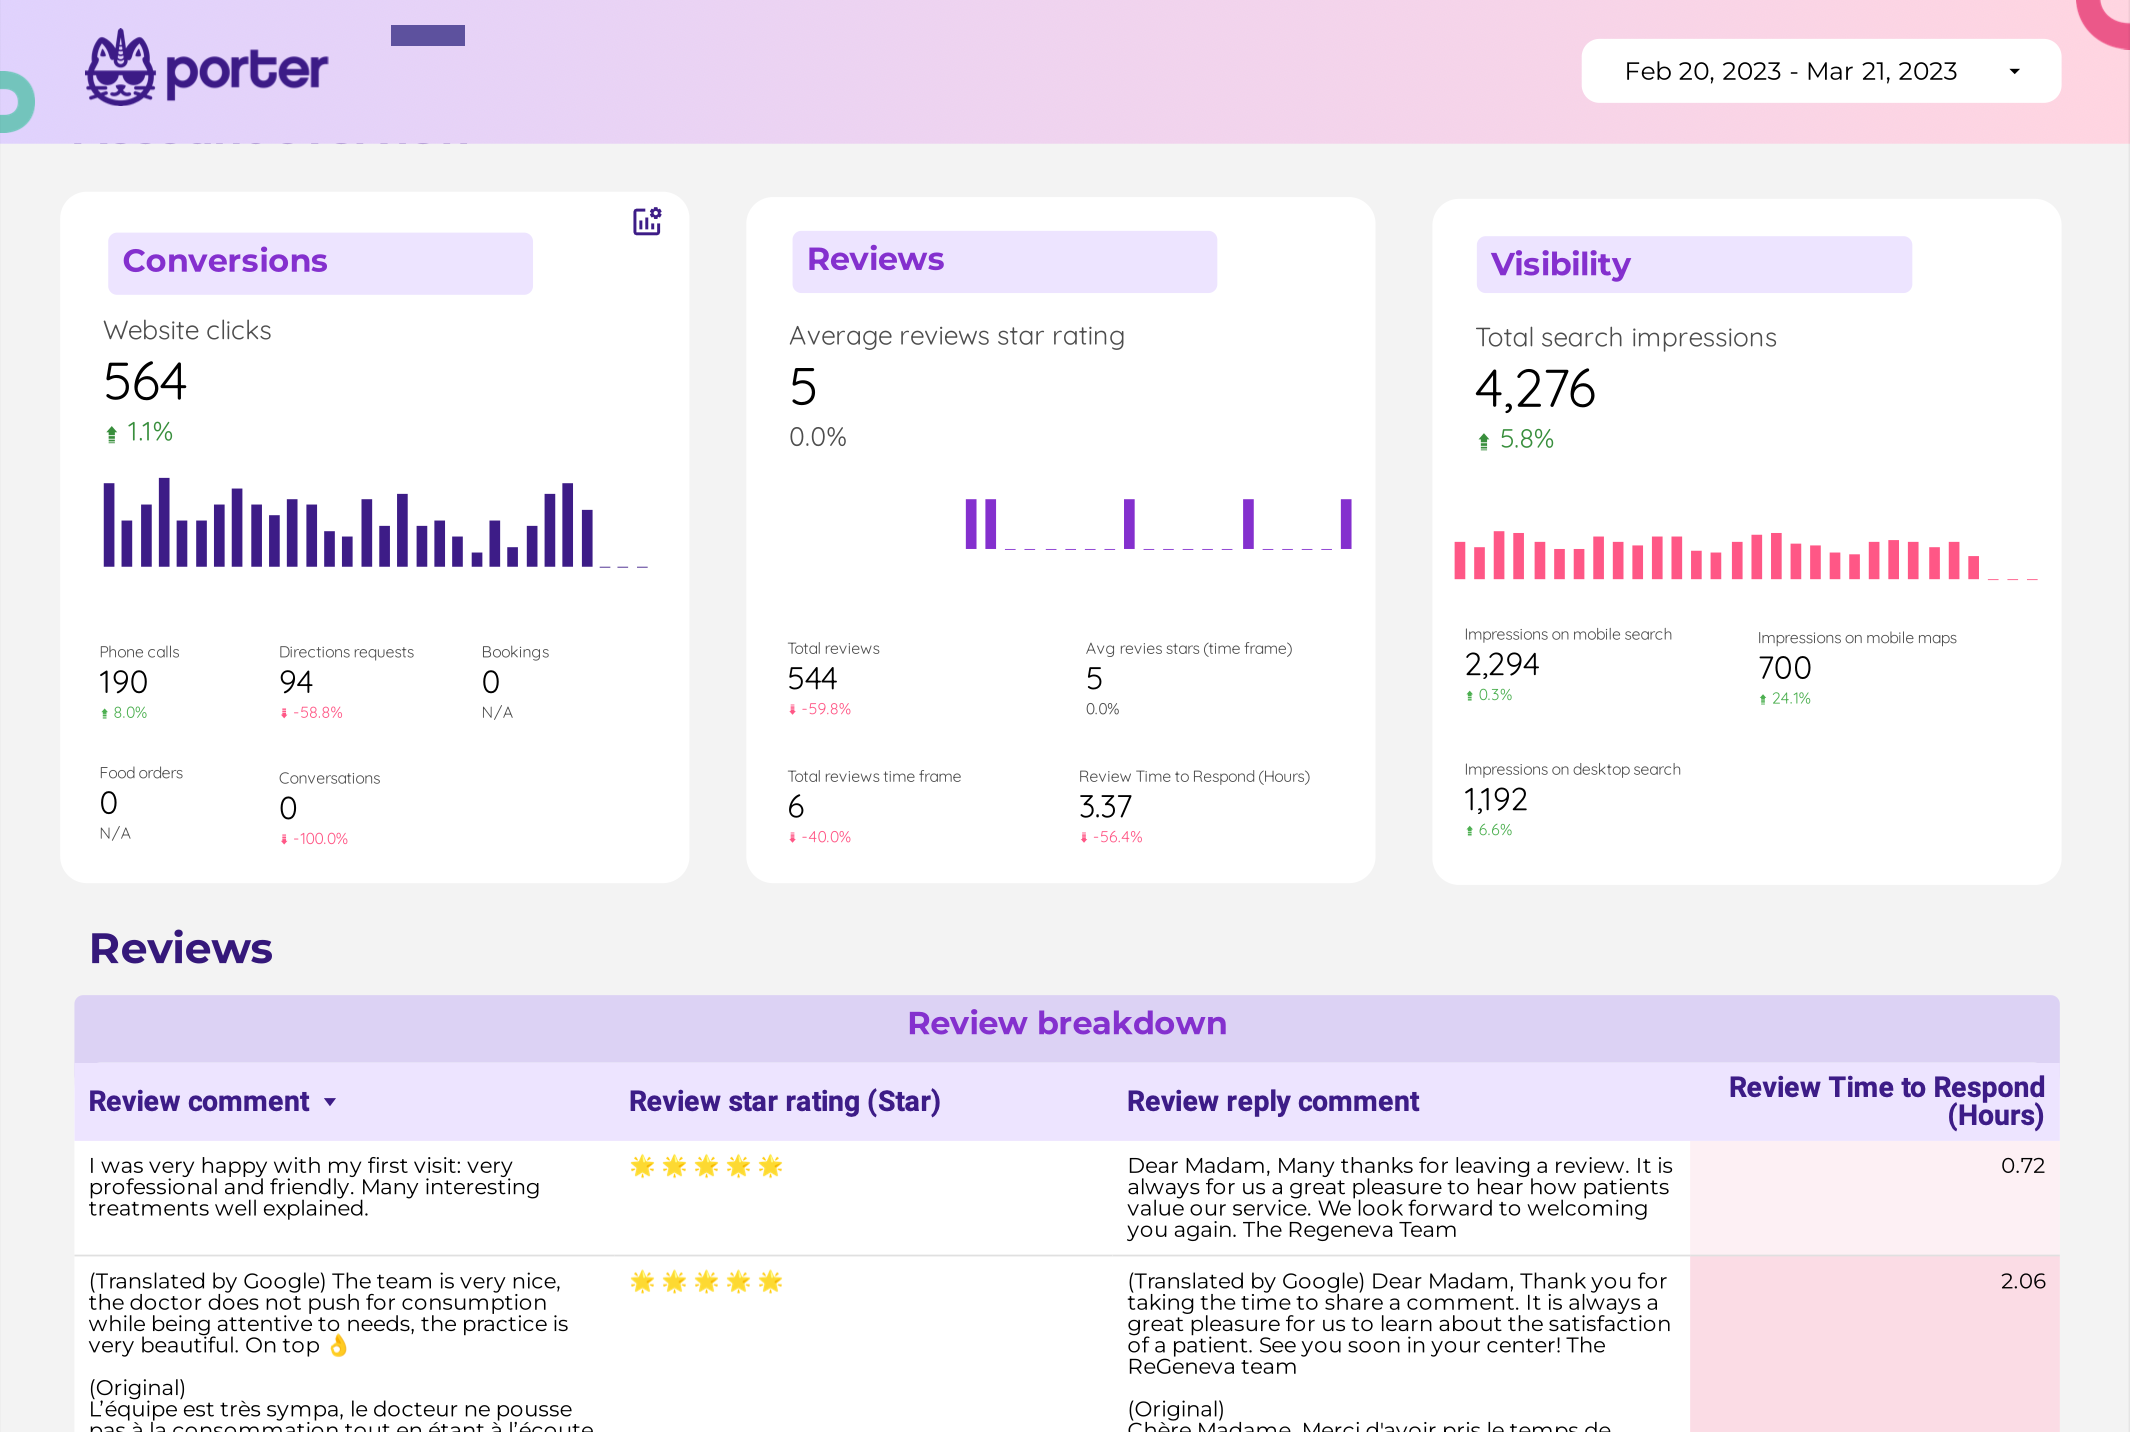
Free Google My Business report template for Looker Studio
Visualize information in a comprehensive dashboard you can use to get more 5 stars rates. This free report was made for business owners, local business consultants, or SEO agencies.
Visualize information in a comprehensive dashboard you can use to get more 5 stars rates. This free report was made for business owners, local business consultants, or SEO agencies.
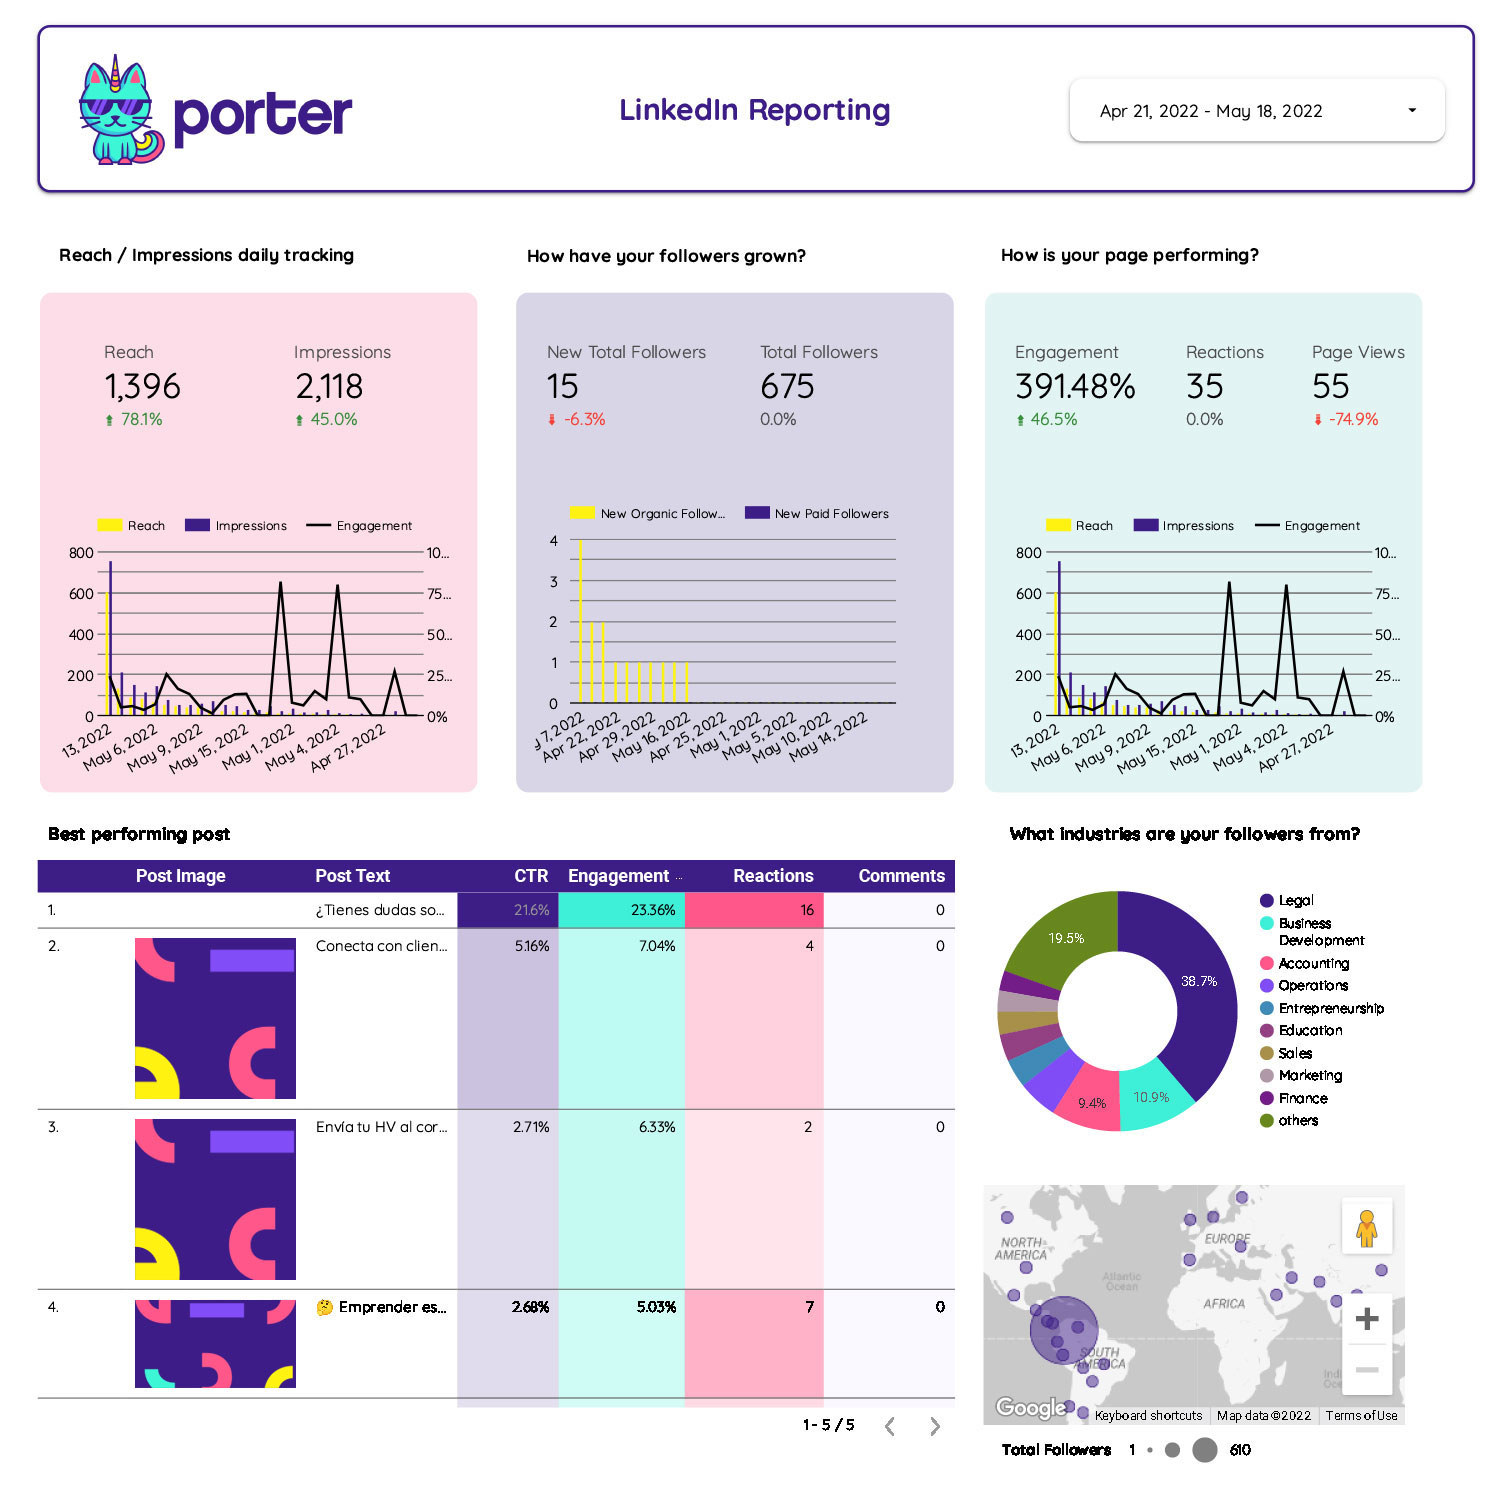
We created a free analytics report template to help you analyze and better understand your account. Simply connect your LinkedIn Pages and LinkedIn Ads account to Google Data Studio, and the template will do the rest!
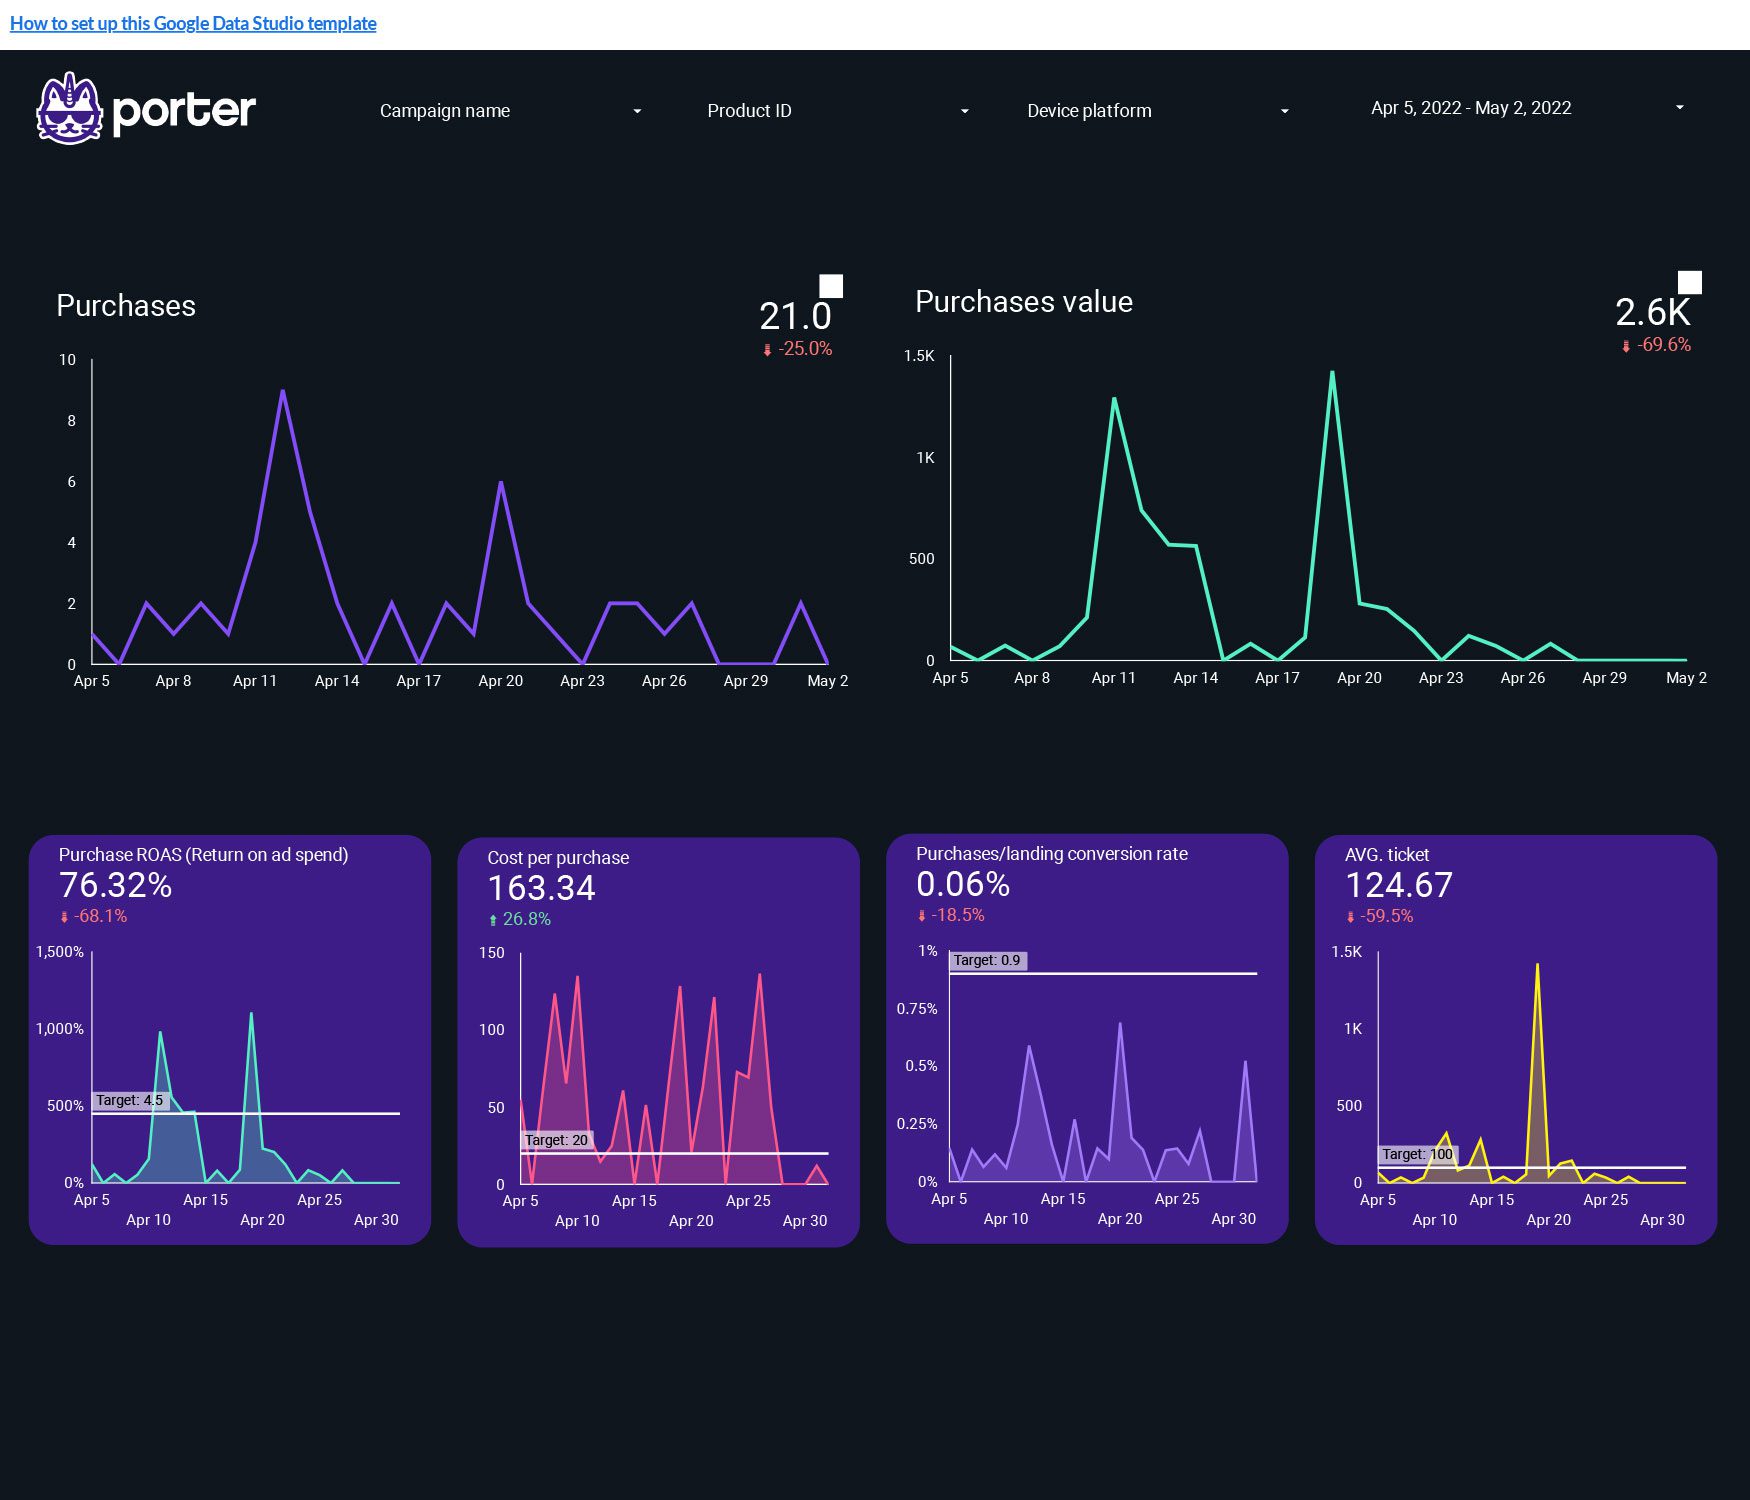
Track the main Facebook Ads e-commerce Key Performance Indicators.
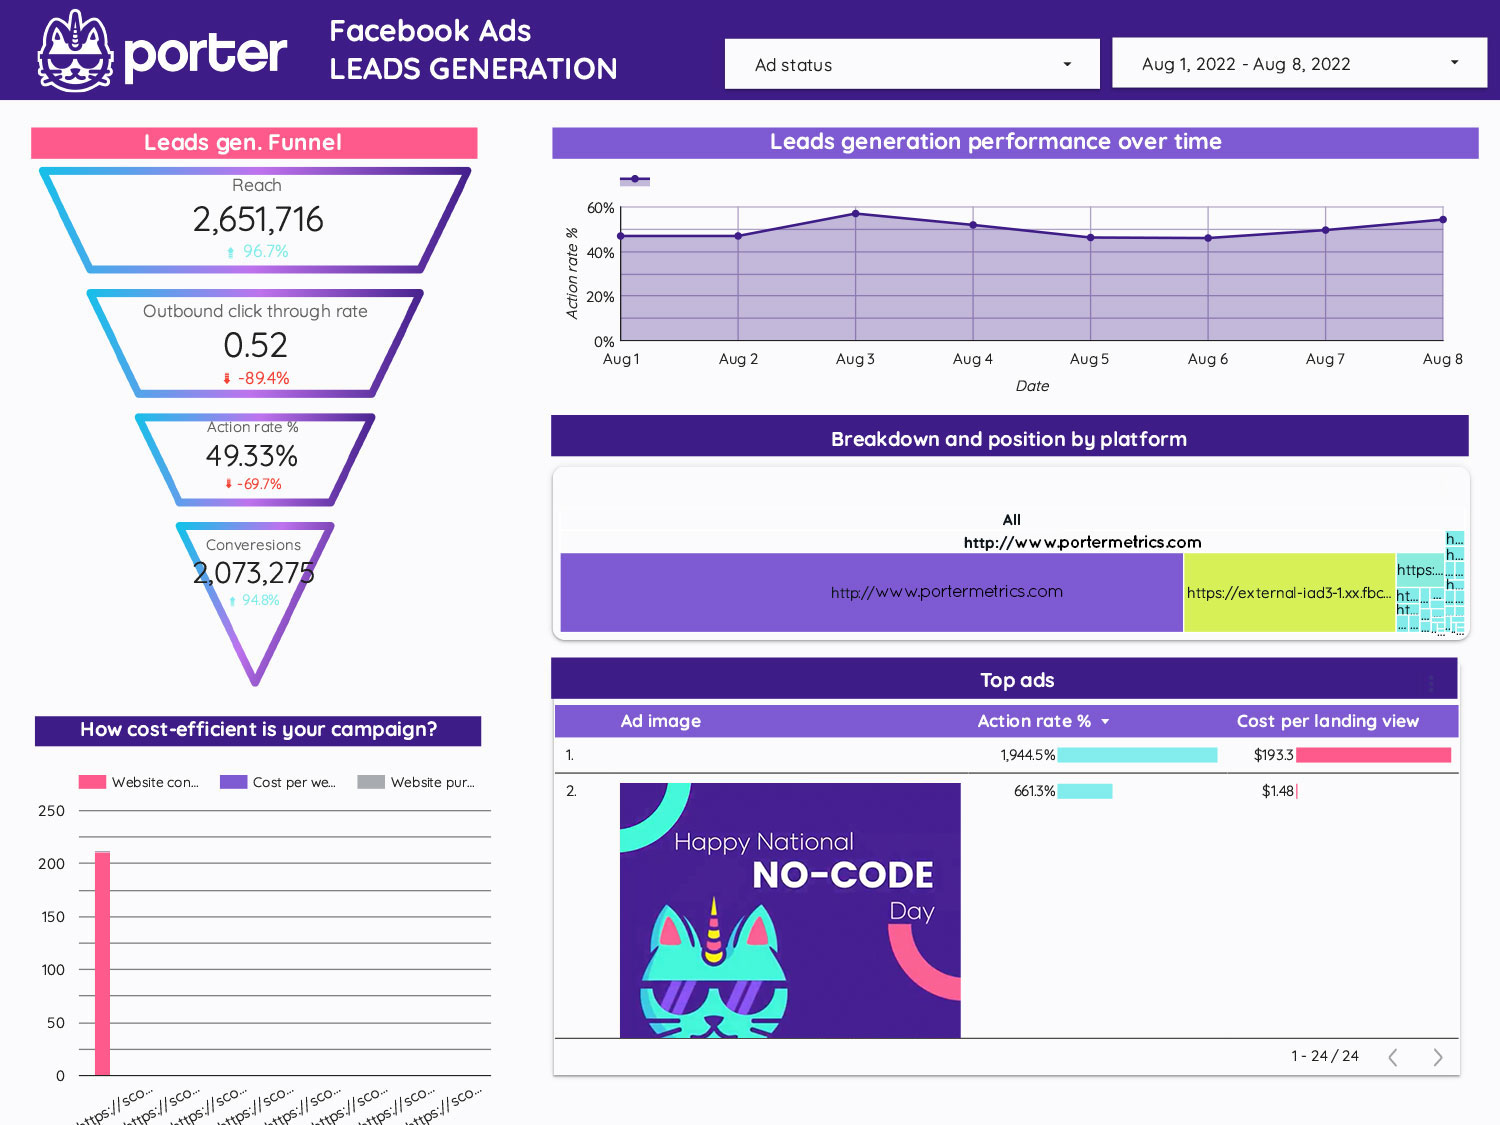
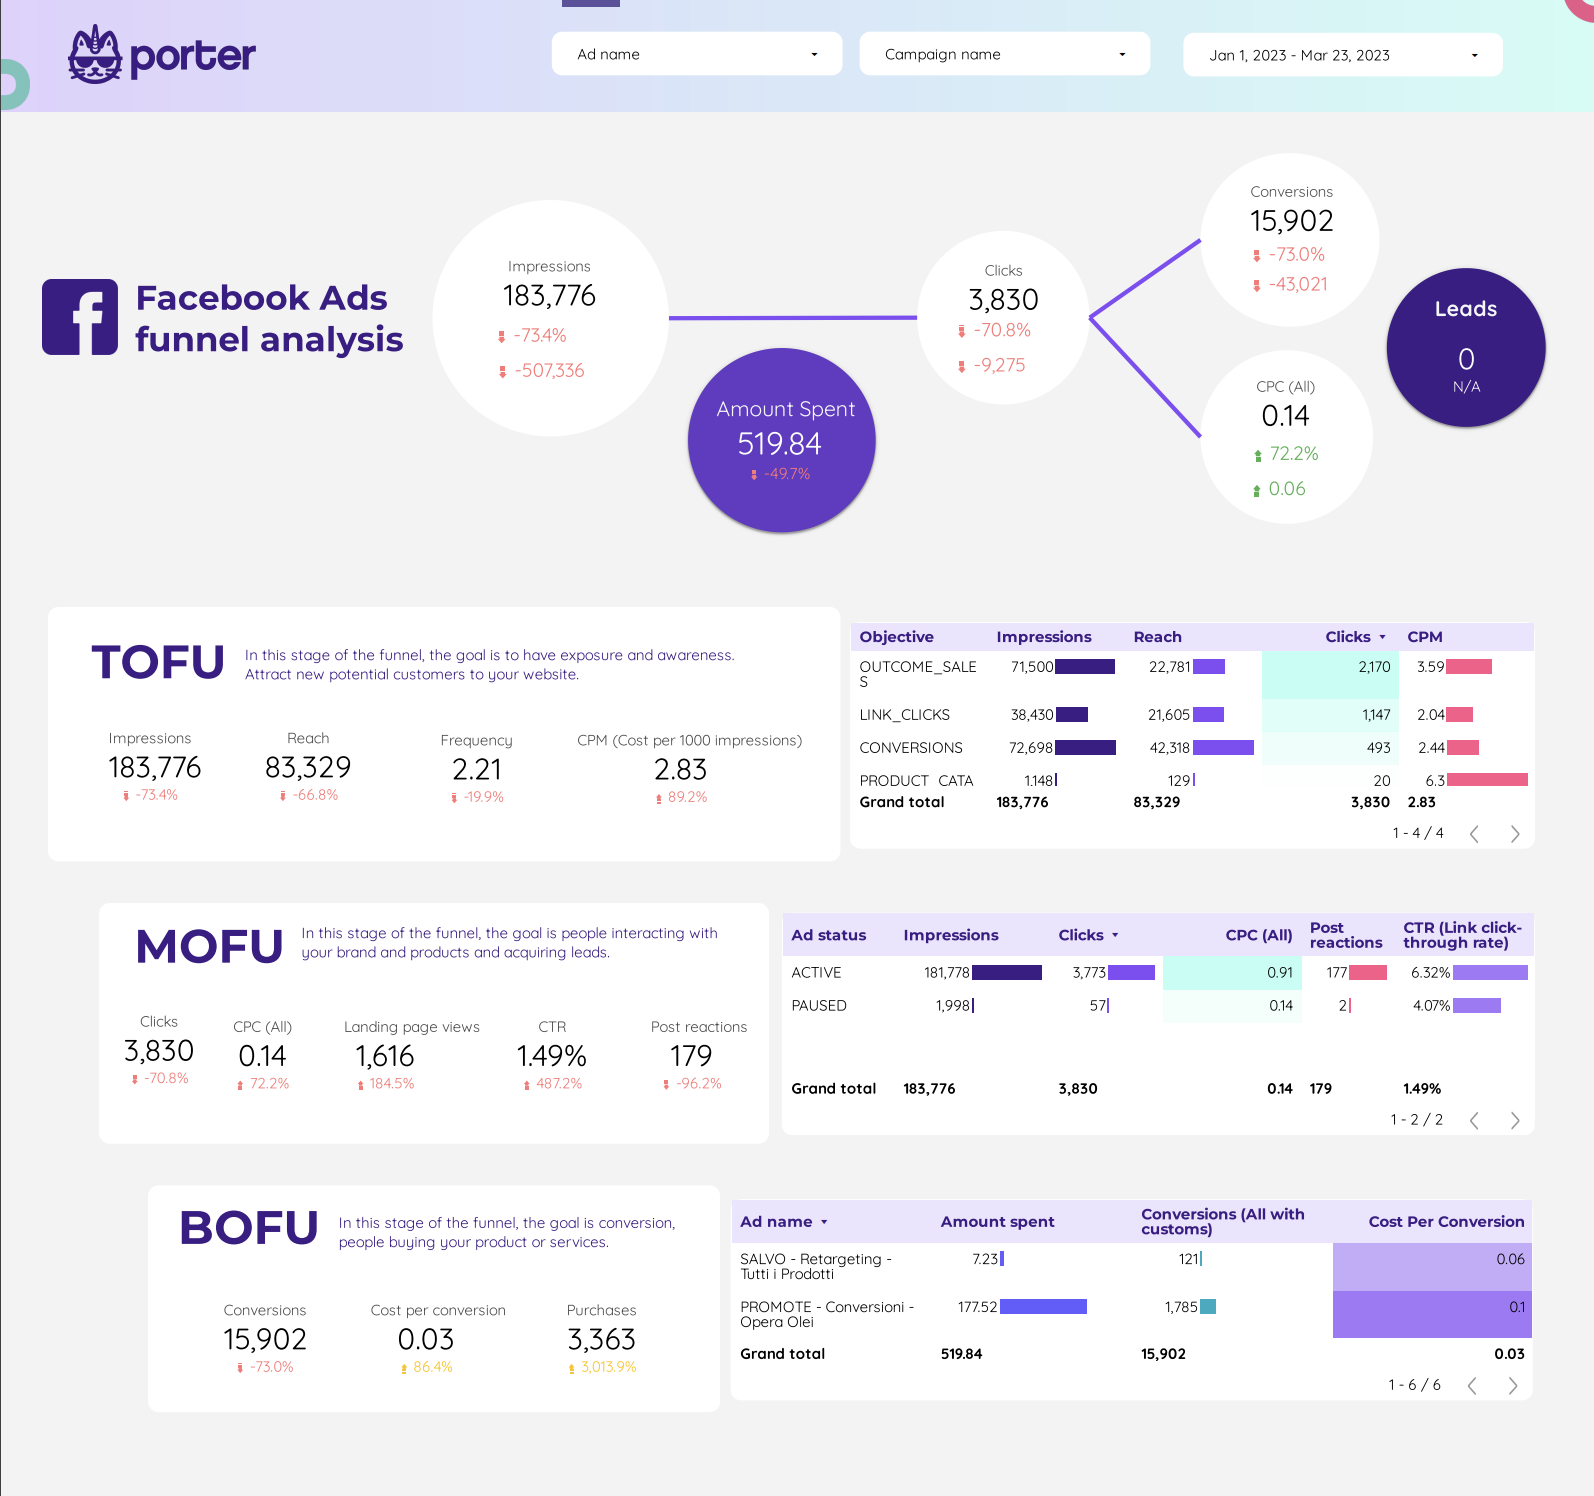
Explore everything you need to know about acquiring leads in your Facebook Ads campaigns. You will find an ad analysis that will help you identify which ads are most effective in getting conversions on your website.
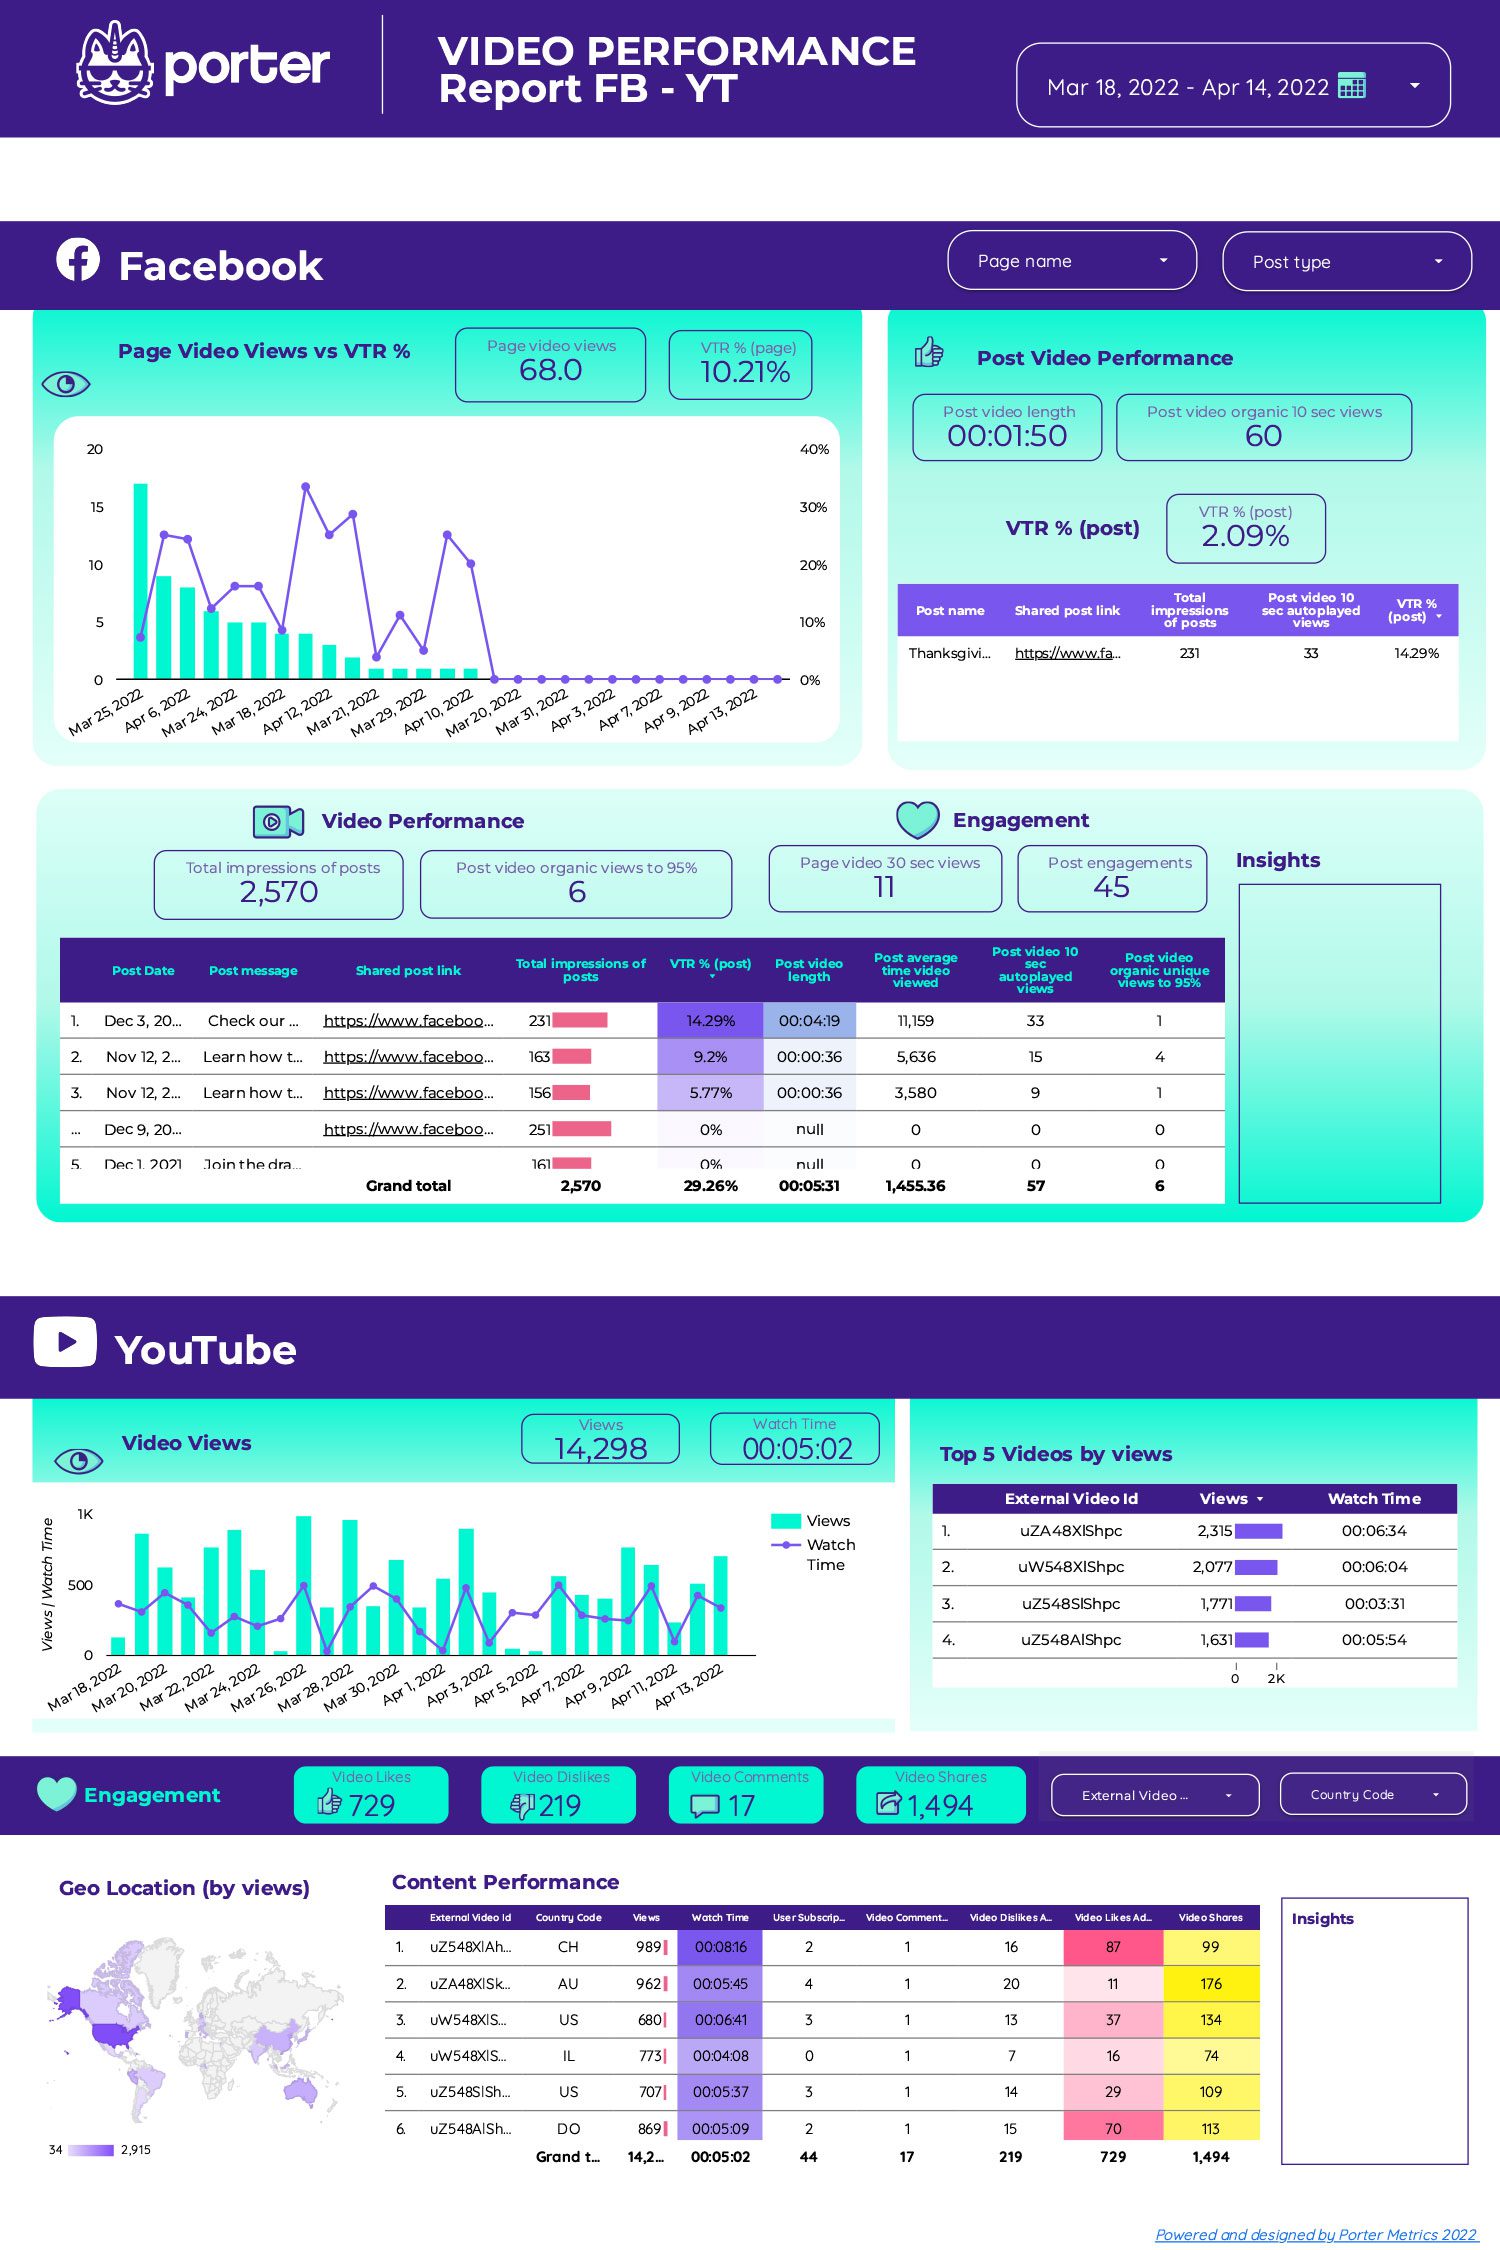
Our new report template connects Facebook Insights and YouTube to show you the impact and performance of your video content pieces. You’ll be able to see things like view-through rate, video completion rate, Facebook video engagement, and YouTube content engagement. So you can make data-driven decisions about your video marketing strategy.
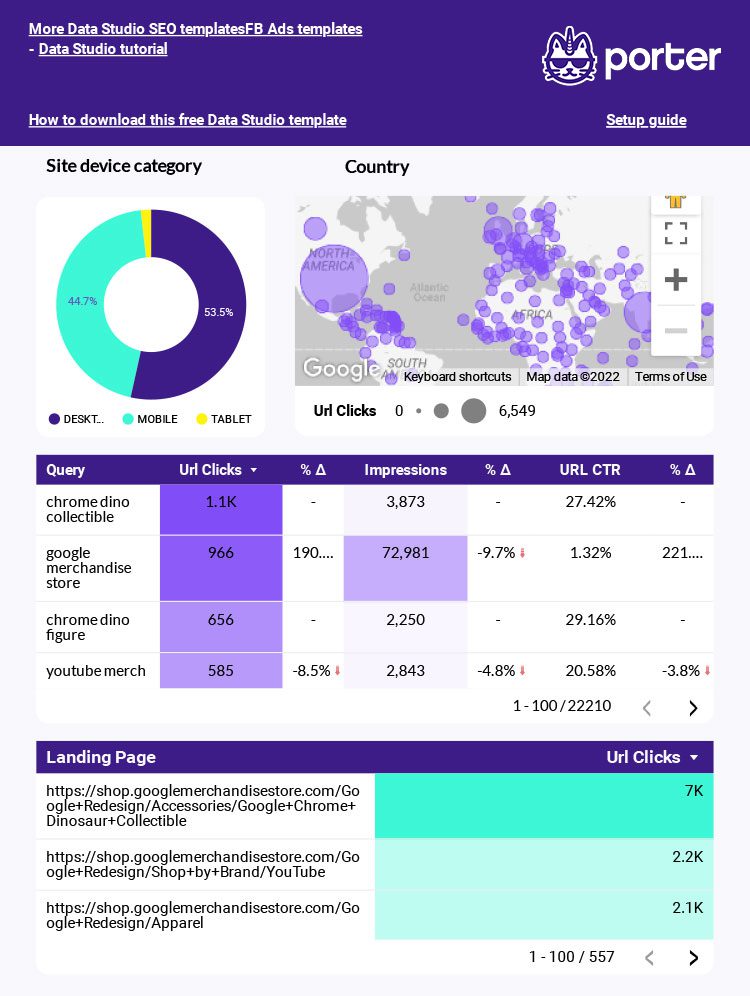
Visualiza tu desempeño SEO en una sola ojeada: cuánto trafico orgánico llega a tu web, con qué palabras clave estás ranqueando y qué páginas te generan más tráfico. Todo con los datos de Search Console.
Put your logo on it and generate an Instagram report in seconds. Track your Profile growth, demographics, stories, and conversion data by connecting your Instagram profile.
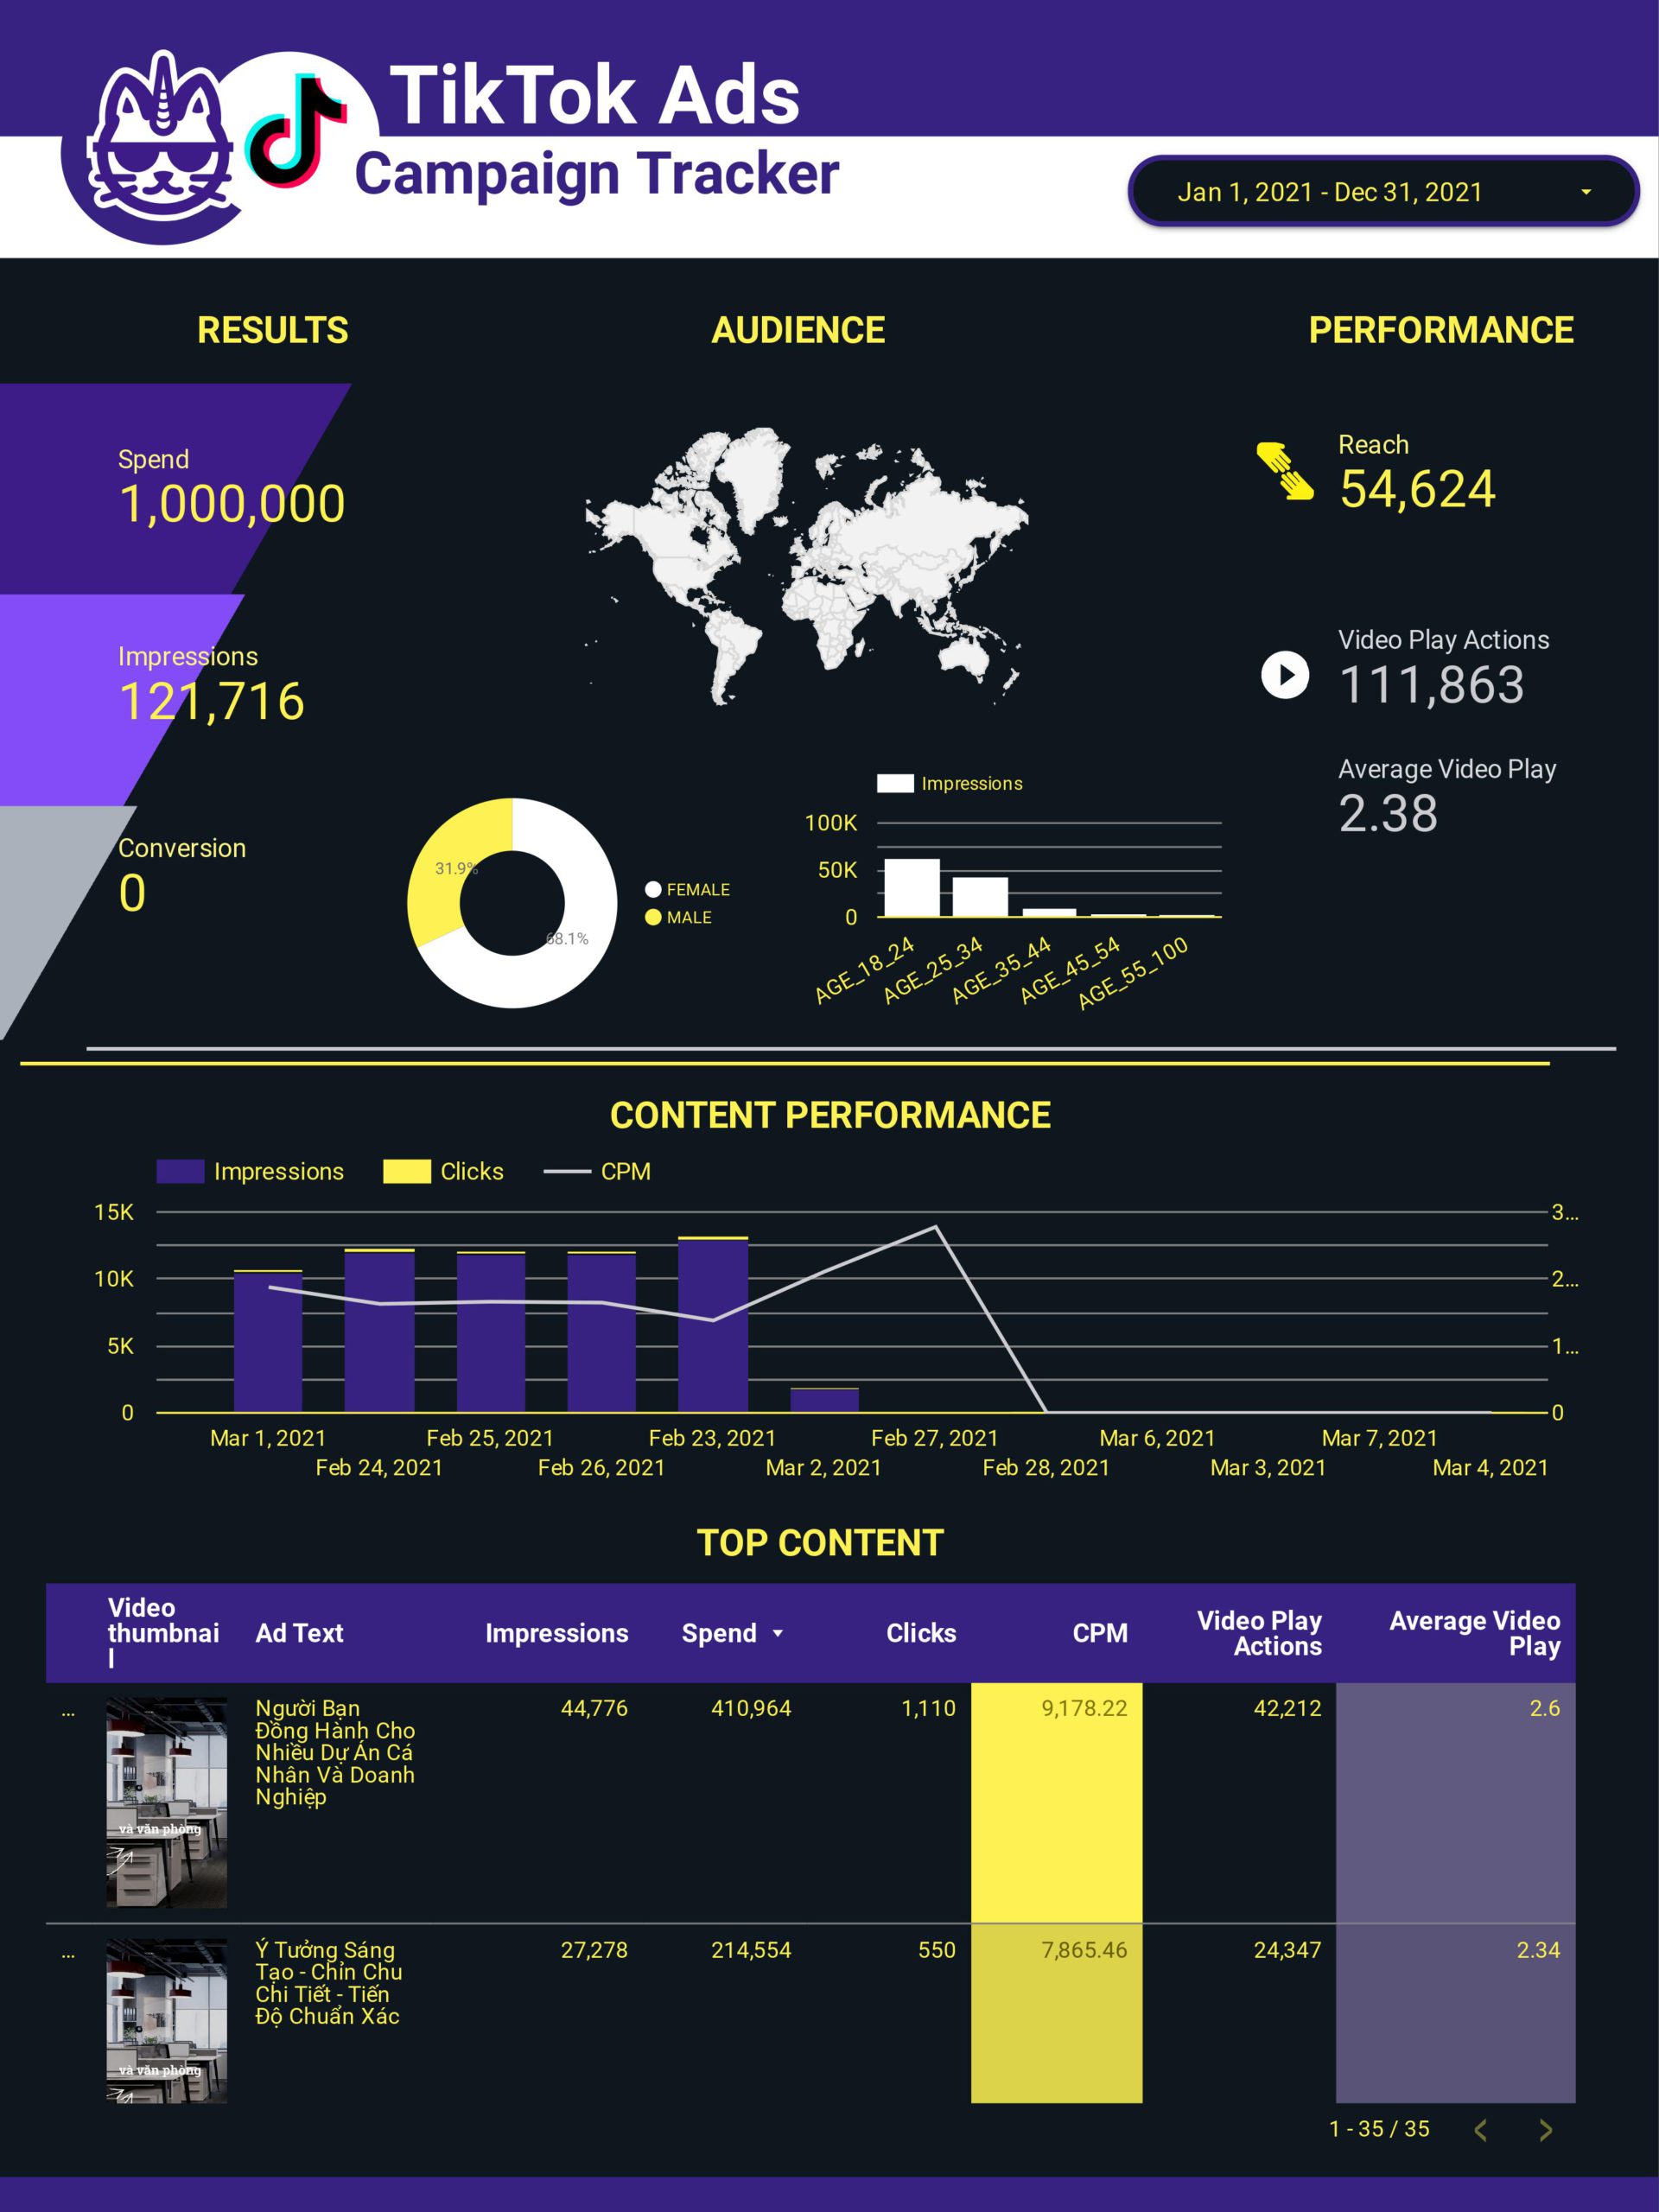
Visualize and customize your TikTok Ads performance data and get everything you need in one page (Mobile-friendly) Download it for FREE and start sharing the most relevant metrics with your teams.
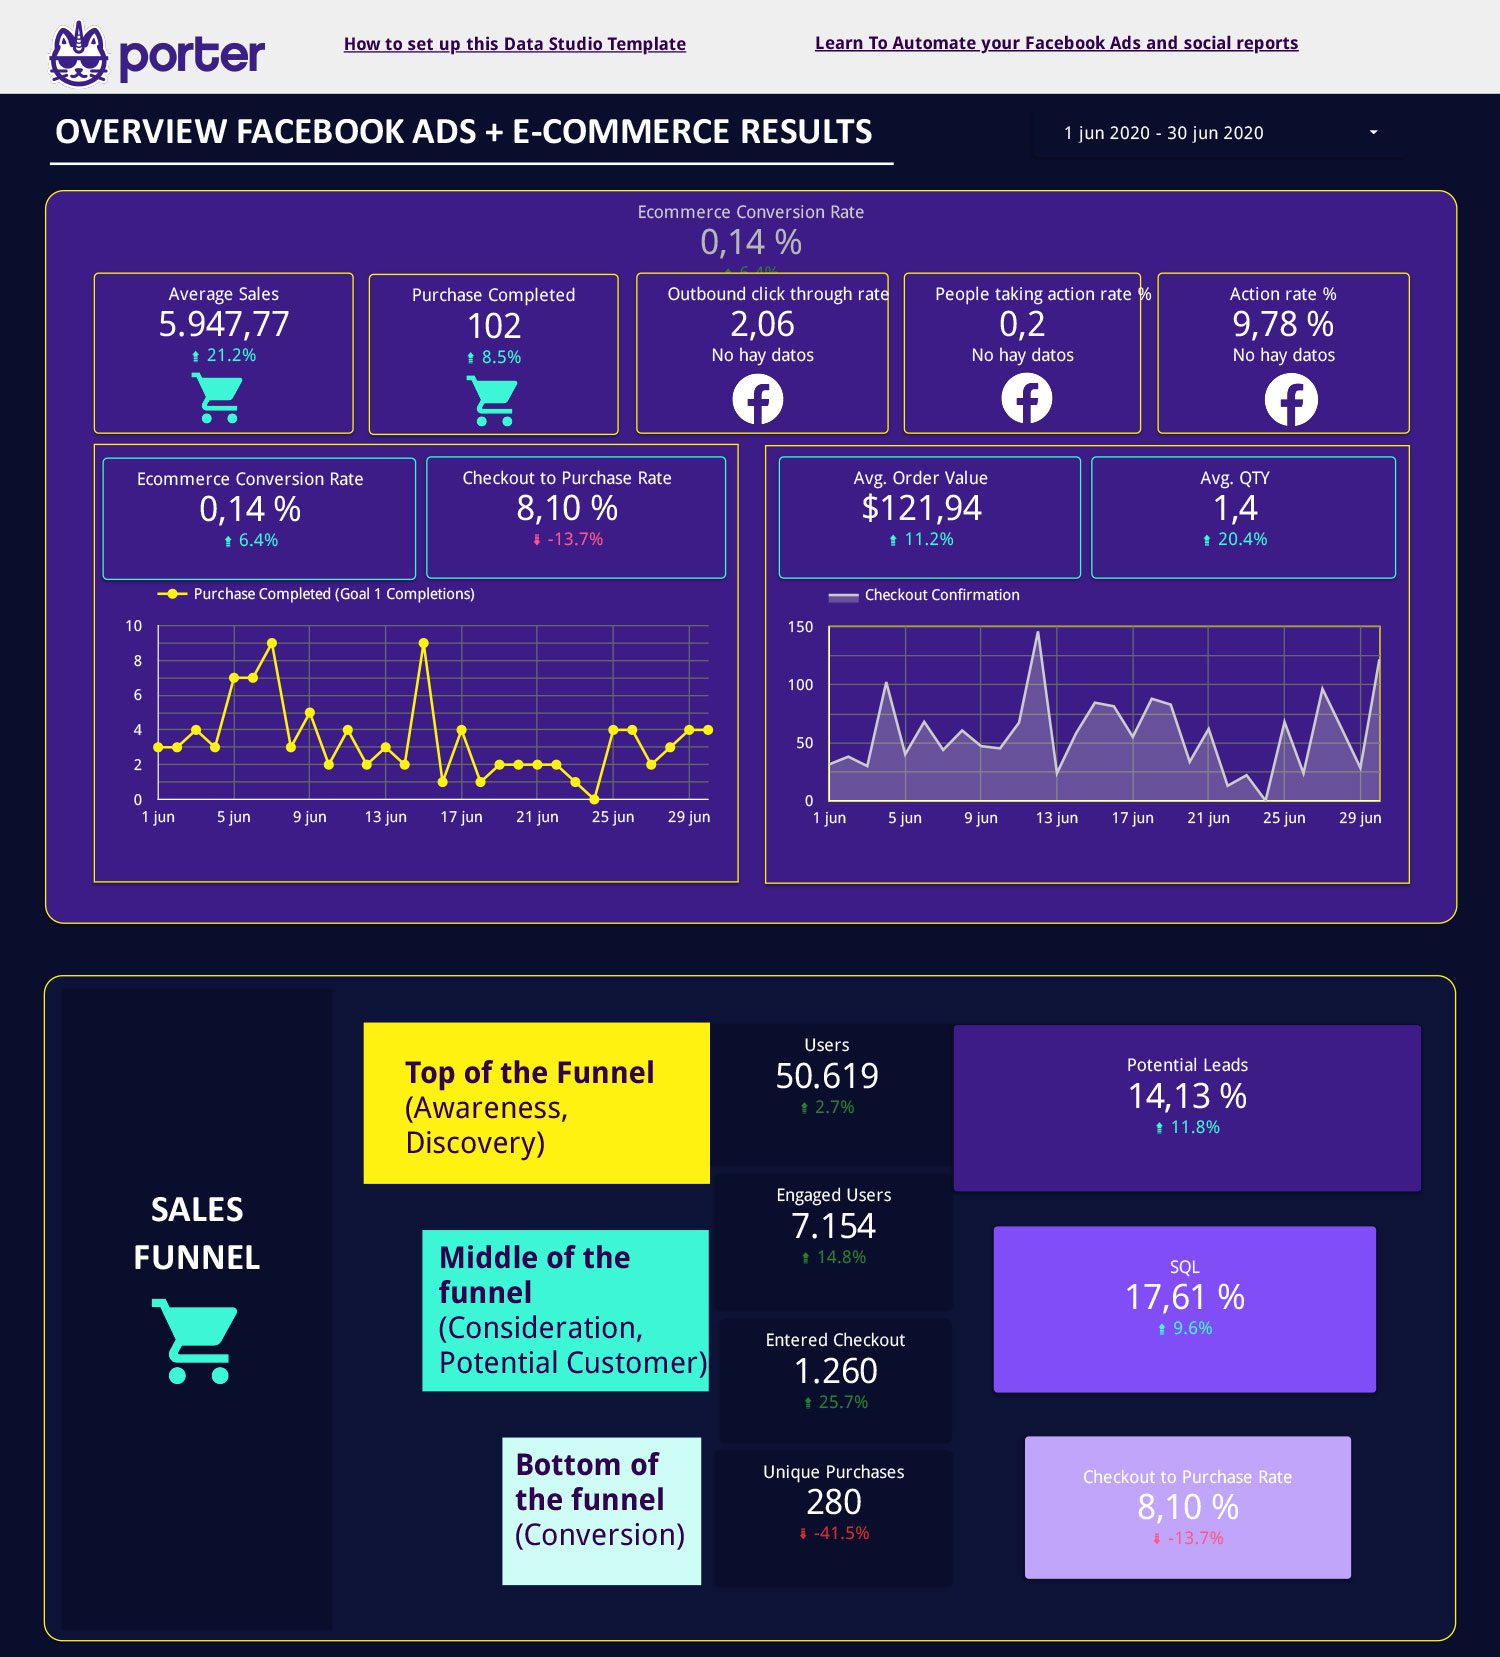
With this FREE template you have everything: your Google Analytics Data and your Facebook Ads performance. Now you can track your most important Business KPI’s in one place [Inspired in a real use case].
Visualize your marketing results as a funnel, get insights and understand how can you improve your conversion in every step of the customer journey.
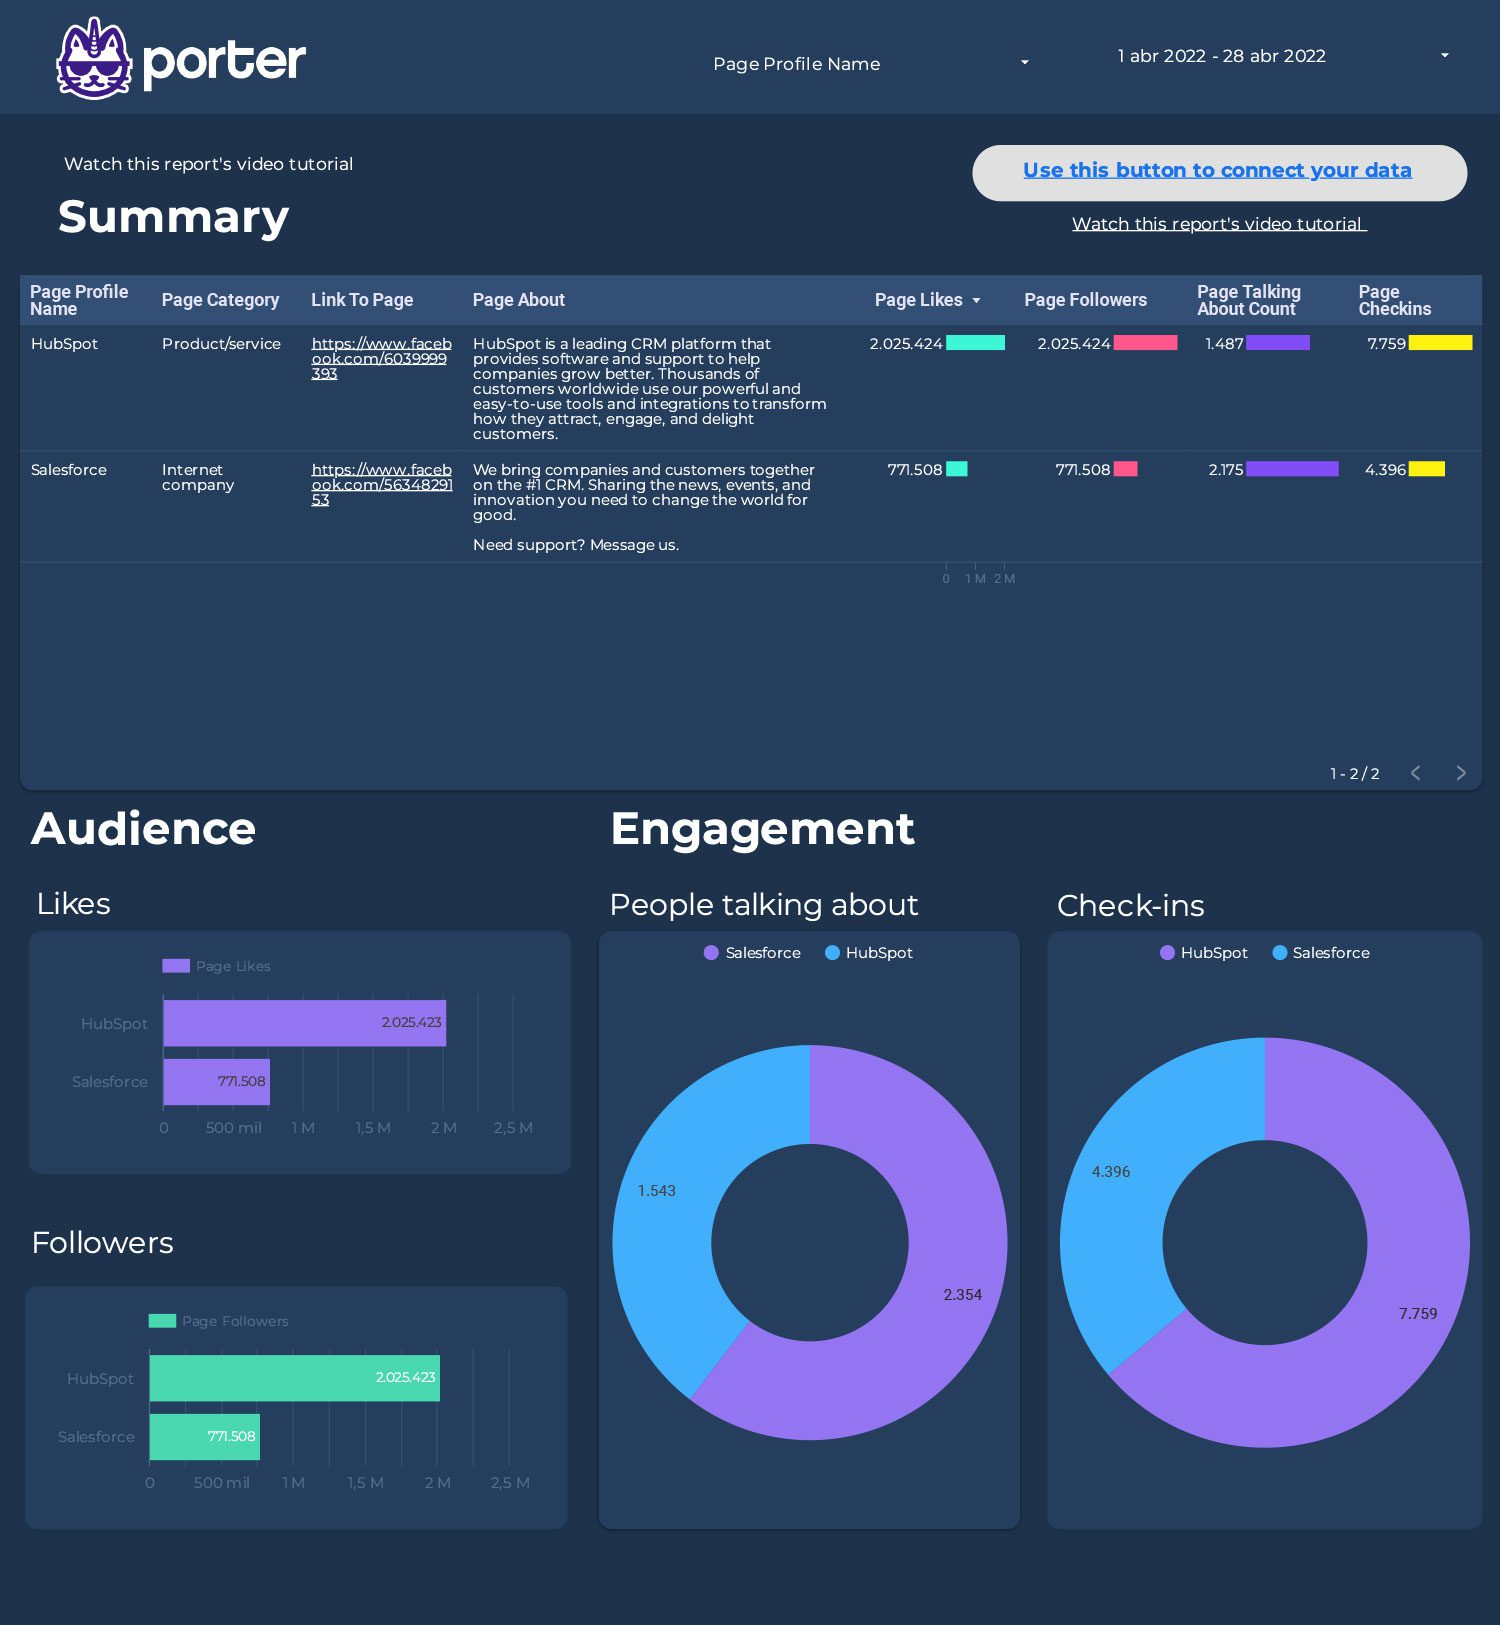
Download this visualization to track your competitors’ Facebook Pages. Pull and visualize data all for FREE with our Porter Facebook Competitors connector.
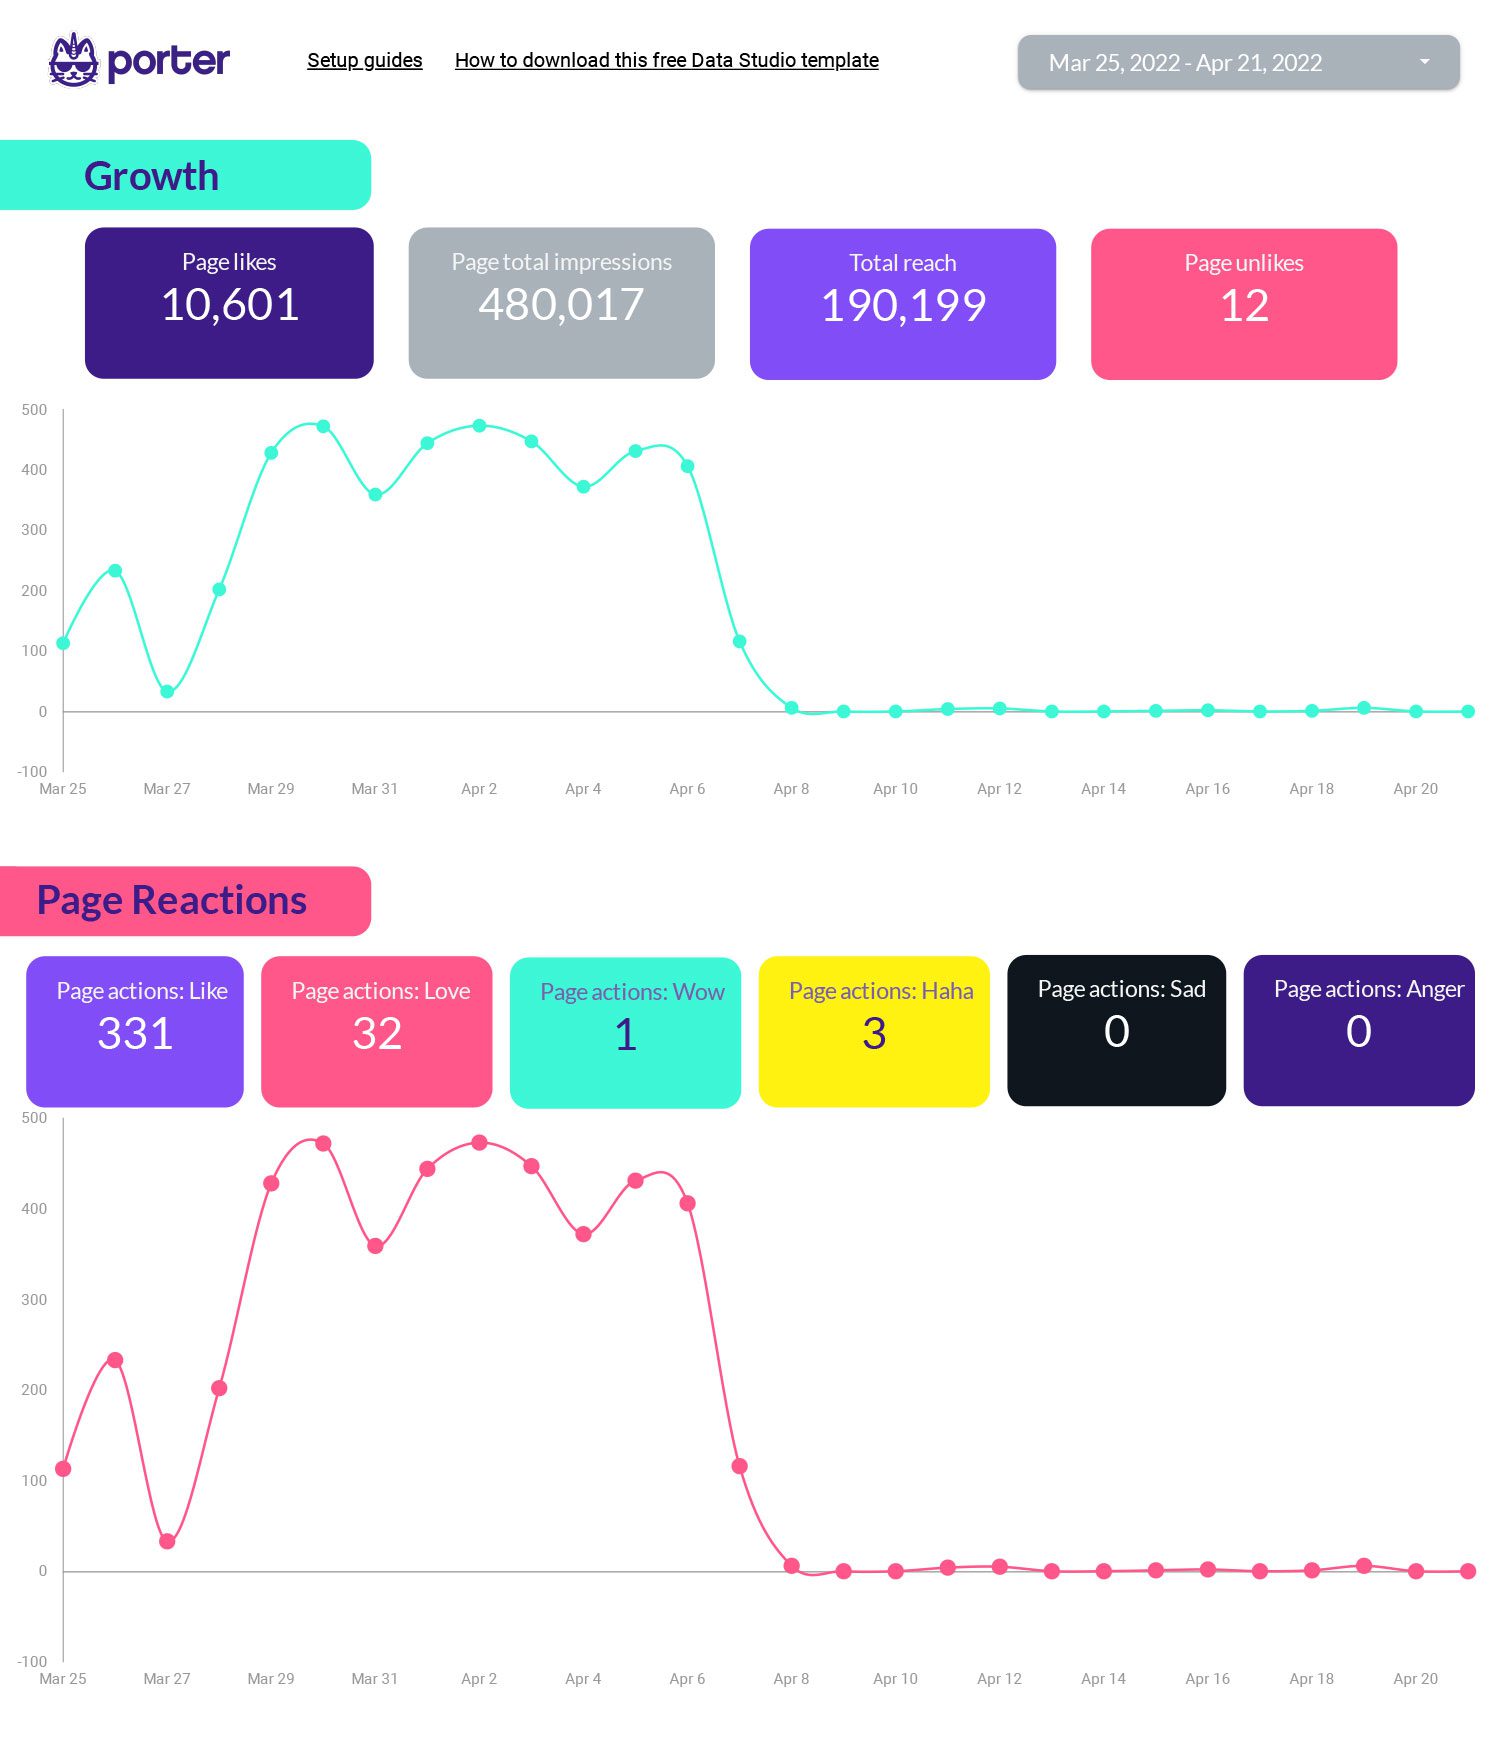
Track your organic efforts on Facebook Insights with this Google Data Studio Template. In just one page track: growth, page likes and reactions and page impressions.
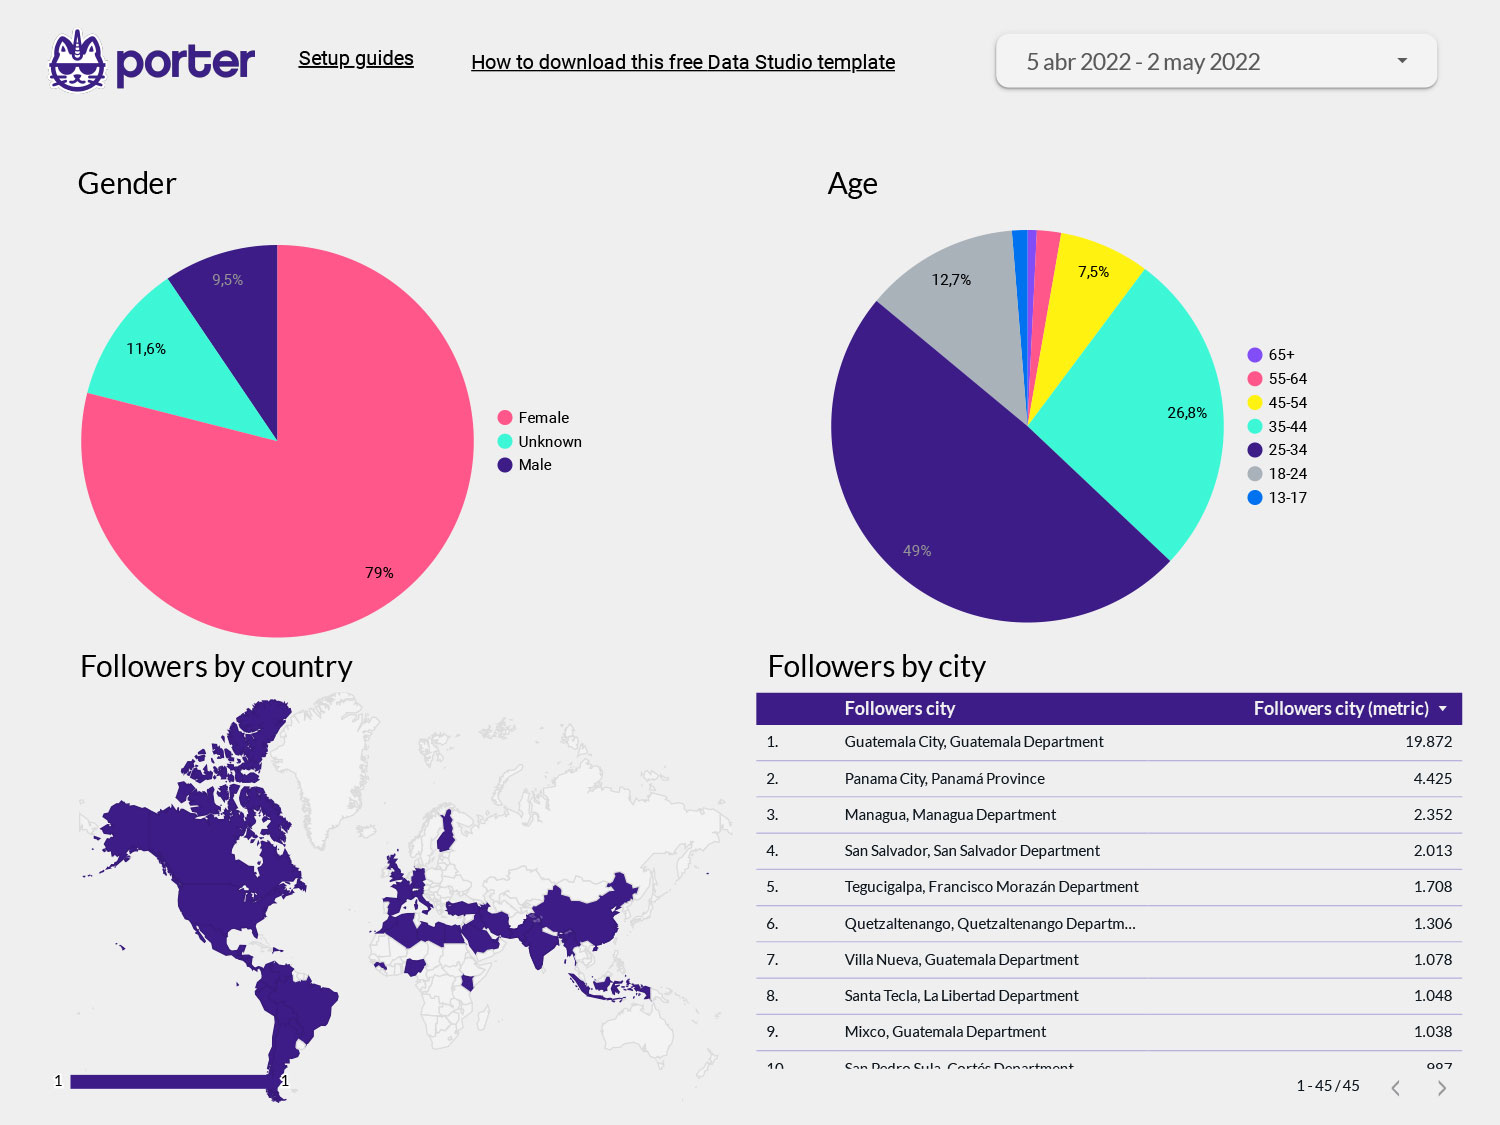
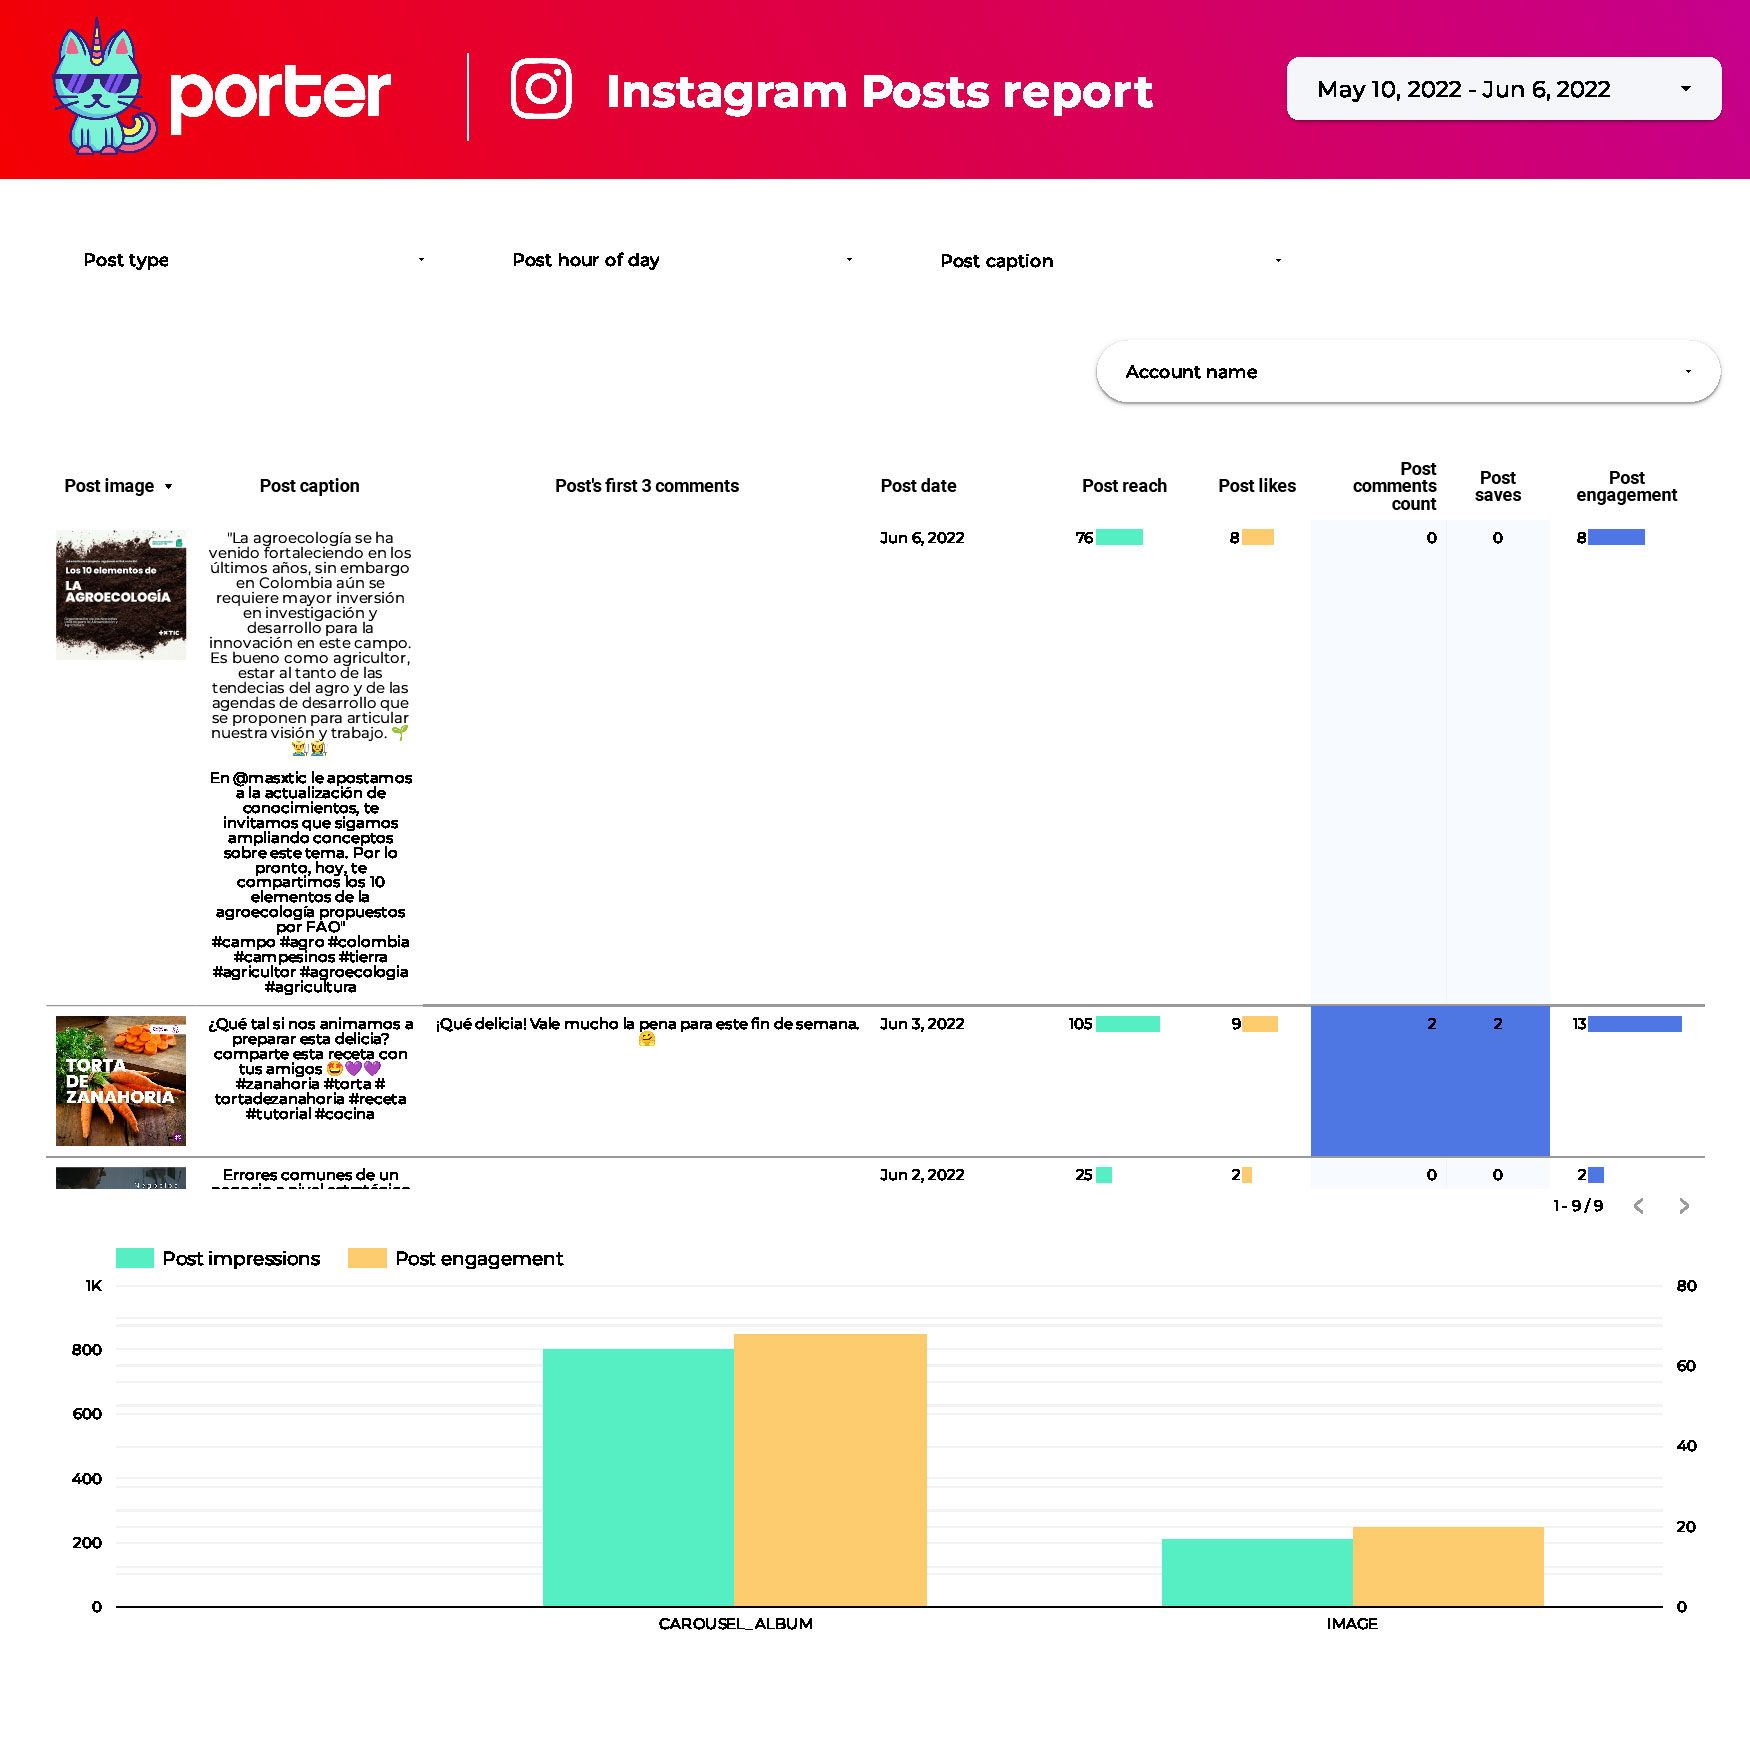
Do you want to get a deeper understanding of your Instagram organic results? Download this template and visualize your data at an account and post level.
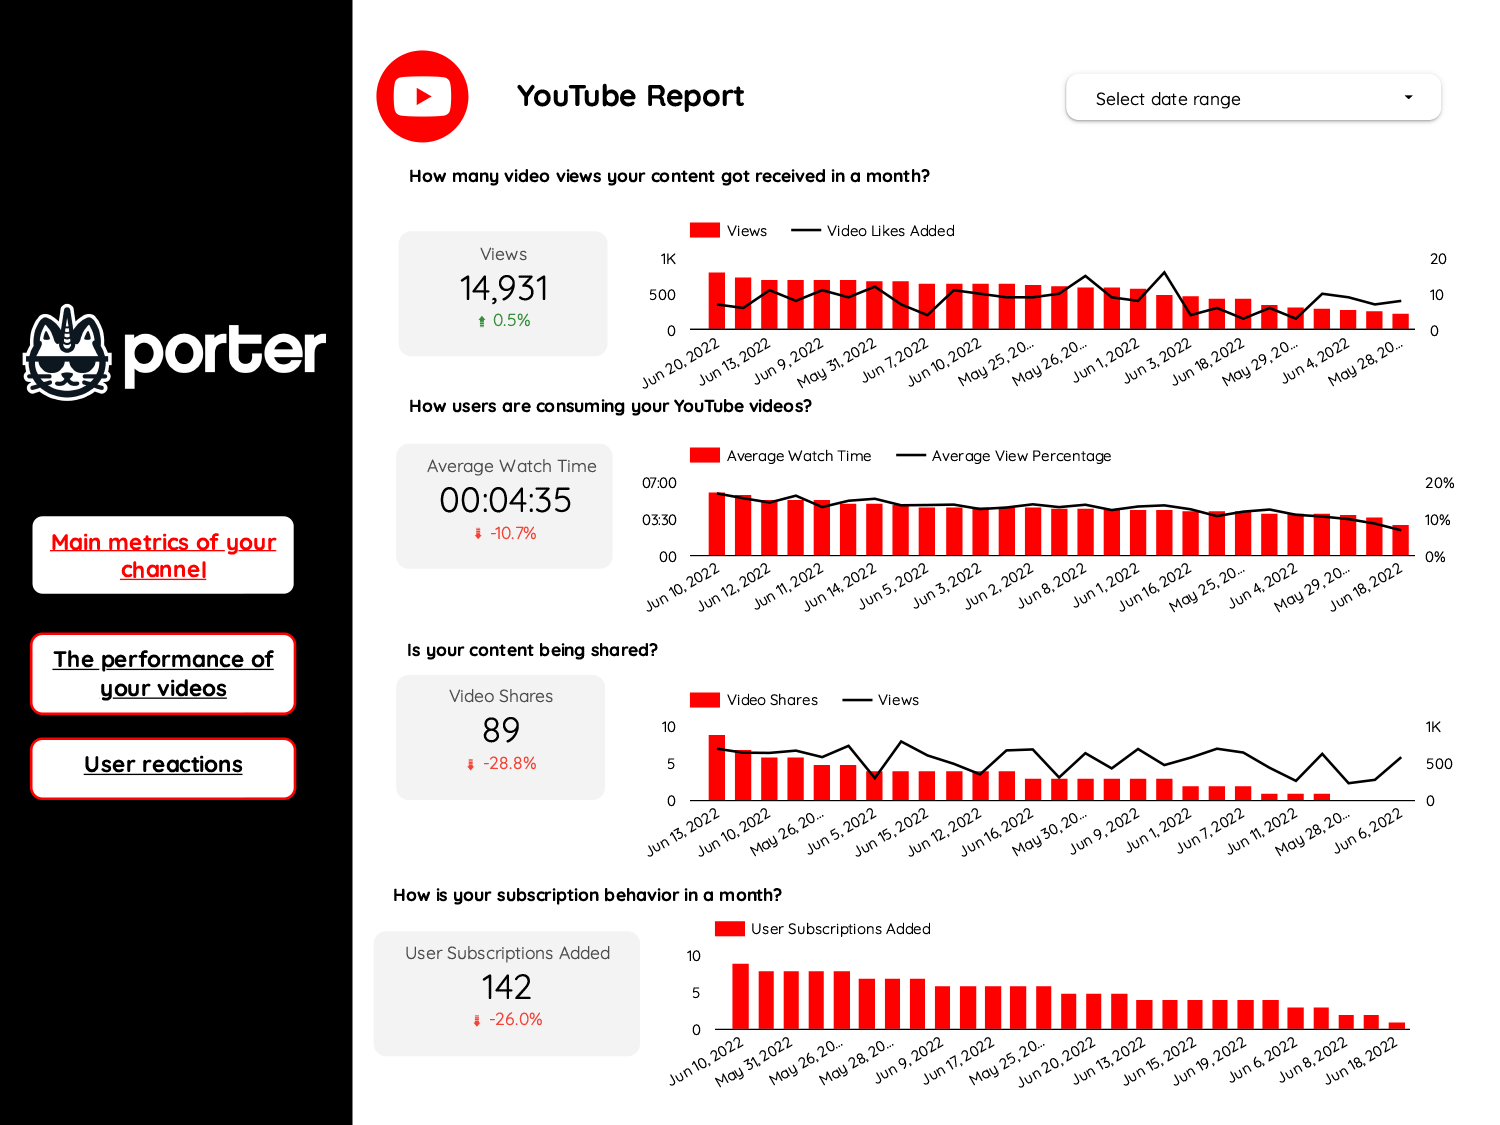
This YouTube Template will help you measure the impact and performance of your video content pieces and will allow you and your team to understand and analyze the following Video KPIs
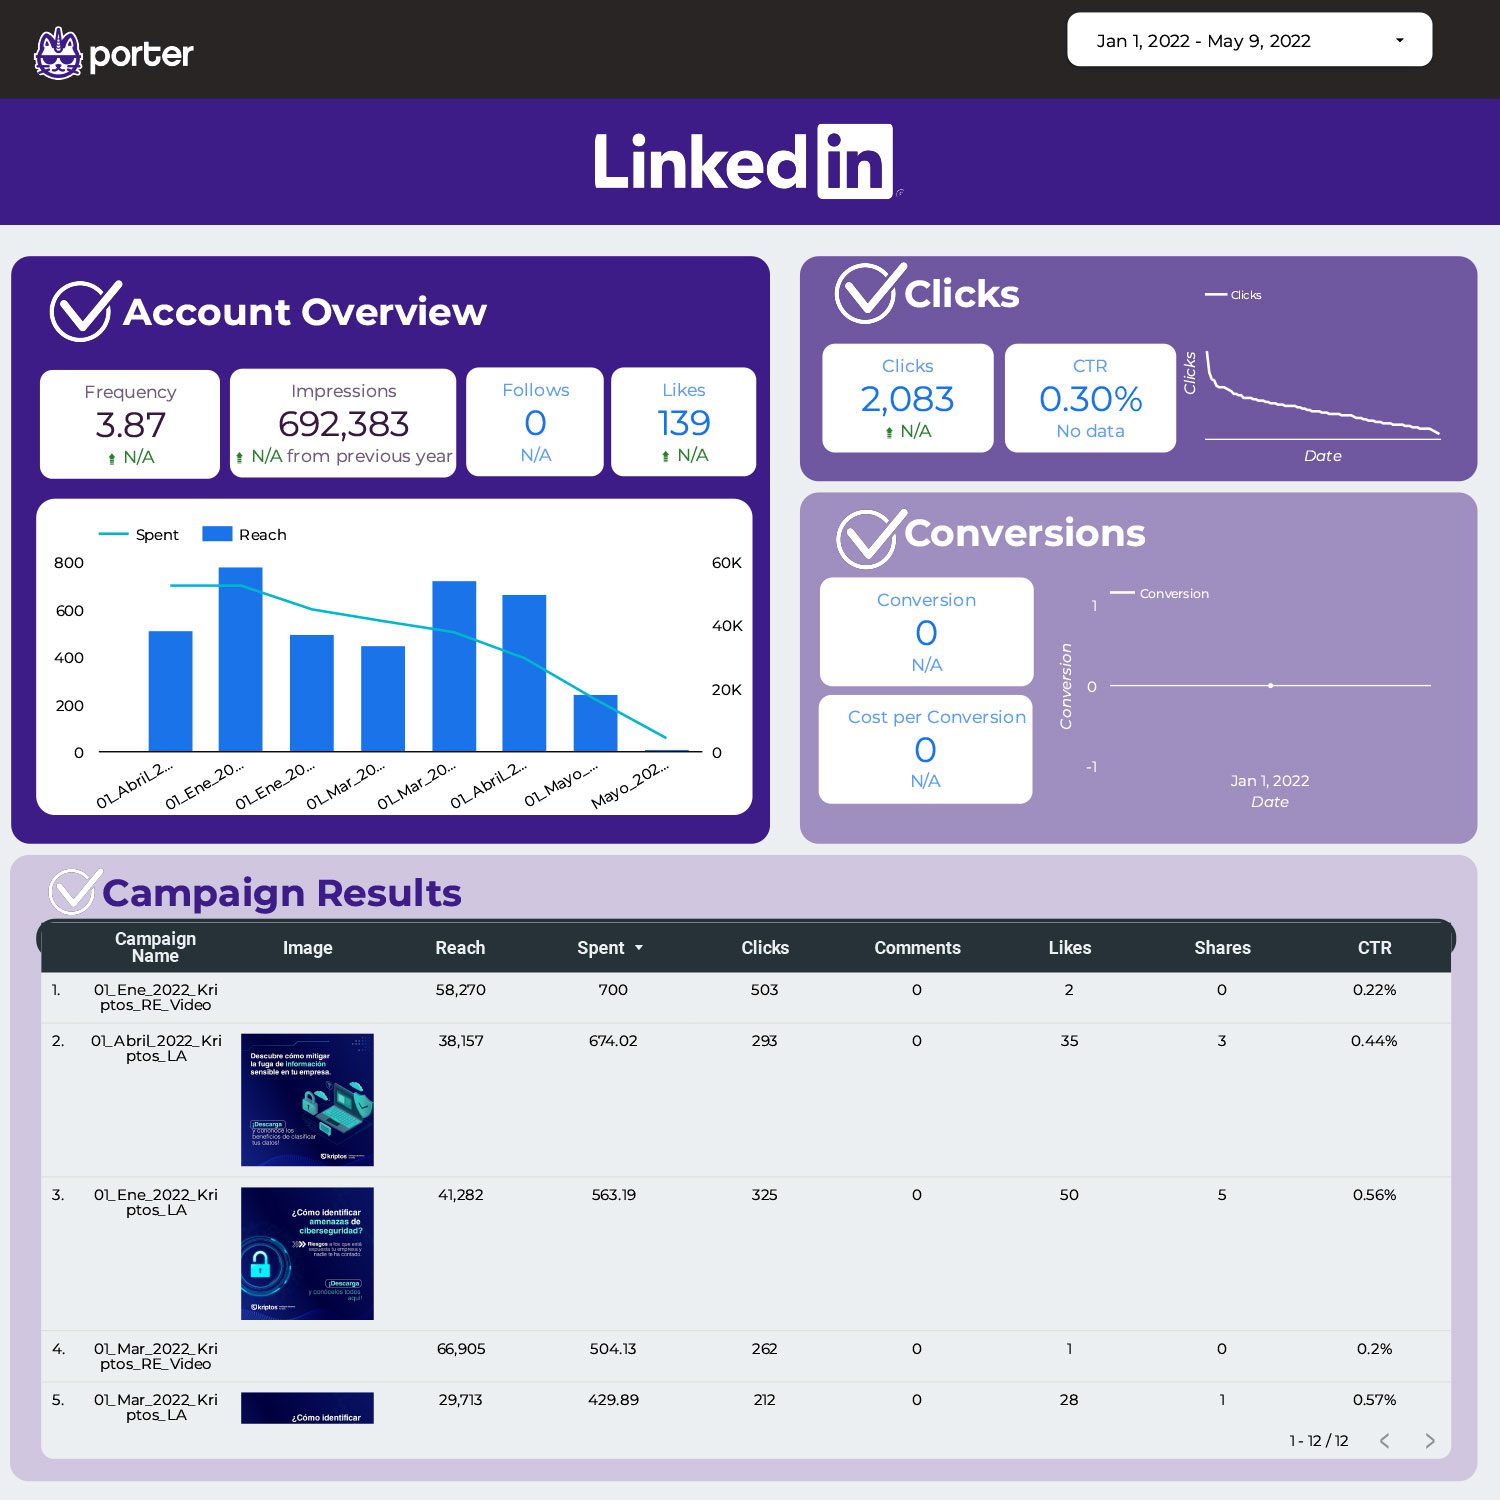
With more than 200 fields automate your LinkdIn Ads report, track your most important KPIs, compare different periods and break down your campaigns as you want.
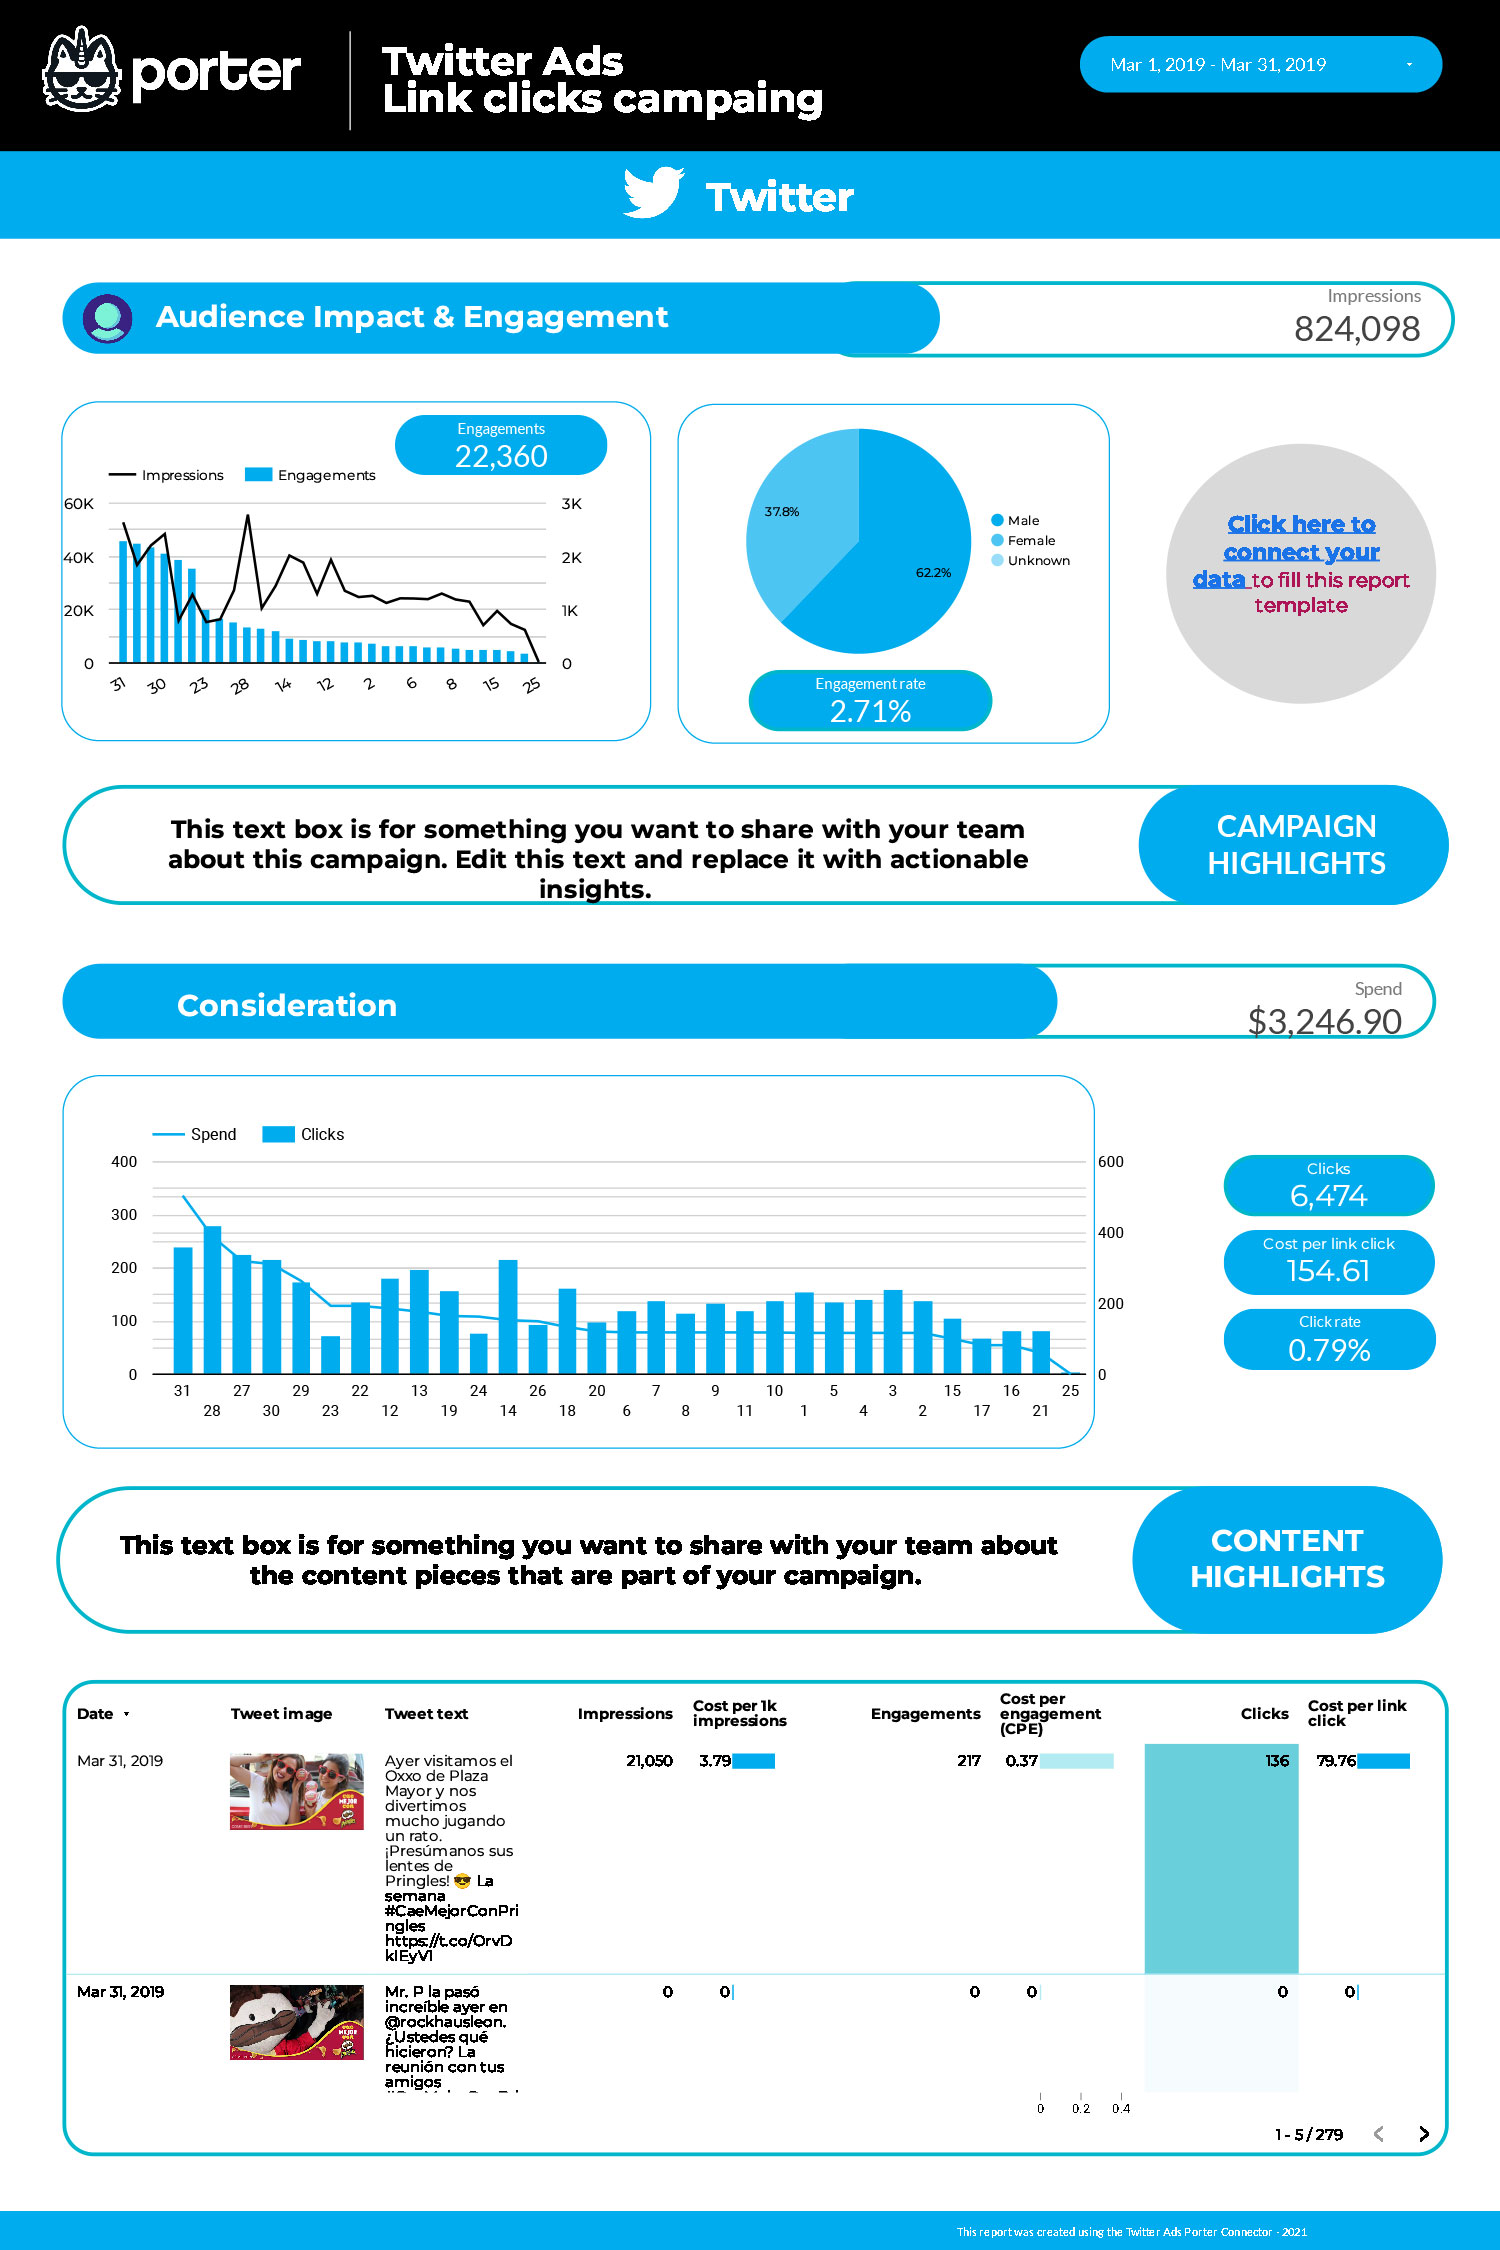
Calculate and report your advertising spend on Twitter. Understand the impact of your Twitter Ads.