

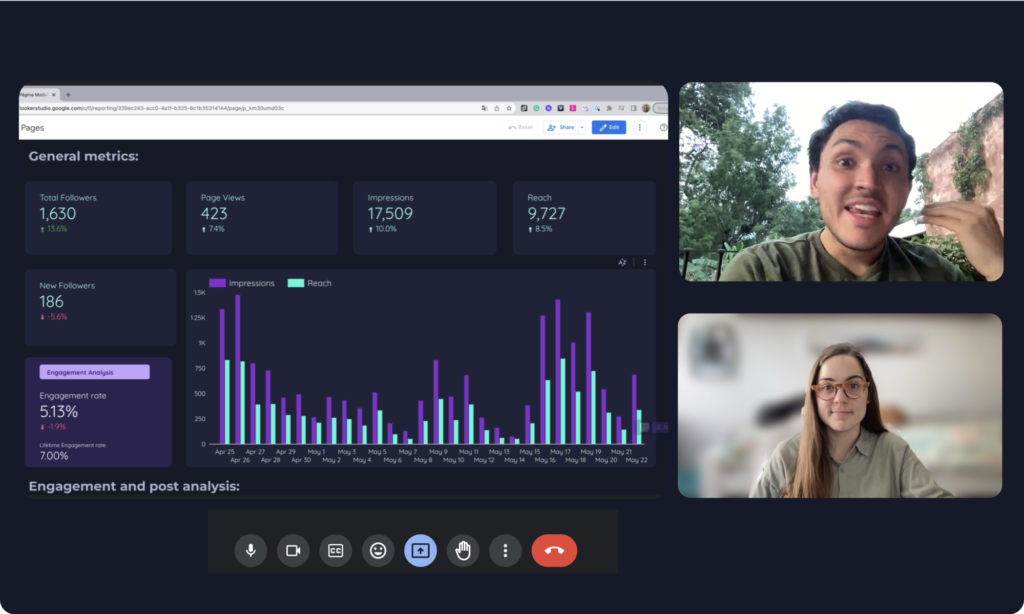

Great connector tool, FABULOUS Customer Support. Very simple to use, easy setup and awesome report templates. When I had an issue connecting, the support team was immediately available via Chat and then Google Meet to resolve my problem. The very friendly Support team understood my urgency and resolved my issues right away. Thank you, Alejandra, you are awesome.
We use Porter to connect Facebook, TikTok, LinkedIn, and GMB with Looker Studio for reporting. Their customer support is incredible; when we have a problem, they answer immediately and connect with us fast to solve it as soon as possible. They have also helped us to learn how to use and understand Looker Studio.

I have spread Porter Metrics to all my contacts. The person that I show you the tool is fascinated with the integrations, competitive price, etc.
Porter Metrics is helping us to improve the use of time migrating complex dashboards by themselves, using their connector to reduce the operative task for my primary team, giving us extra time to analyze and build strategic thinking. When Porter Metrics has a customer service promise is a fact, and they do whatever that they can to resolve your issue and give you the best experience with the product.

The union of Porter Metrics and Looker Studio is very good, their super attentive service team and Juan's support is invaluable. 🔝 100
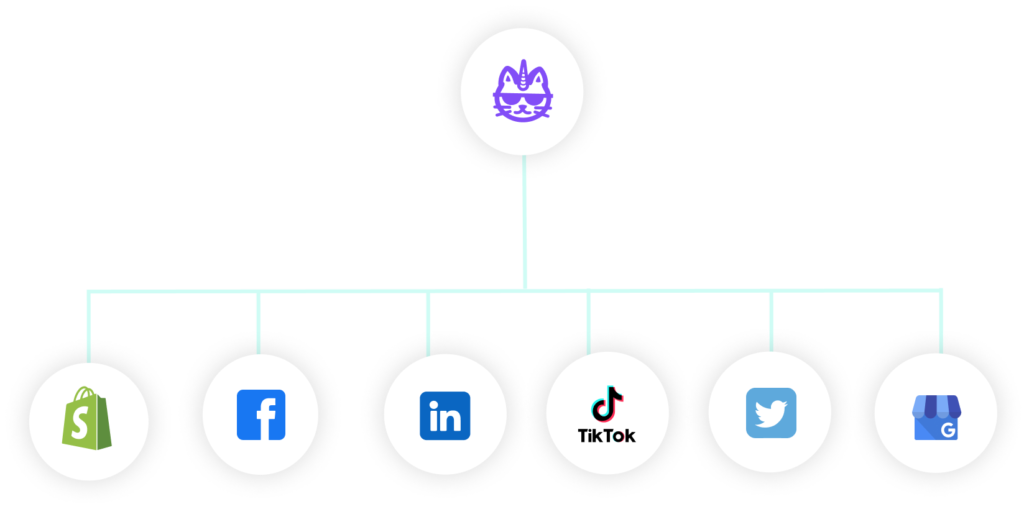
I work creating dahsboards for all types of companies. We need a centralized place to check all social media metrics and CRMs. Porter allowed us to have a one source of truth that would have:
Facebook Insights
Instagram Insights
Linkedin ads
Shopify sales
Hubspot leads
All in one place! It is unbelievable!
Whenever I had a question, their customer service team was there to help me.
This was the main difference on to why we are using Porter above Supermetrics. They have a human touch and a know how at your disposal.
10000% recommend