Free Google Analytics report template
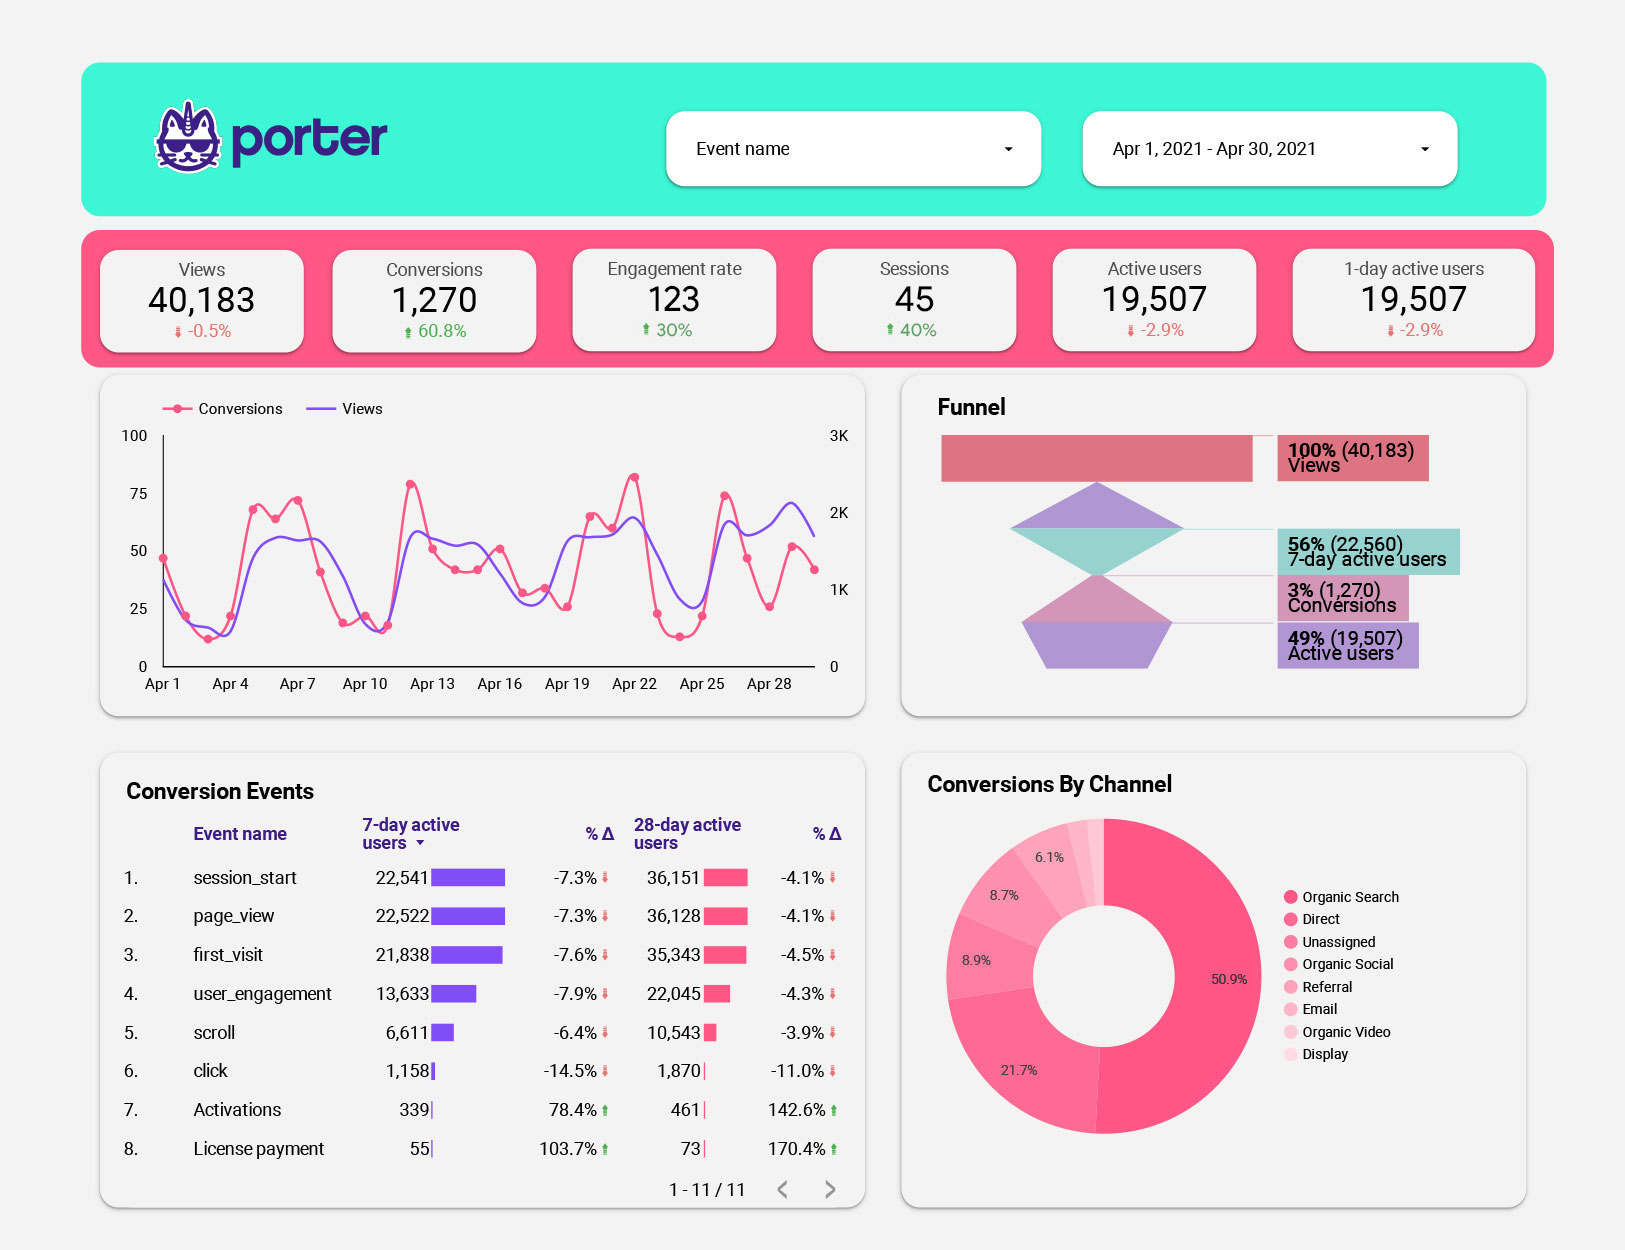
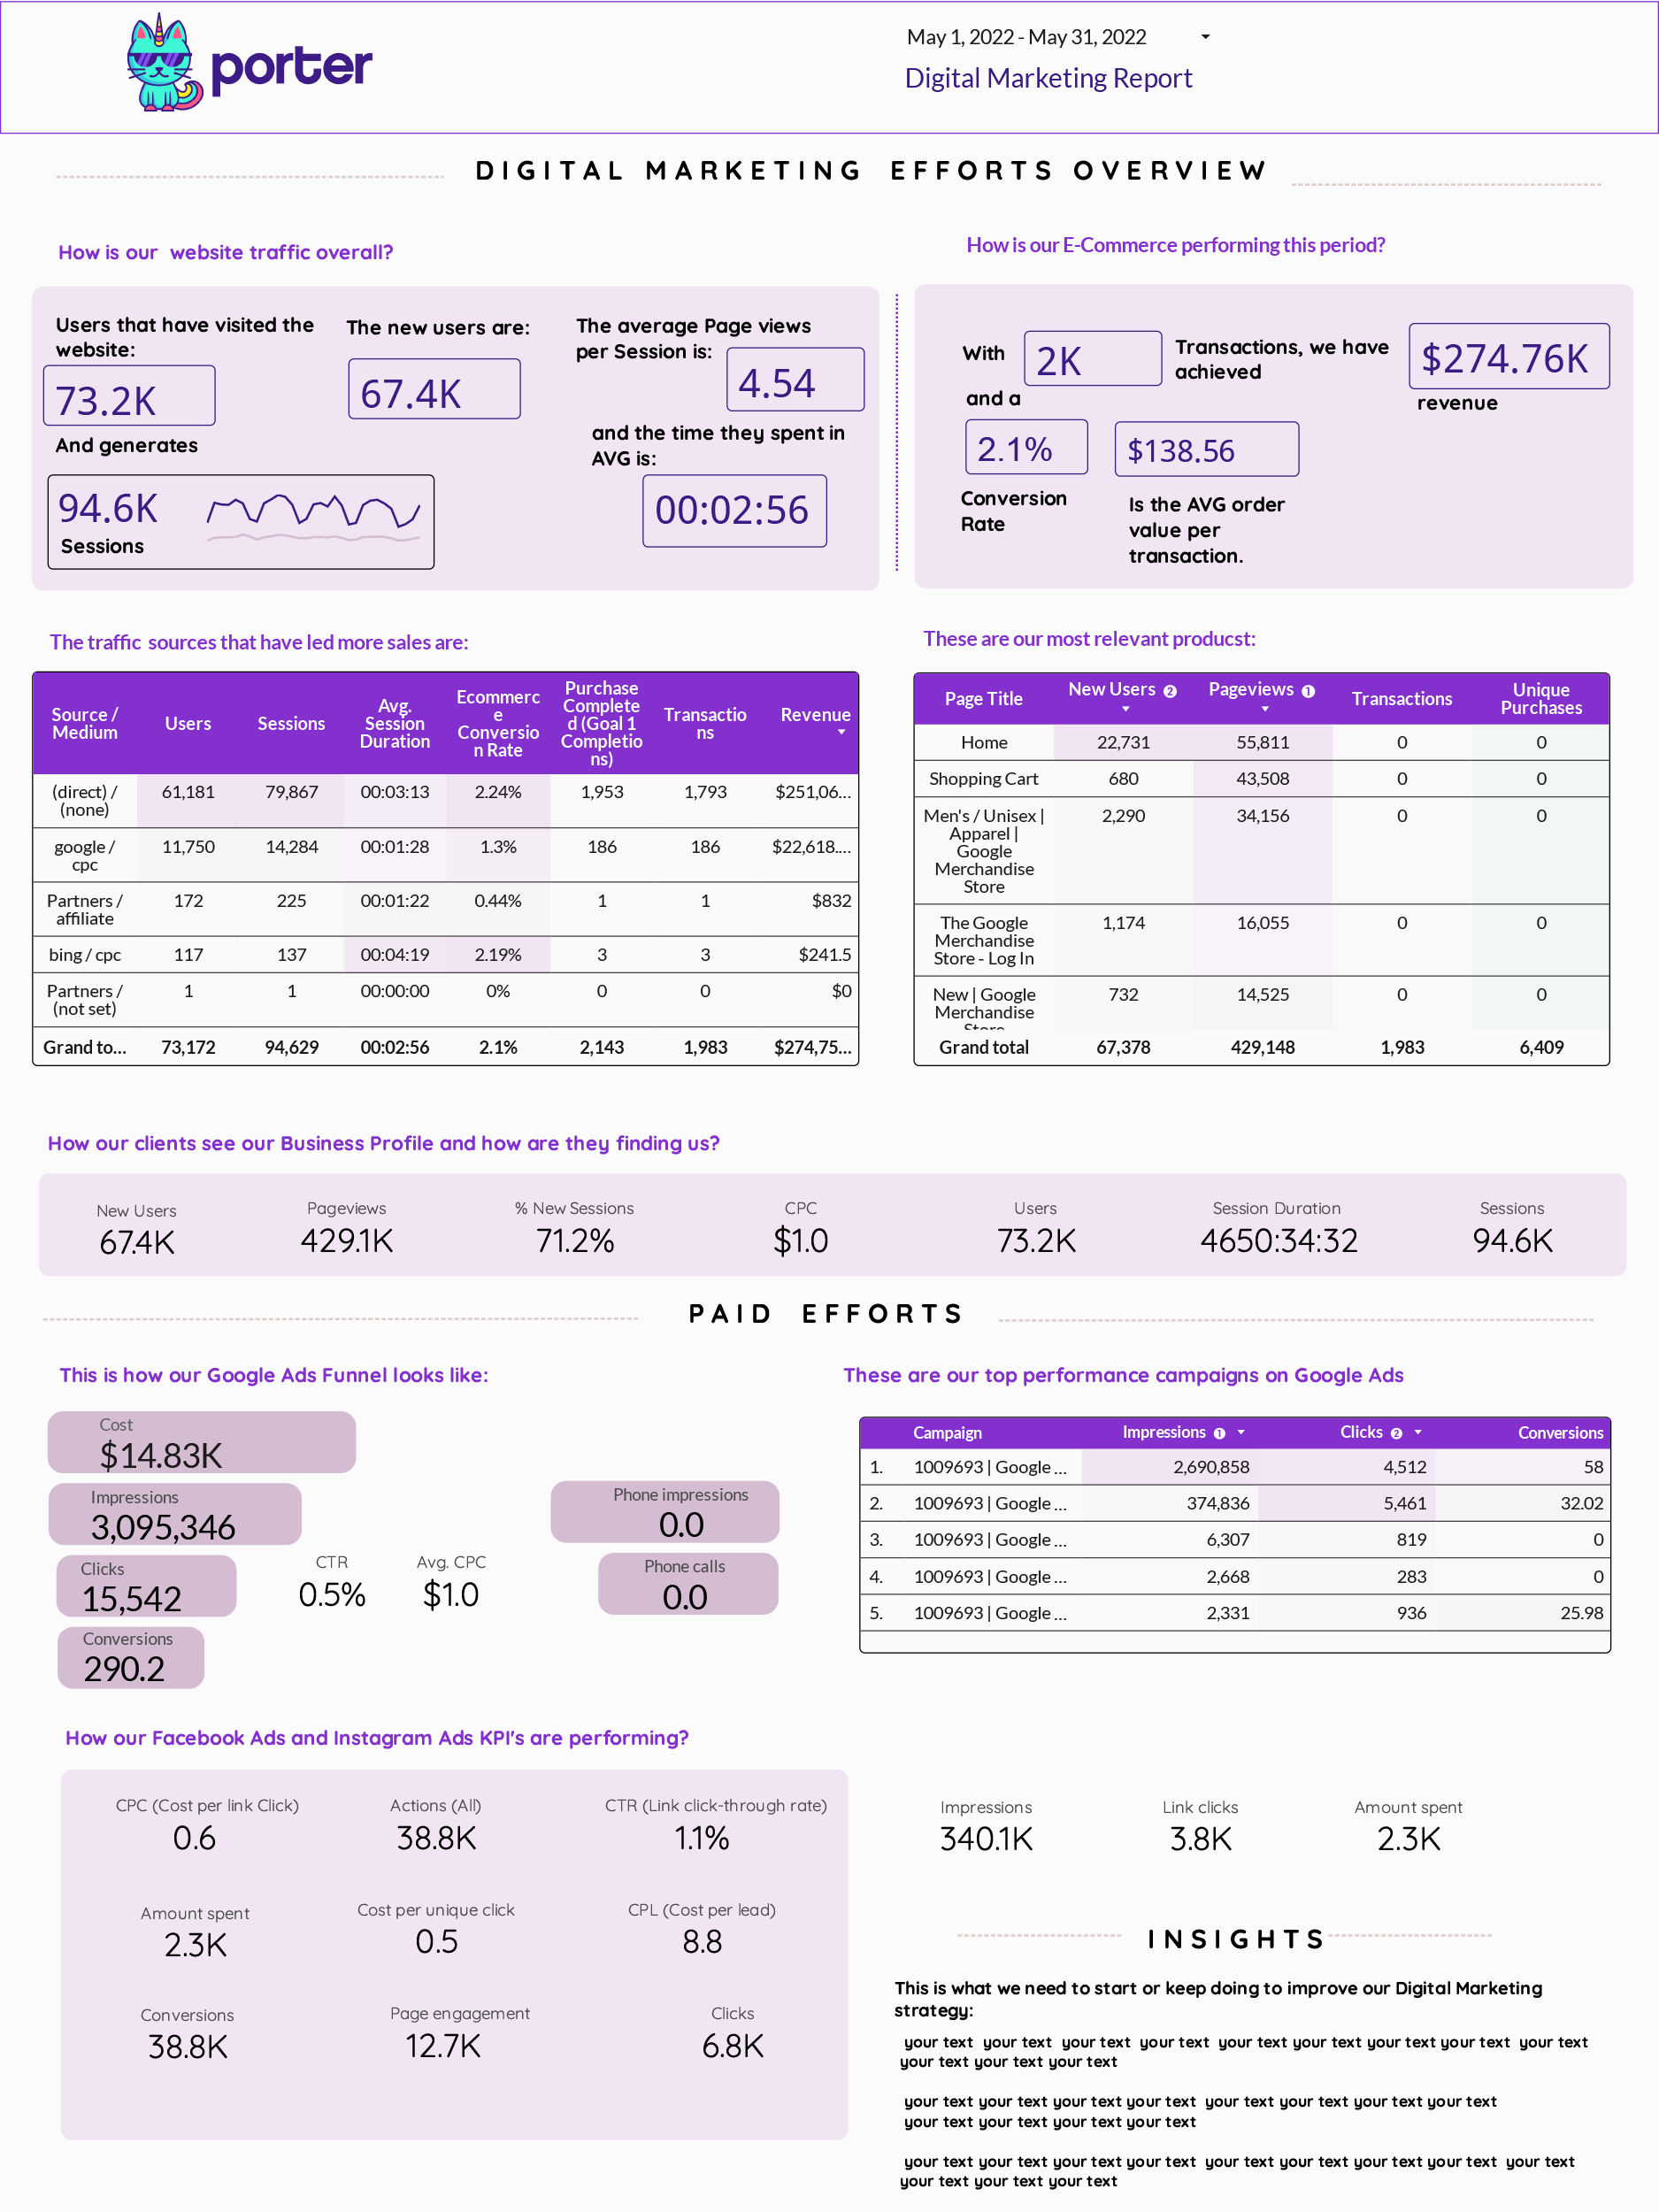
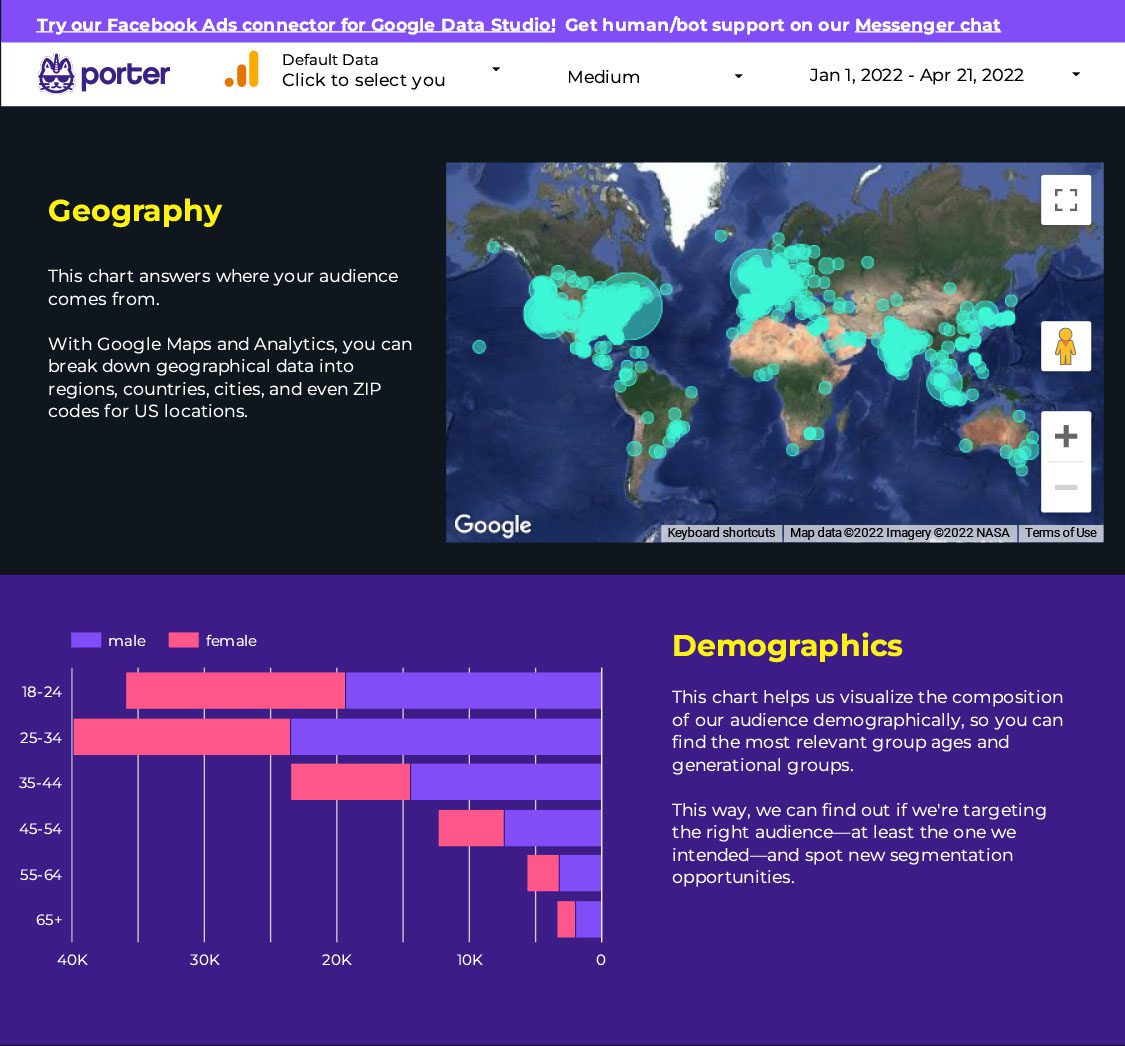
Understand how are you acquiring users, engaging, and monetizing your e-commerce with this Data Studio template. Compare your monthly results and understand your user demographics.
Understand how are you acquiring users, engaging, and monetizing your e-commerce with this Data Studio template. Compare your monthly results and understand your user demographics.
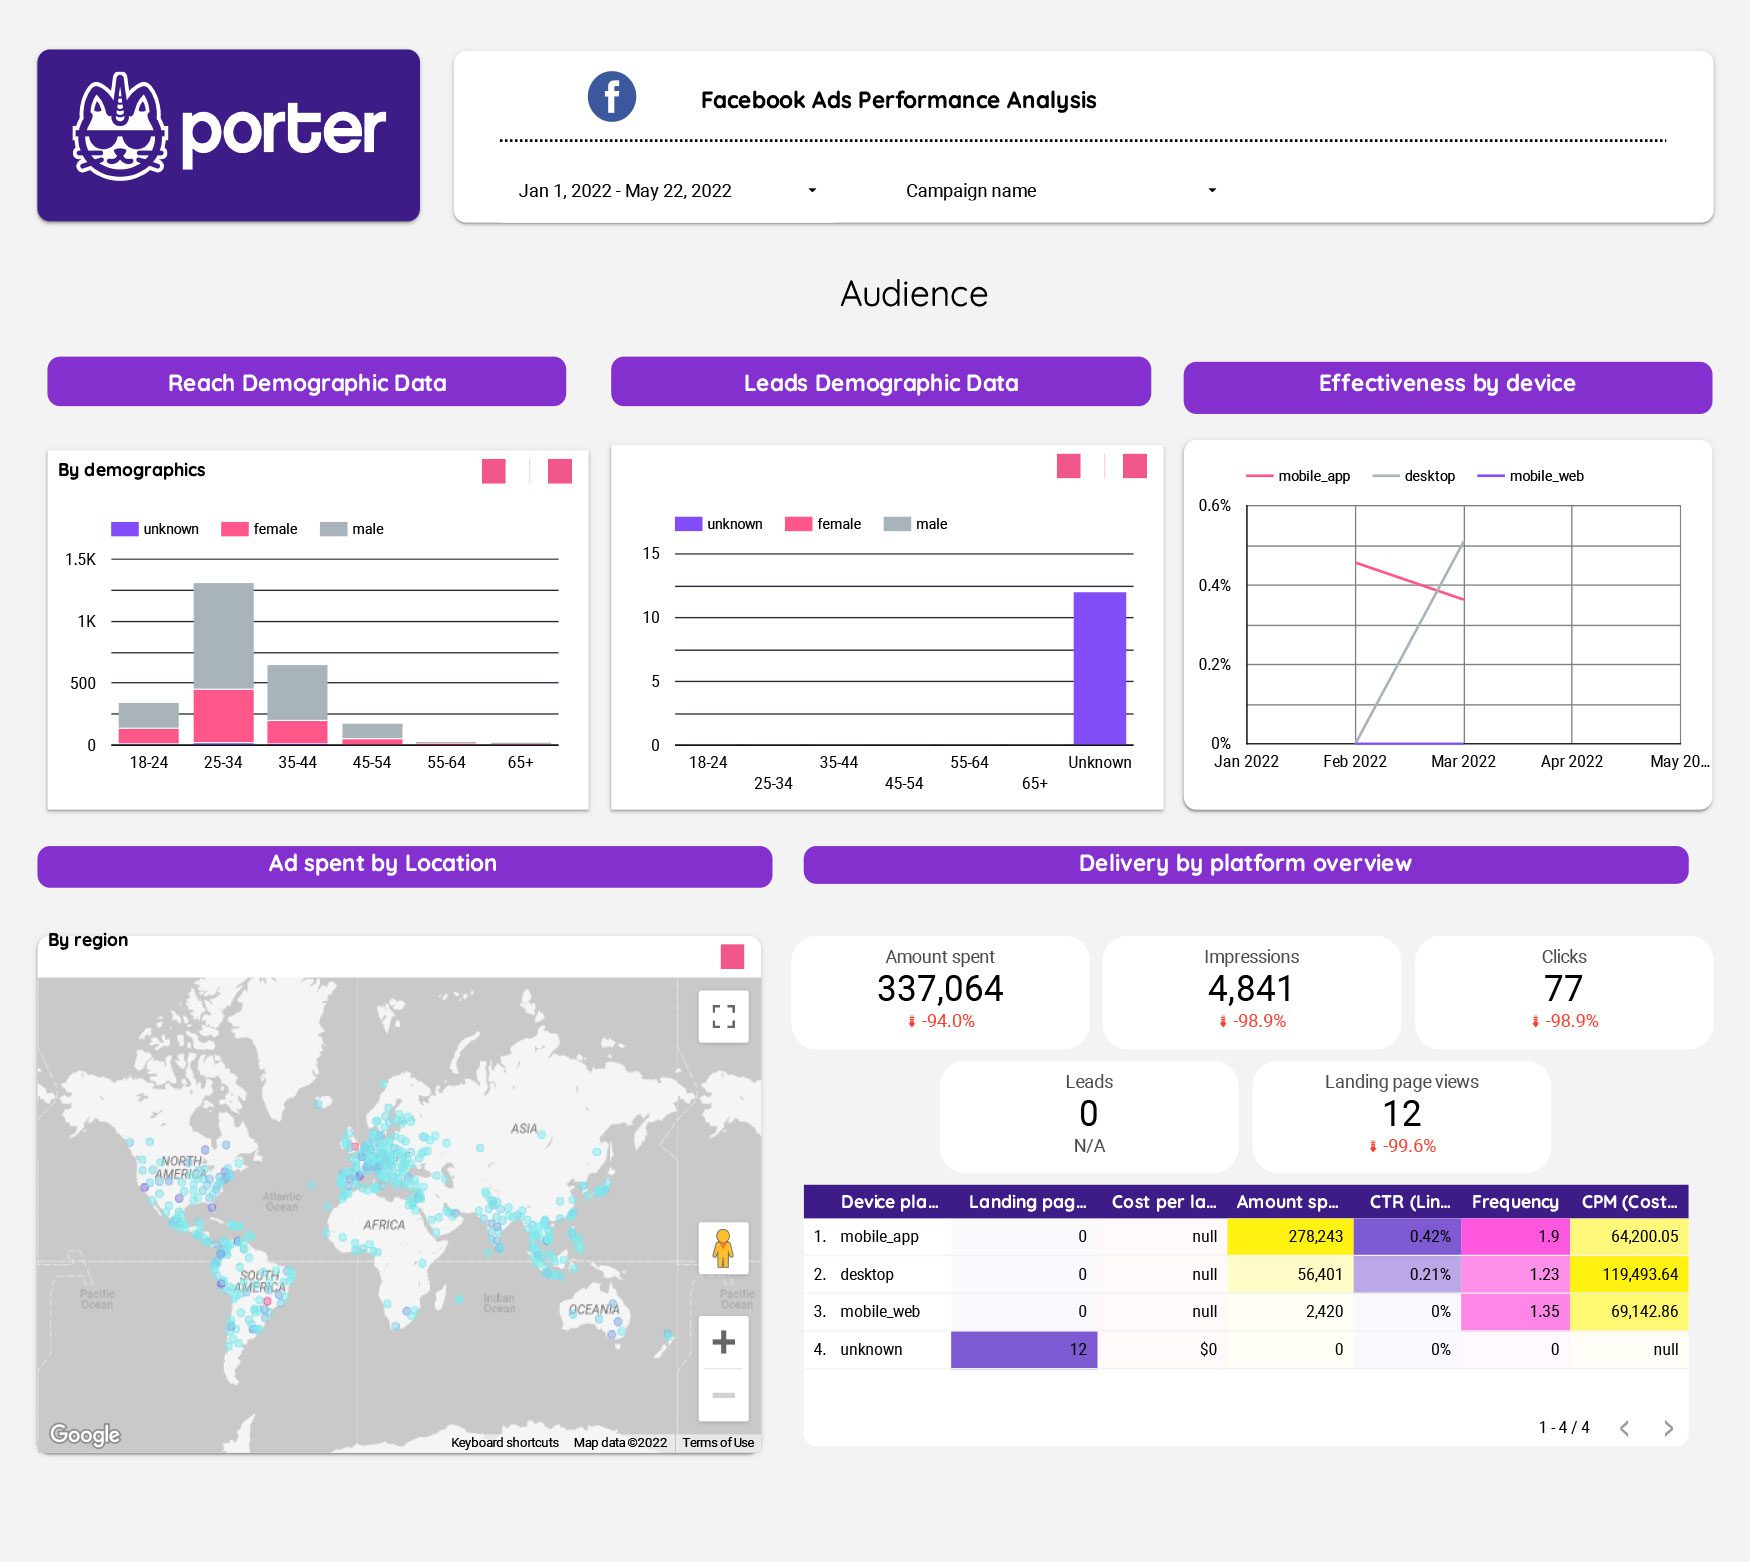
We created a free analytics report template to help you analyze and better understand your account. Simply connect your Facebook Ads account to Google Data Studio, and the template will do the rest!
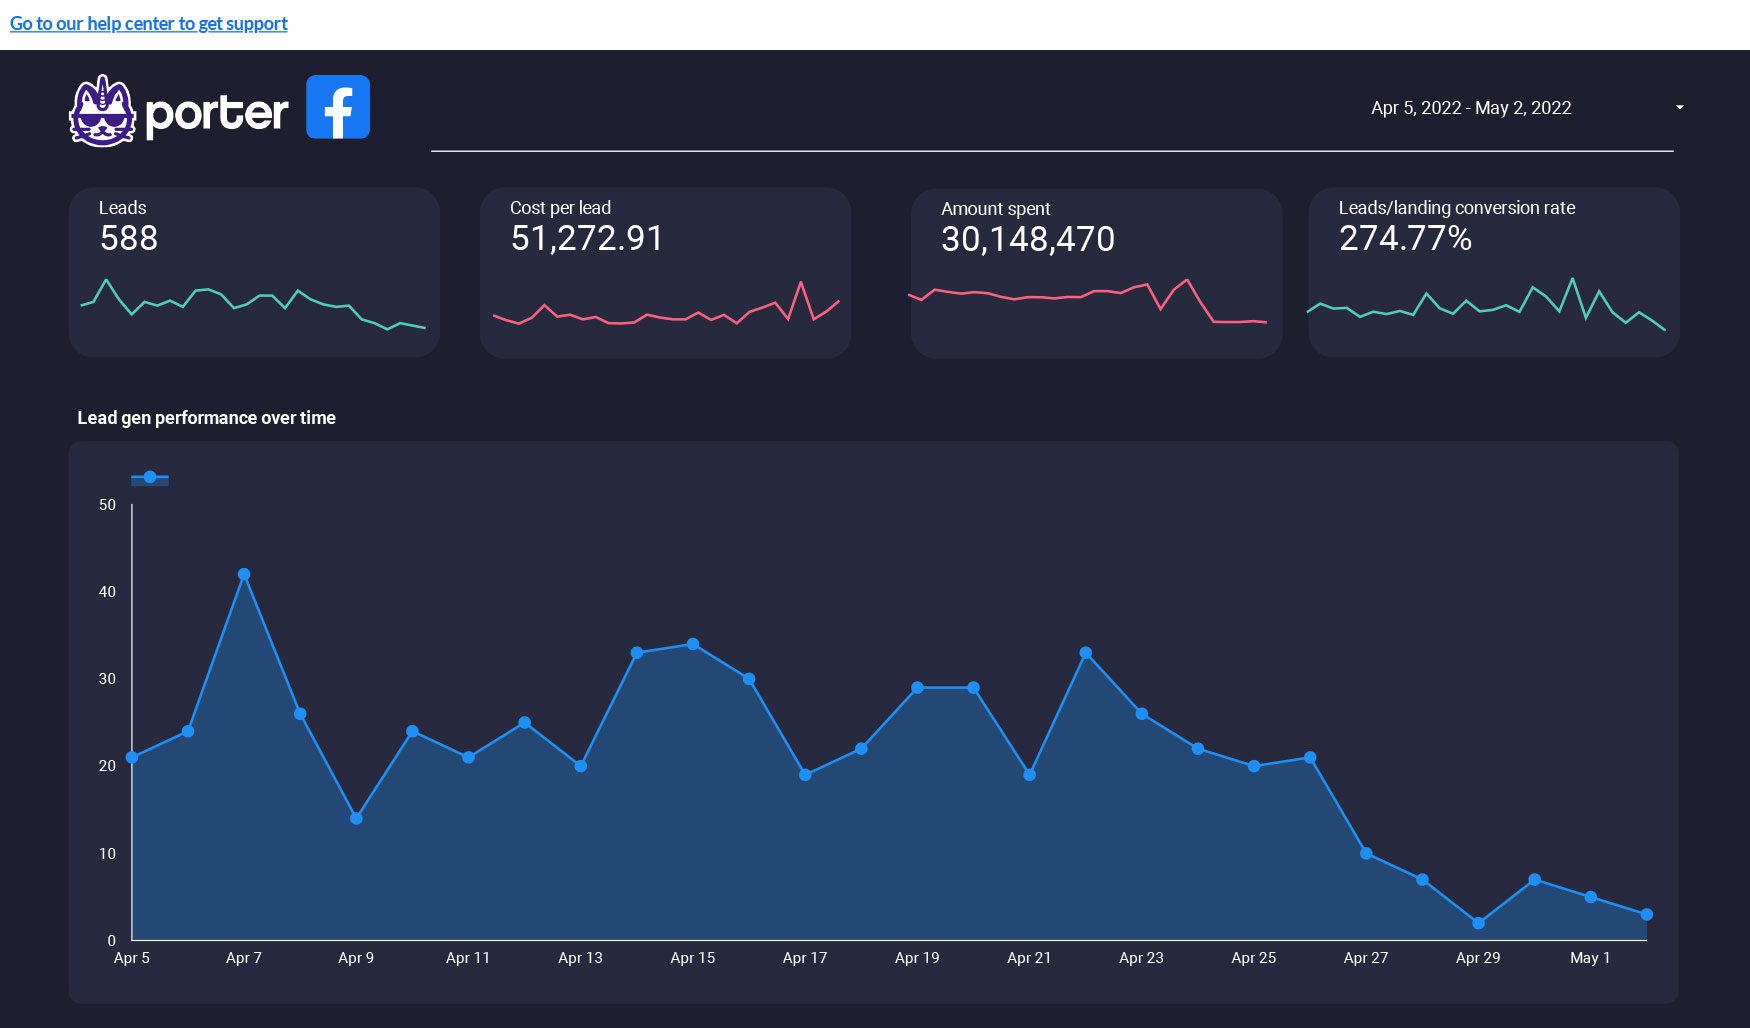
Use this Google Data Studio template to track and optimize your lead generation efforts.
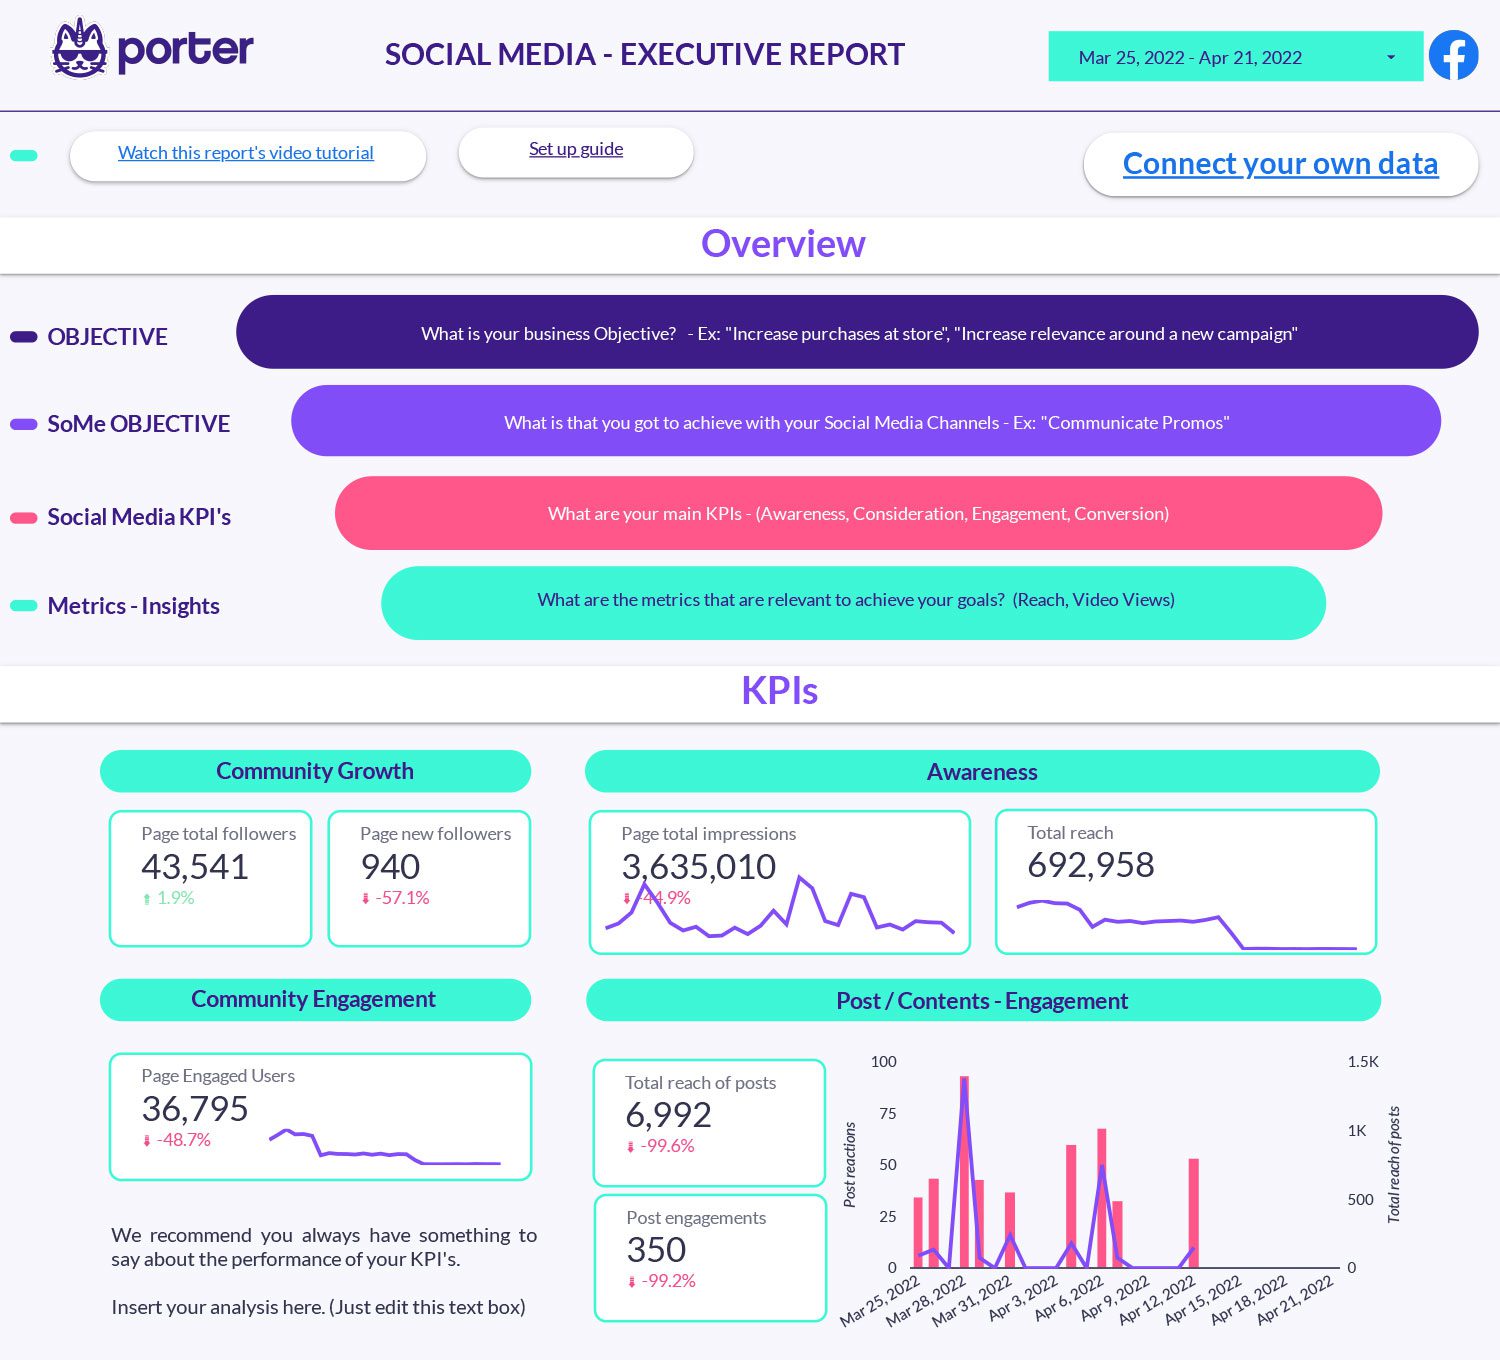
Are you measuring your Facebook Insights according to your business objectives? Track your Facebook Insights with the best visualization methodology. Keep your objectives in mind and get the best results.
Create personalized dashboards and reports for SEO, PPC, social media, and other purposes with this marketing agency reporting template.
Are you measuring your Facebook Insights according to your business objectives? Track your Facebook Insights with the best visualization methodology. Keep your objectives in mind and get the best results.
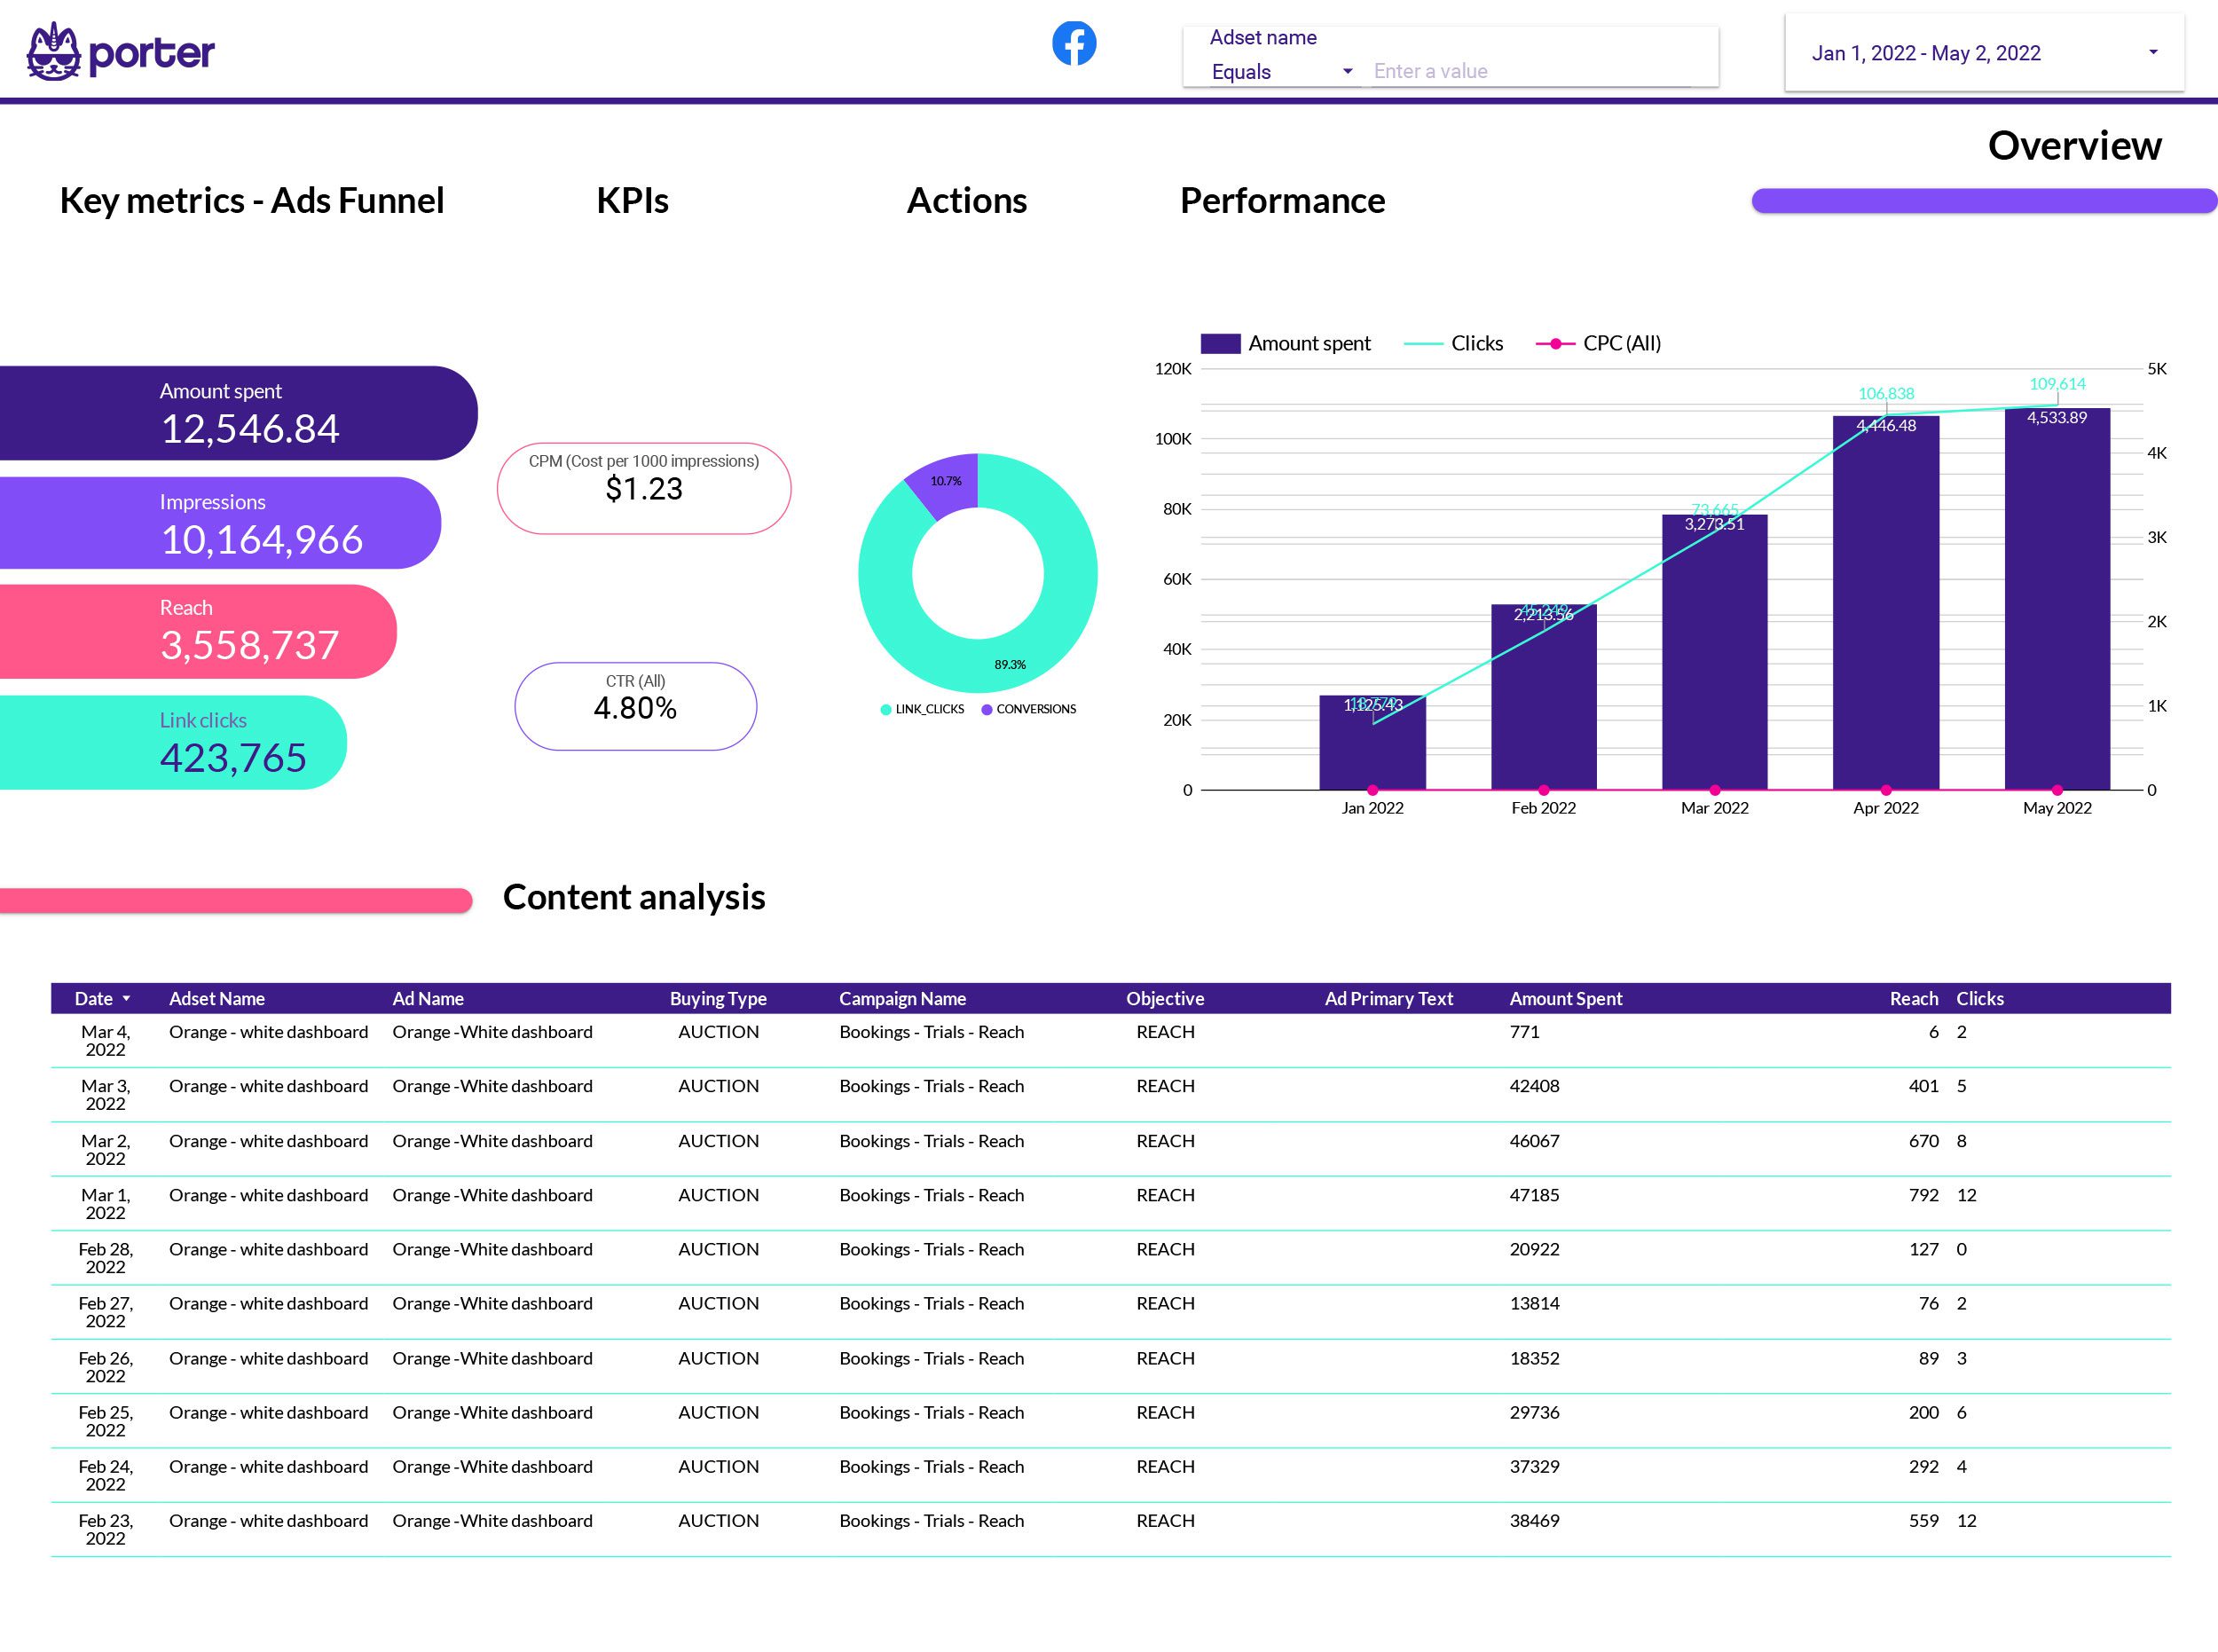
Facebook has various campaign objectives which allow you connect with the right audiences at different stages of the marketing funnel.
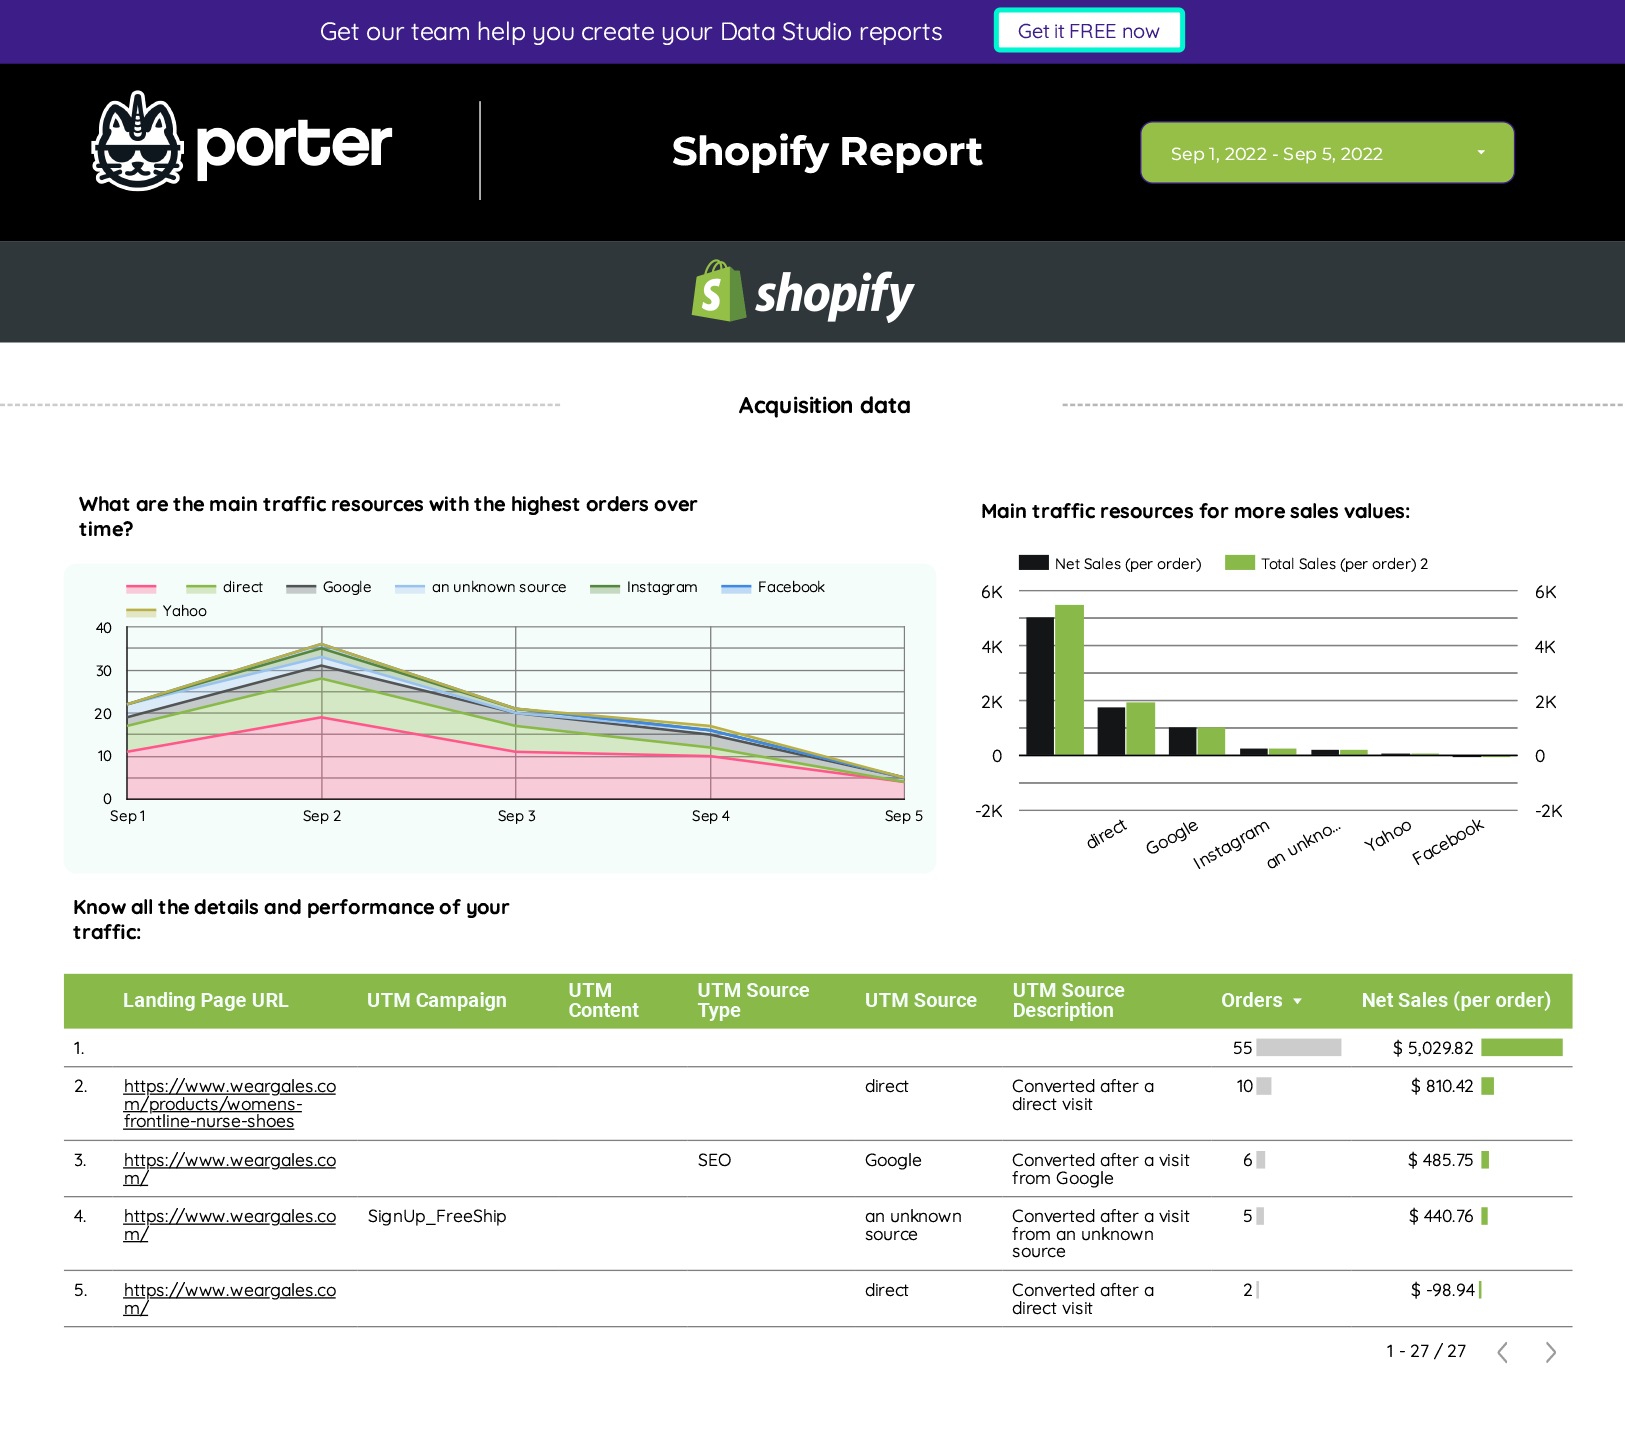
This is the initial report (the first template) of the Shopify connector, it allows for tracking the sales produced by the e-commerce, knowing which are the products with the highest number of sales, to know which are the sources of traffic to the website, and all the details of the orders.
Main metrics: sales, total orders, total orders per product, total sales, cost of sales, net sales, total completed sales, order status, etc.
With this Google Data Studio report, you will understand the profile of the users who are visiting and buying your website to find data-based buyer personas.
Are you measuring your Facebook Insights according to your business objectives? Track your Facebook Insights with the best visualization methodology. Keep your objectives in mind and get the best results.
Facebook has various campaign objectives which allow you connect with the right audiences at different stages of the marketing funnel.
Create personalized dashboards and reports for SEO, PPC, social media, and other purposes with this marketing agency reporting template.
Are you measuring your Facebook Insights according to your business objectives? Track your Facebook Insights with the best visualization methodology. Keep your objectives in mind and get the best results.
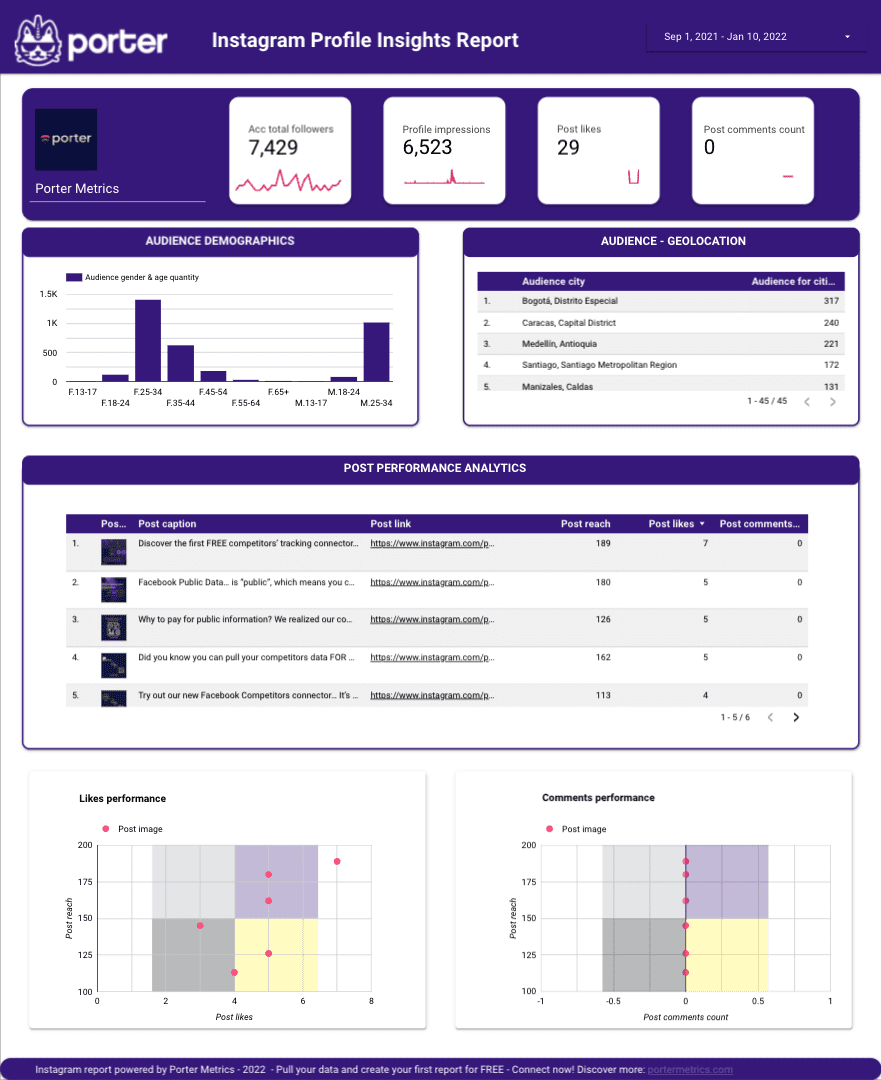
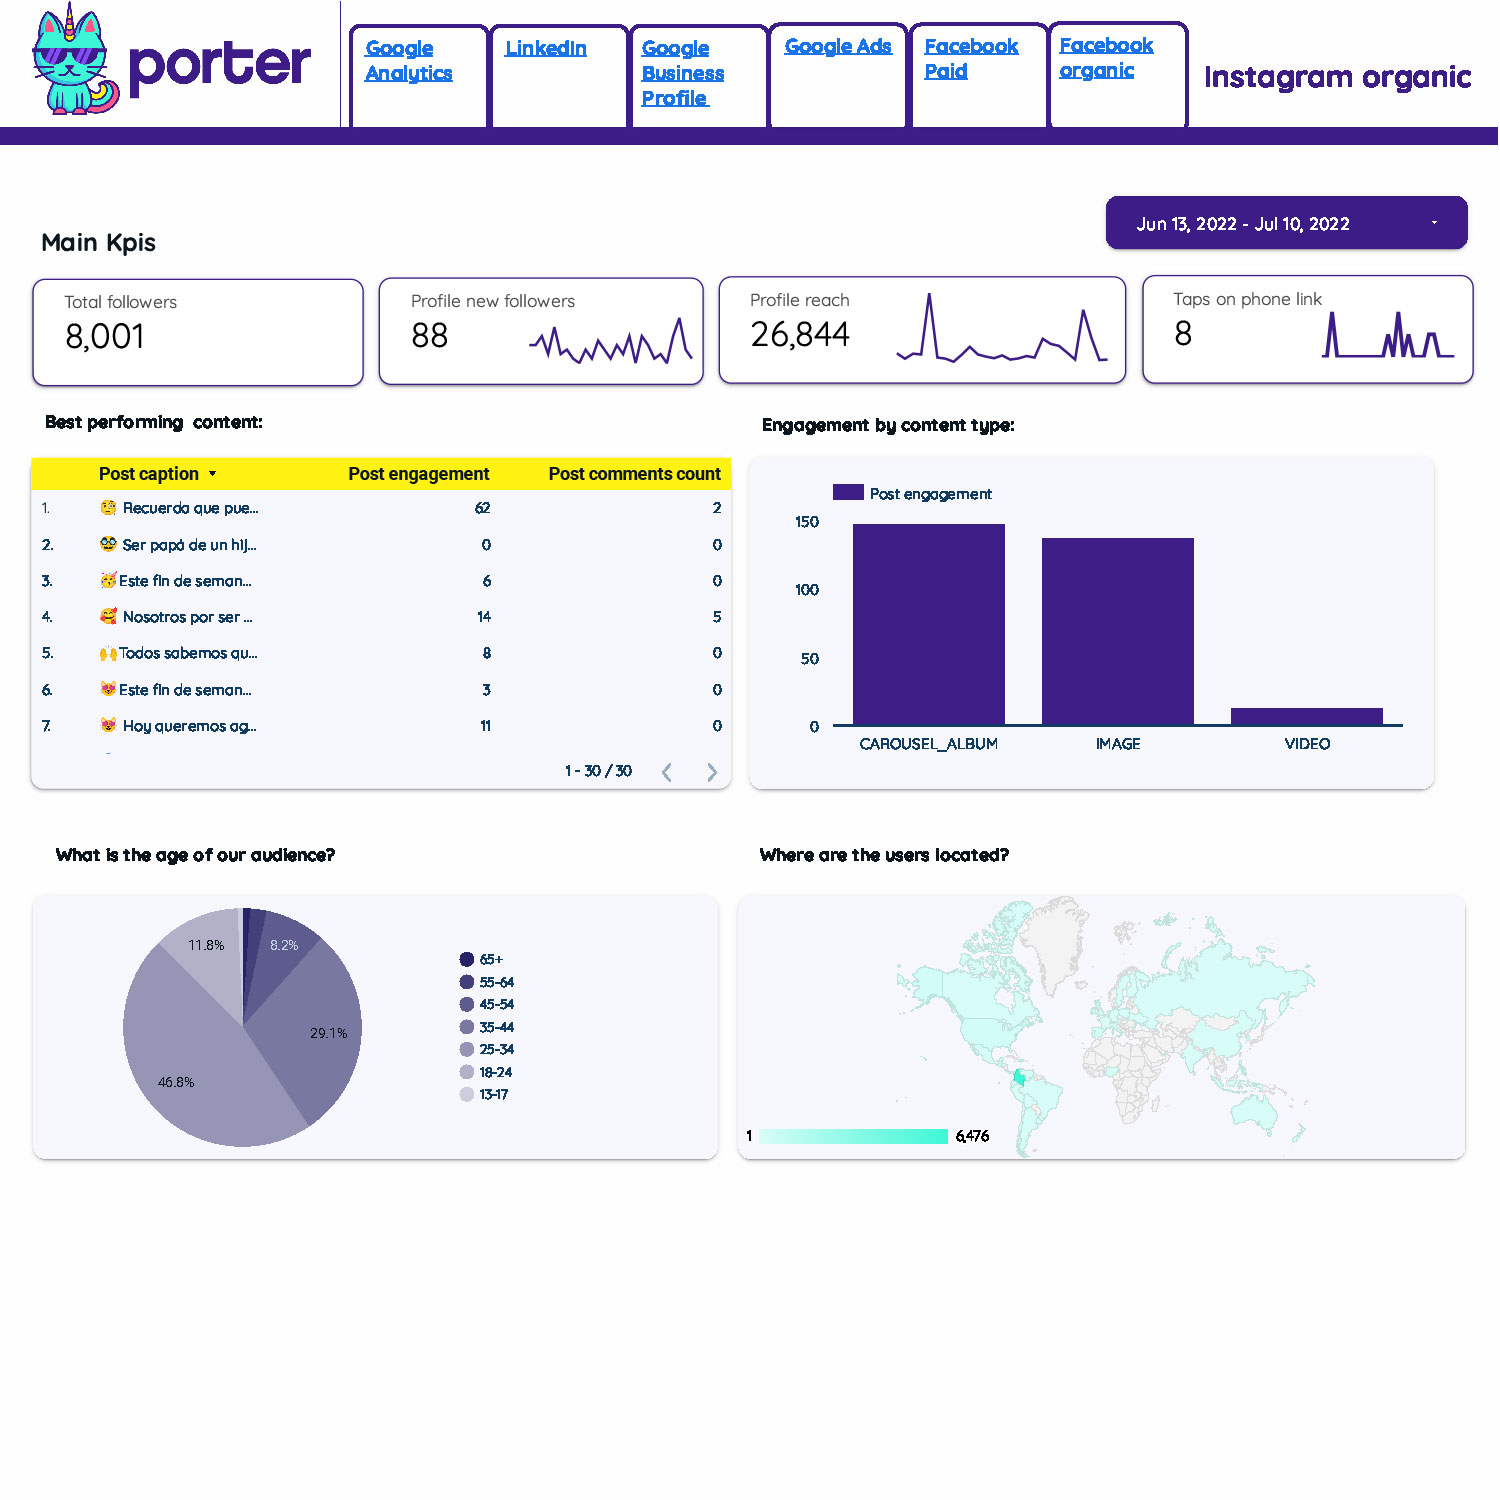
Download this free report template and pull your Instagram page insights. Deliver page impressions, followers, likes, profile trends, demographic, and post insights automatically with the power of Google Data Studio.
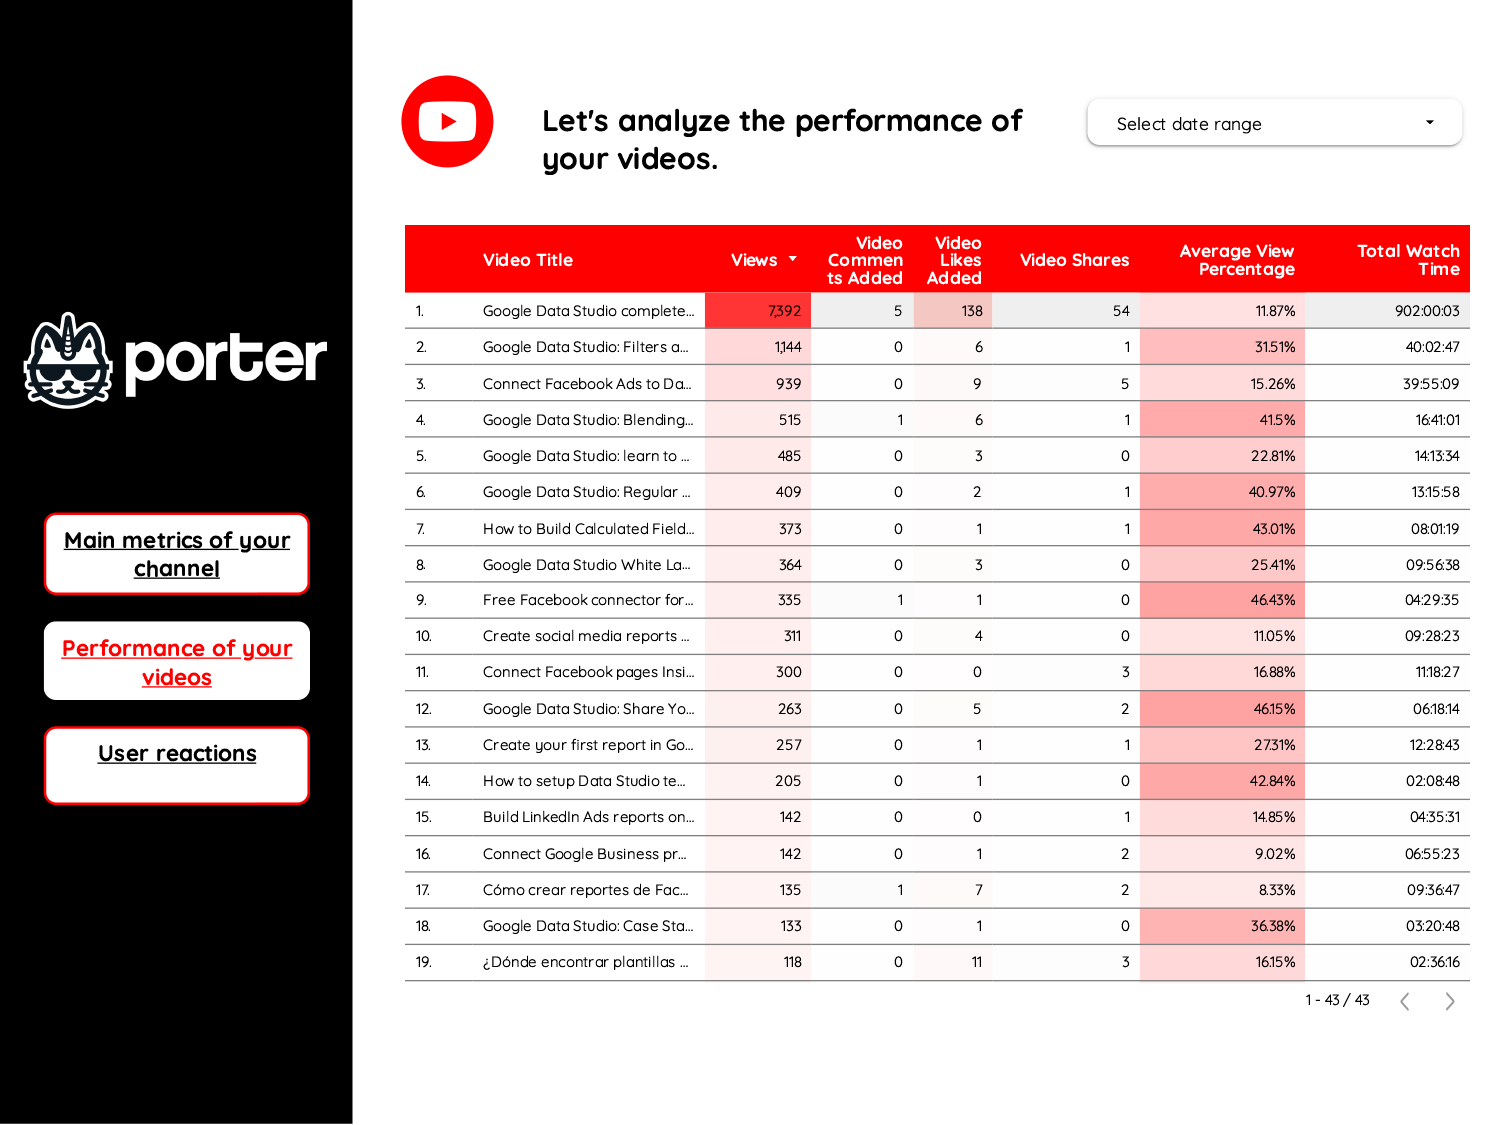
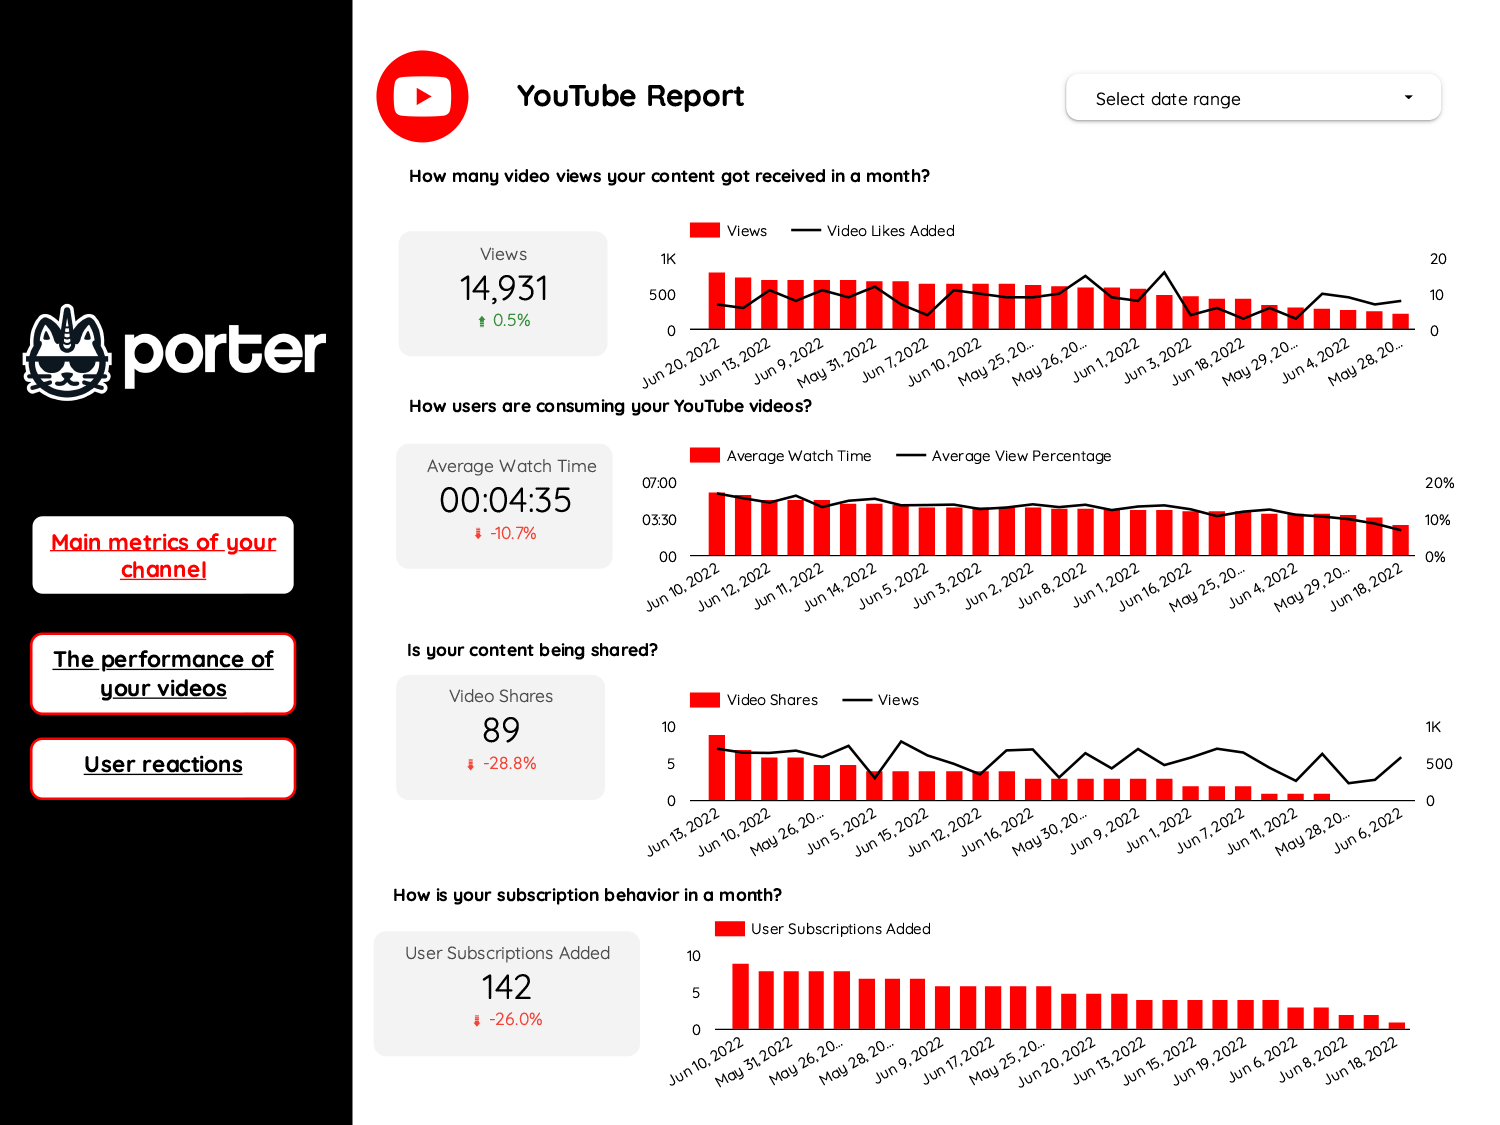
This YouTube Template will help you measure the impact and performance of your video content pieces and will allow you and your team to understand and analyze the following Video KPIs
Monitor your organic search rankings with this free Google Data Studio + Google Search Console template.
This is the initial report (the first template) of the Shopify connector, it allows for tracking the sales produced by the e-commerce, knowing which are the products with the highest number of sales, to know which are the sources of traffic to the website, and all the details of the orders.
Main metrics: sales, total orders, total orders per product, total sales, cost of sales, net sales, total completed sales, order status, etc.
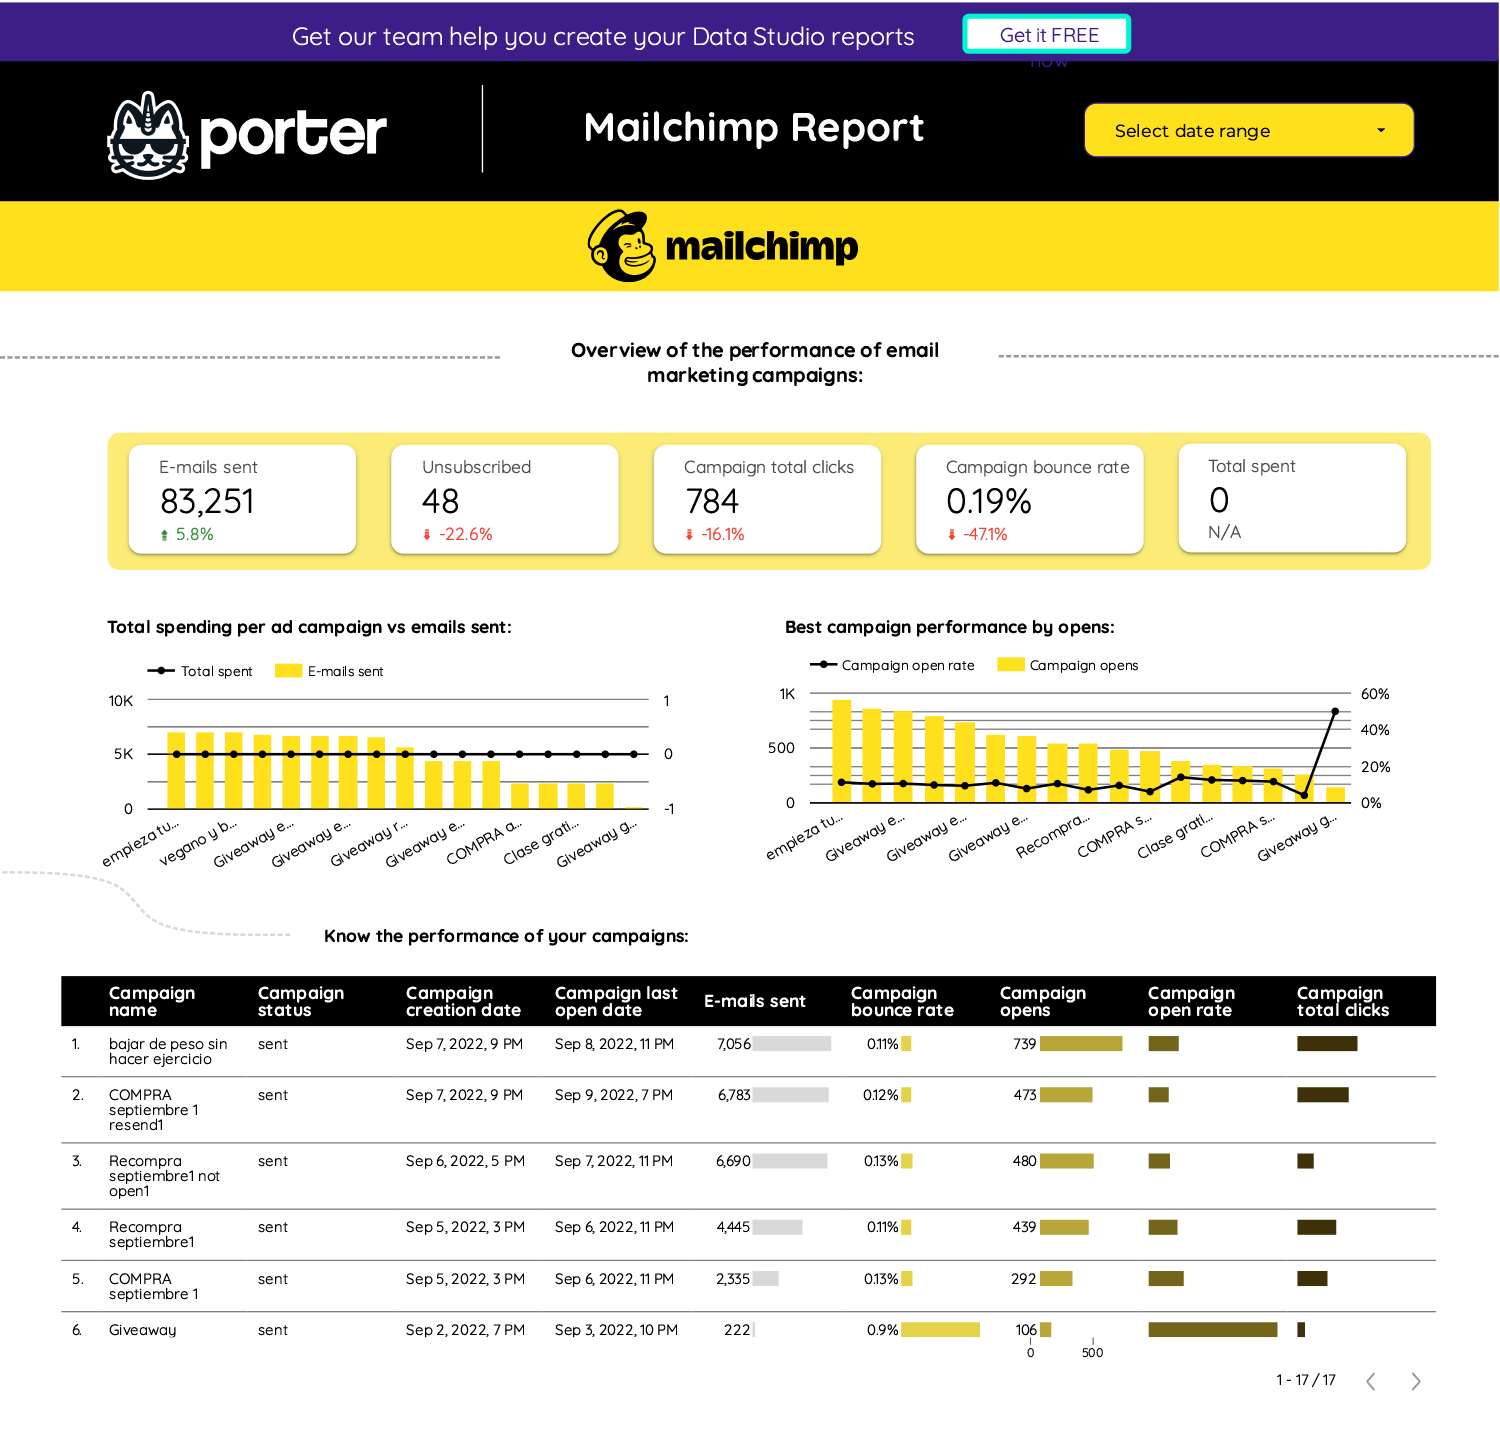
Main metrics: E-mails sent, unsubscribed, campaign total clicks, bounce rate, totally spent, campaign open rate, campaign opens, campaigns emails canceled, total clicks, total list members, list click rate, member open rate, main metrics testing A and B.
Main metrics: E-mails sent, unsubscribed, campaign total clicks, bounce rate, totally spent, campaign open rate, campaign opens, campaigns emails canceled, total clicks, total list members, list click rate, member open rate, main metrics testing A and B.
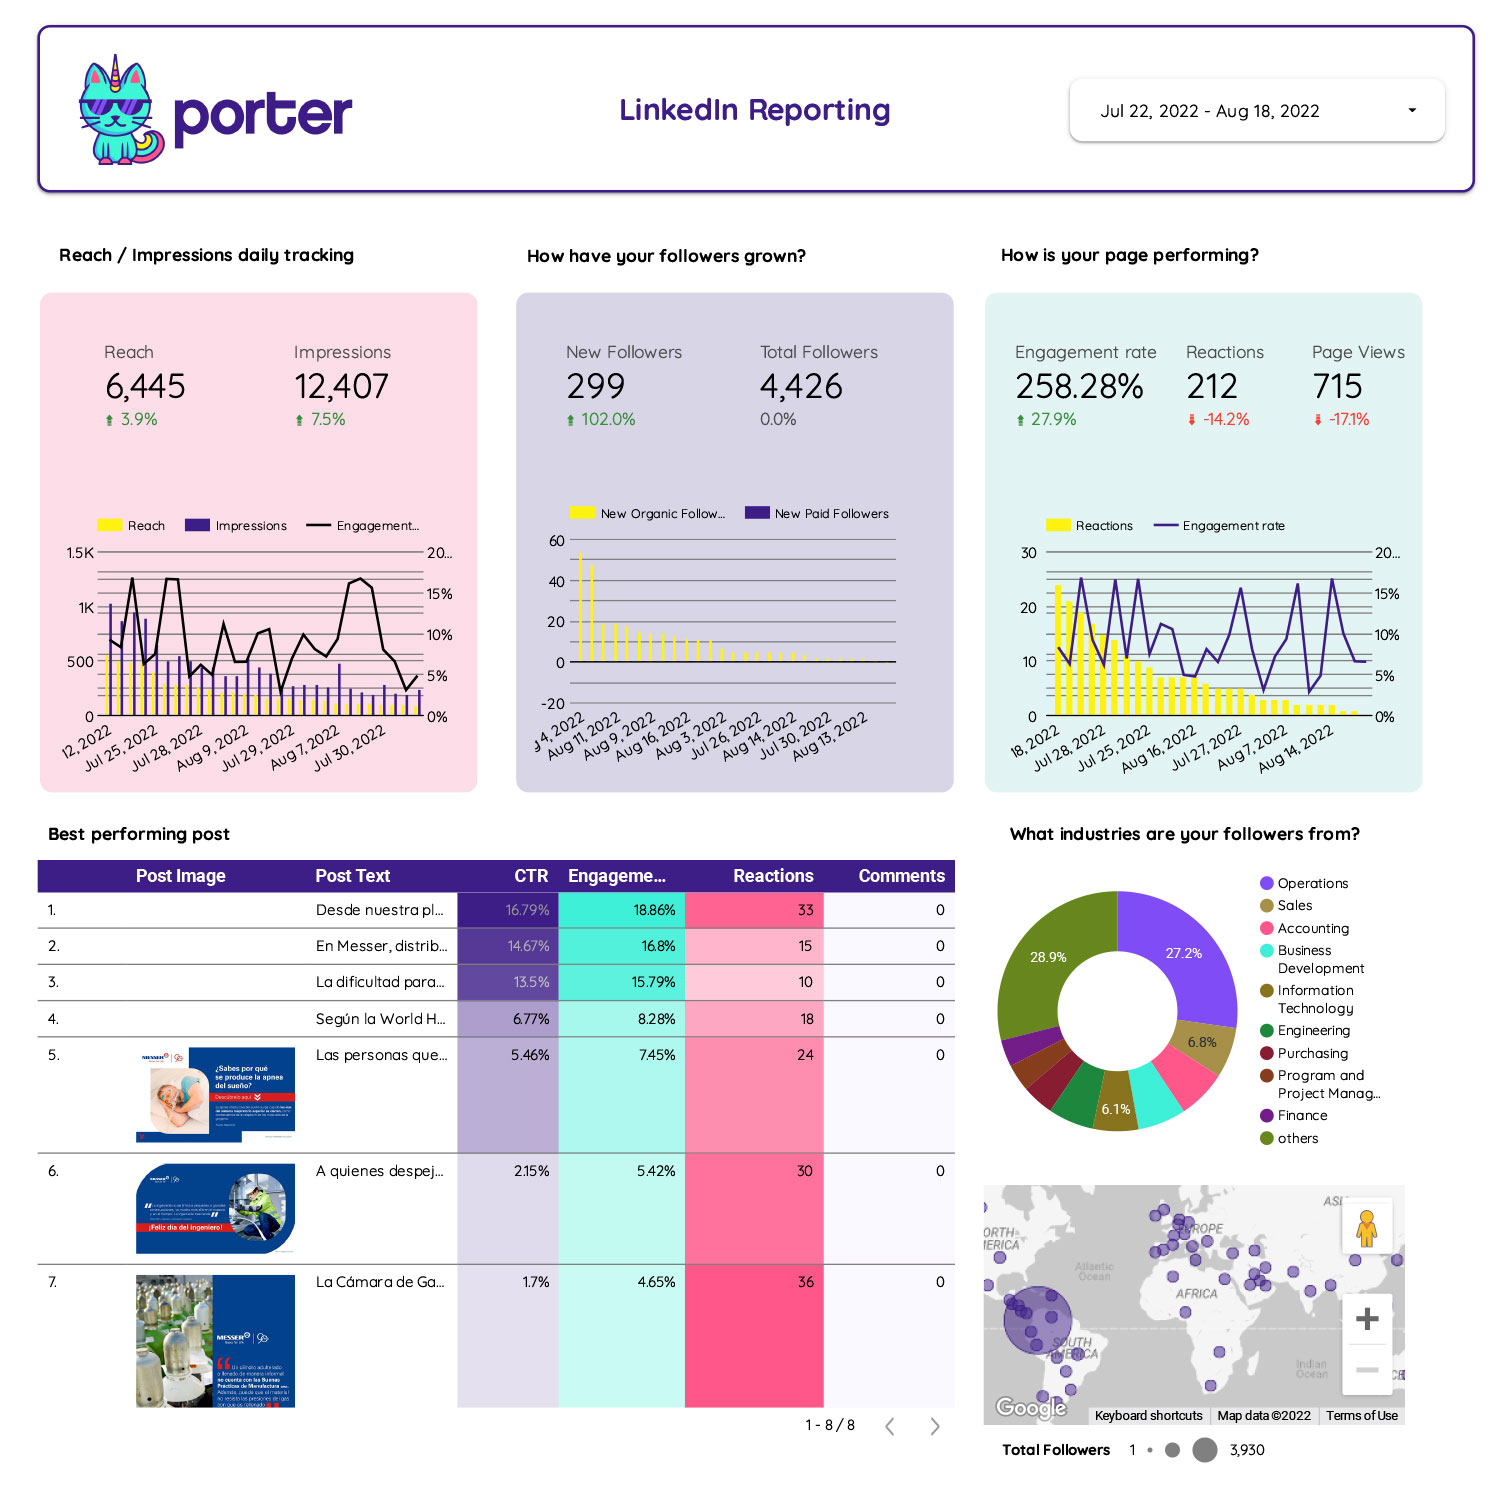
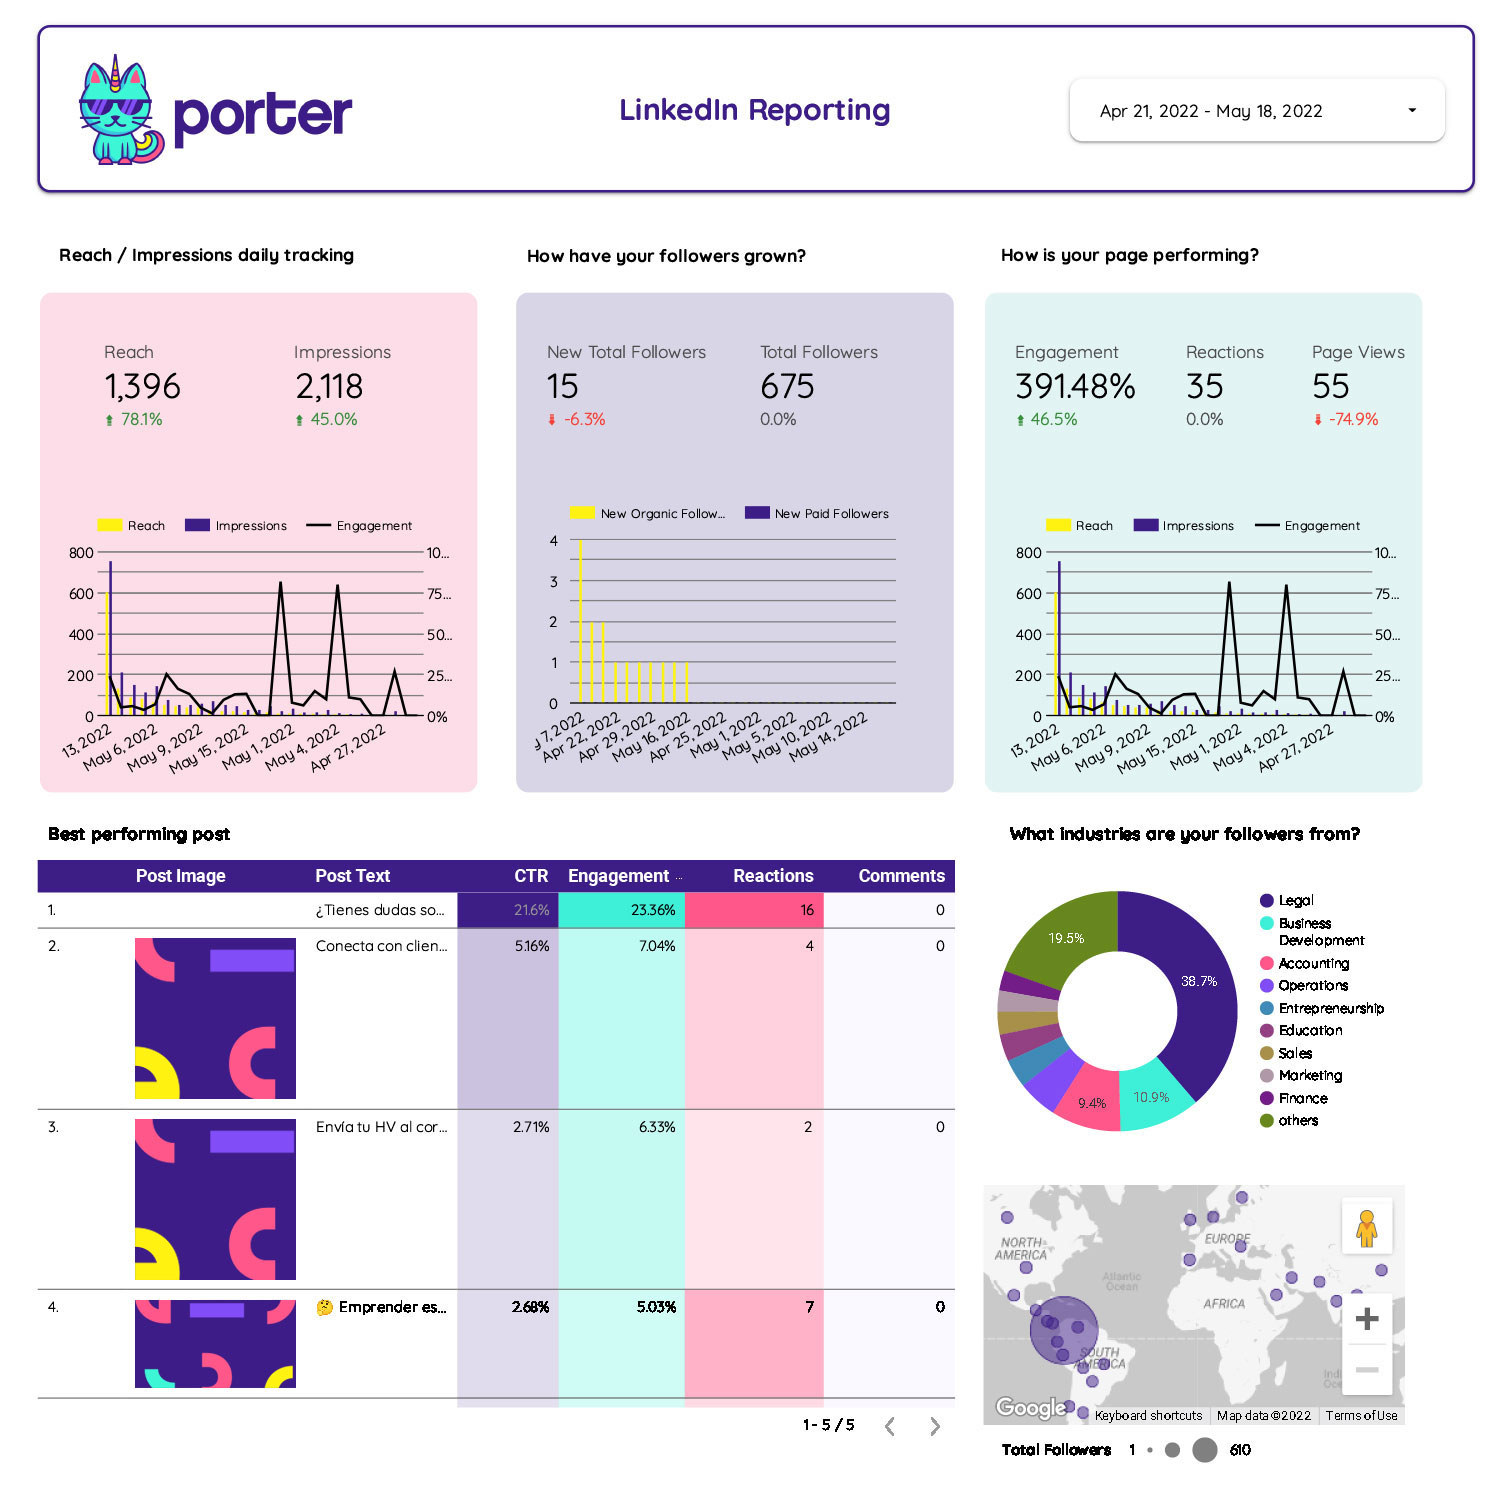
The LinkedIn reporting includes both organic data from LinkedIn Pages and Paid data from LinkedIn Ads.
This integrated dashboard pulls your data from different paid media platforms such as Facebook Ads, Google Ads, Tiktok Ads, and Twitter ads. Track your website traffic performance and start distributing your budgets more efficiently.
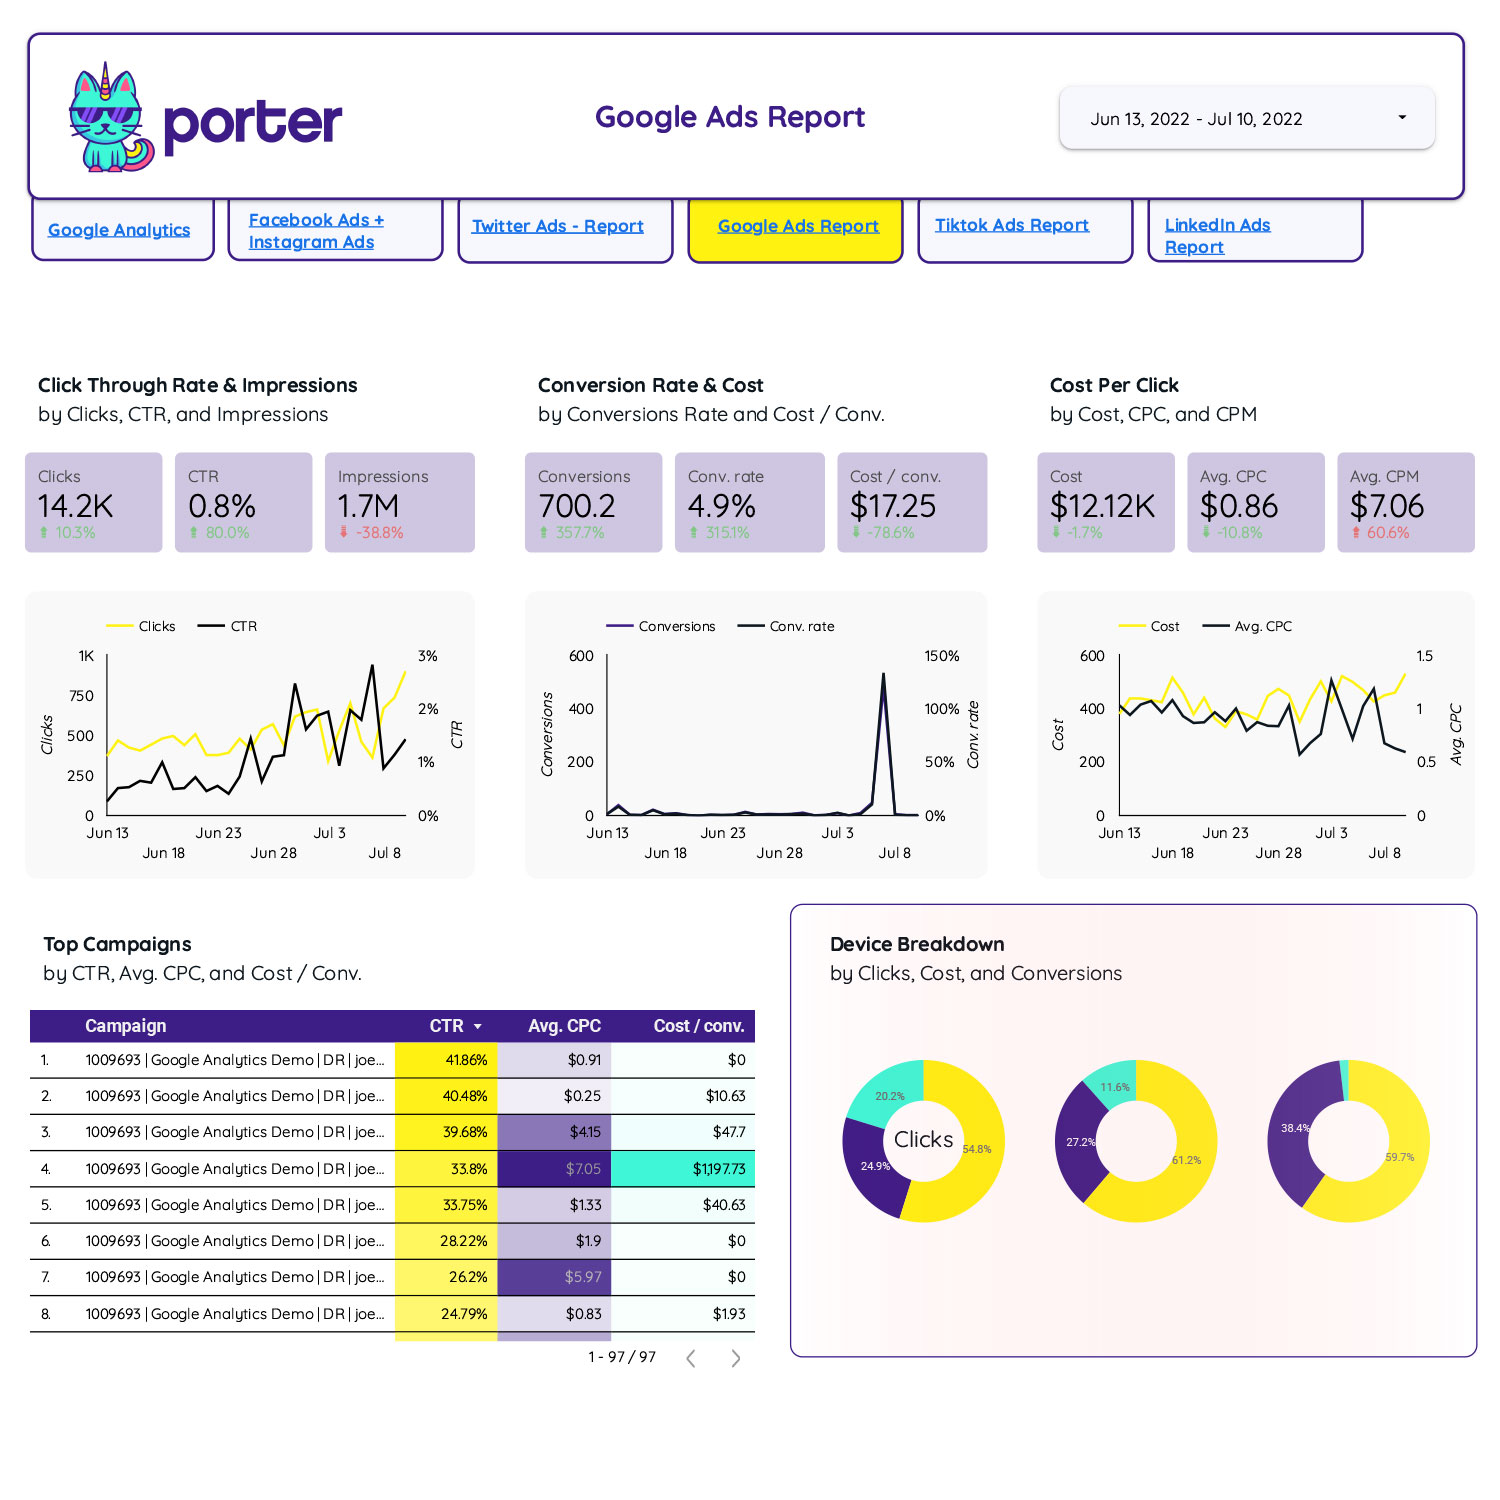
This integrated dashboard pulls your data from different paid media platforms such as Facebook Ads, Google Ads, Tiktok Ads, and Twitter ads. Track your website traffic performance and start distributing your PPC budgets more efficiently.
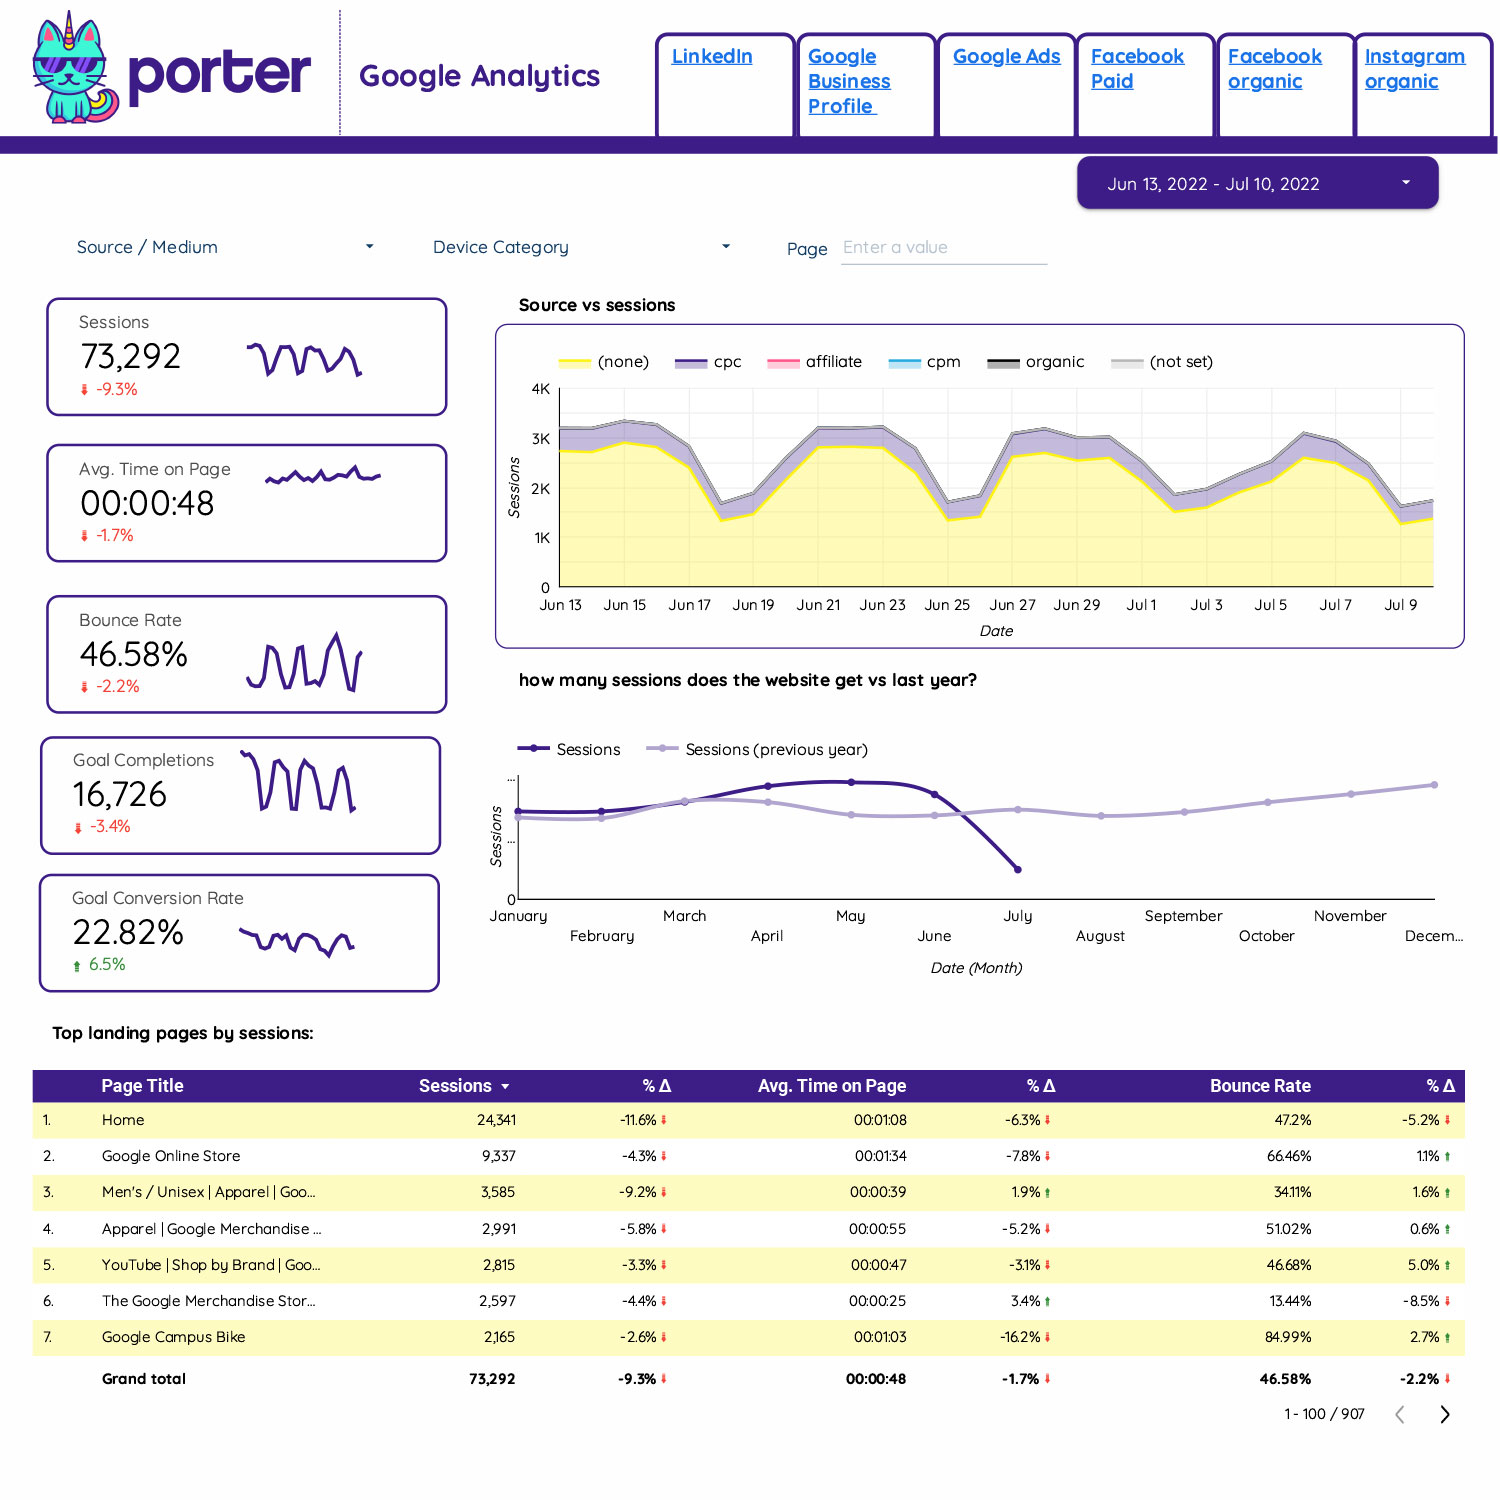
This Multi-platform report template automatically pulls data from Google Analytics, Google Ads, Google Business, FB Ads, and IG Insights. Deliver insightful client reports using our trusted Porter Metrics connectors.
This YouTube Template will help you measure the impact and performance of your video content pieces and will allow you and your team to understand and analyze the following Video KPIs
This YouTube Template will help you measure the impact and performance of your video content pieces and will allow you and your team to understand and analyze the following Video KPIs
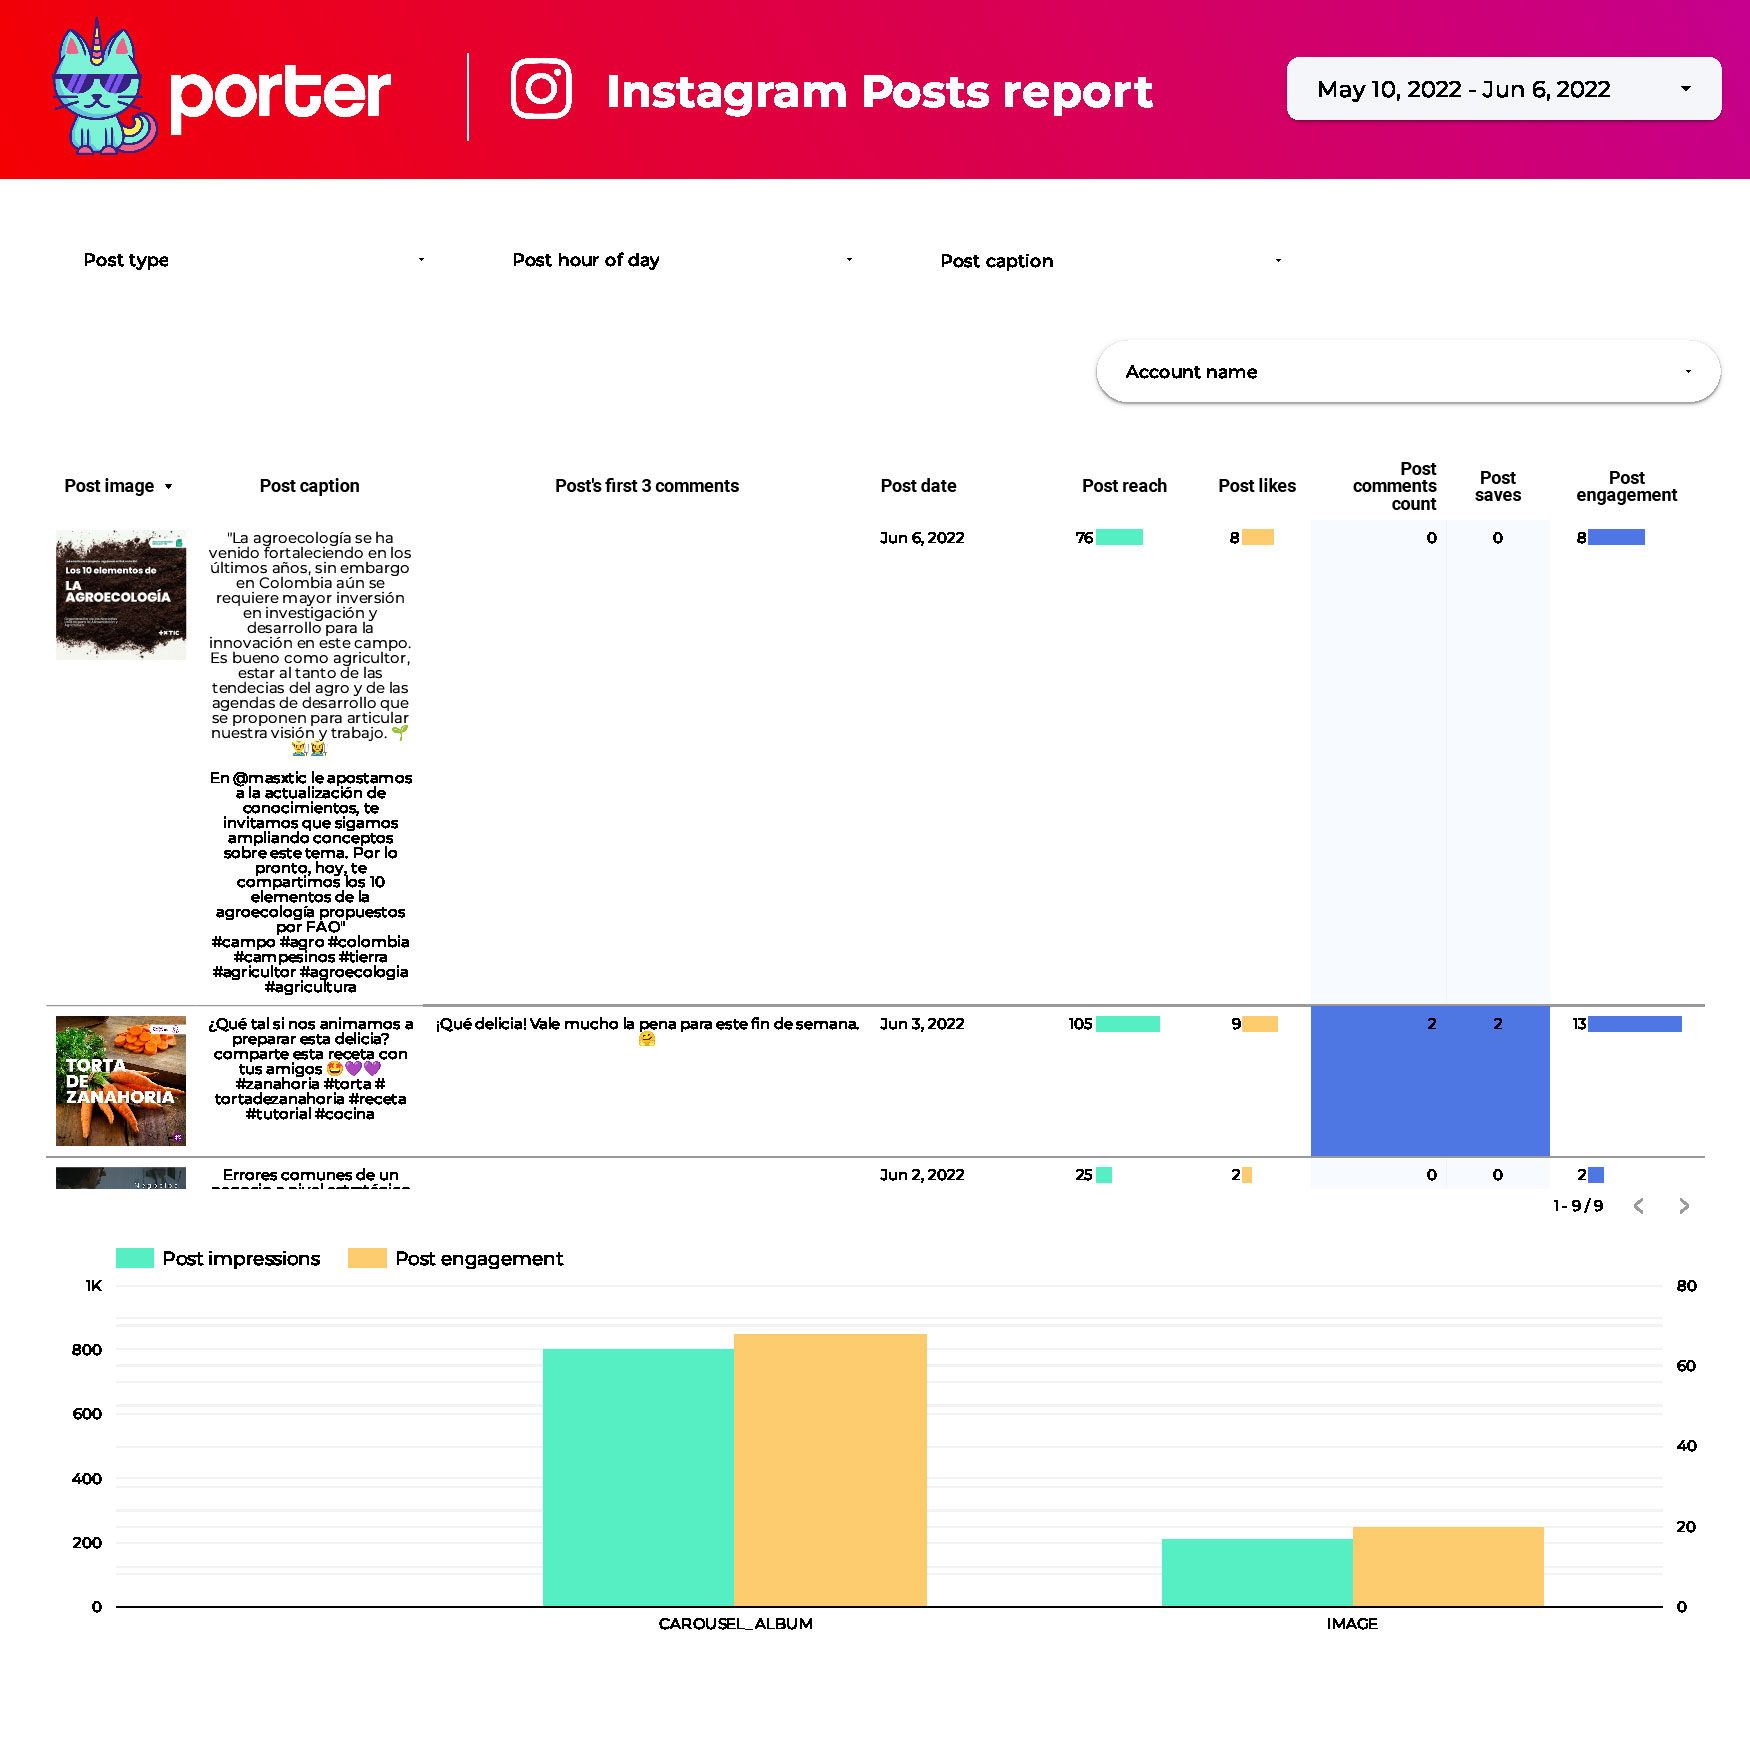
Put your logo on it and generate an Instagram report in seconds. Track your Profile growth, demographics, stories, and conversion data by connecting your Instagram profile.
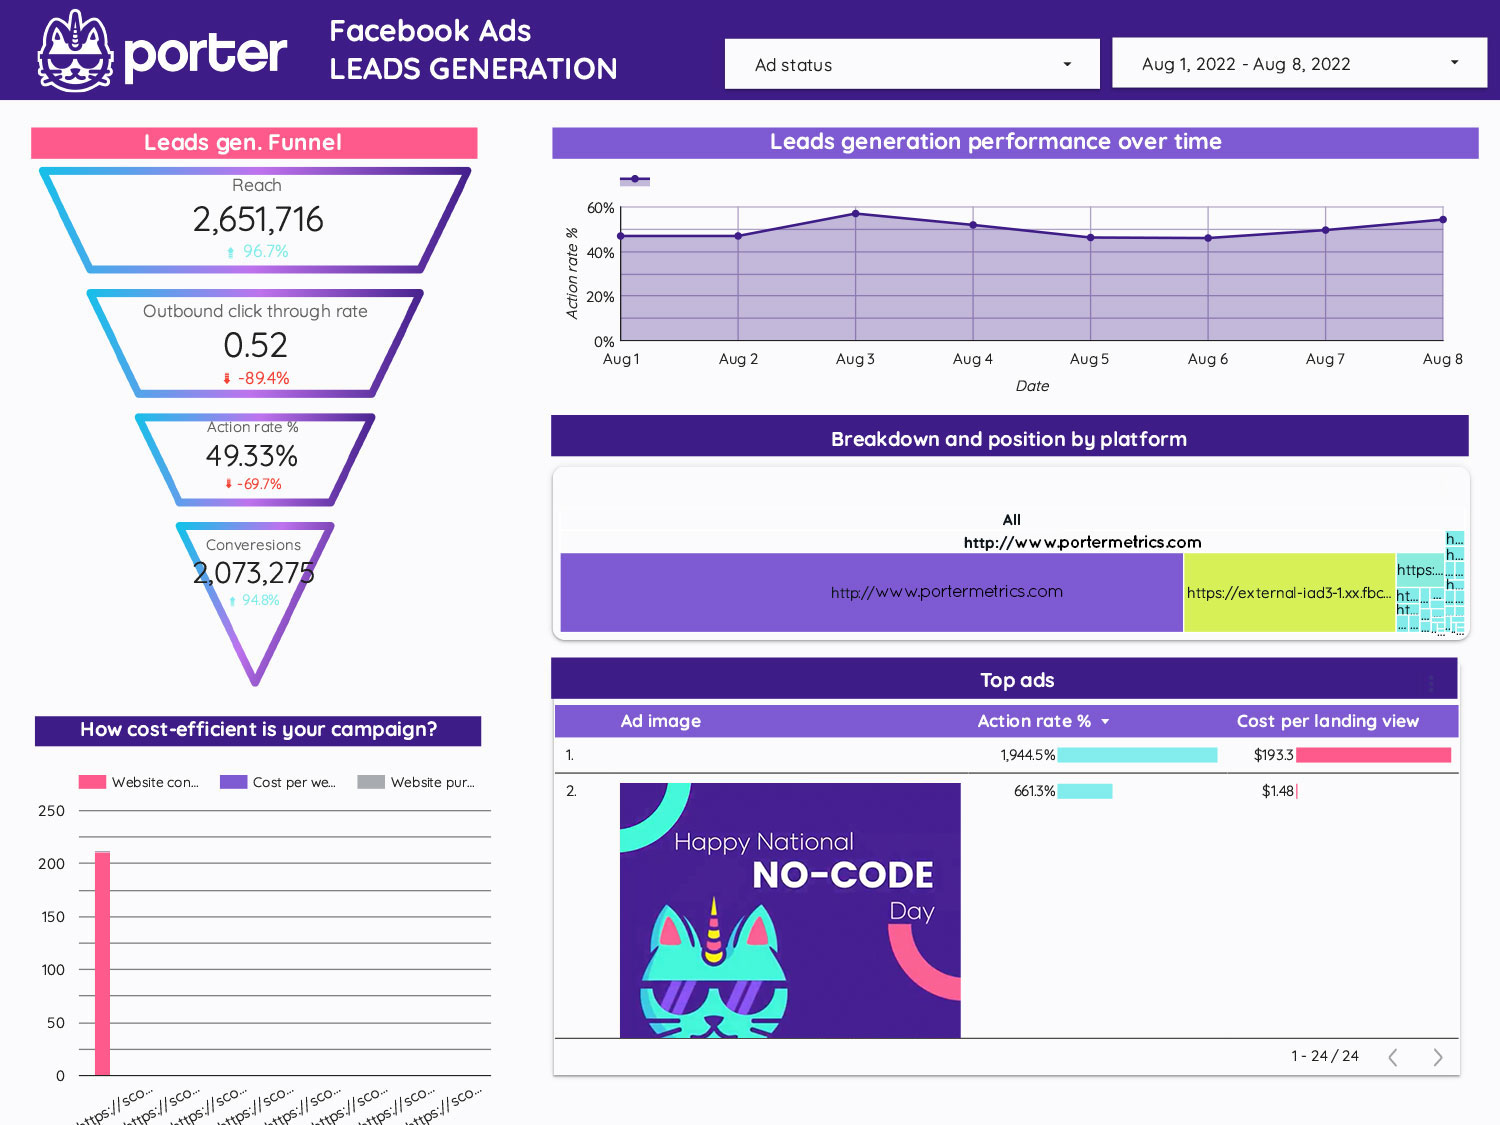
Explore everything you need to know about acquiring leads in your Facebook Ads campaigns. You will find an ad analysis that will help you identify which ads are most effective in getting conversions on your website.

With two simple steps generate automatically a full report of your Instagram profile. Read and understand the performance of your content and how your audience is growing. Track your stories and conversion metrics in a Google Data Studio dashboard.
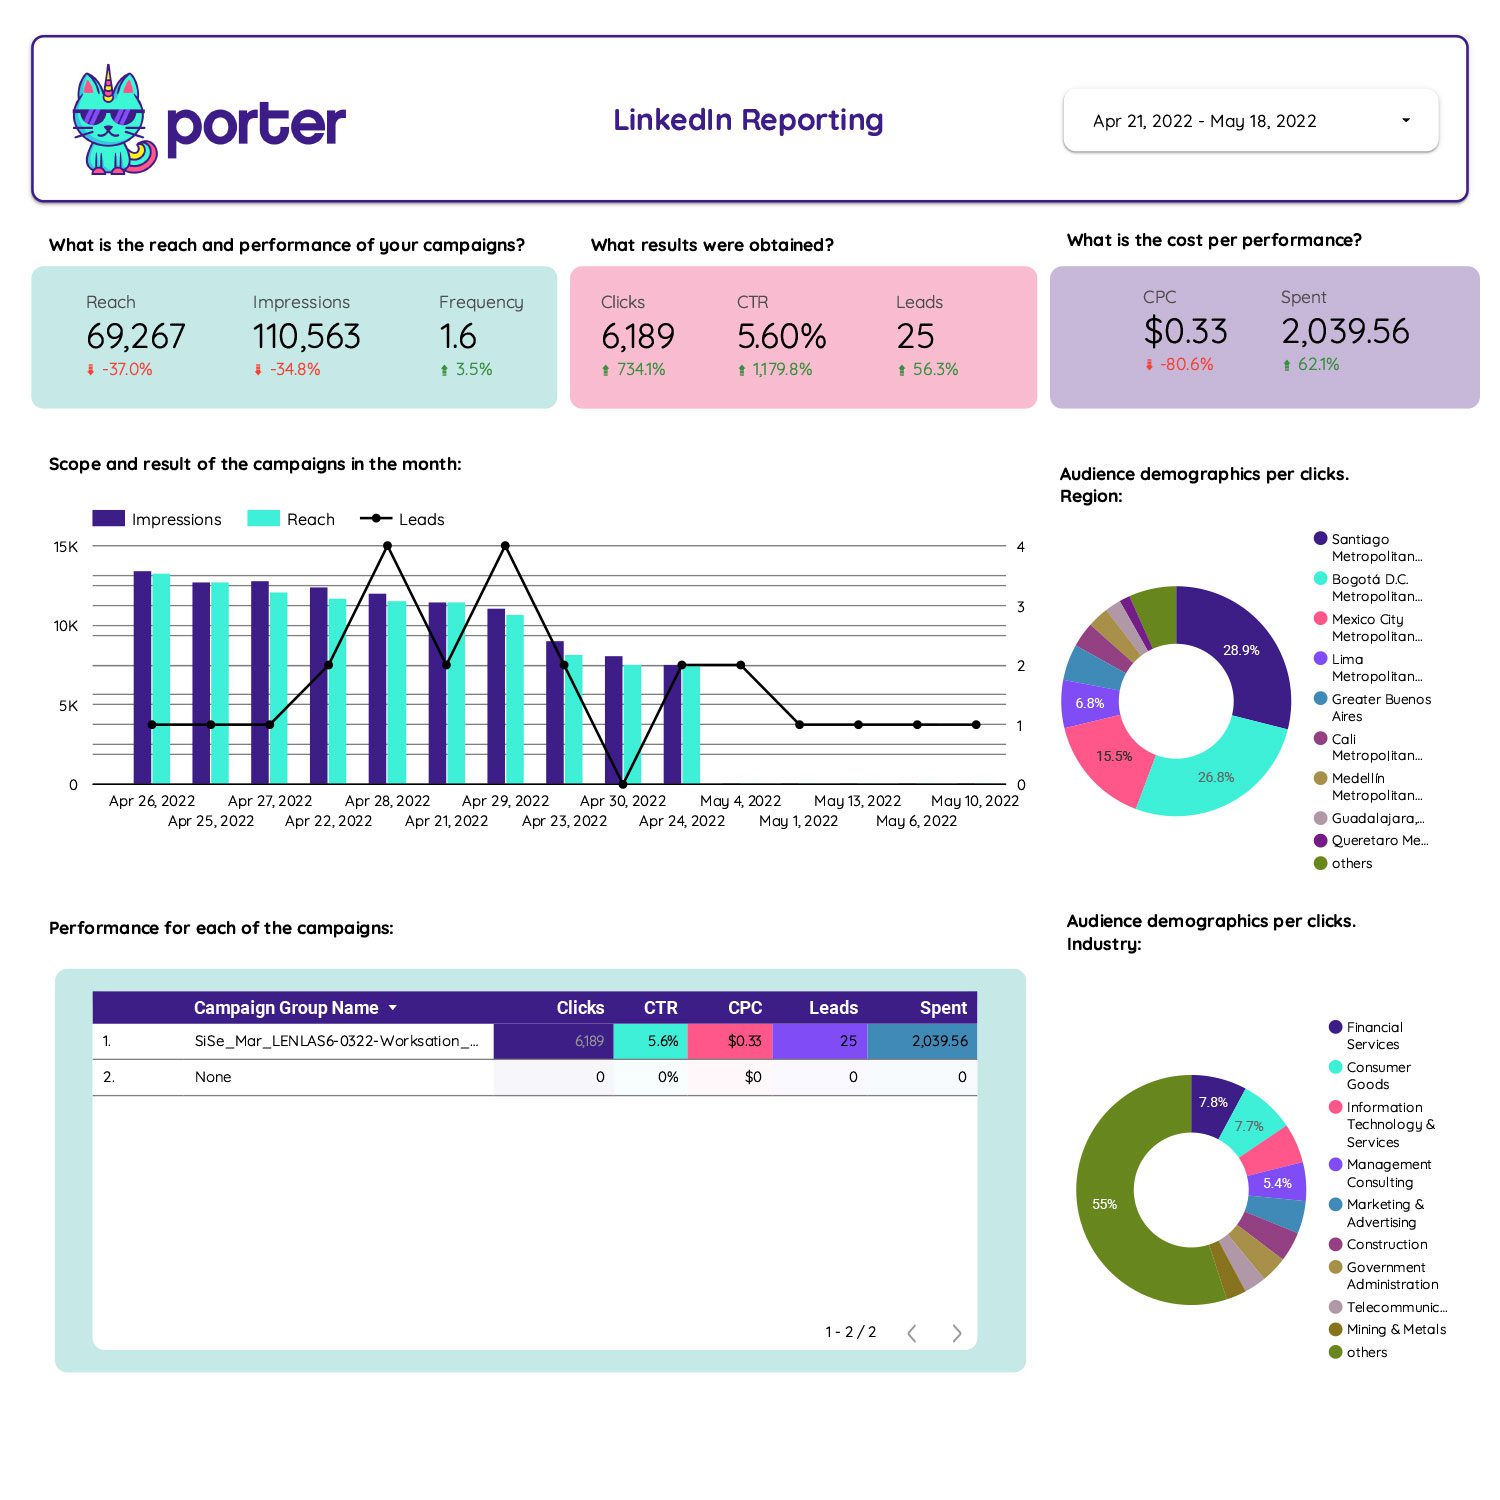
We created a free analytics report template to help you analyze and better understand your account. Simply connect your LinkedIn Pages and LinkedIn Ads account to Google Data Studio, and the template will do the rest!
We created a free analytics report template to help you analyze and better understand your account. Simply connect your LinkedIn Pages and LinkedIn Ads account to Google Data Studio, and the template will do the rest!