- Product
Edit Content
-
Paid Media
-
Google
-
CRM & Email
-
E-commerce
-
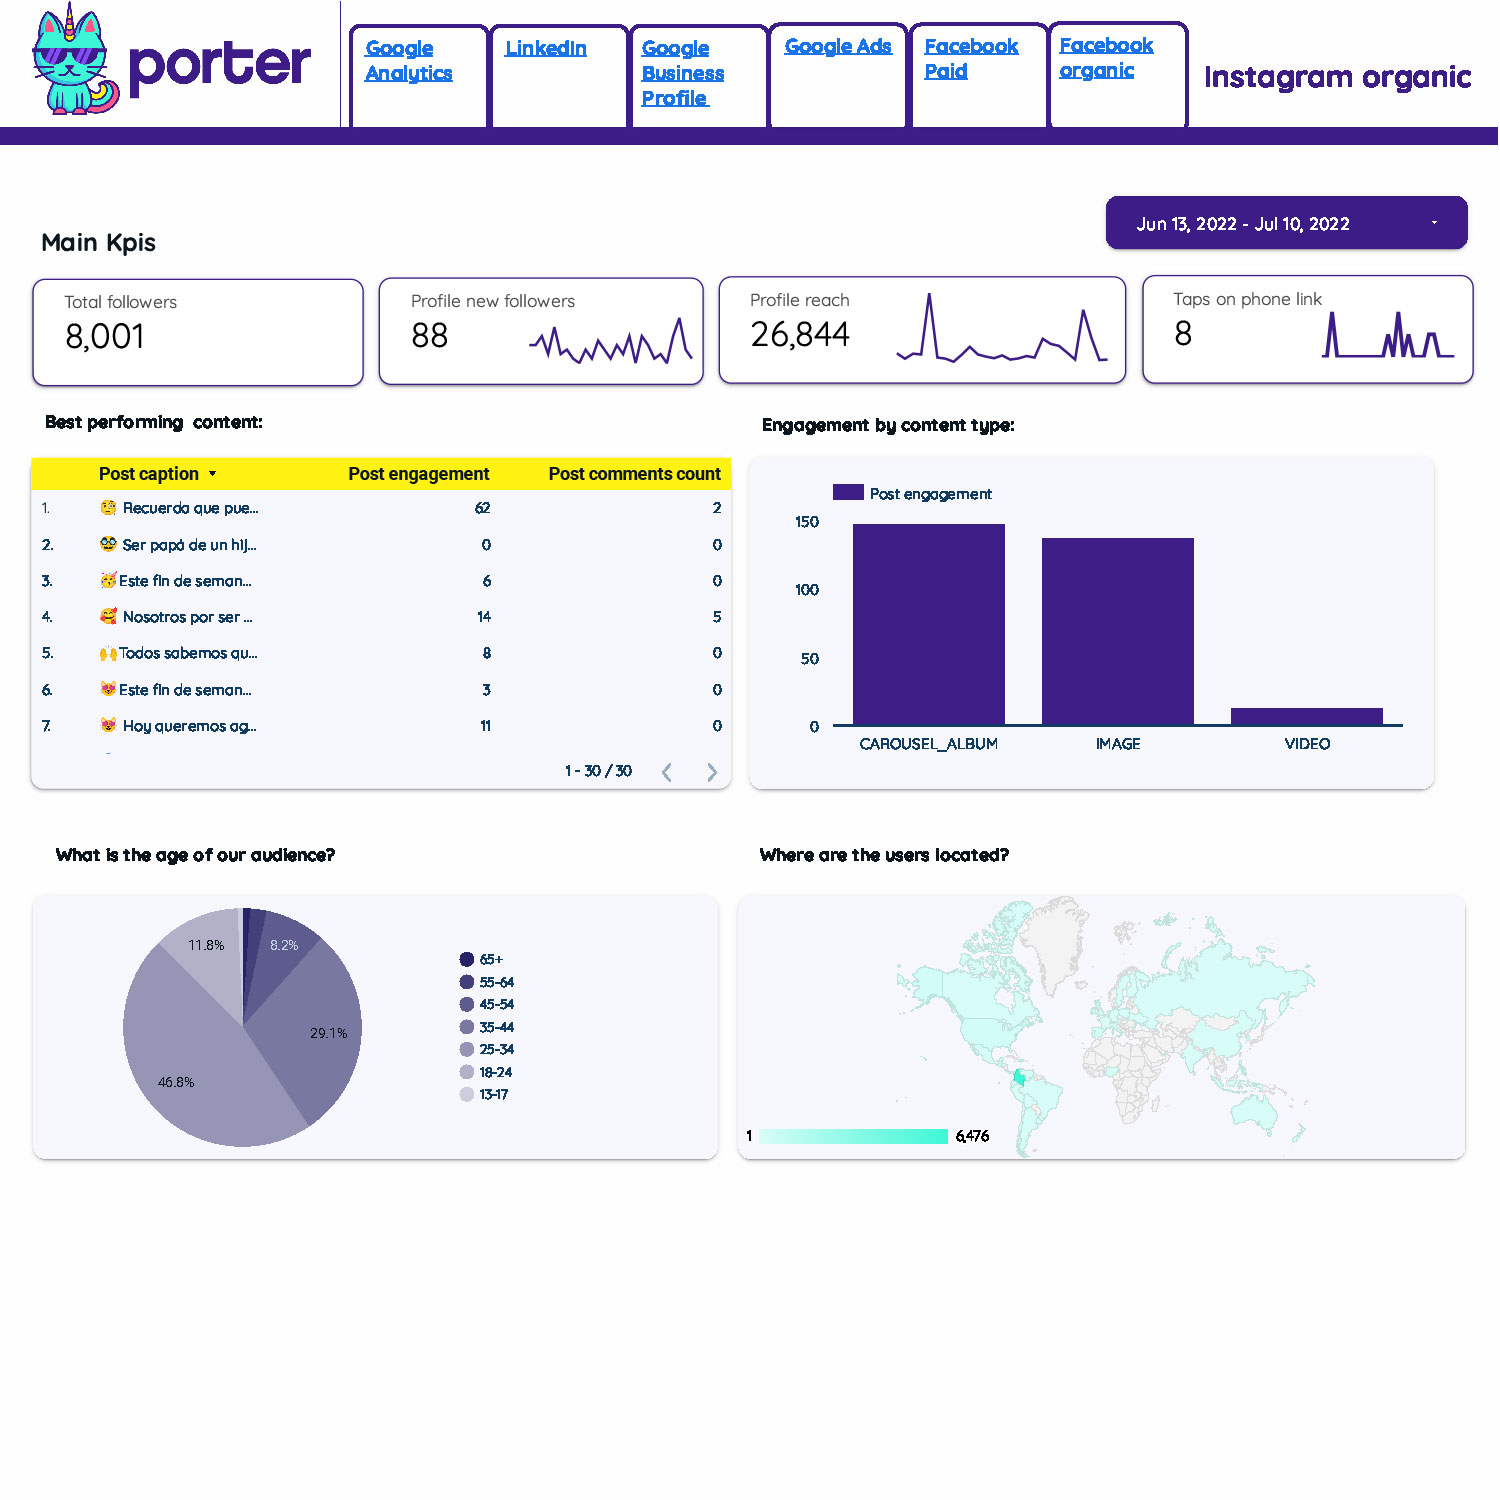
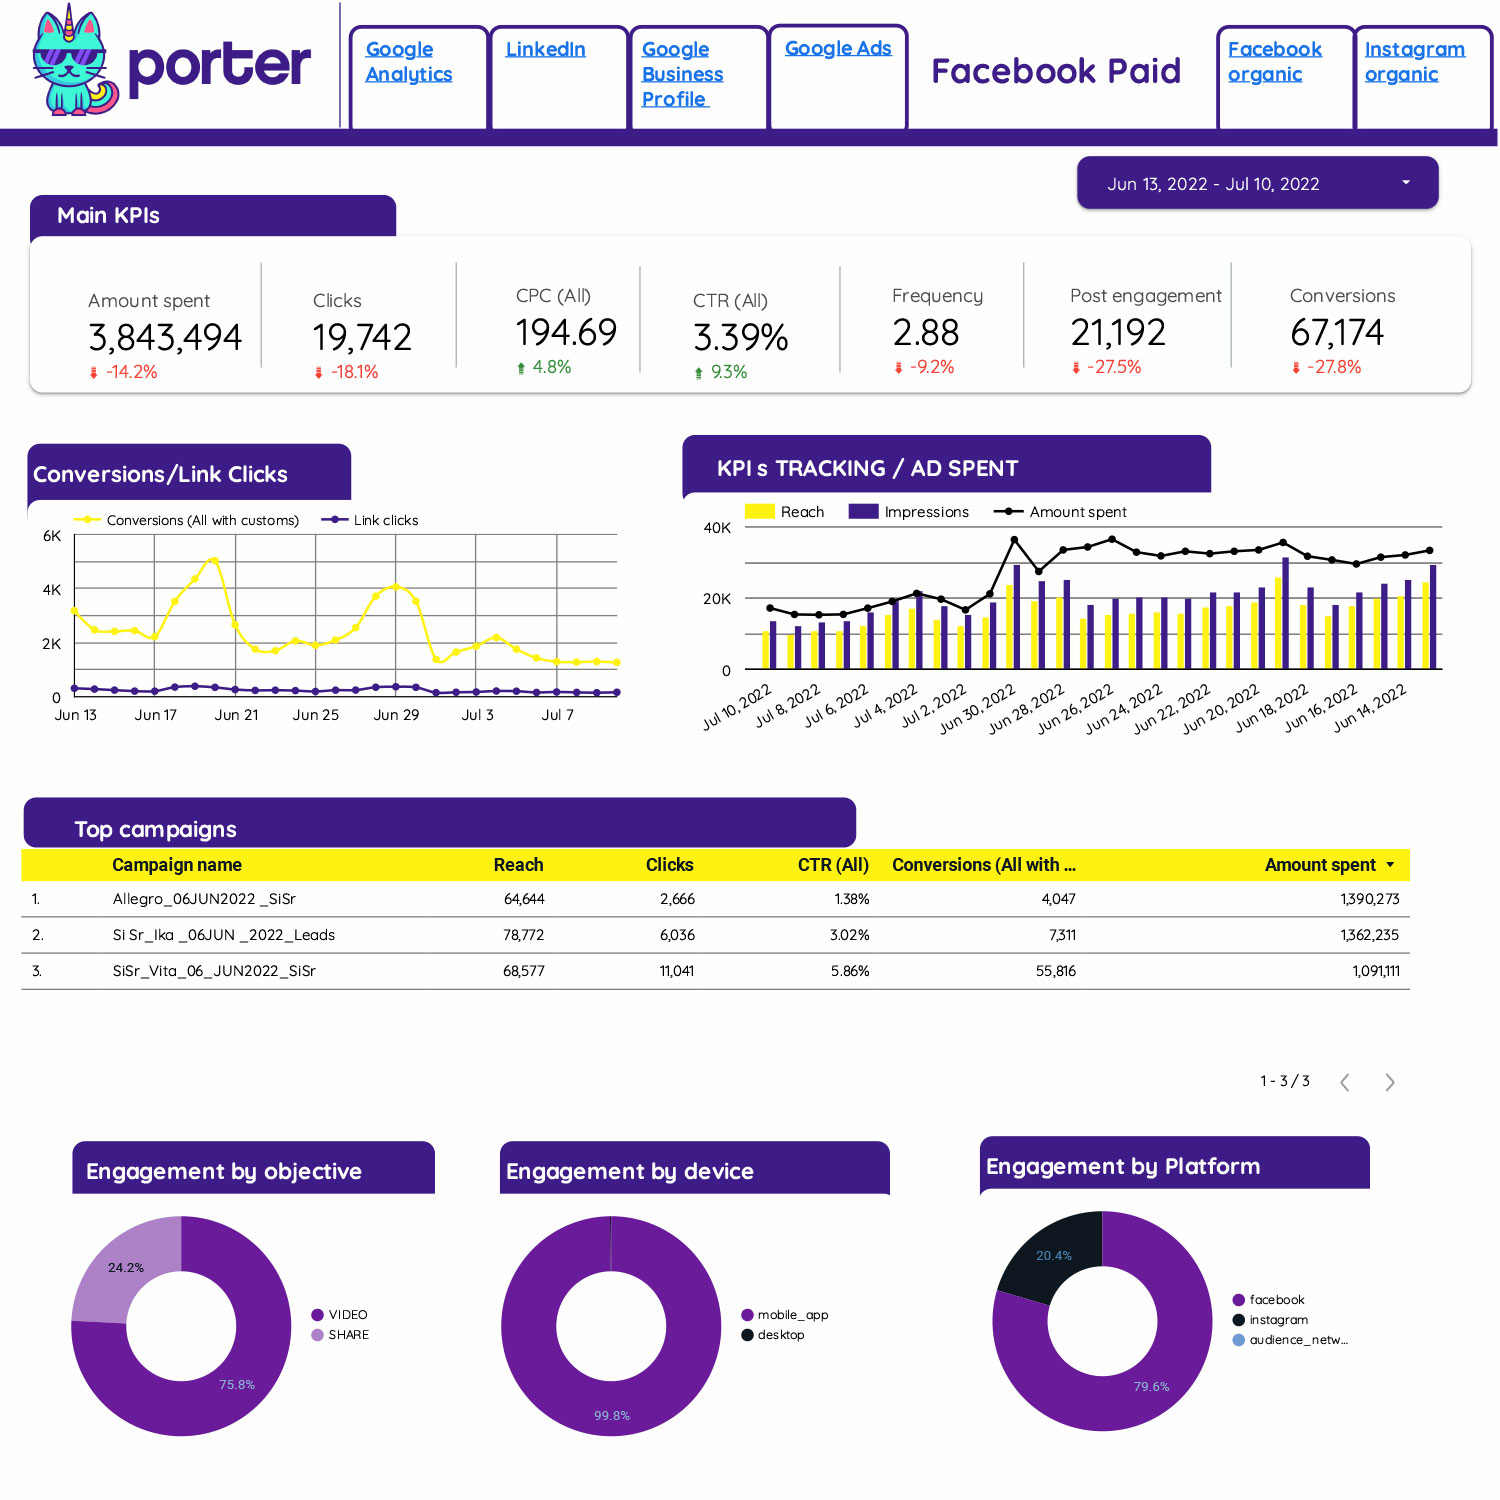
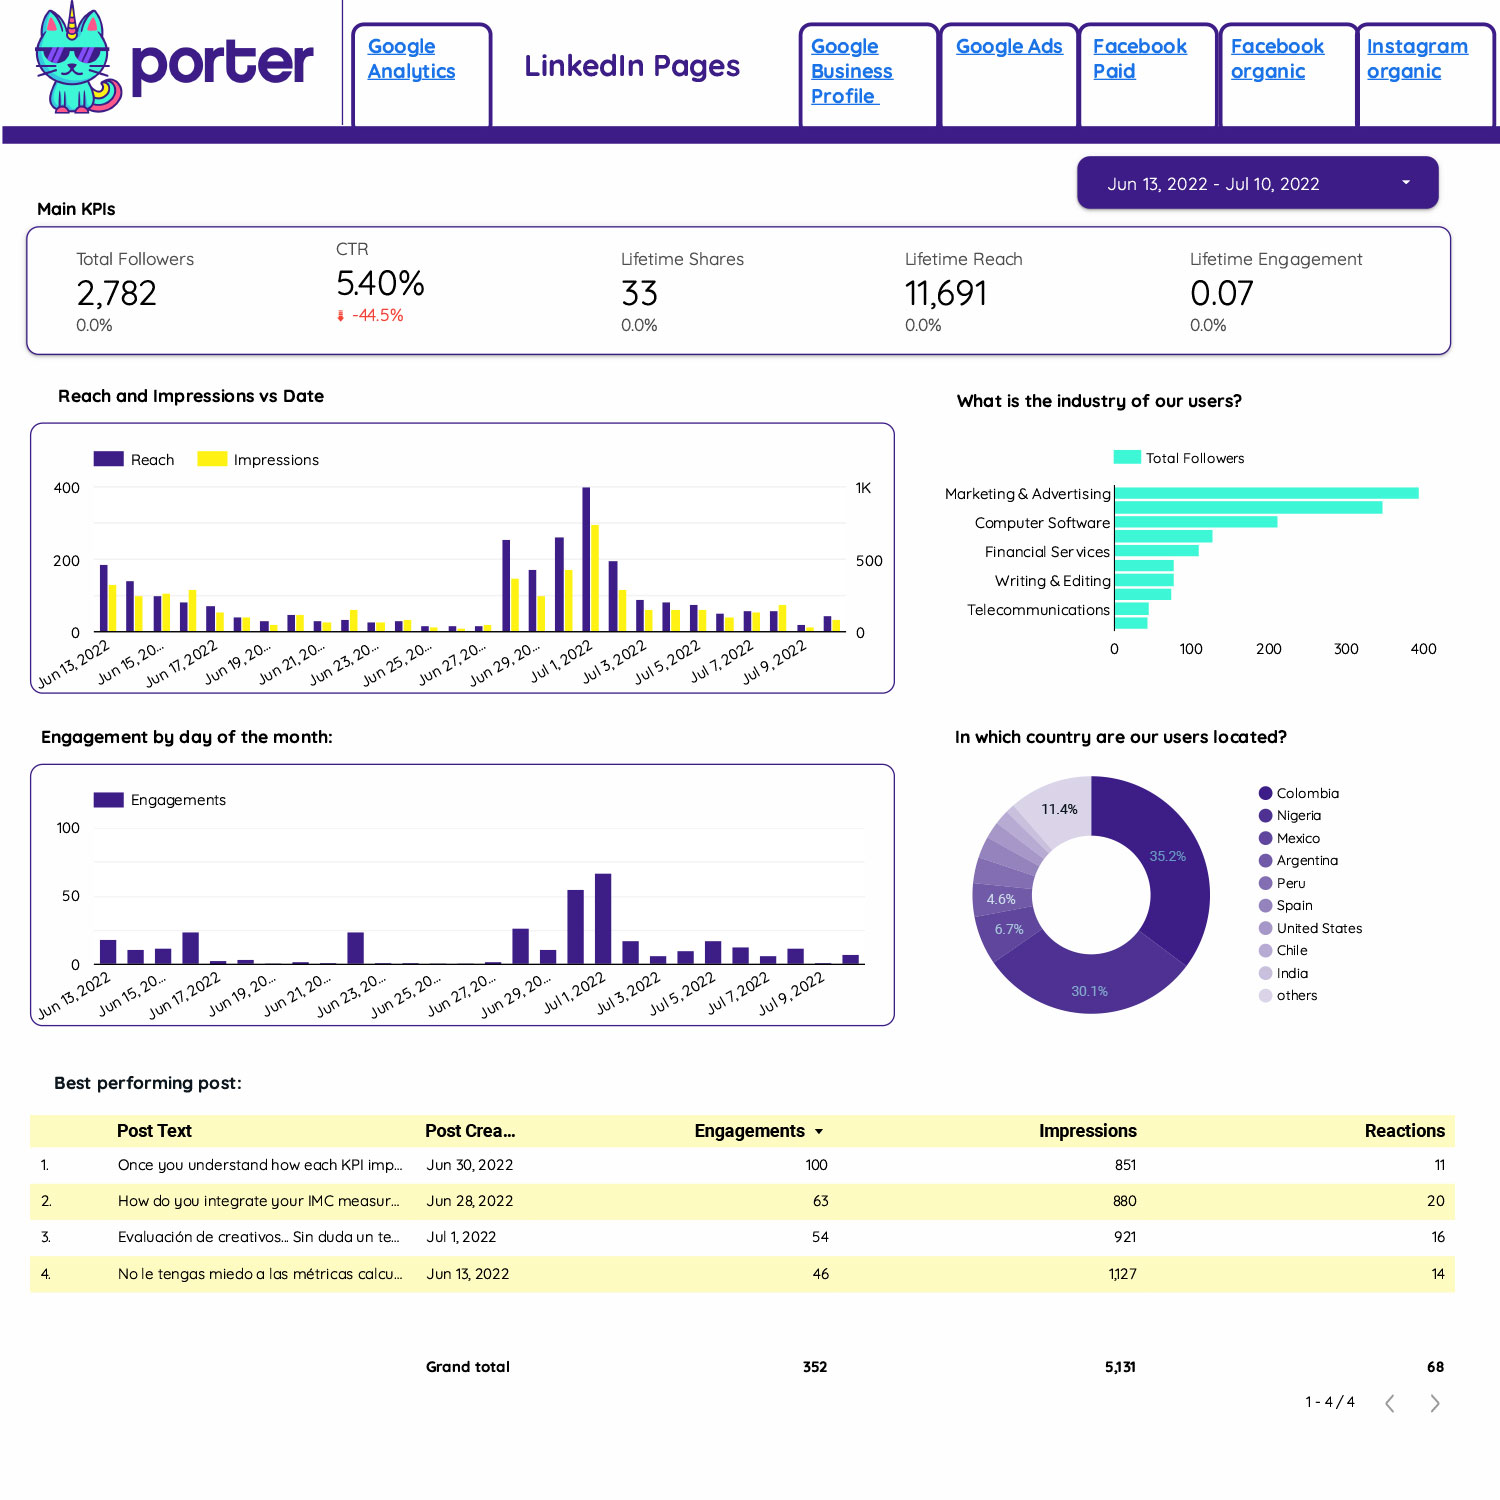
Social Media
-
Competitor Analysis
Edit Content-
Paid Media
-
Google
-
CRM & Email
Edit ContentLooker Studio
Connect +19 marketing data sources to visualize your marketing data!
Google Sheets
Export your marketing data to Google Sheets in seconds.
Edit Content-
Paid Media
-
Google
-
CRM & Email
-
E-commerce
-
Social Media
-
Competitor Analysis
-
- Company
Free report setup →
Get your free Looker Studio Report within 48 hours
Referral program →
Earn a 20% recurrent commission for every referral
Premium templates →
Get exclusive templates worth +$800 [customers only]
Product roadmap →
See what we're building. Upvote integrations
- Pricing
- Templates
See all templates →
Check all the templates and choose one based on your use case
Multichannel templates →
Copy a template that combines multiple data sources
- Learn
Edit ContentEdit Content
-
Paid Media
-
Google
-
CRM & Email
Edit ContentPaid media
Google
Social media
E-comm & CRM
Edit Content -