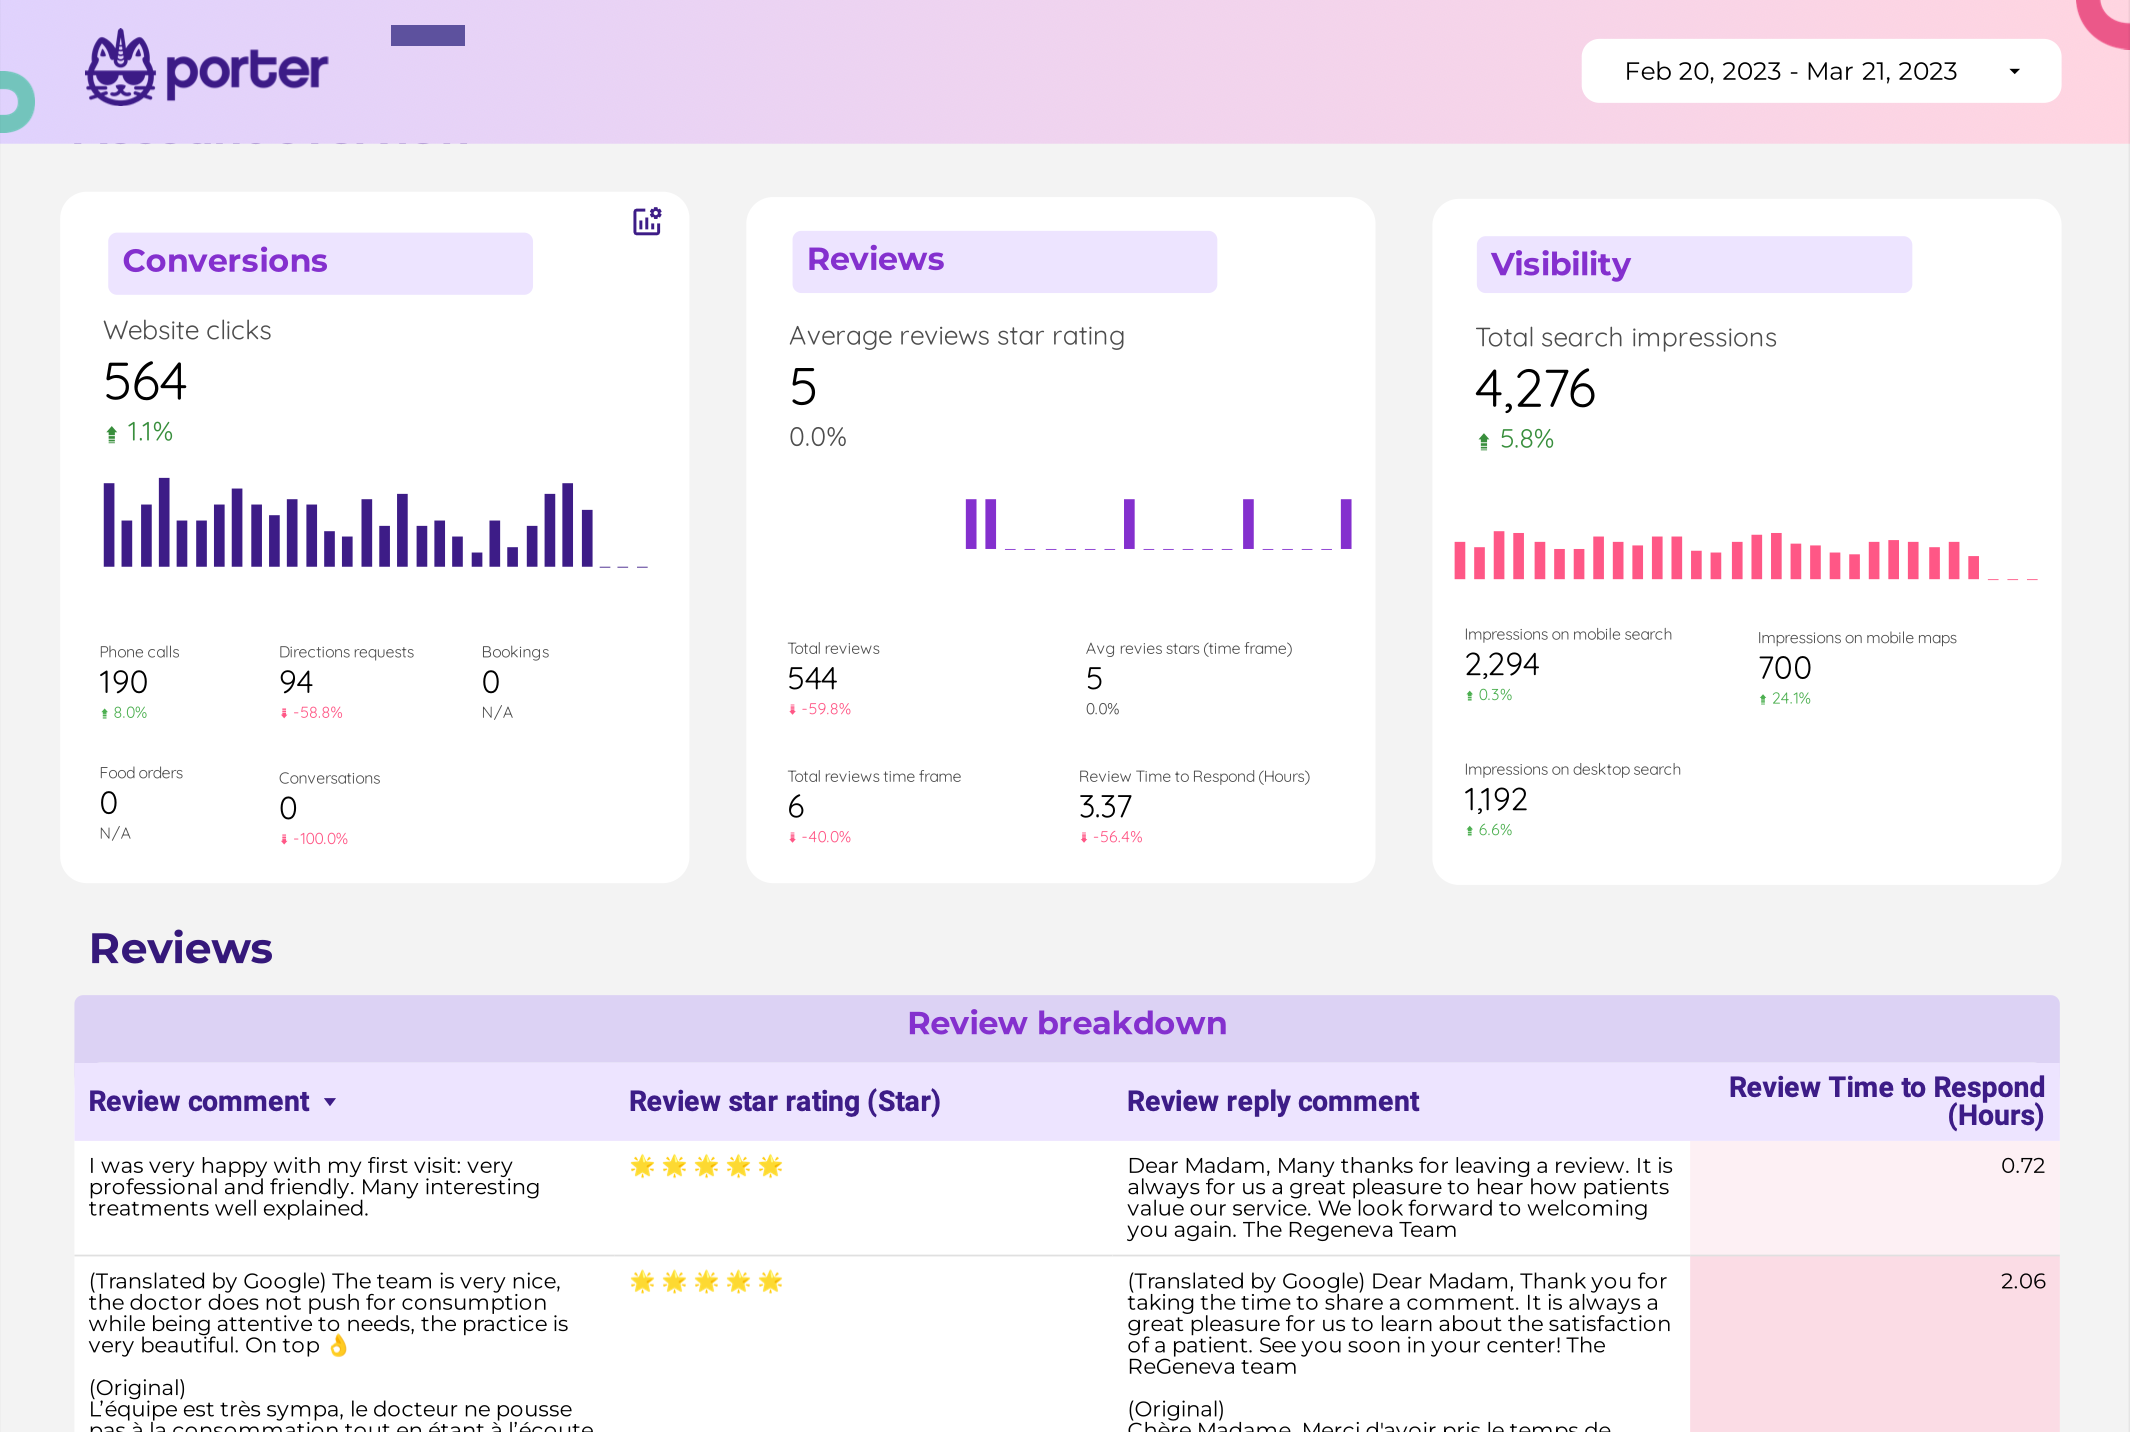
Free Google My Business report template for Looker Studio
Visualize information in a comprehensive dashboard you can use to get more 5 stars rates. This free report was made for business owners, local business consultants, or SEO agencies.
Visualize information in a comprehensive dashboard you can use to get more 5 stars rates. This free report was made for business owners, local business consultants, or SEO agencies.
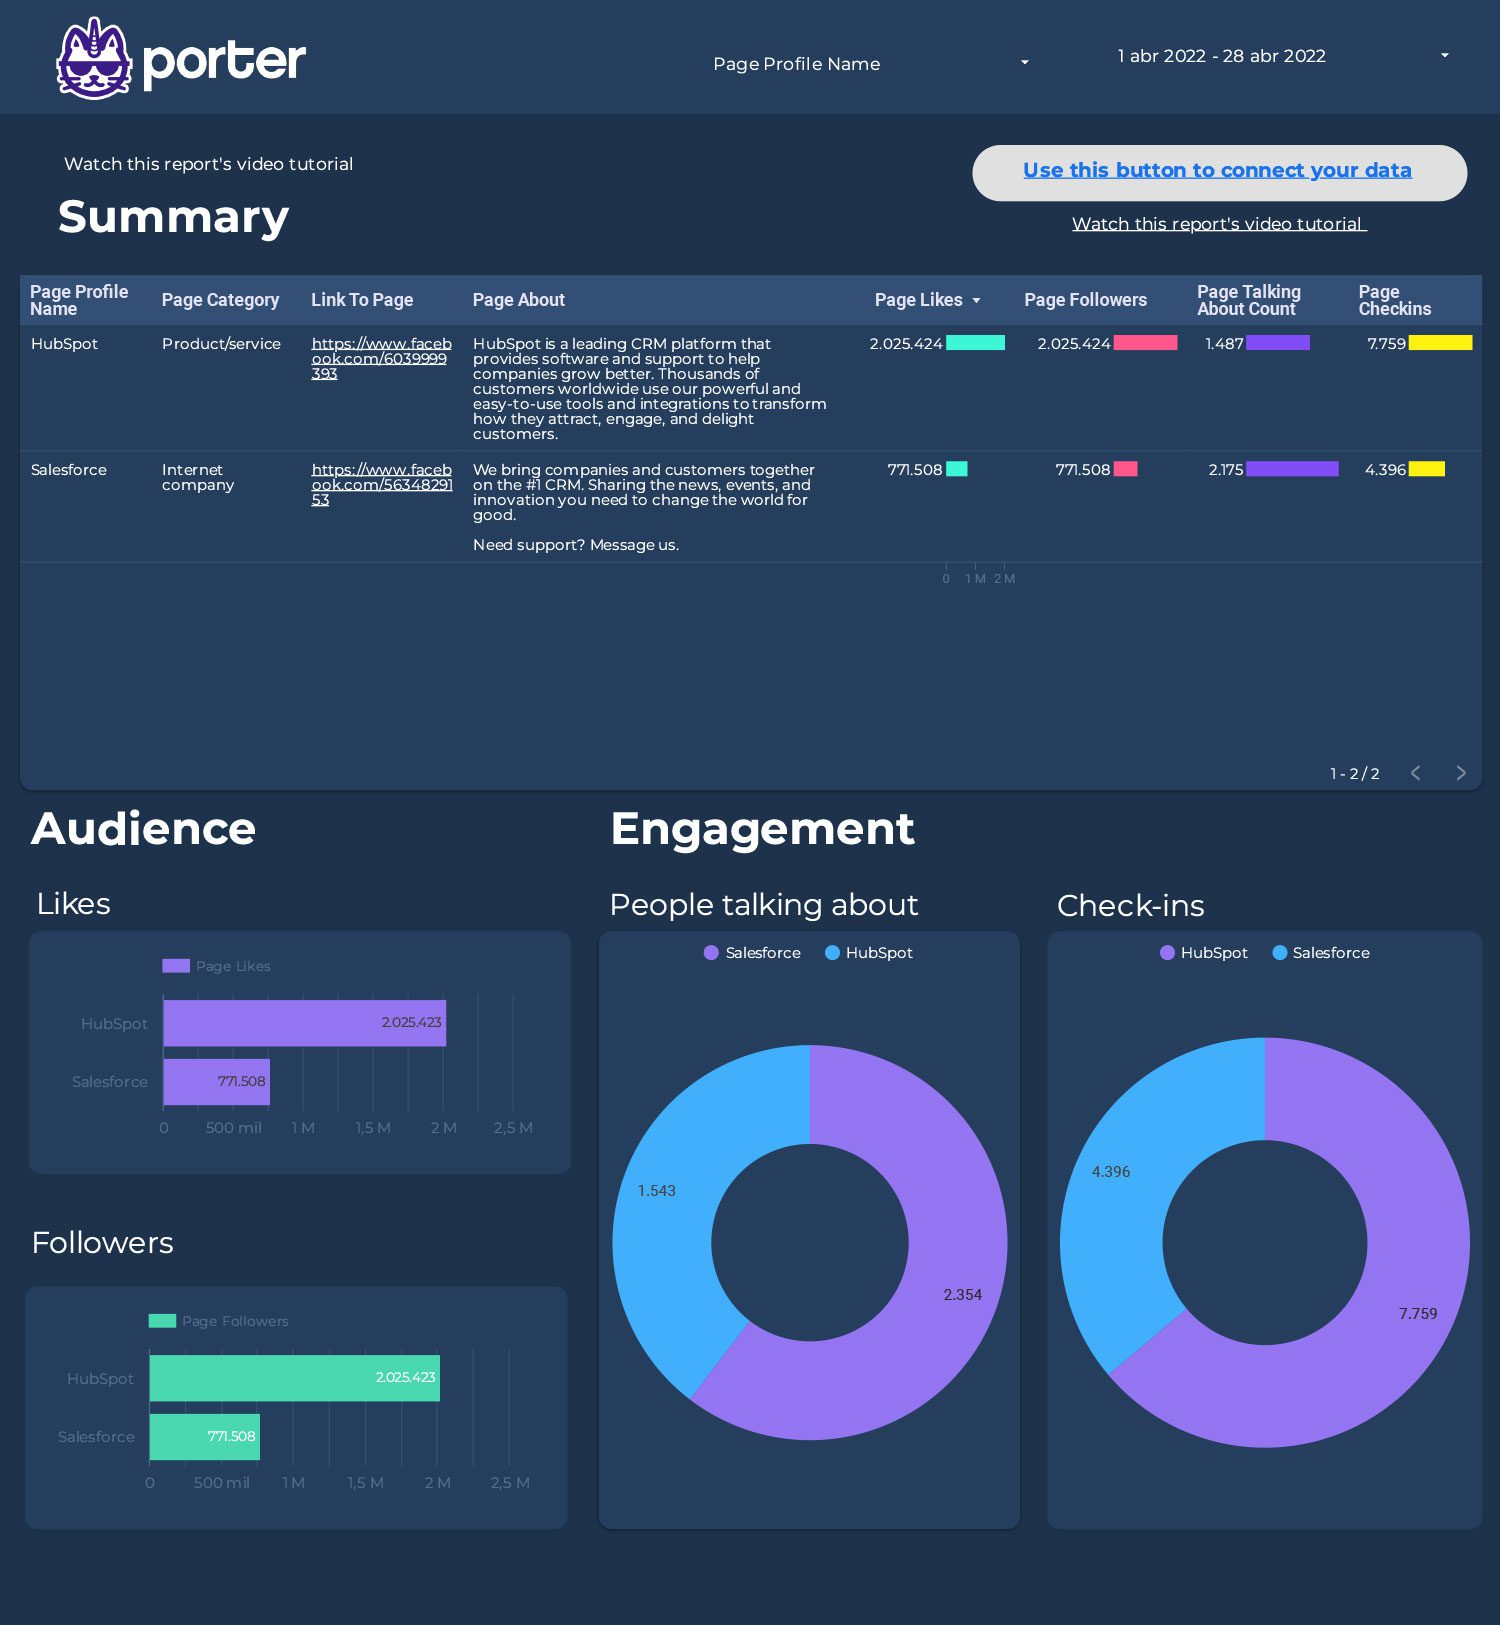
Download this visualization to track your competitors’ Facebook Pages. Pull and visualize data all for FREE with our Porter Facebook Competitors connector.
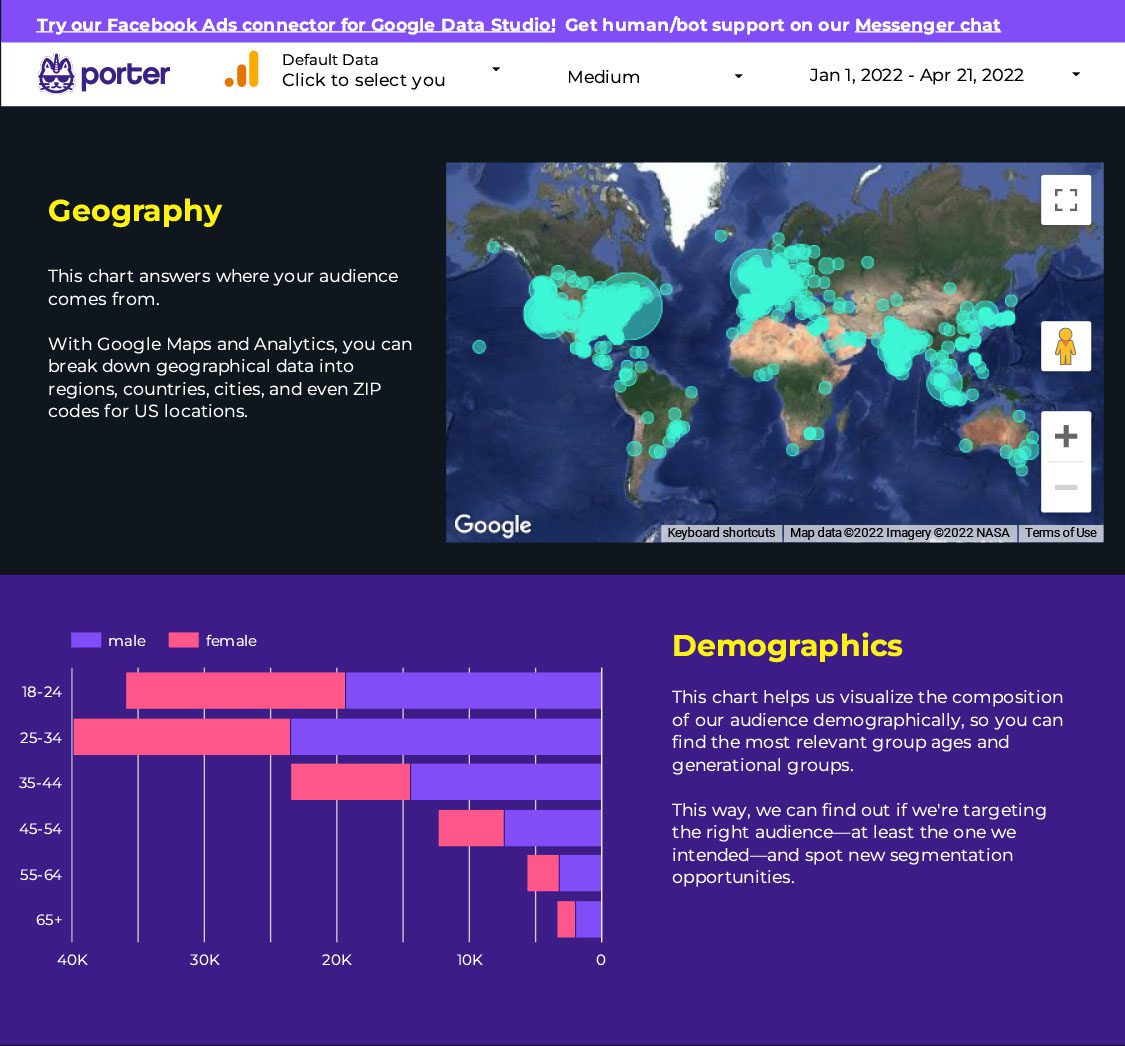
With this Google Data Studio report, you will understand the profile of the users who are visiting and buying your website to find data-based buyer personas.
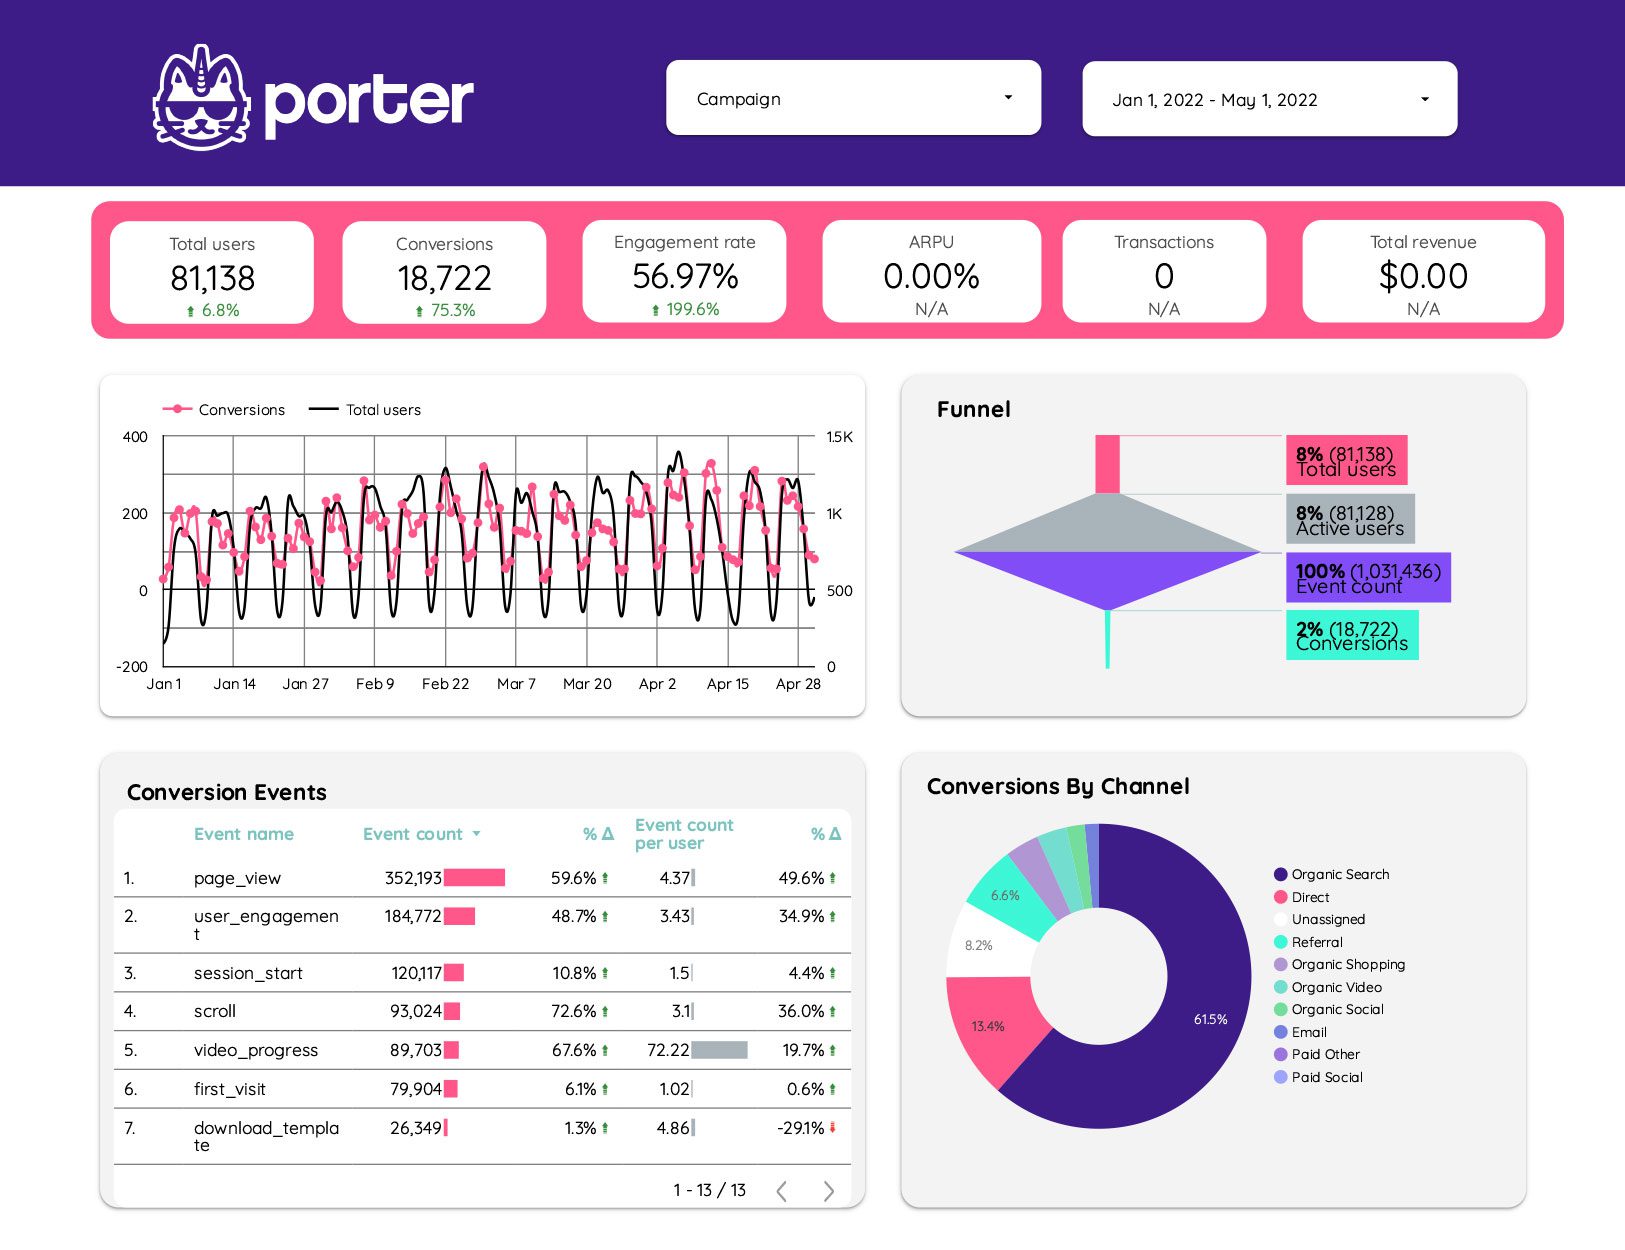
Switching or migrating data from UA to GA4 might be a little struggling for most marketers, but not for you. Because this report template will help you with the principal metrics you need to analyze from now on Google Analytics 4.

This template is inspired and brought by an ex-Googler and Google Marketing Expert.
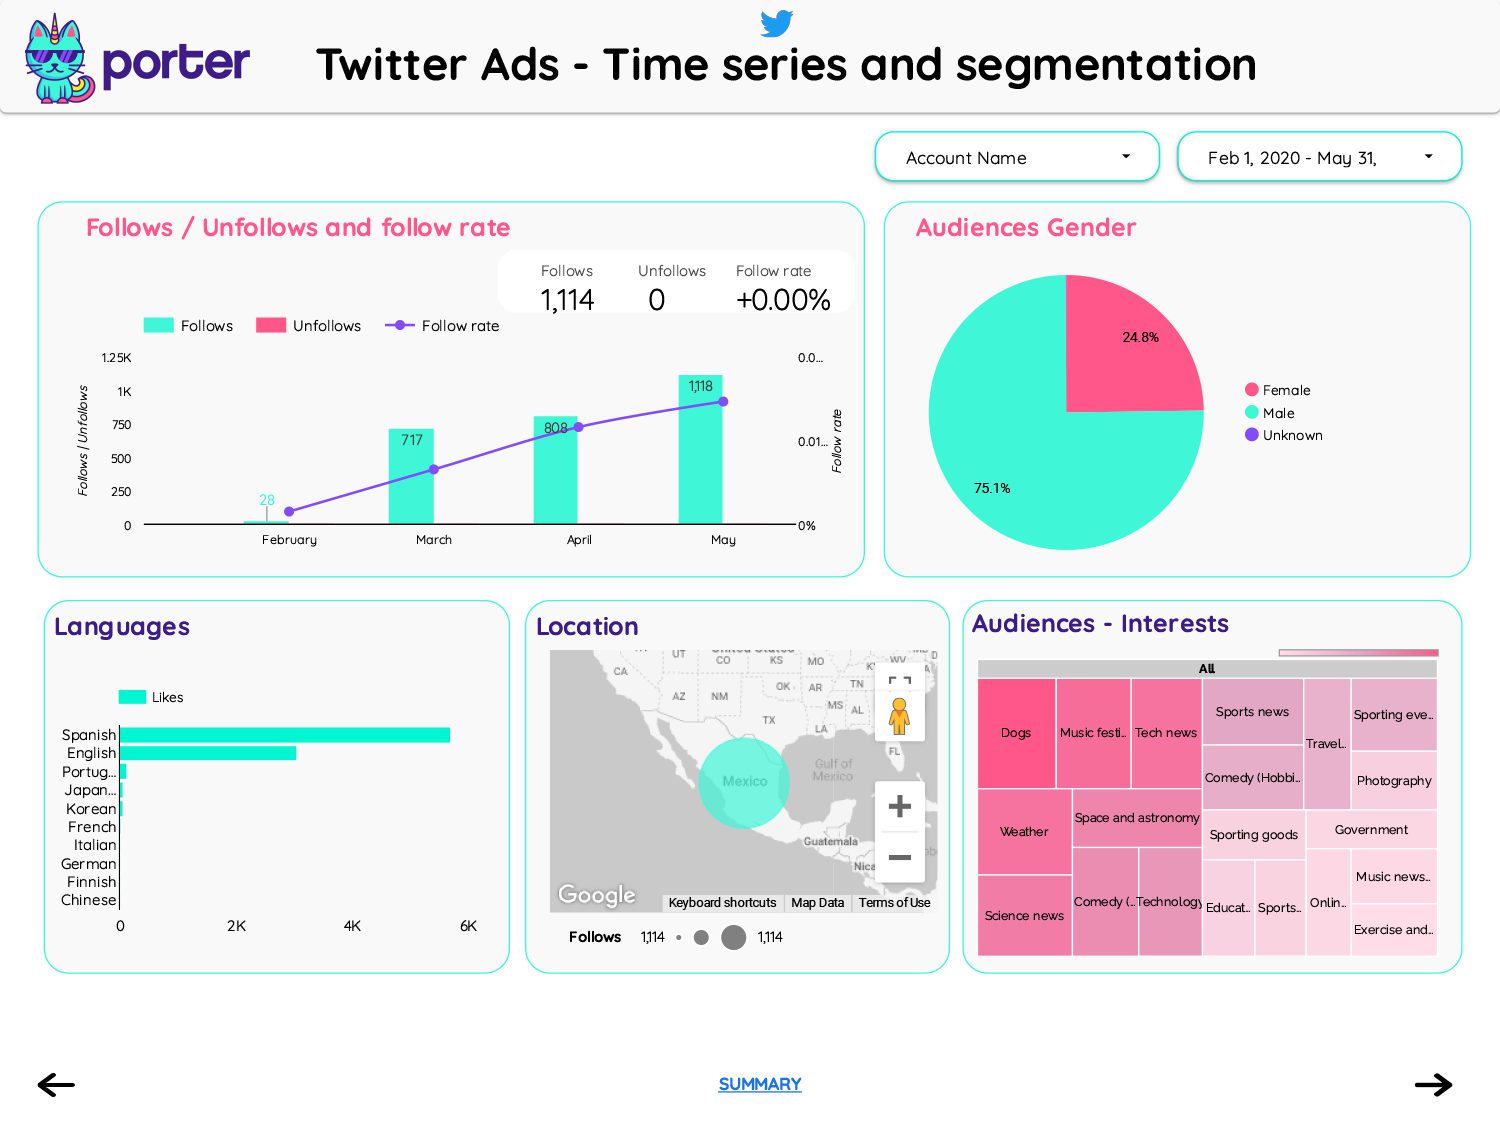
This pre-built template is all you need for free. Use it as a daily, weekly, and monthly Twitter Ads analytics reporting.
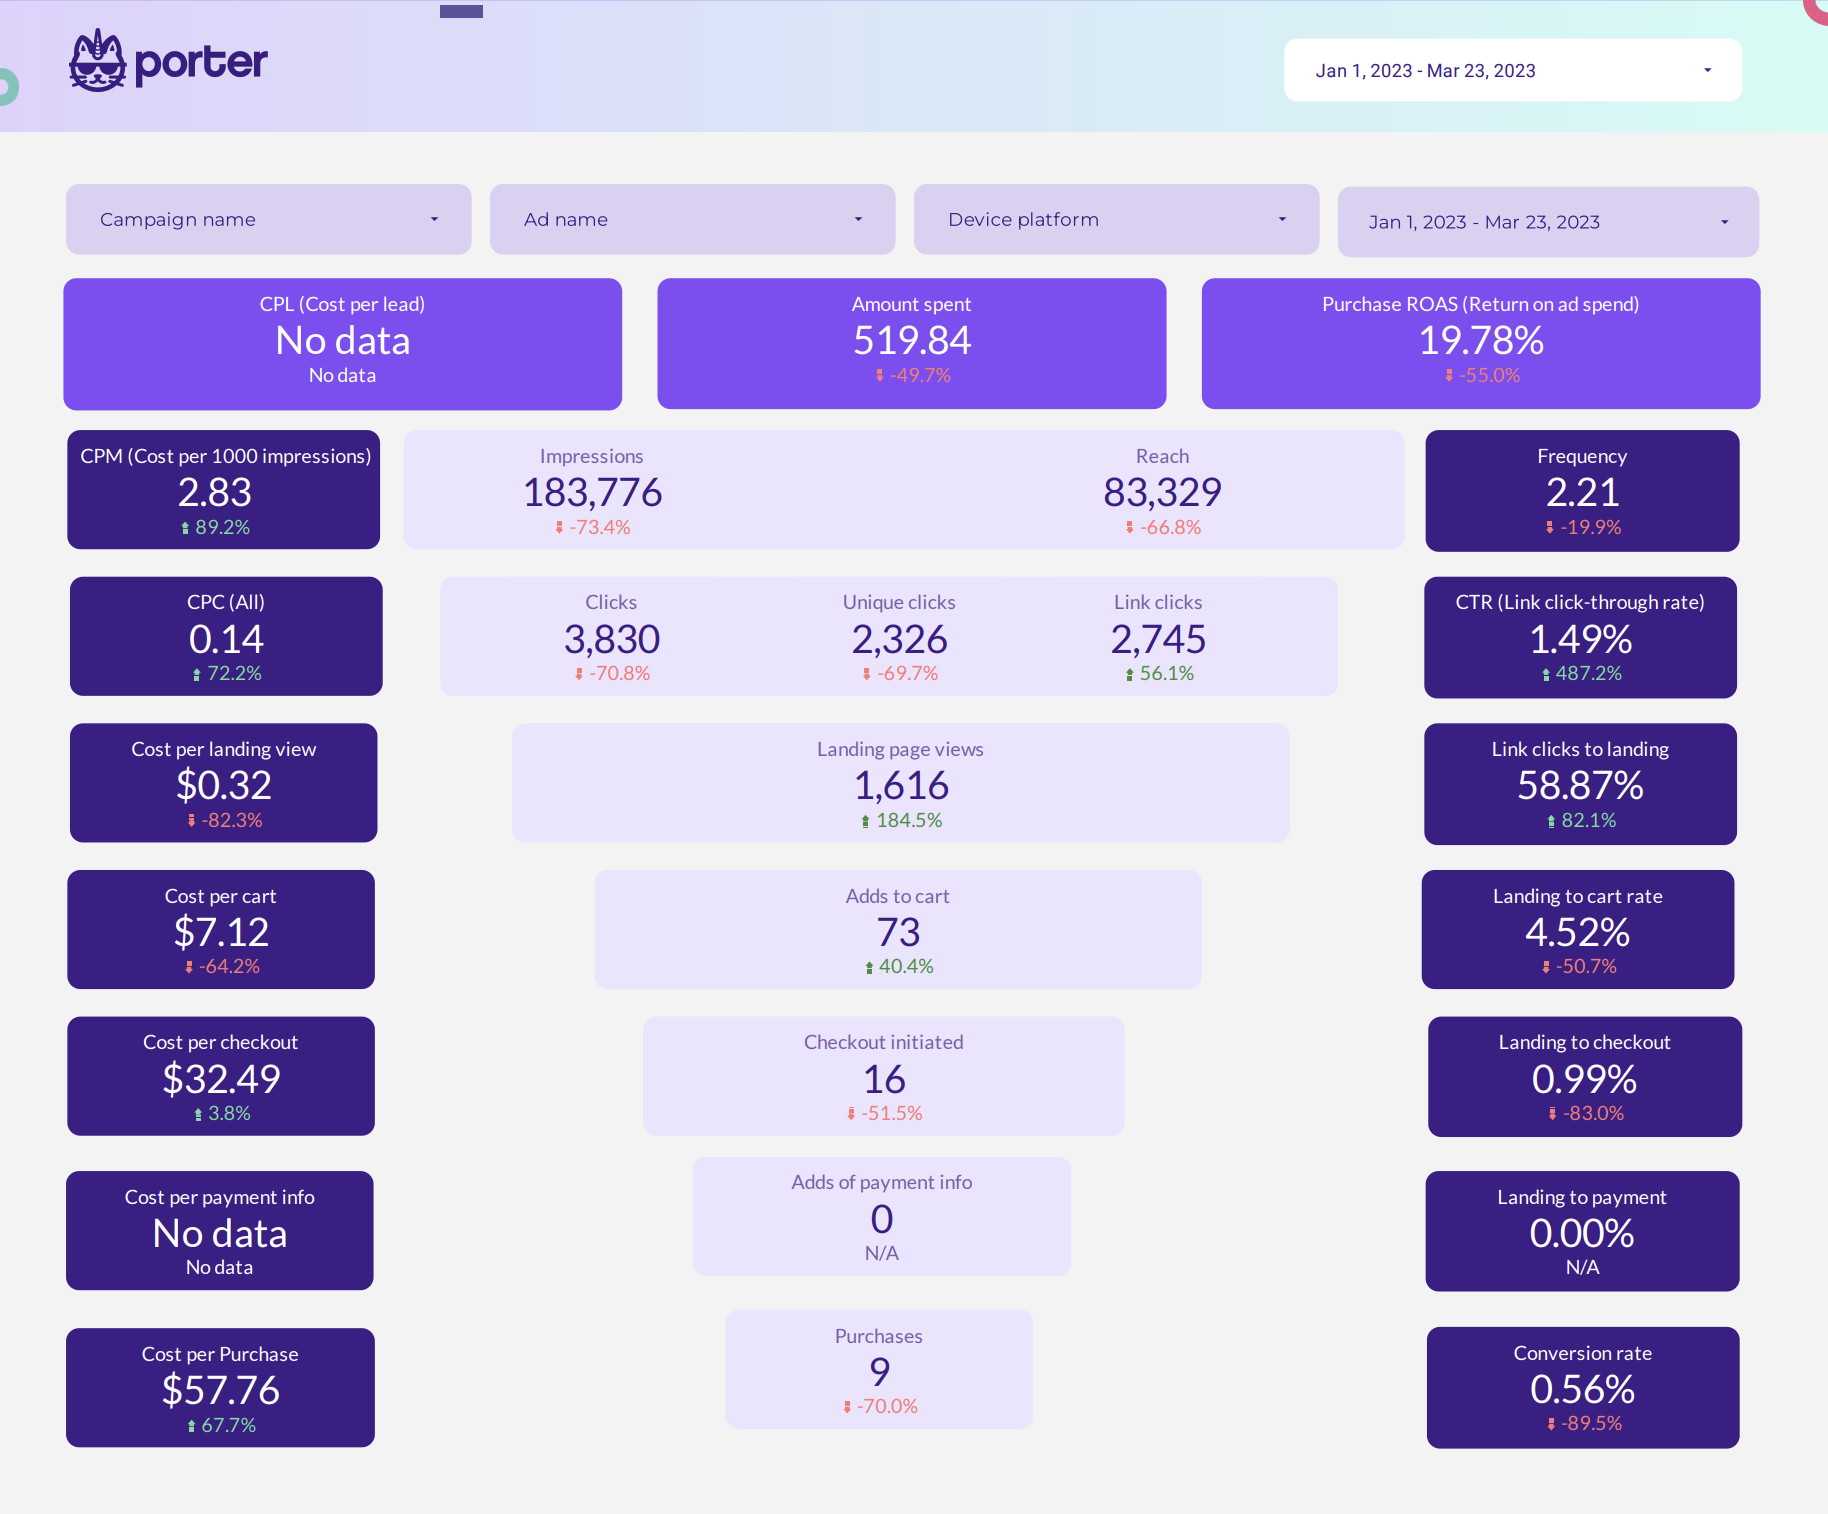
The Facebook Ads E-commerce funnel report template is part of the welcome kit we give away to our Facebook Ads connector users in both free trial and paid plan.
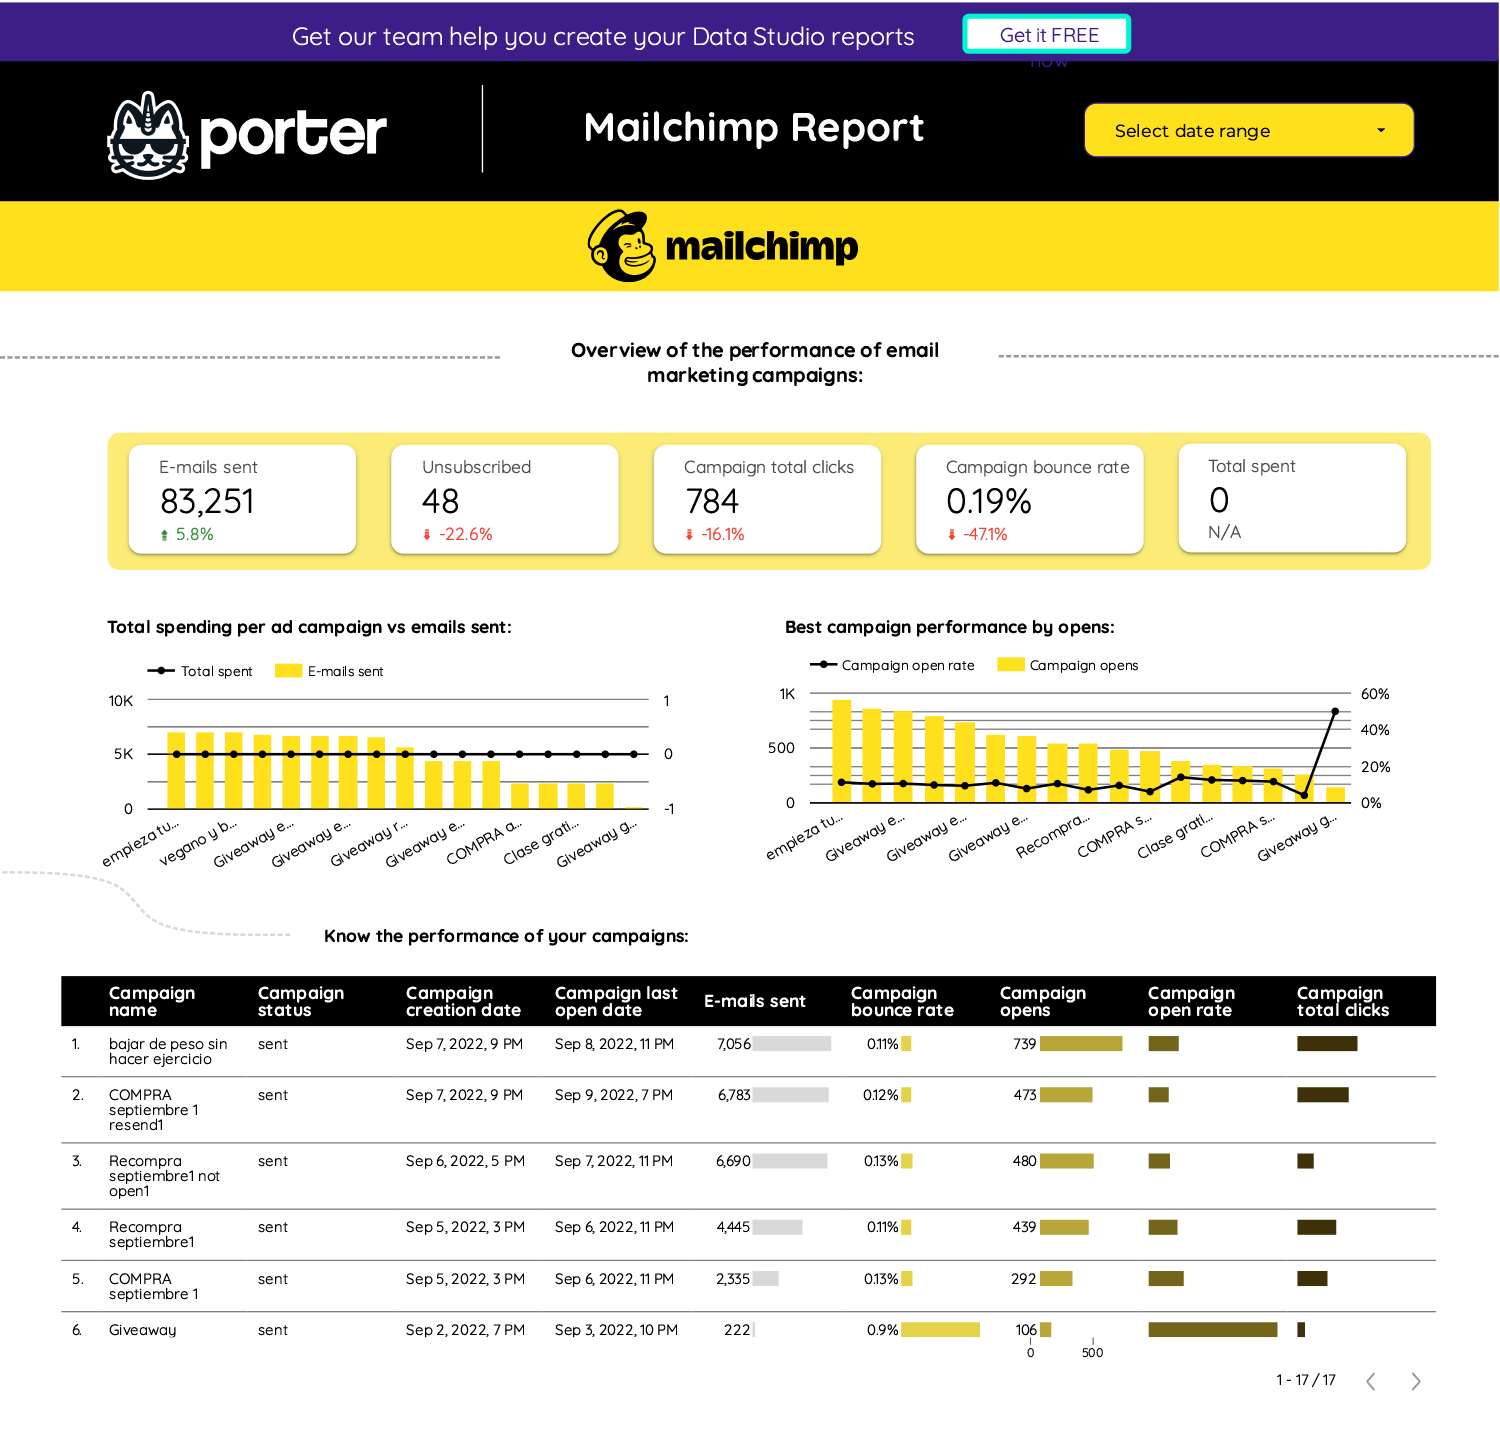
Main metrics: E-mails sent, unsubscribed, campaign total clicks, bounce rate, totally spent, campaign open rate, campaign opens, campaigns emails canceled, total clicks, total list members, list click rate, member open rate, main metrics testing A and B.
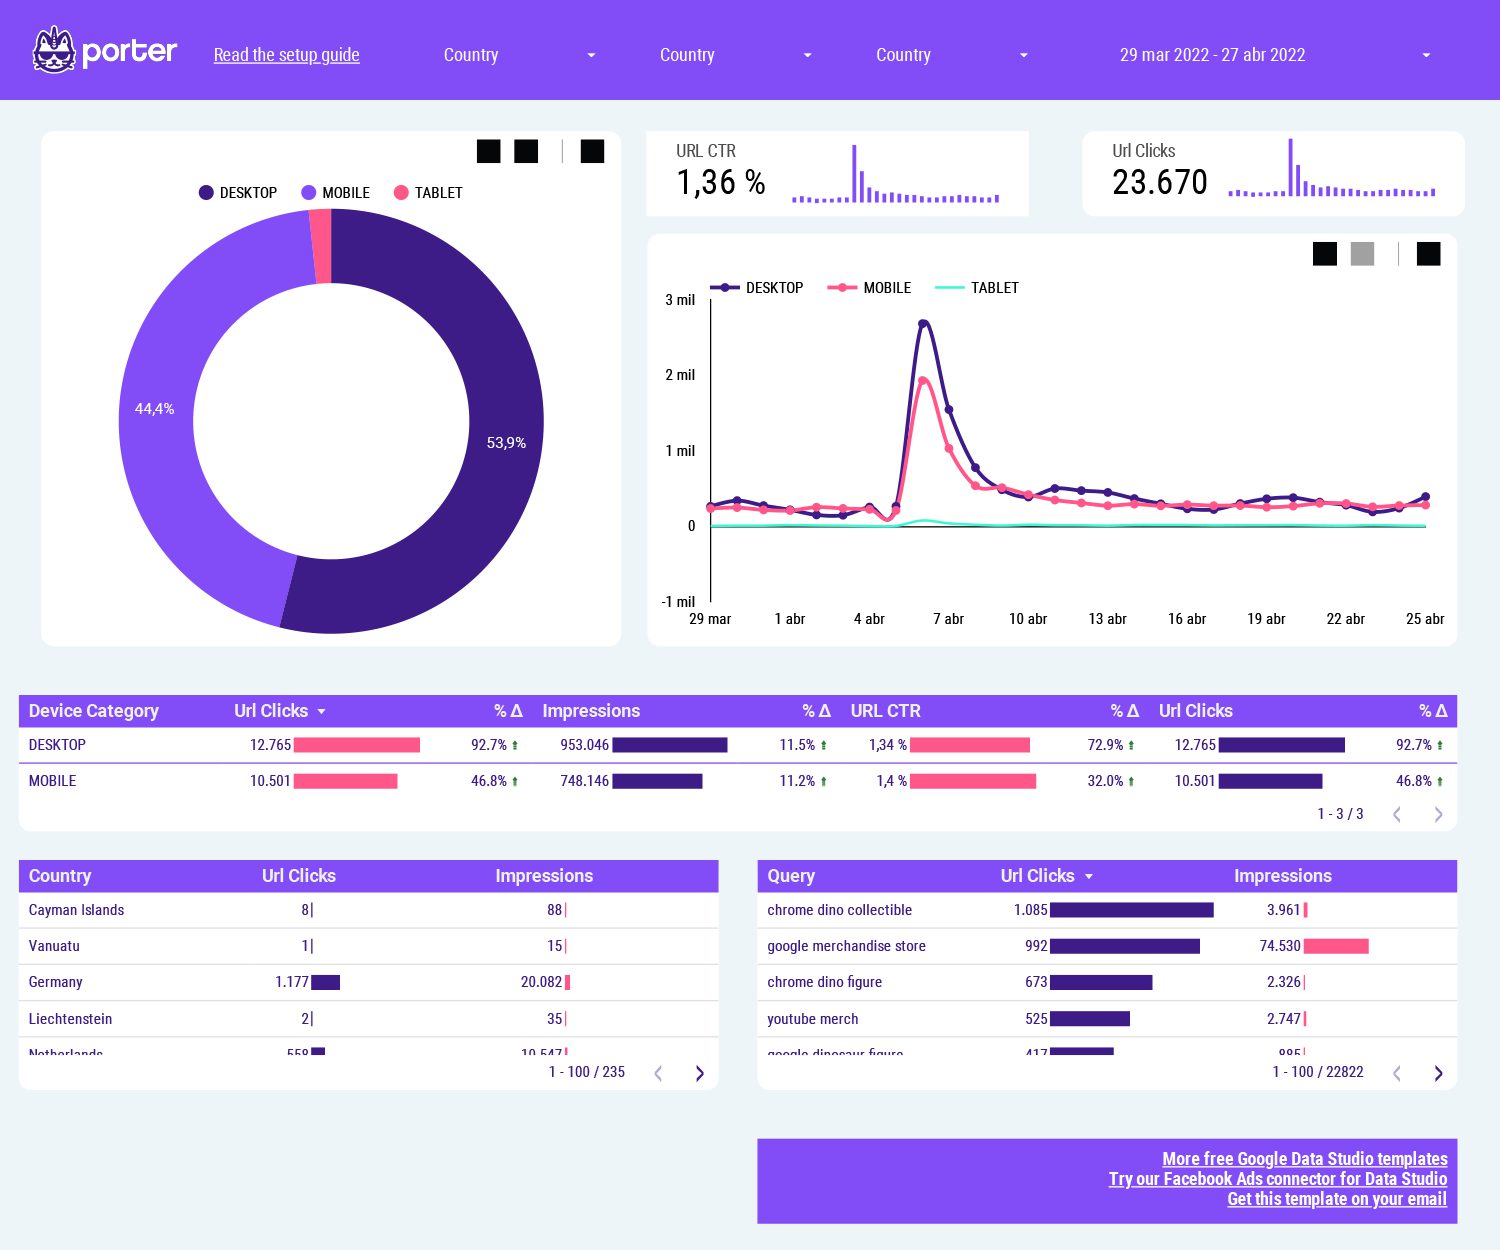
Learn to break down your SEO analysis into branded and non-branded (or discovery) searches
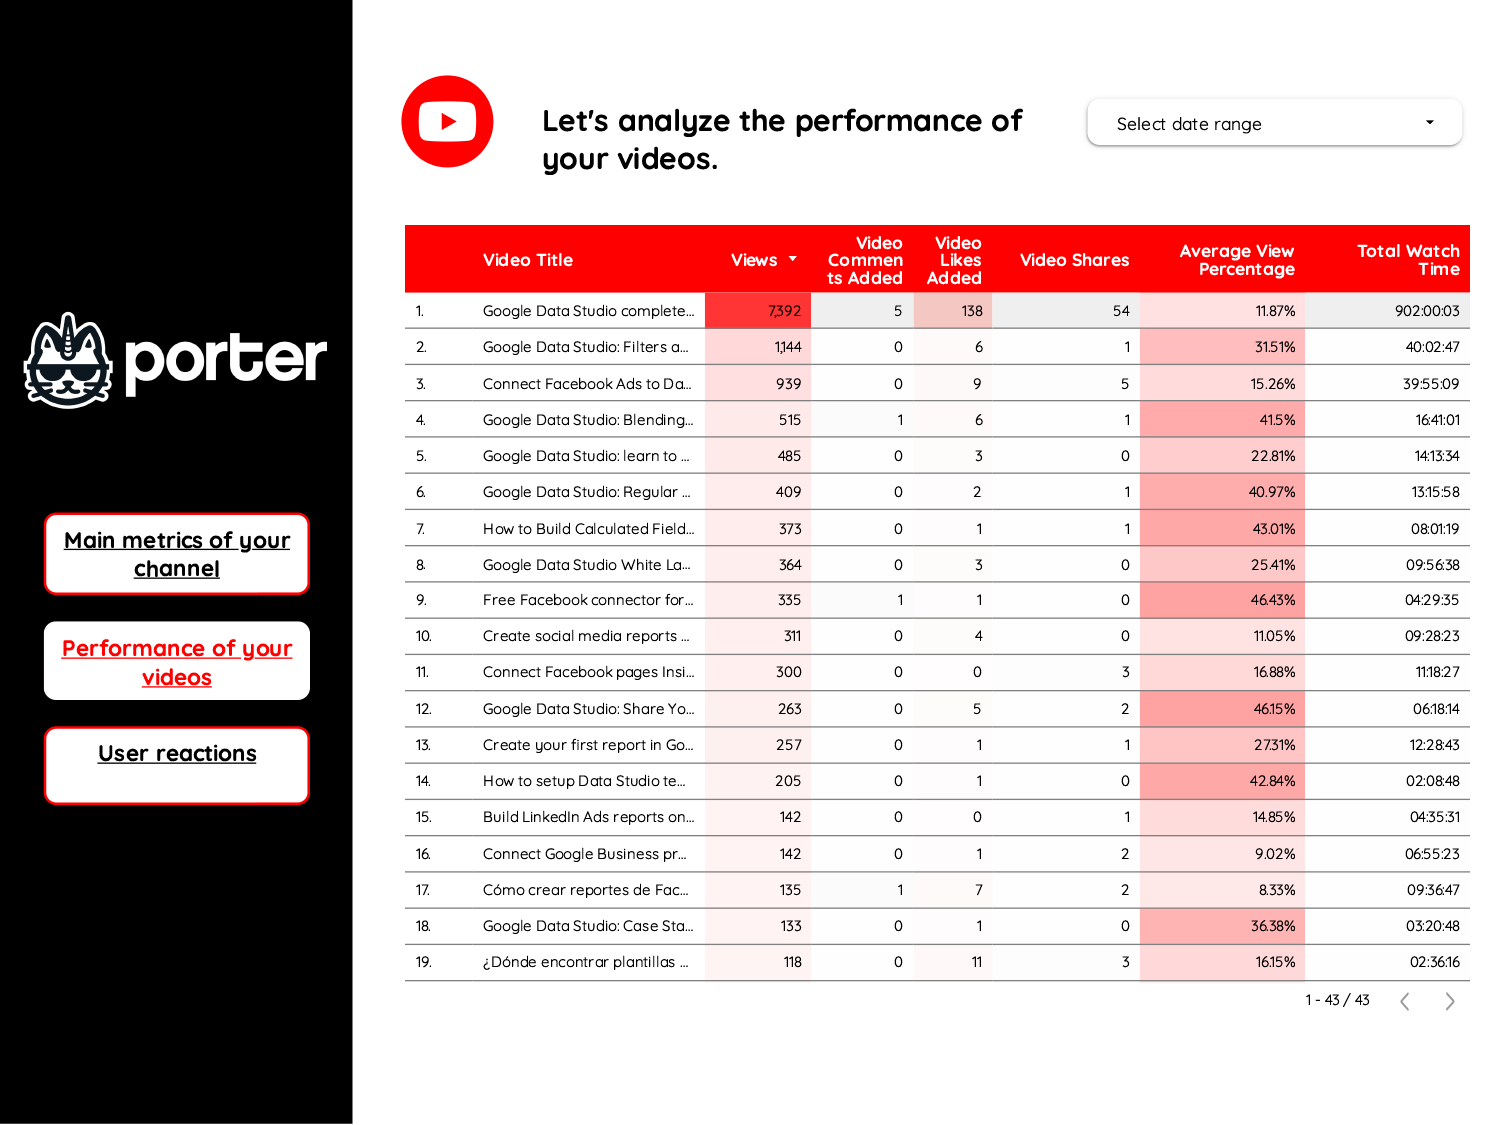
This YouTube Template will help you measure the impact and performance of your video content pieces and will allow you and your team to understand and analyze the following Video KPIs
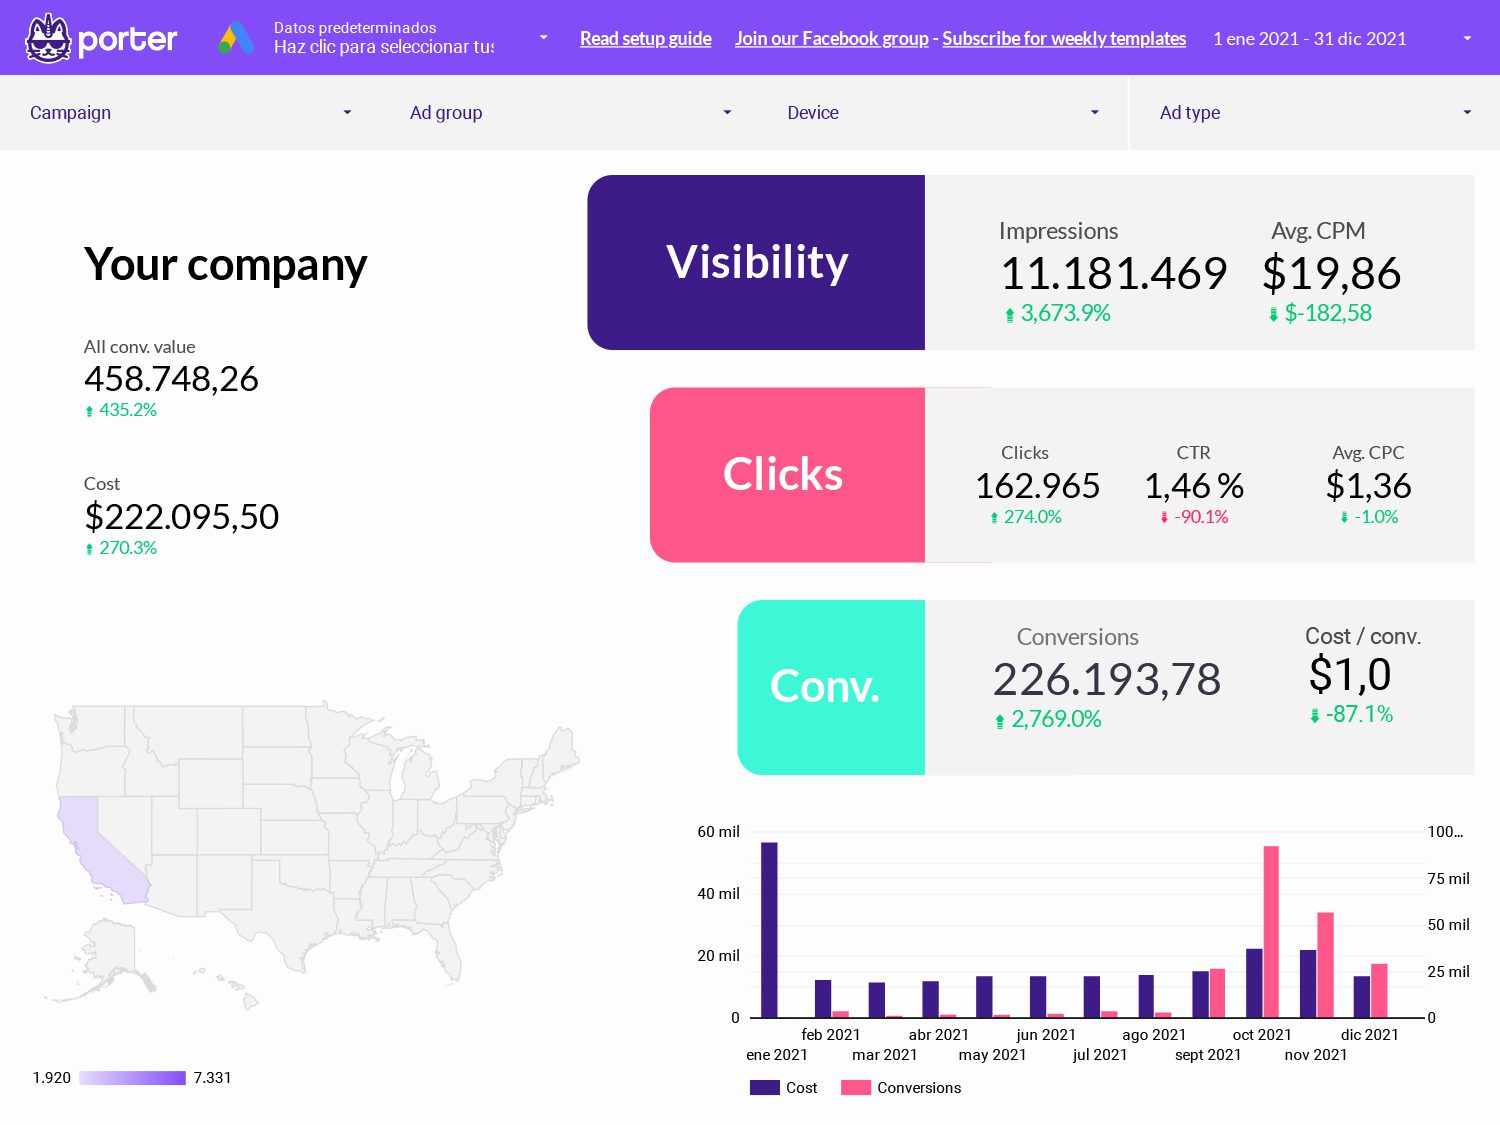
Visualize your Google Ads funnel, ad spend and sales—all in a single view. Break down your data into campaign, ad sets and devices.
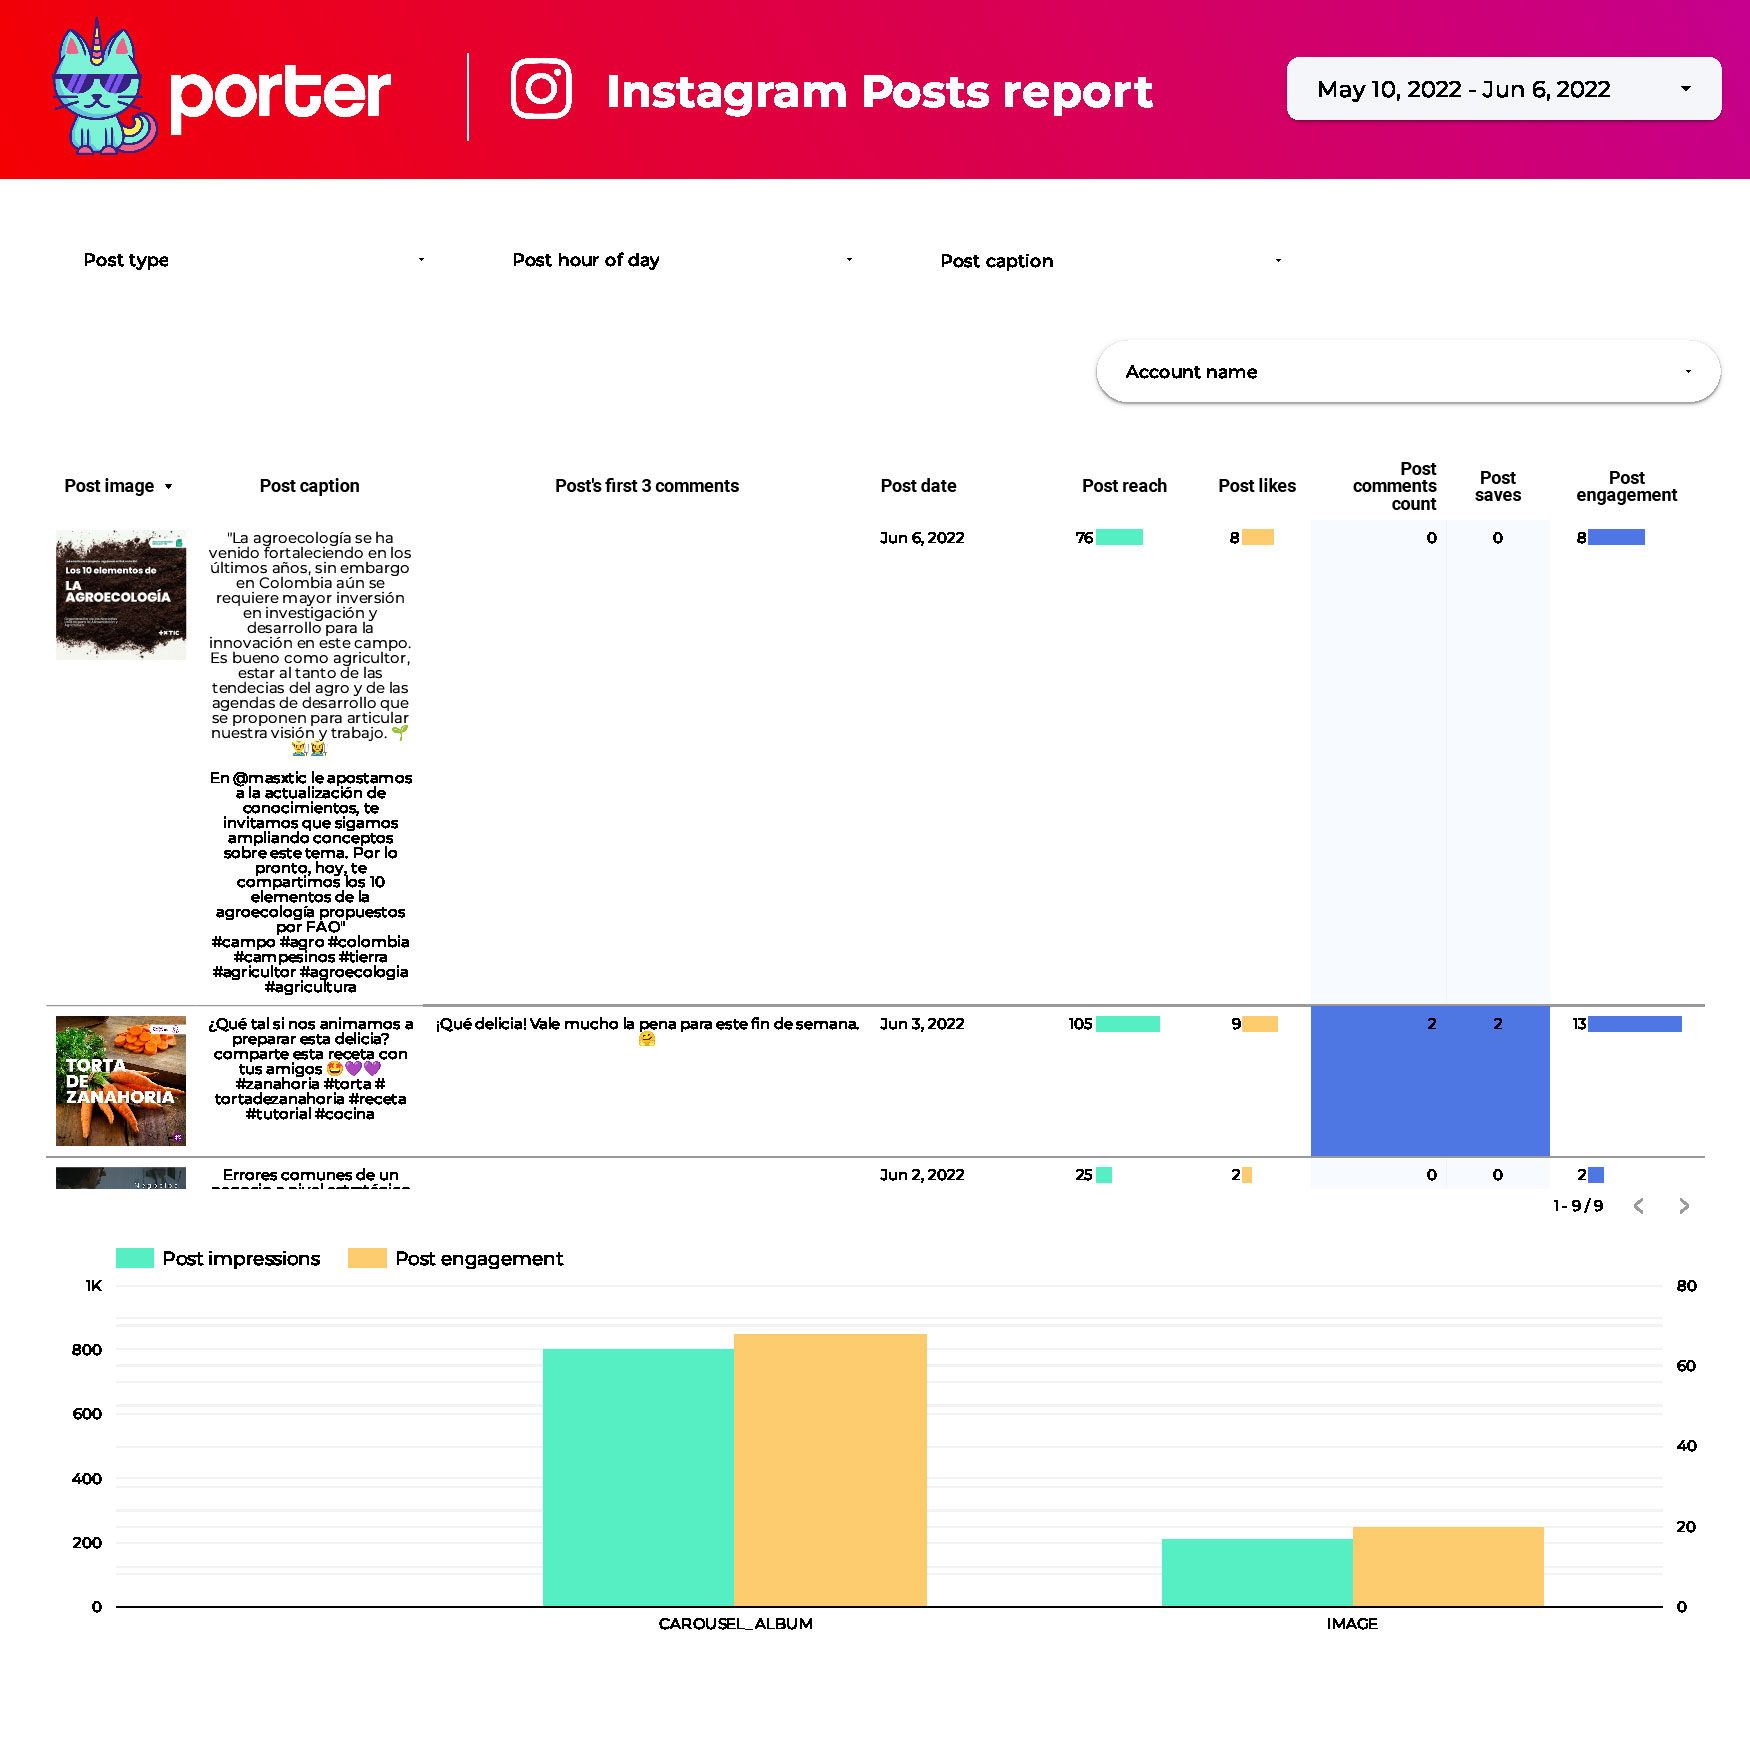
Put your logo on it and generate an Instagram report in seconds. Track your Profile growth, demographics, stories, and conversion data by connecting your Instagram profile.
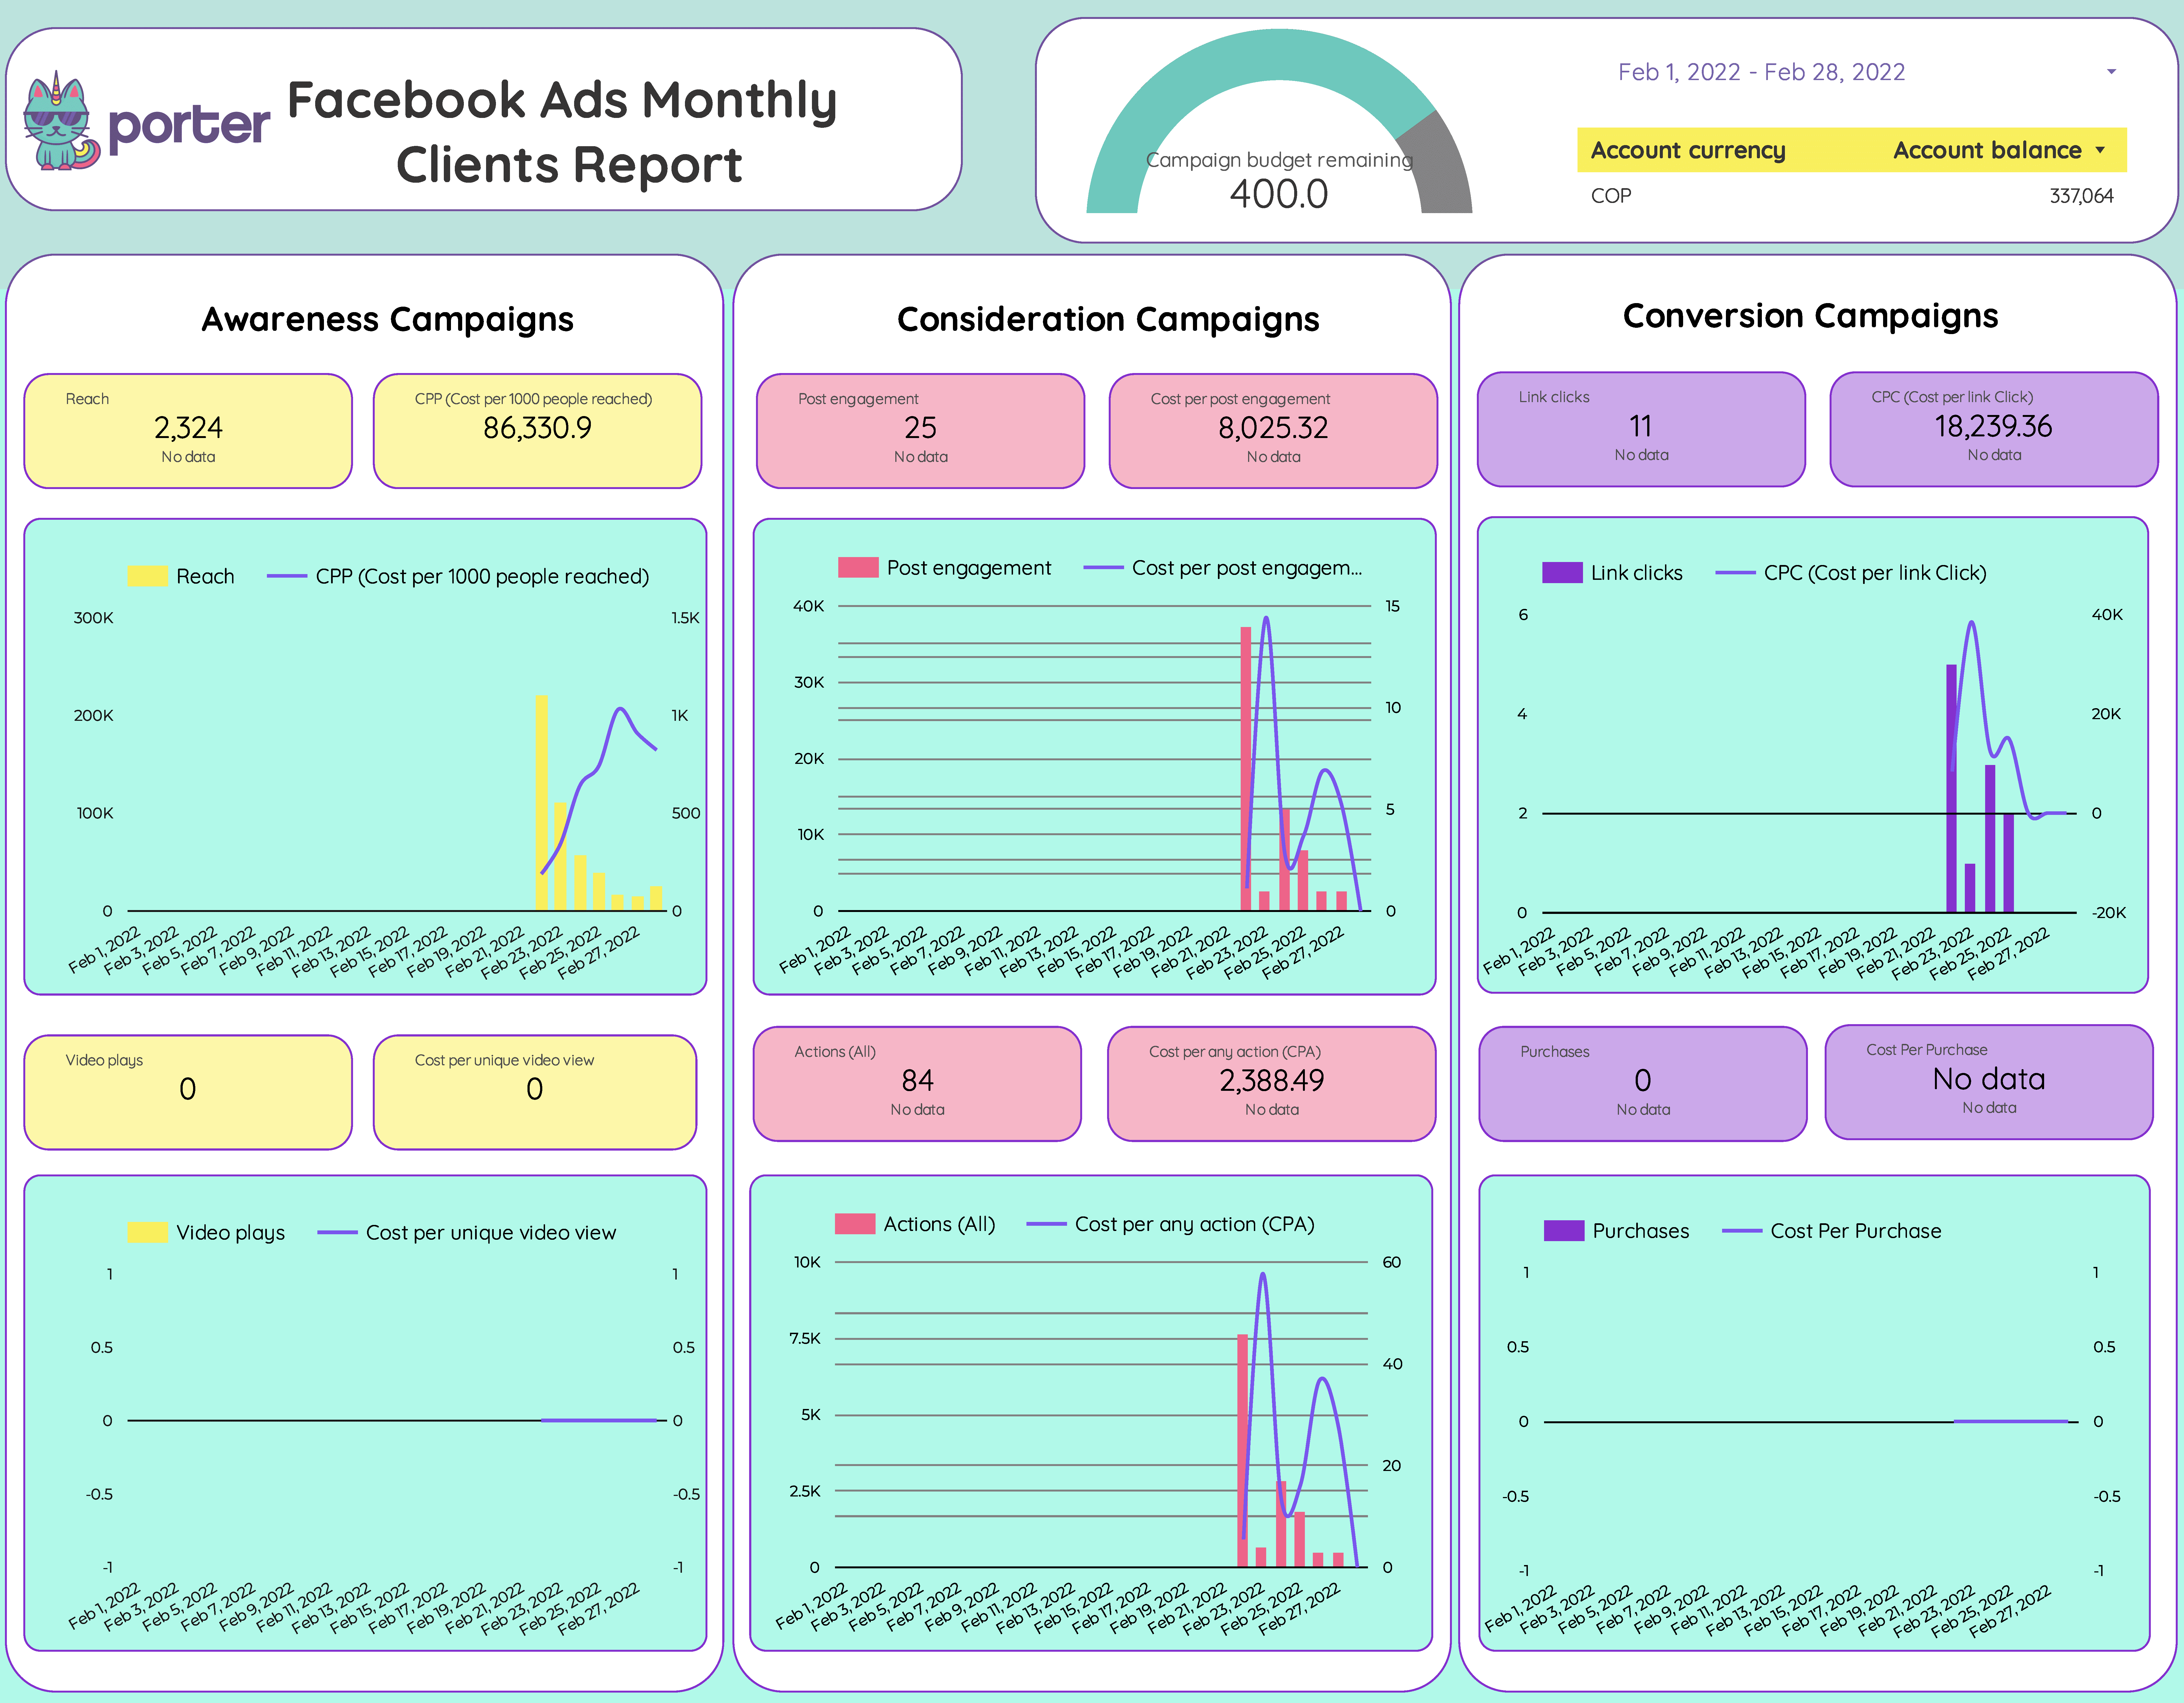
Track the most relevant Facebook Ads buying objectives and automate your monthly reporting.
To deliver a Monthly report to your clients never been so easy!
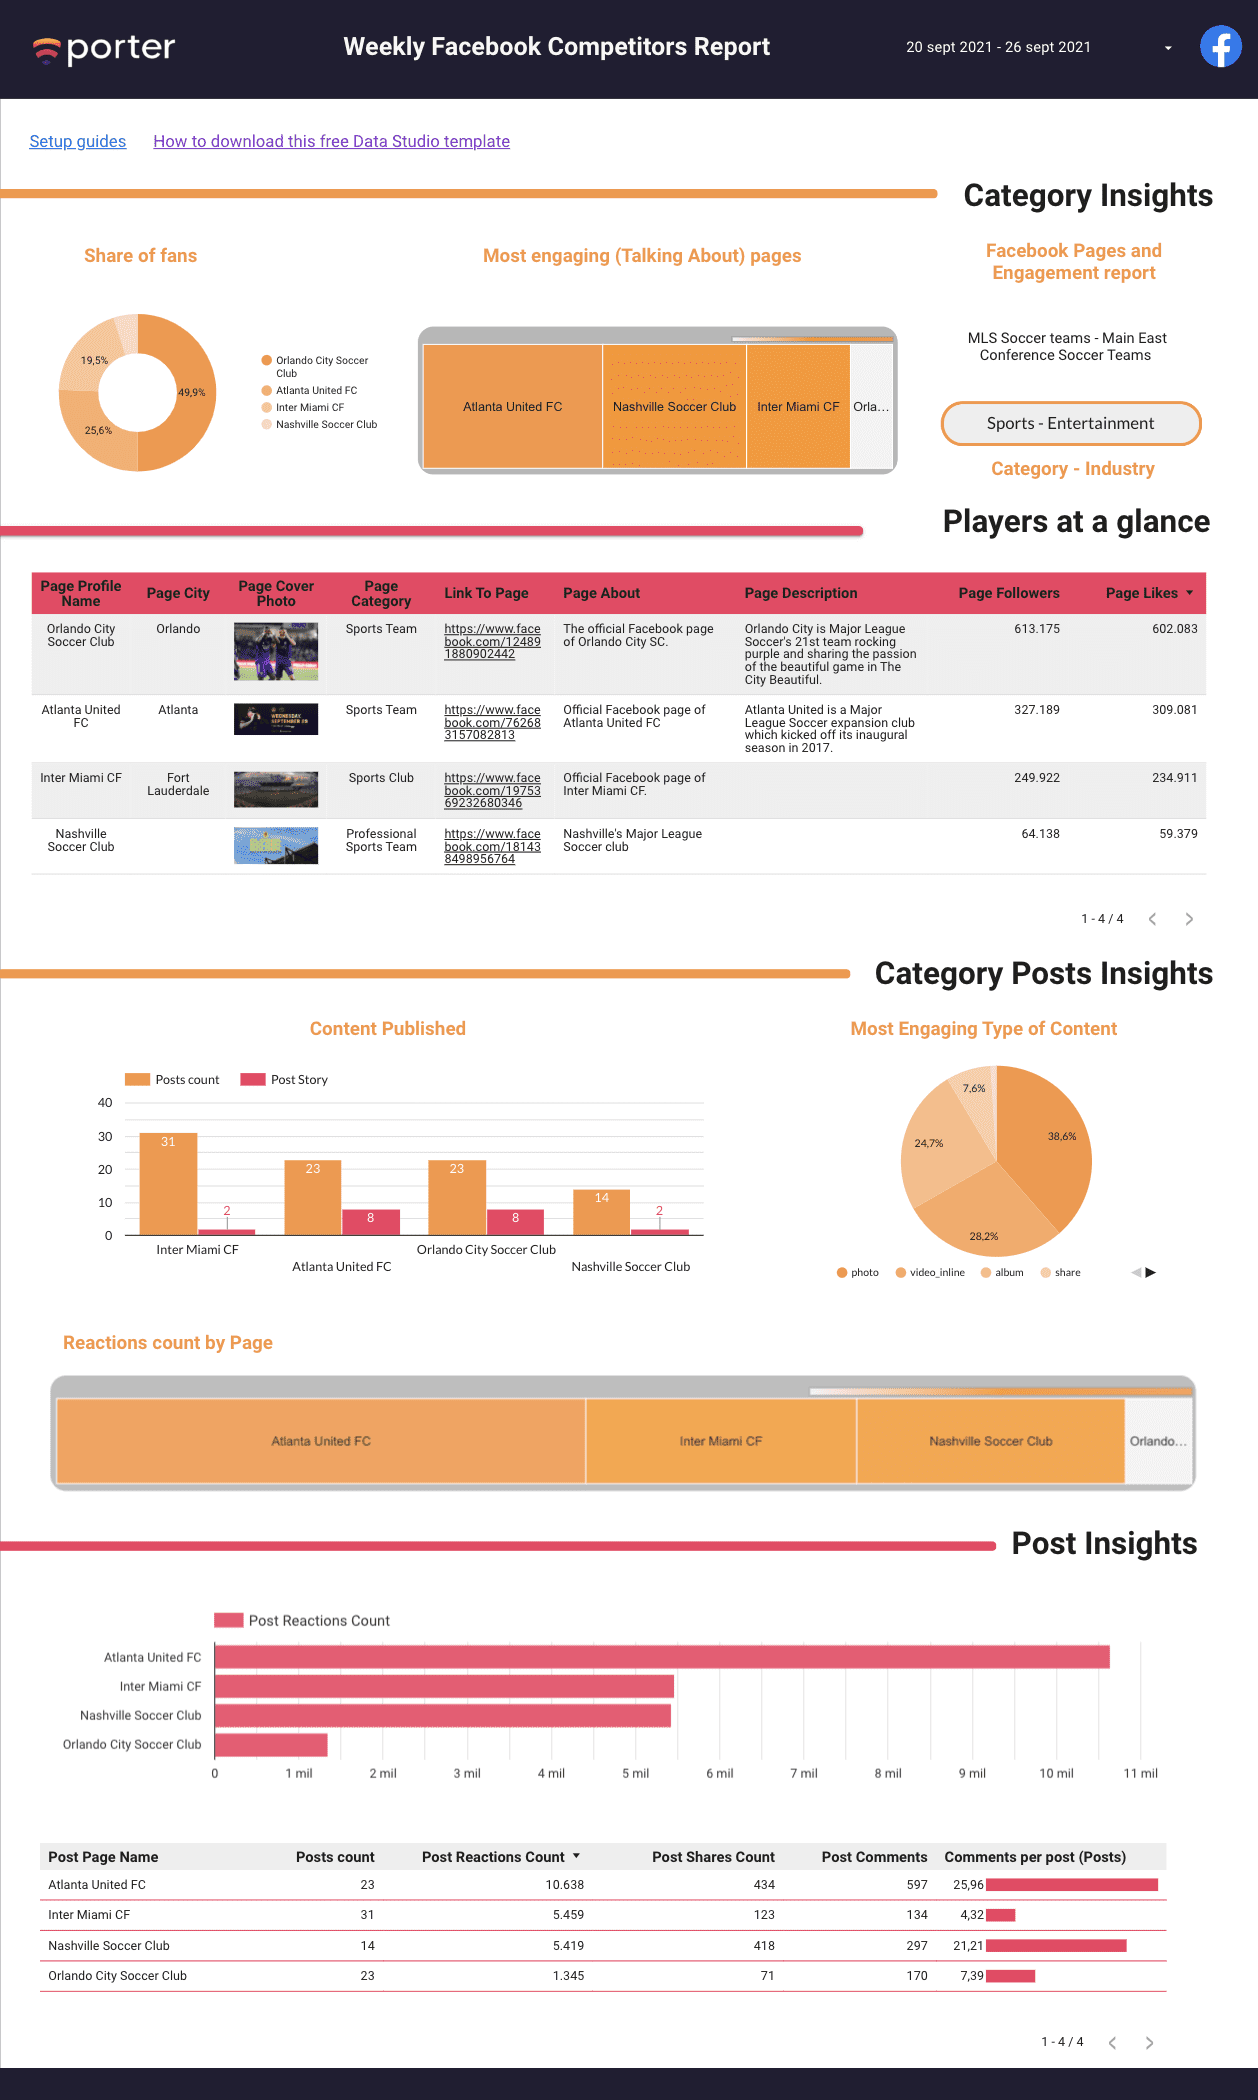
Visualize the Facebook Competitors data with the Facebook Public Data Porter connector and boost your strategy. Get the template – It’s free Facebook Competitor’s report
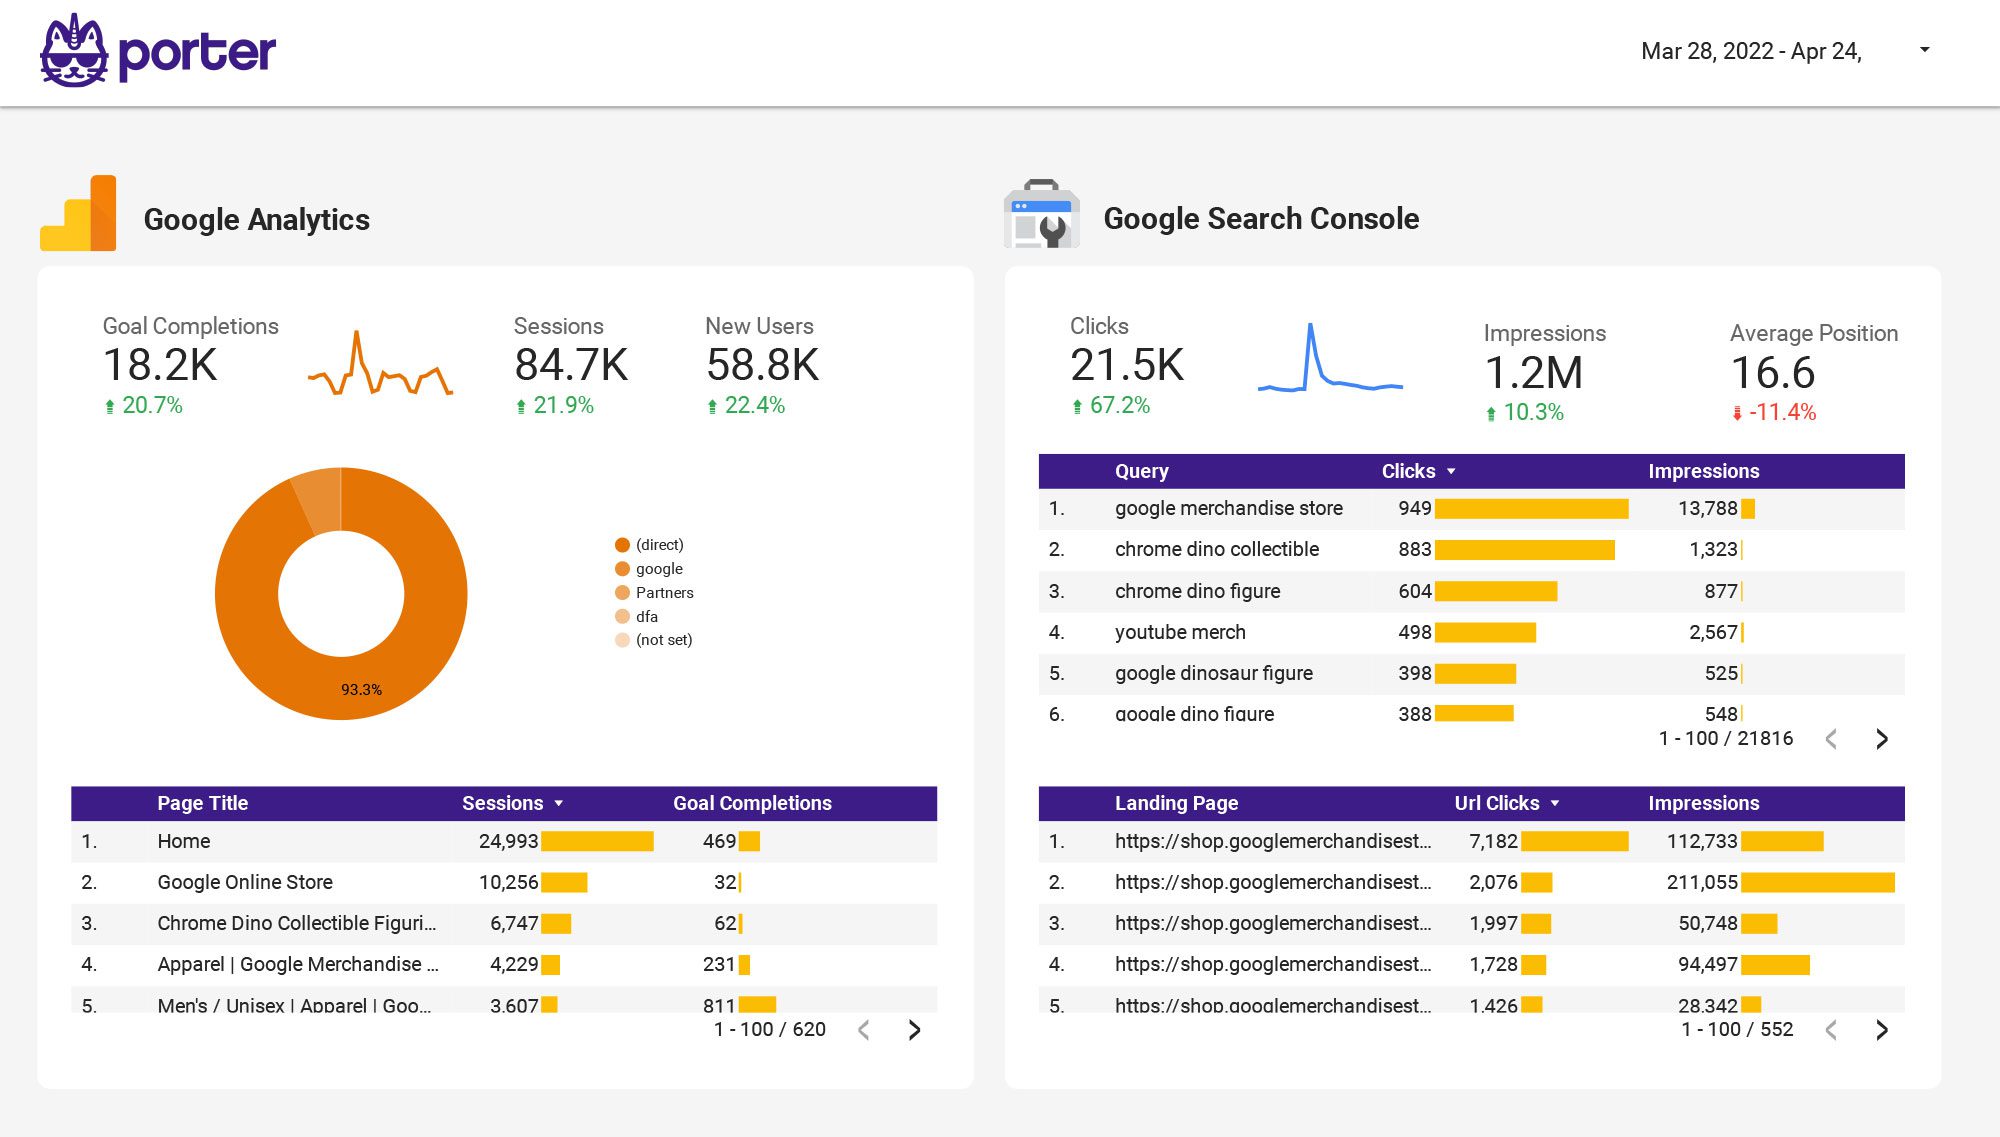
Visualize your core marketing KPIs from all channels in a single view: Google Analytics, Google Ads, Youtube, Google Search Console, Facebook pages, Instagram pages, and Facebook Ads.