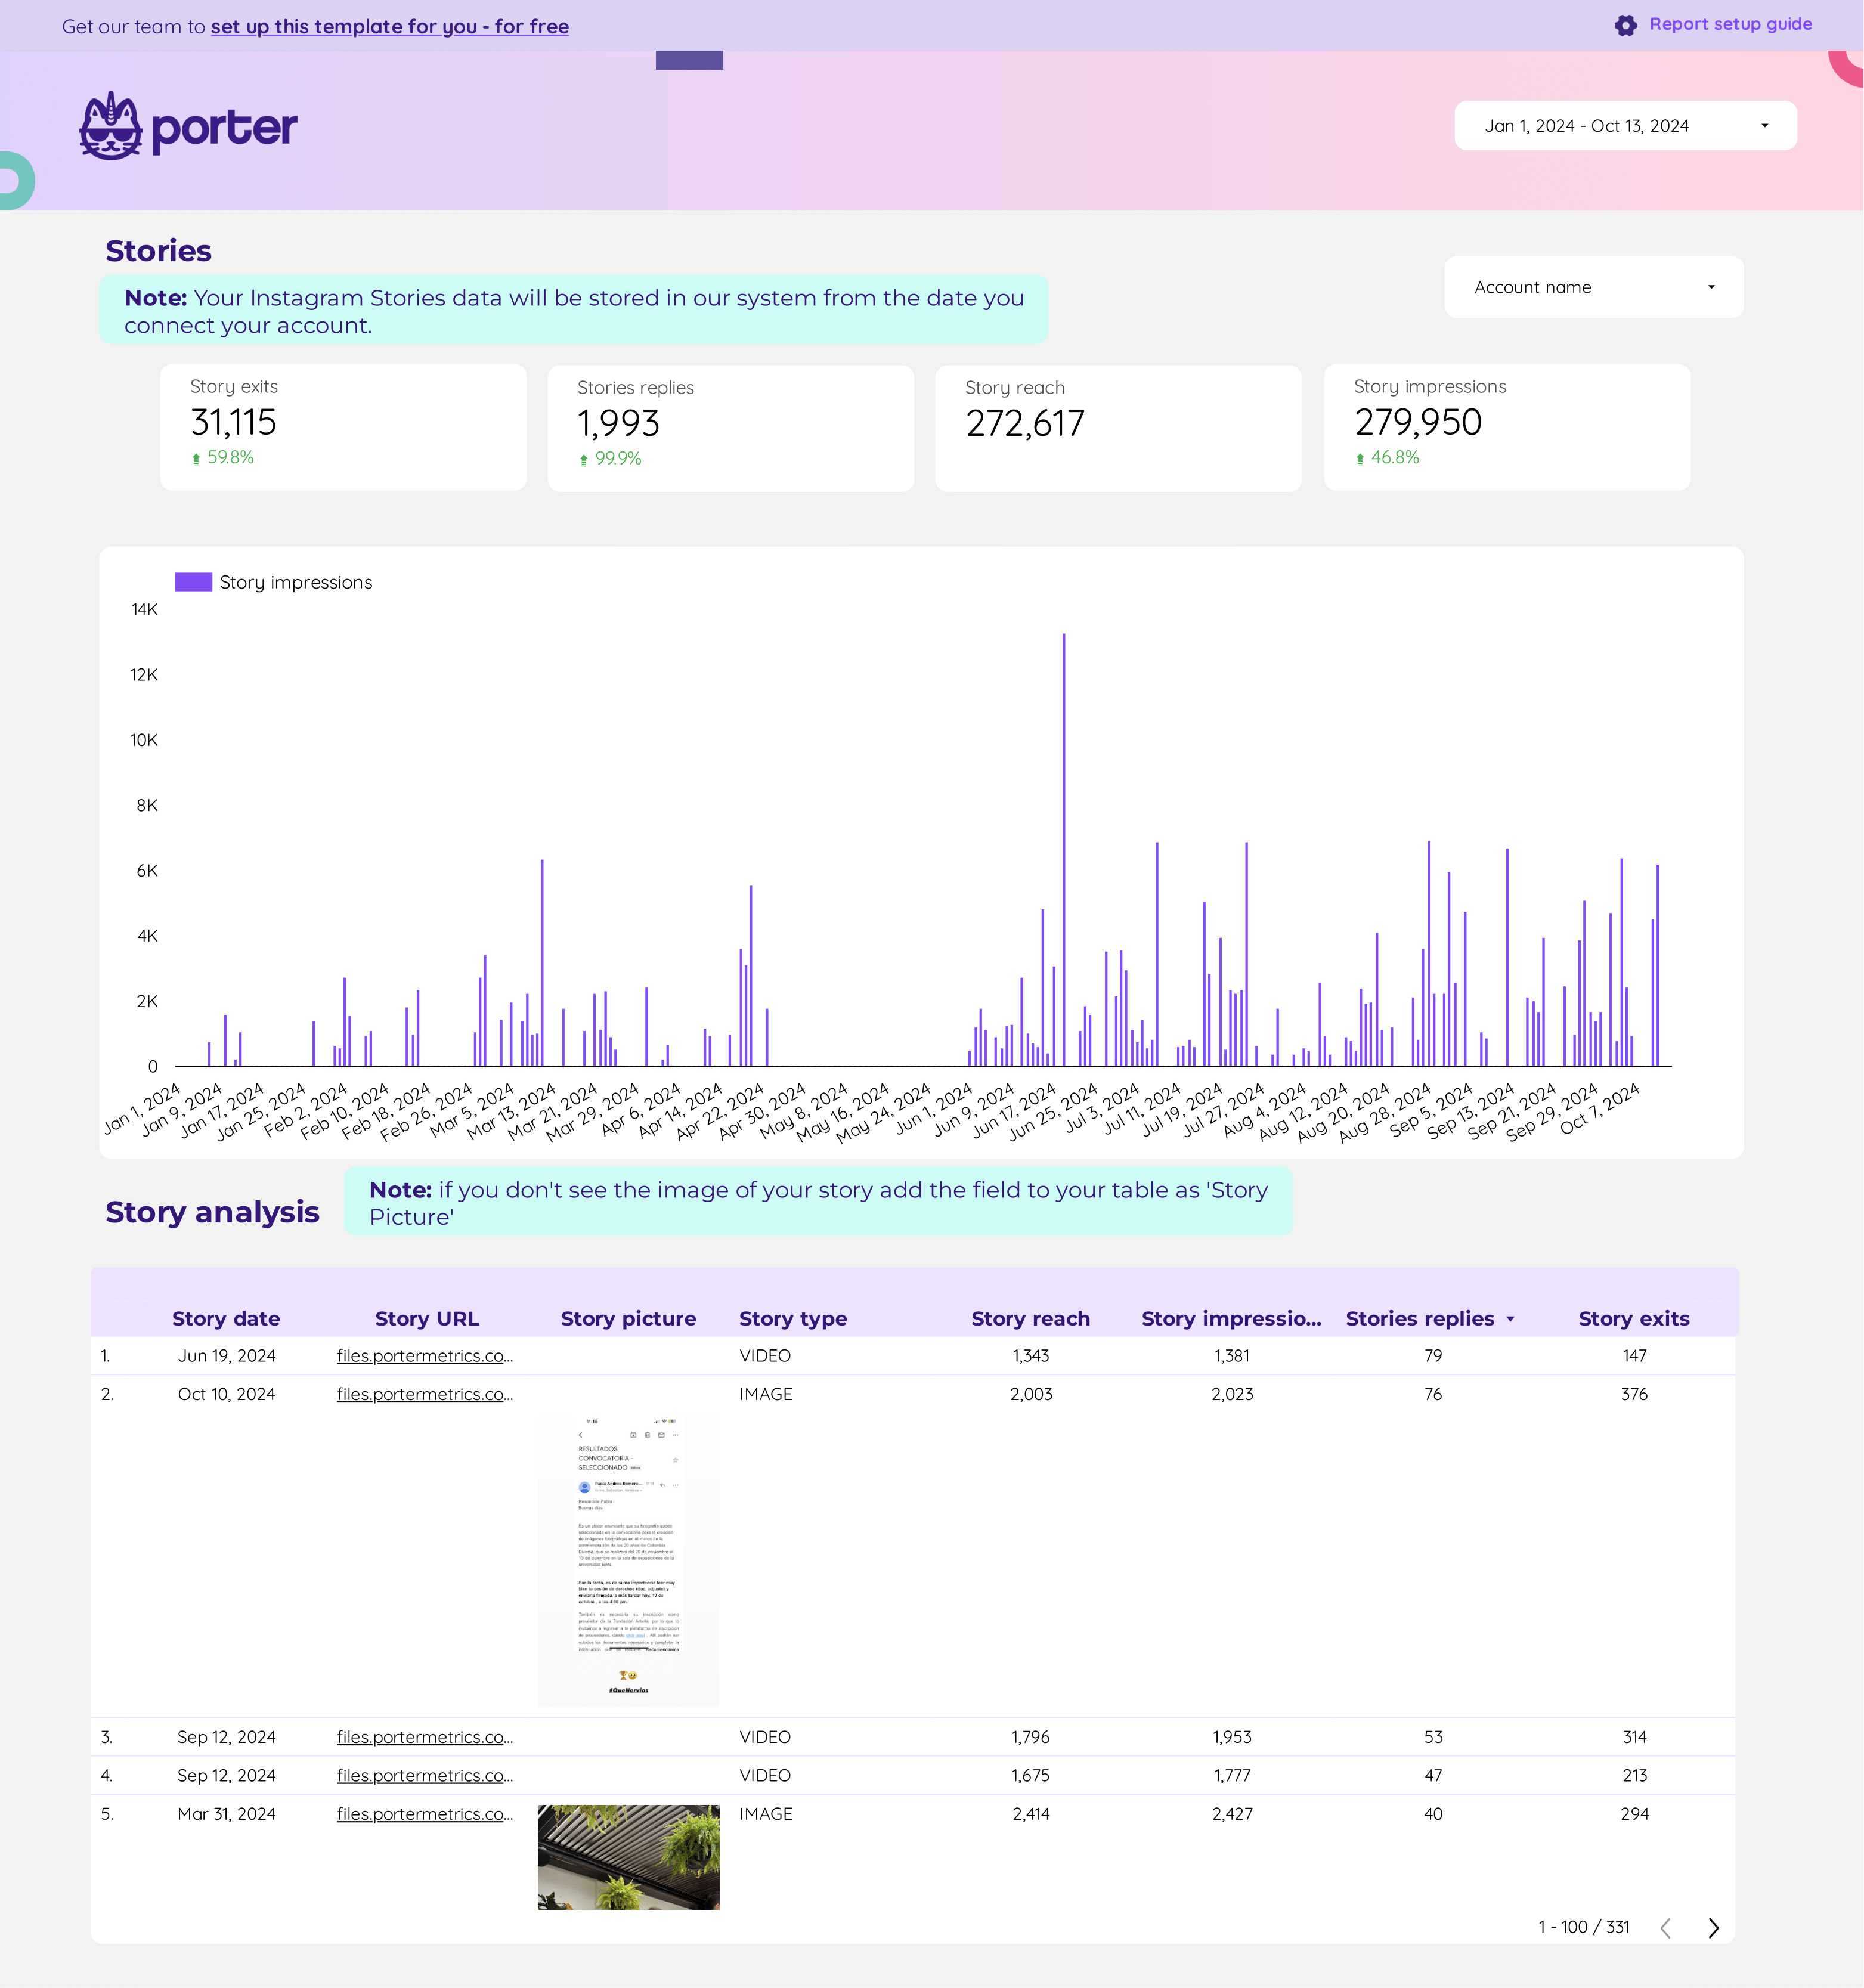
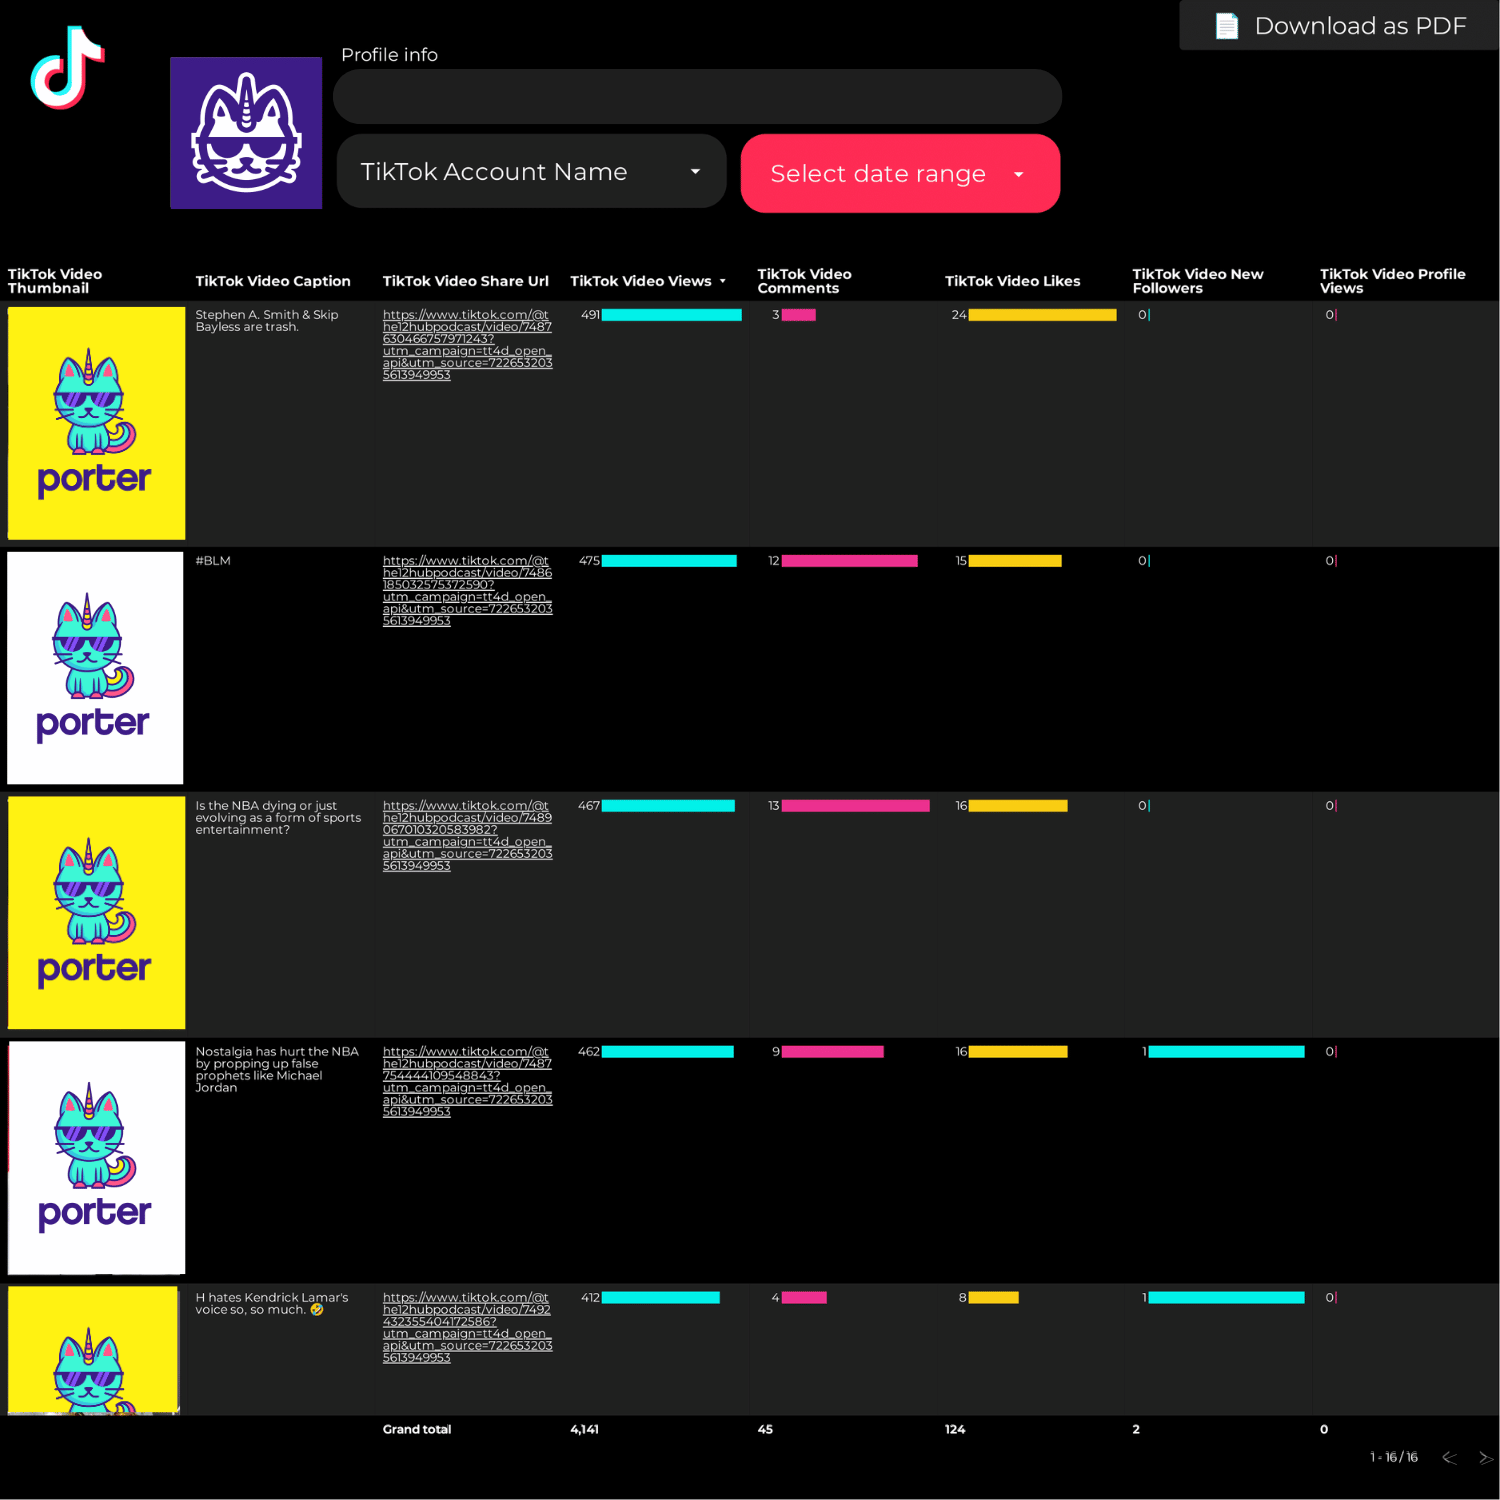
Instagram Insights Stories Report template for Marketing teams and agencies
Analyze key metrics with the Instagram Insights Stories report template. Track conversion rates, CPA, AOV, likes, shares, comments, impressions, reach, and CTR. Segment by audience, media type, and time. Ideal for marketing teams to consolidate strategies and assess performance using Instagram Insights and social media analytics.
LinkedIn Pages Report template for Marketing teams and agencies
Optimize your LinkedIn Pages strategy with this report template. Track CTR, conversion rate, and engagement. Analyze metrics by audience, objectives, and channels. Measure performance across demographics and timeframes. Perfect for marketing teams to refine strategies and achieve LinkedIn goals.
Brand awareness Report template for Marketing teams and agencies
Awareness report template consolidates key metrics like CTR, CPA, and conversion rate from Social Media, Instagram Insights, and LinkedIn Pages. Analyze demographics, psychographics, and behavior over time. Perfect for marketing teams to track performance and strategy, providing actionable insights into audience engagement and organic search ranking.
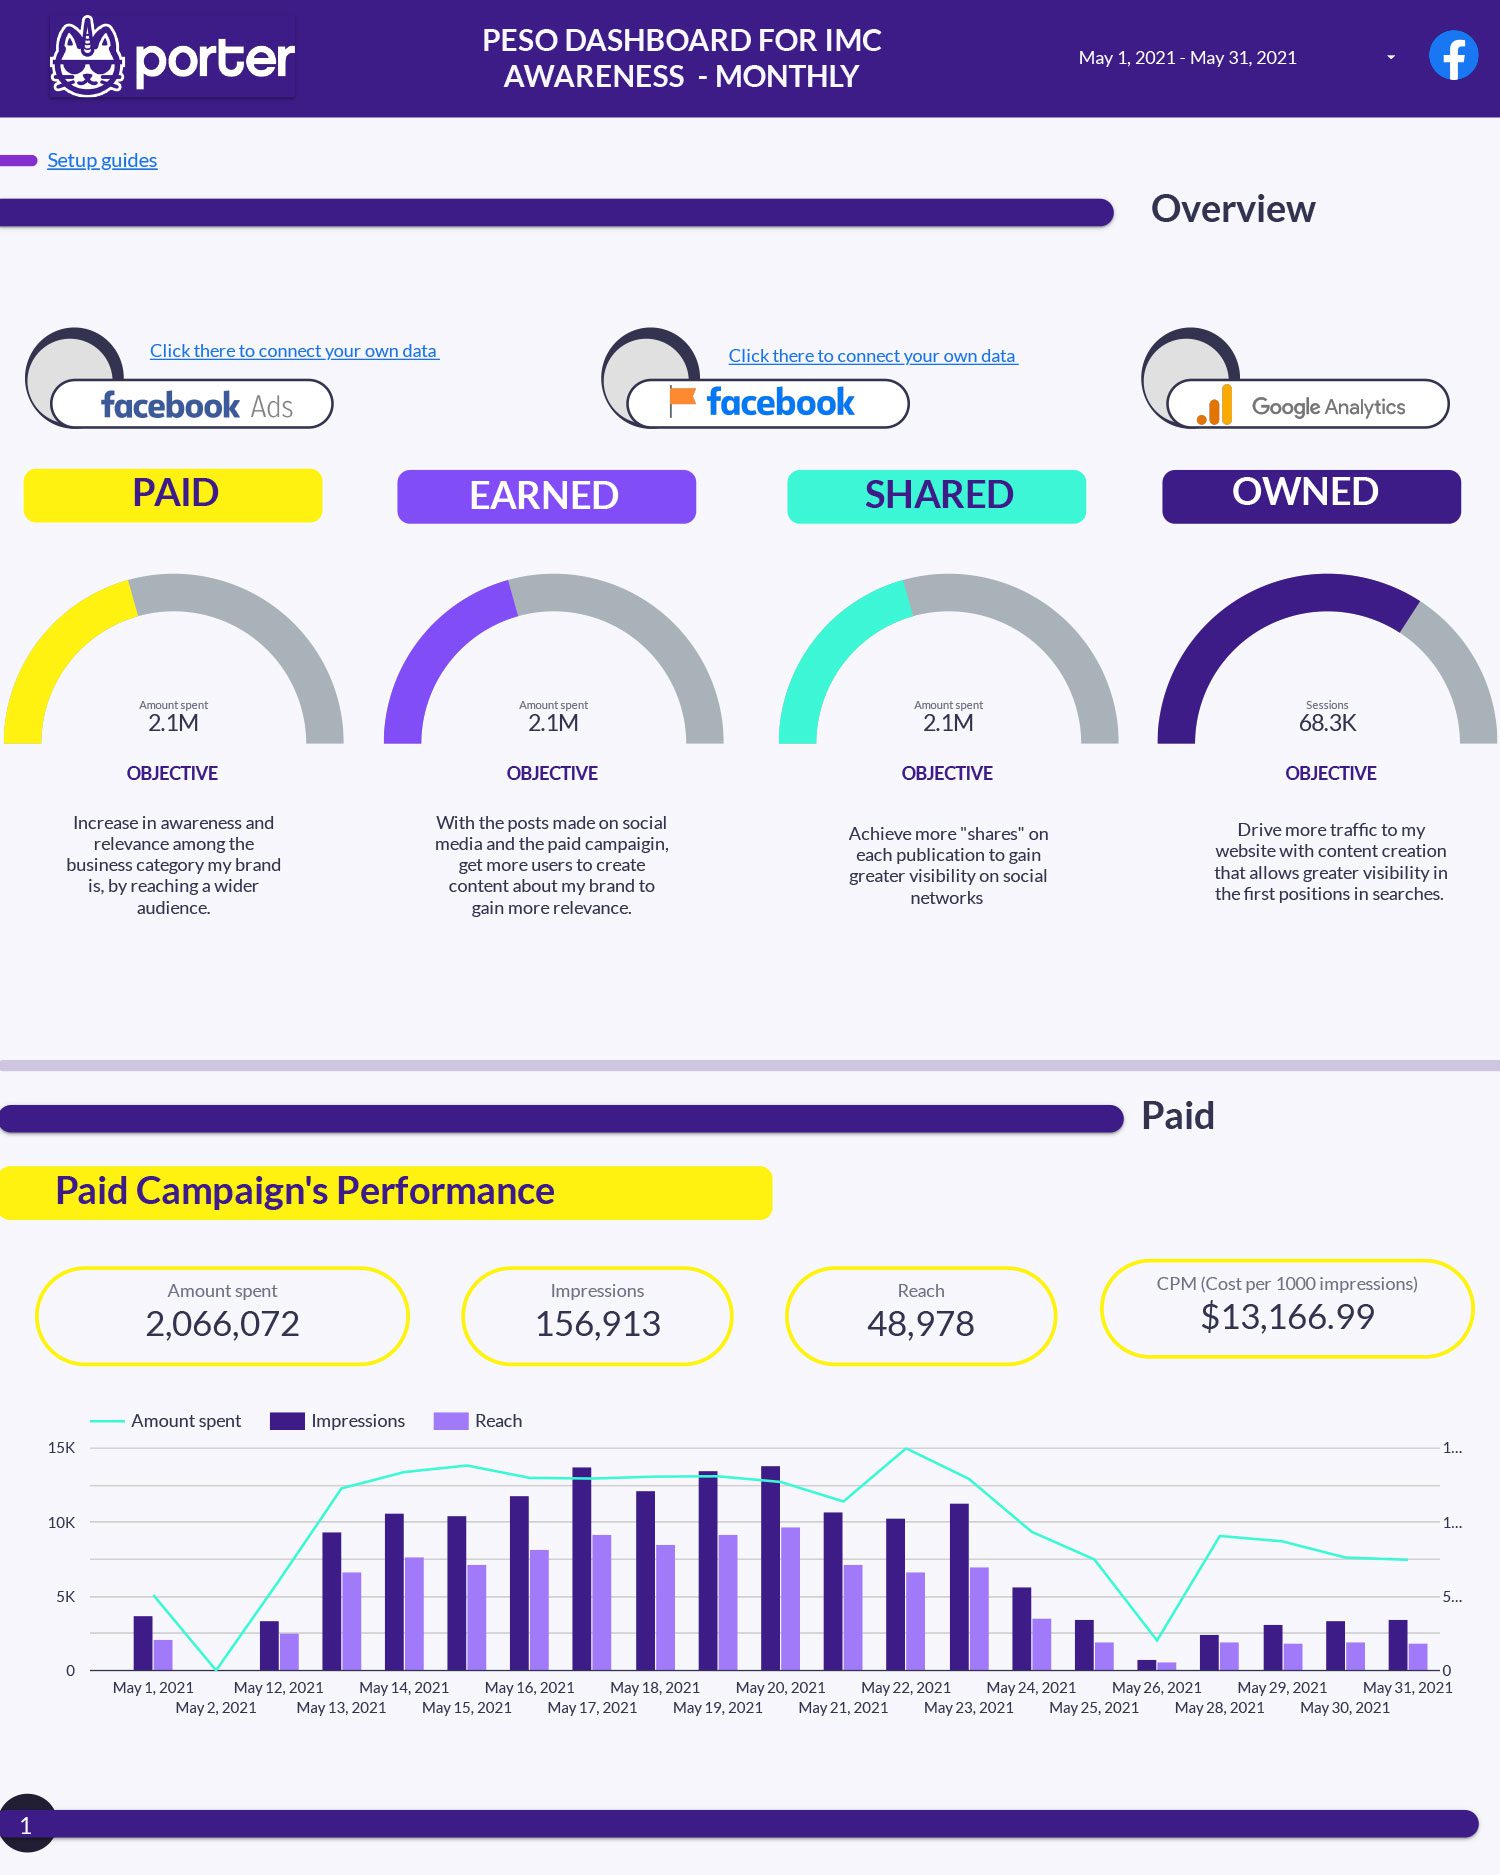
Peso model Report template for Marketing teams and agencies
Analyze key metrics such as leads, conversion rates, and engagement with the Peso model report template. Evaluate campaign performance across Facebook Ads, Instagram Insights, and SEO. Segment by audience demographics and timeframes. Perfect for marketing teams to track e-commerce and social media strategies efficiently.
Community manager Report template for Marketing teams and agencies
Community manager Social Media report template tracks key metrics like conversion rate, cost per conversion, and engagement. Analyze dimensions such as campaign duration, budget, and audience demographics. Monitor likes, shares, and comments across Social Media platforms. Ideal for community managers to consolidate data and refine social media strategy.
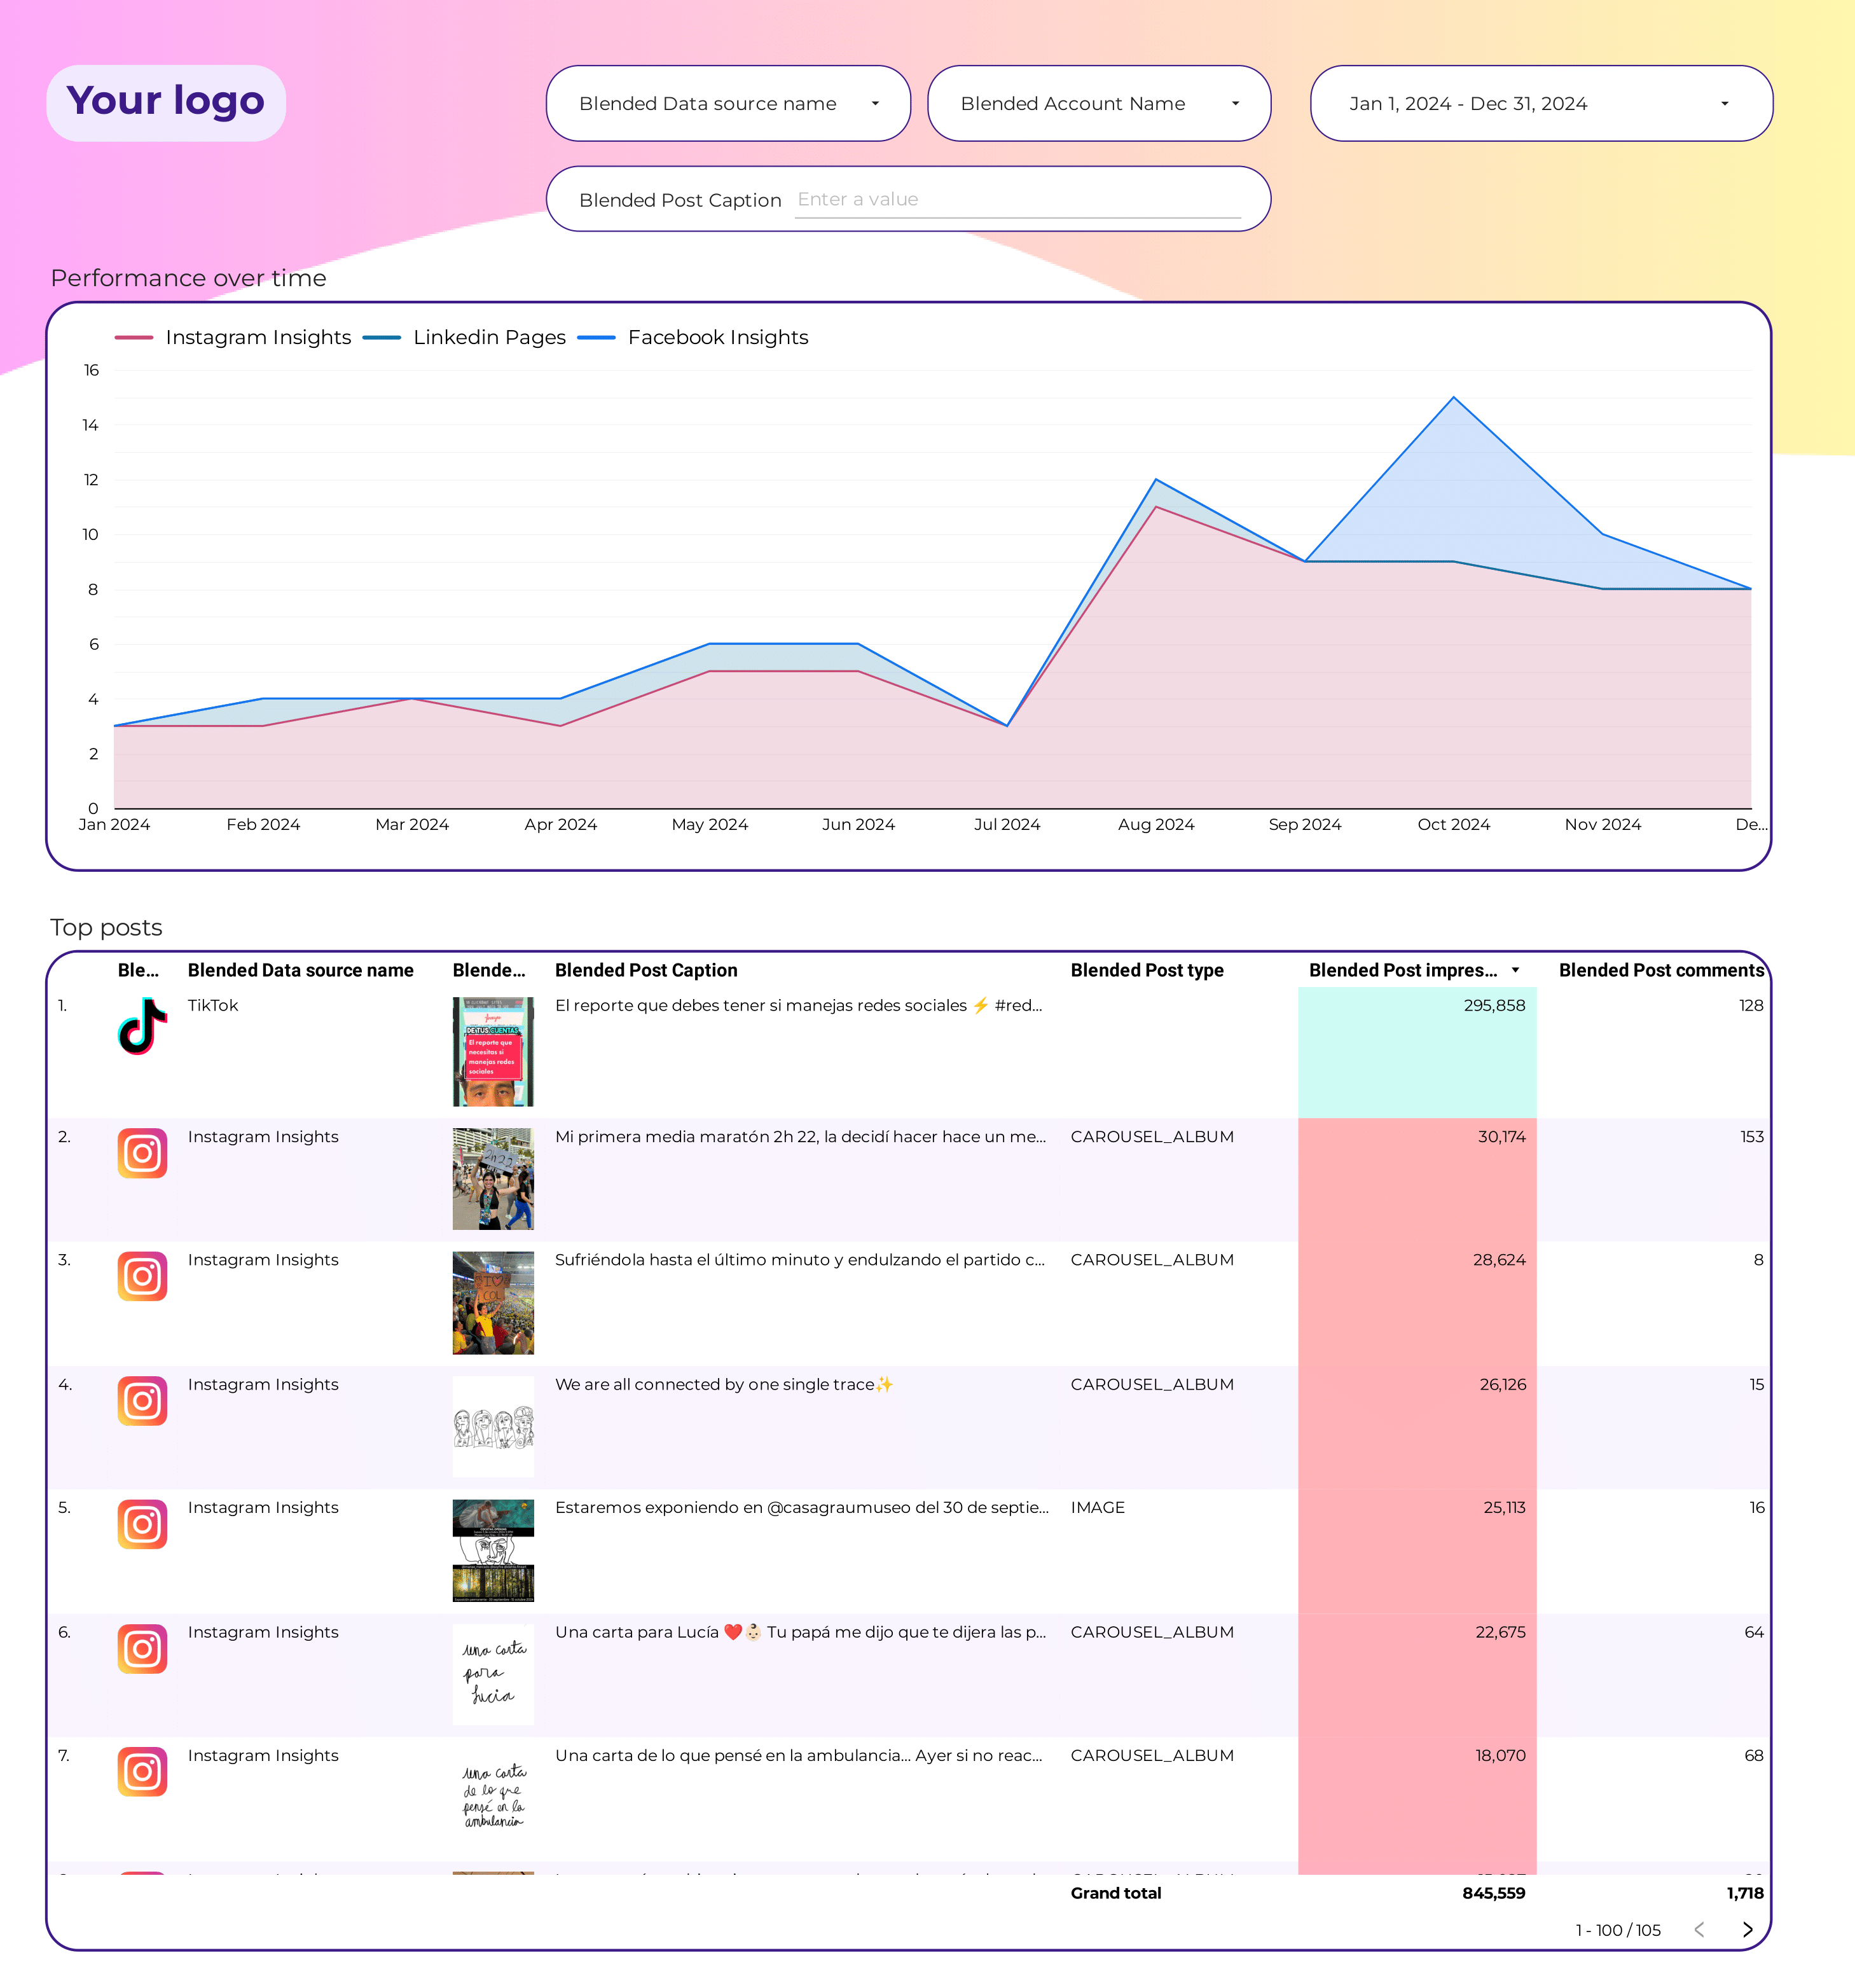
Content performance Report template for Marketing teams and agencies
Optimize your social media strategy with the Content performance report template. Track conversion rates, engagement, and audience demographics using data from Google Analytics 4, Instagram Insights, and Facebook Insights. Analyze key metrics by campaign, duration, and time. Perfect for marketing teams to measure performance and achieve objectives efficiently.
Creator marketing Report template for Marketing teams and agencies
Track key metrics like CTR, conversion rate, and ROAS with the Creator marketing report template. Analyze audience breakdowns by demographics, psychographics, and behavior. Measure engagement through likes, shares, and comments. Utilize data from Social Media, Instagram Insights, and LinkedIn Pages. Optimize strategy with actionable insights segmented by time periods. Ideal for marketing teams.
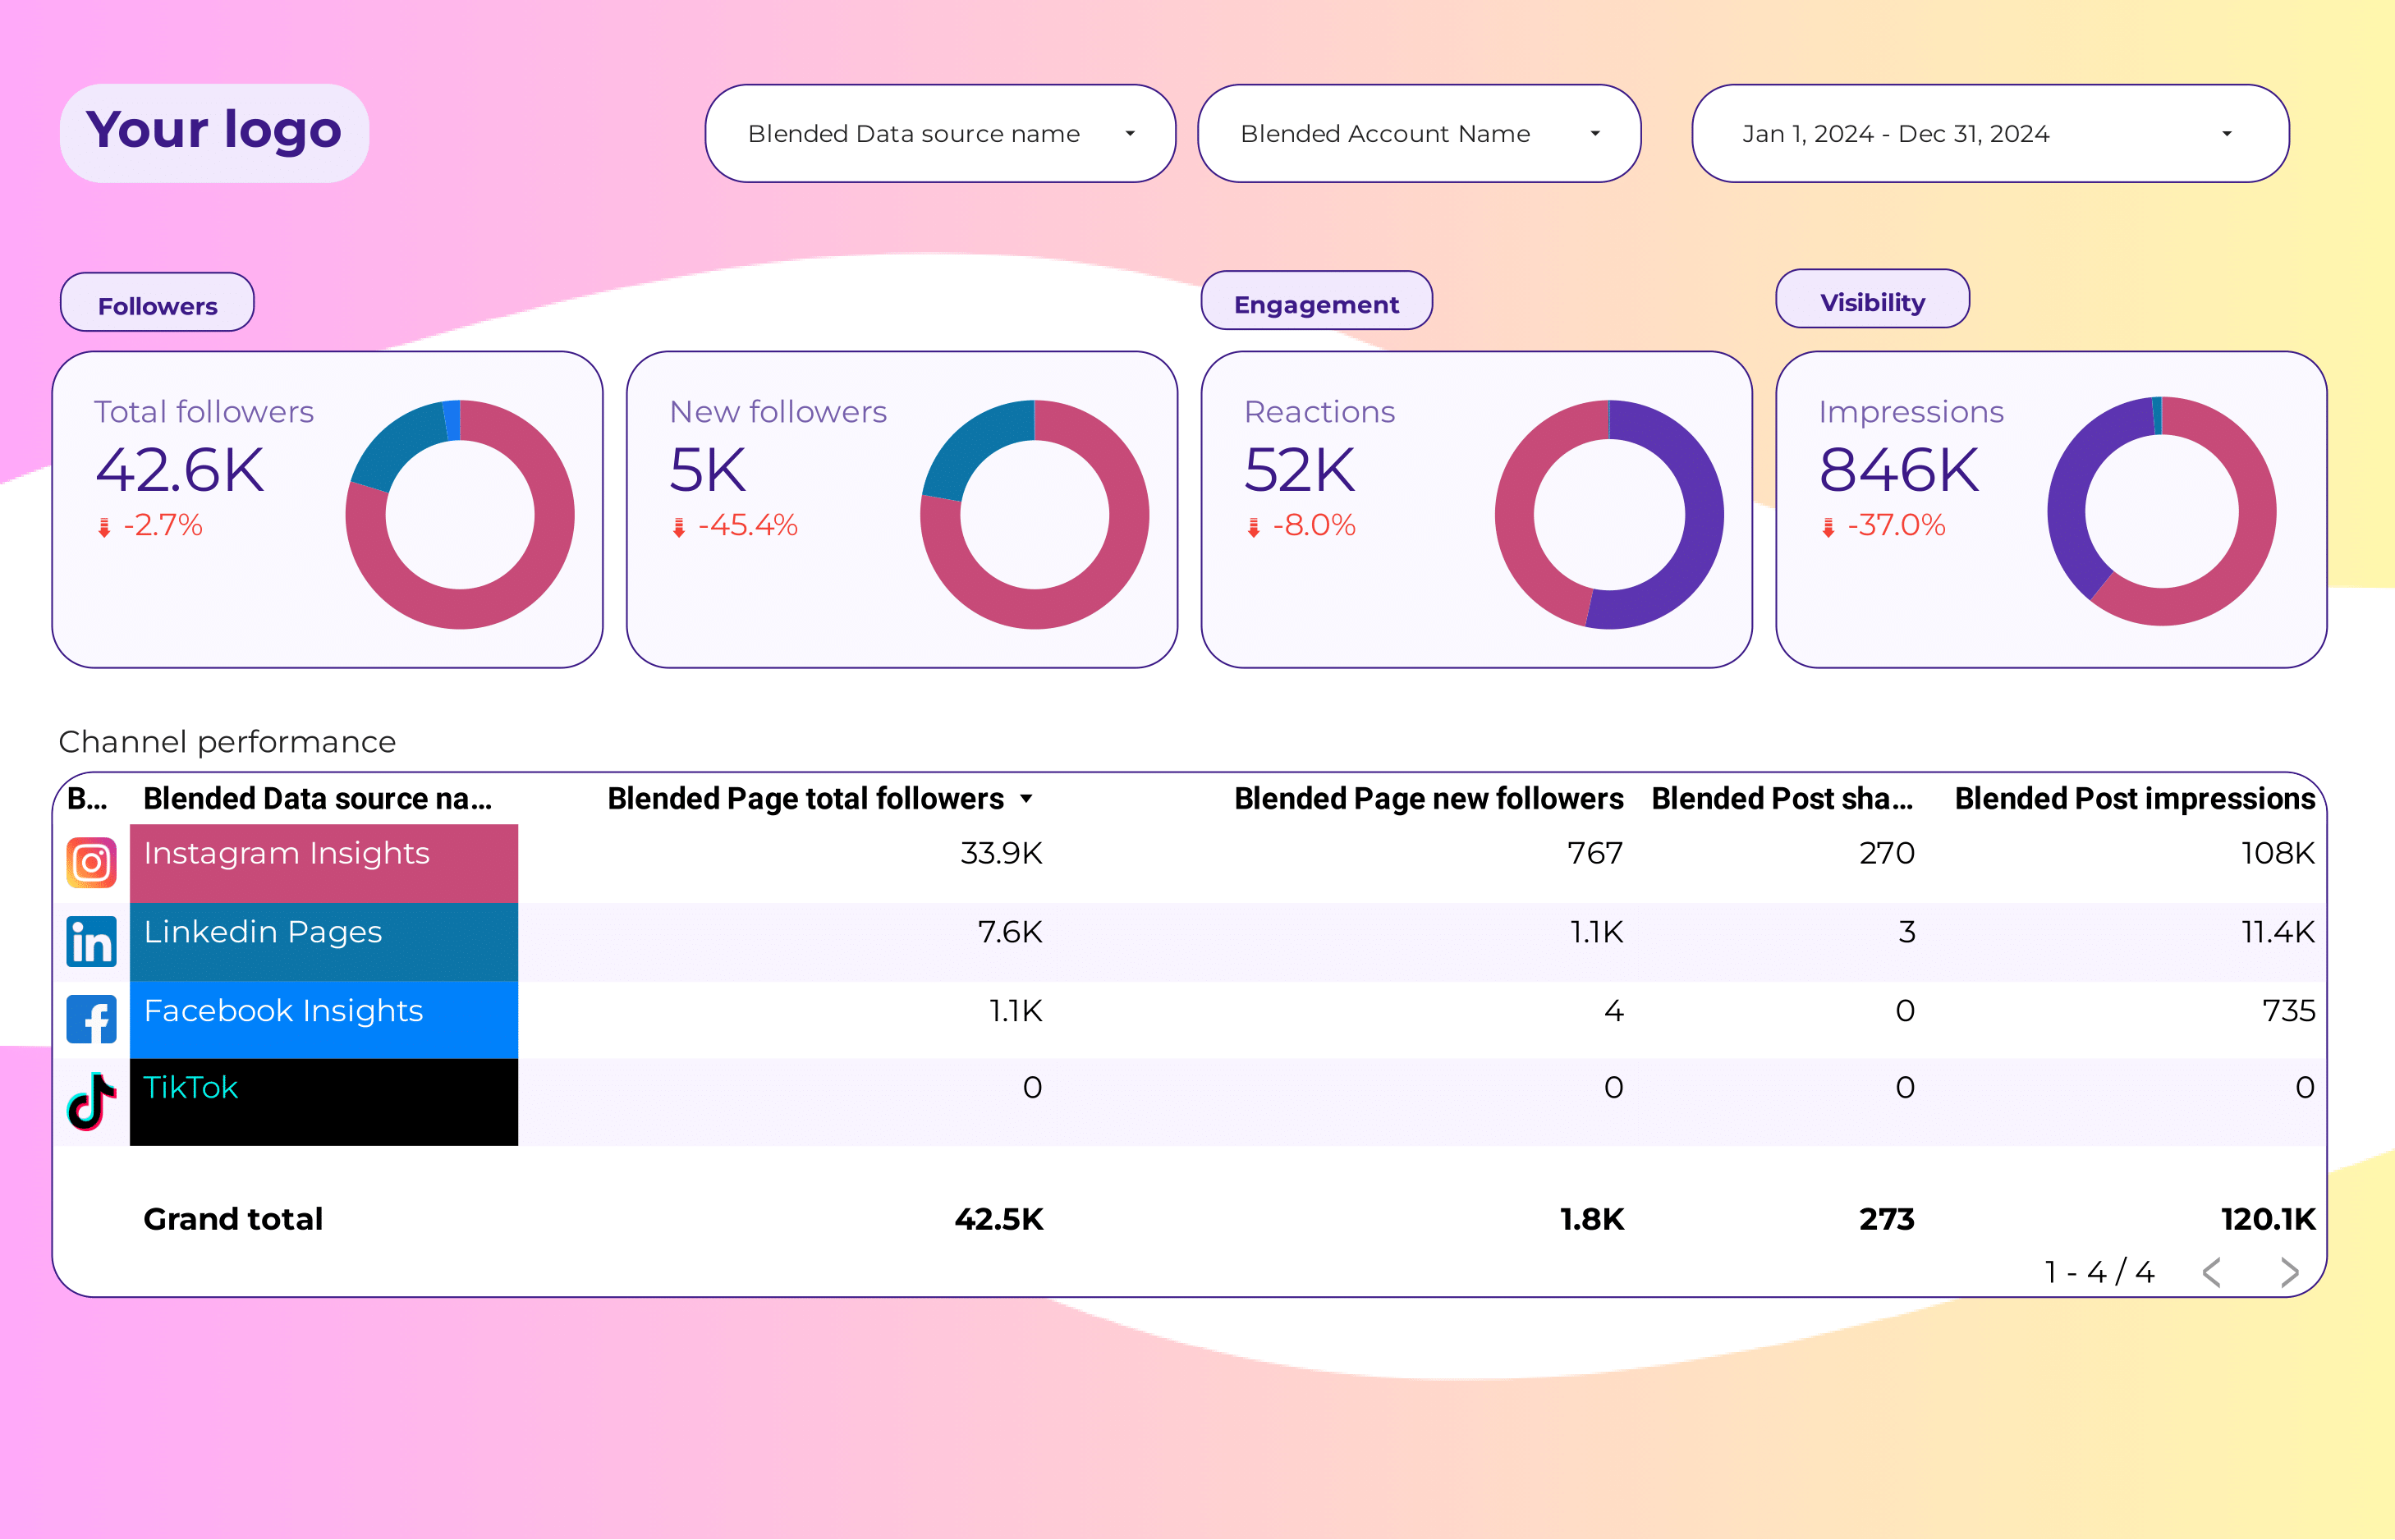
Social Media Report template for Marketing teams and agencies
Optimize your strategy with this Social Media report template. Analyze conversion rates, ROAS, and engagement metrics from Instagram Insights and LinkedIn Pages. Track key metrics like likes, comments, and shares. Segment by audience, age, and location. Perfect for marketing teams to measure performance and achieve specific goals.
Engagement rate Report template for Marketing teams and agencies
Engagement rate report template consolidates key metrics like CTR, conversion rate, and CPA from social media, Instagram Insights, and LinkedIn Pages. Analyze by time, channel, and audience demographics. Perfect for marketing teams to track performance and refine strategies.
Social Media Client presentation Report template for Marketing teams and agencies
Analyze key metrics with this Social Media Client presentation report template. Track conversion rates, engagement, and audience insights from Instagram and Facebook. Segment data by campaign, demographics, and time. Perfect for agencies to present actionable insights and performance, aligning with marketing goals and strategies.
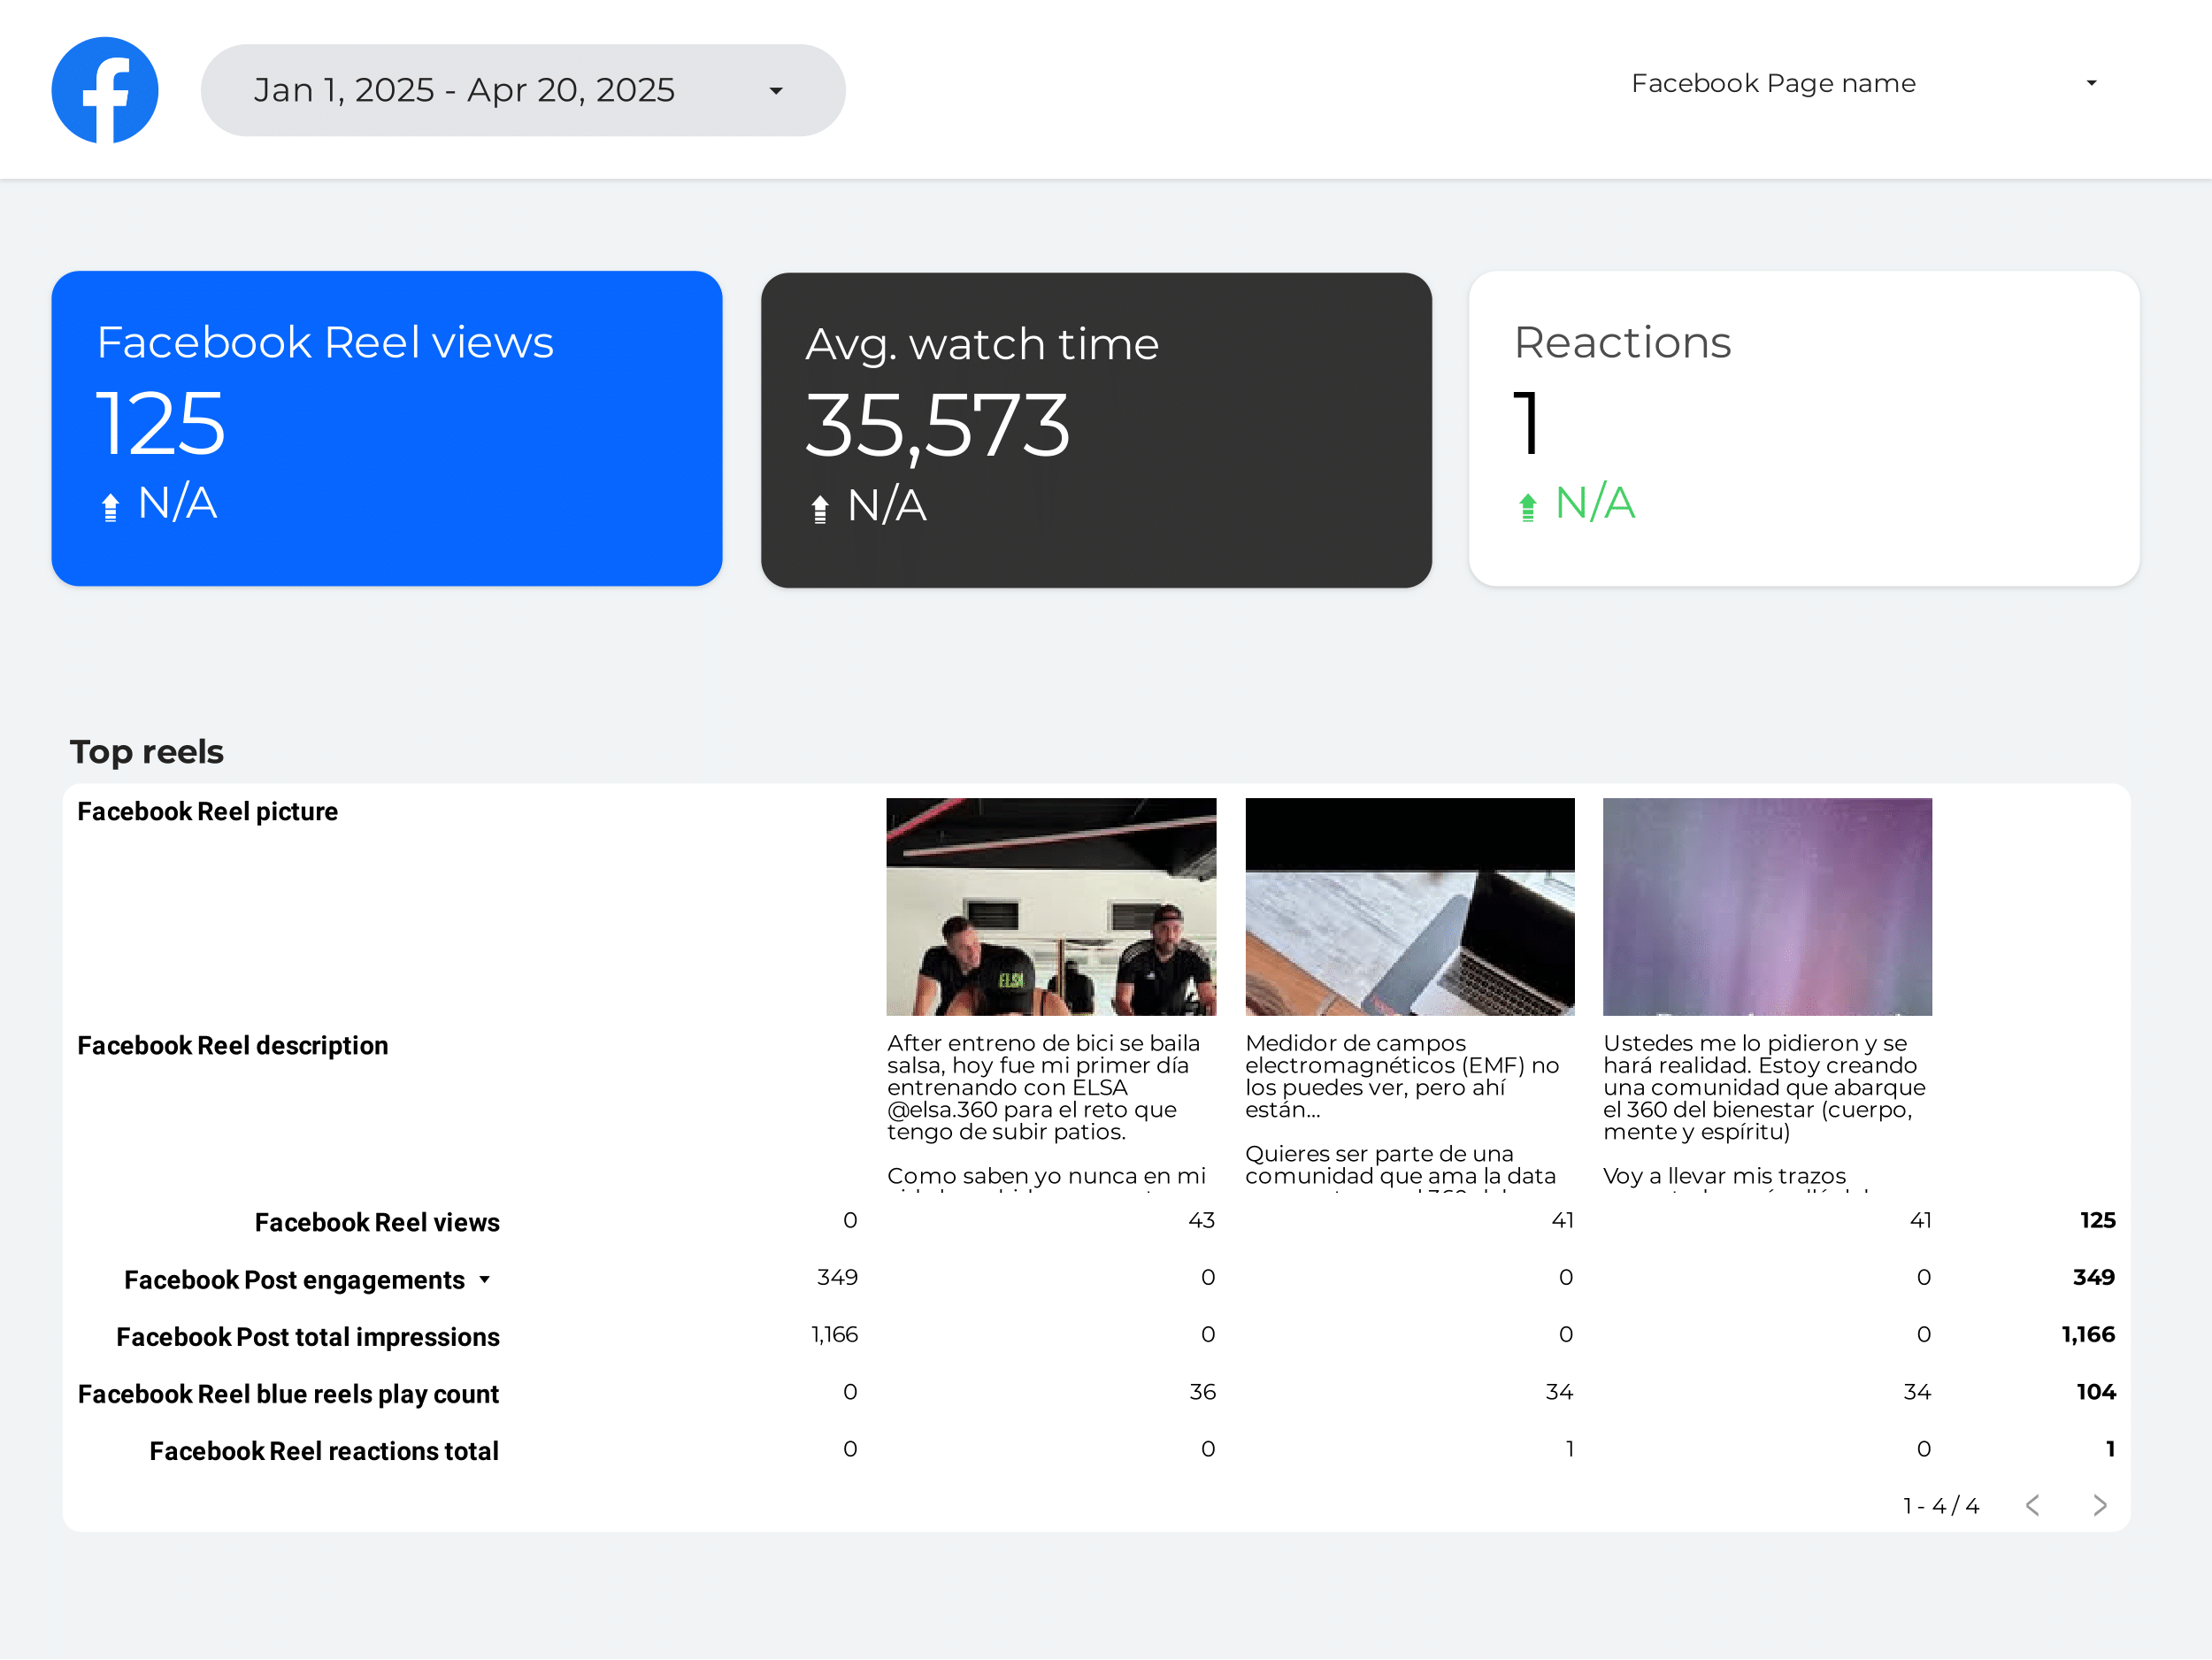
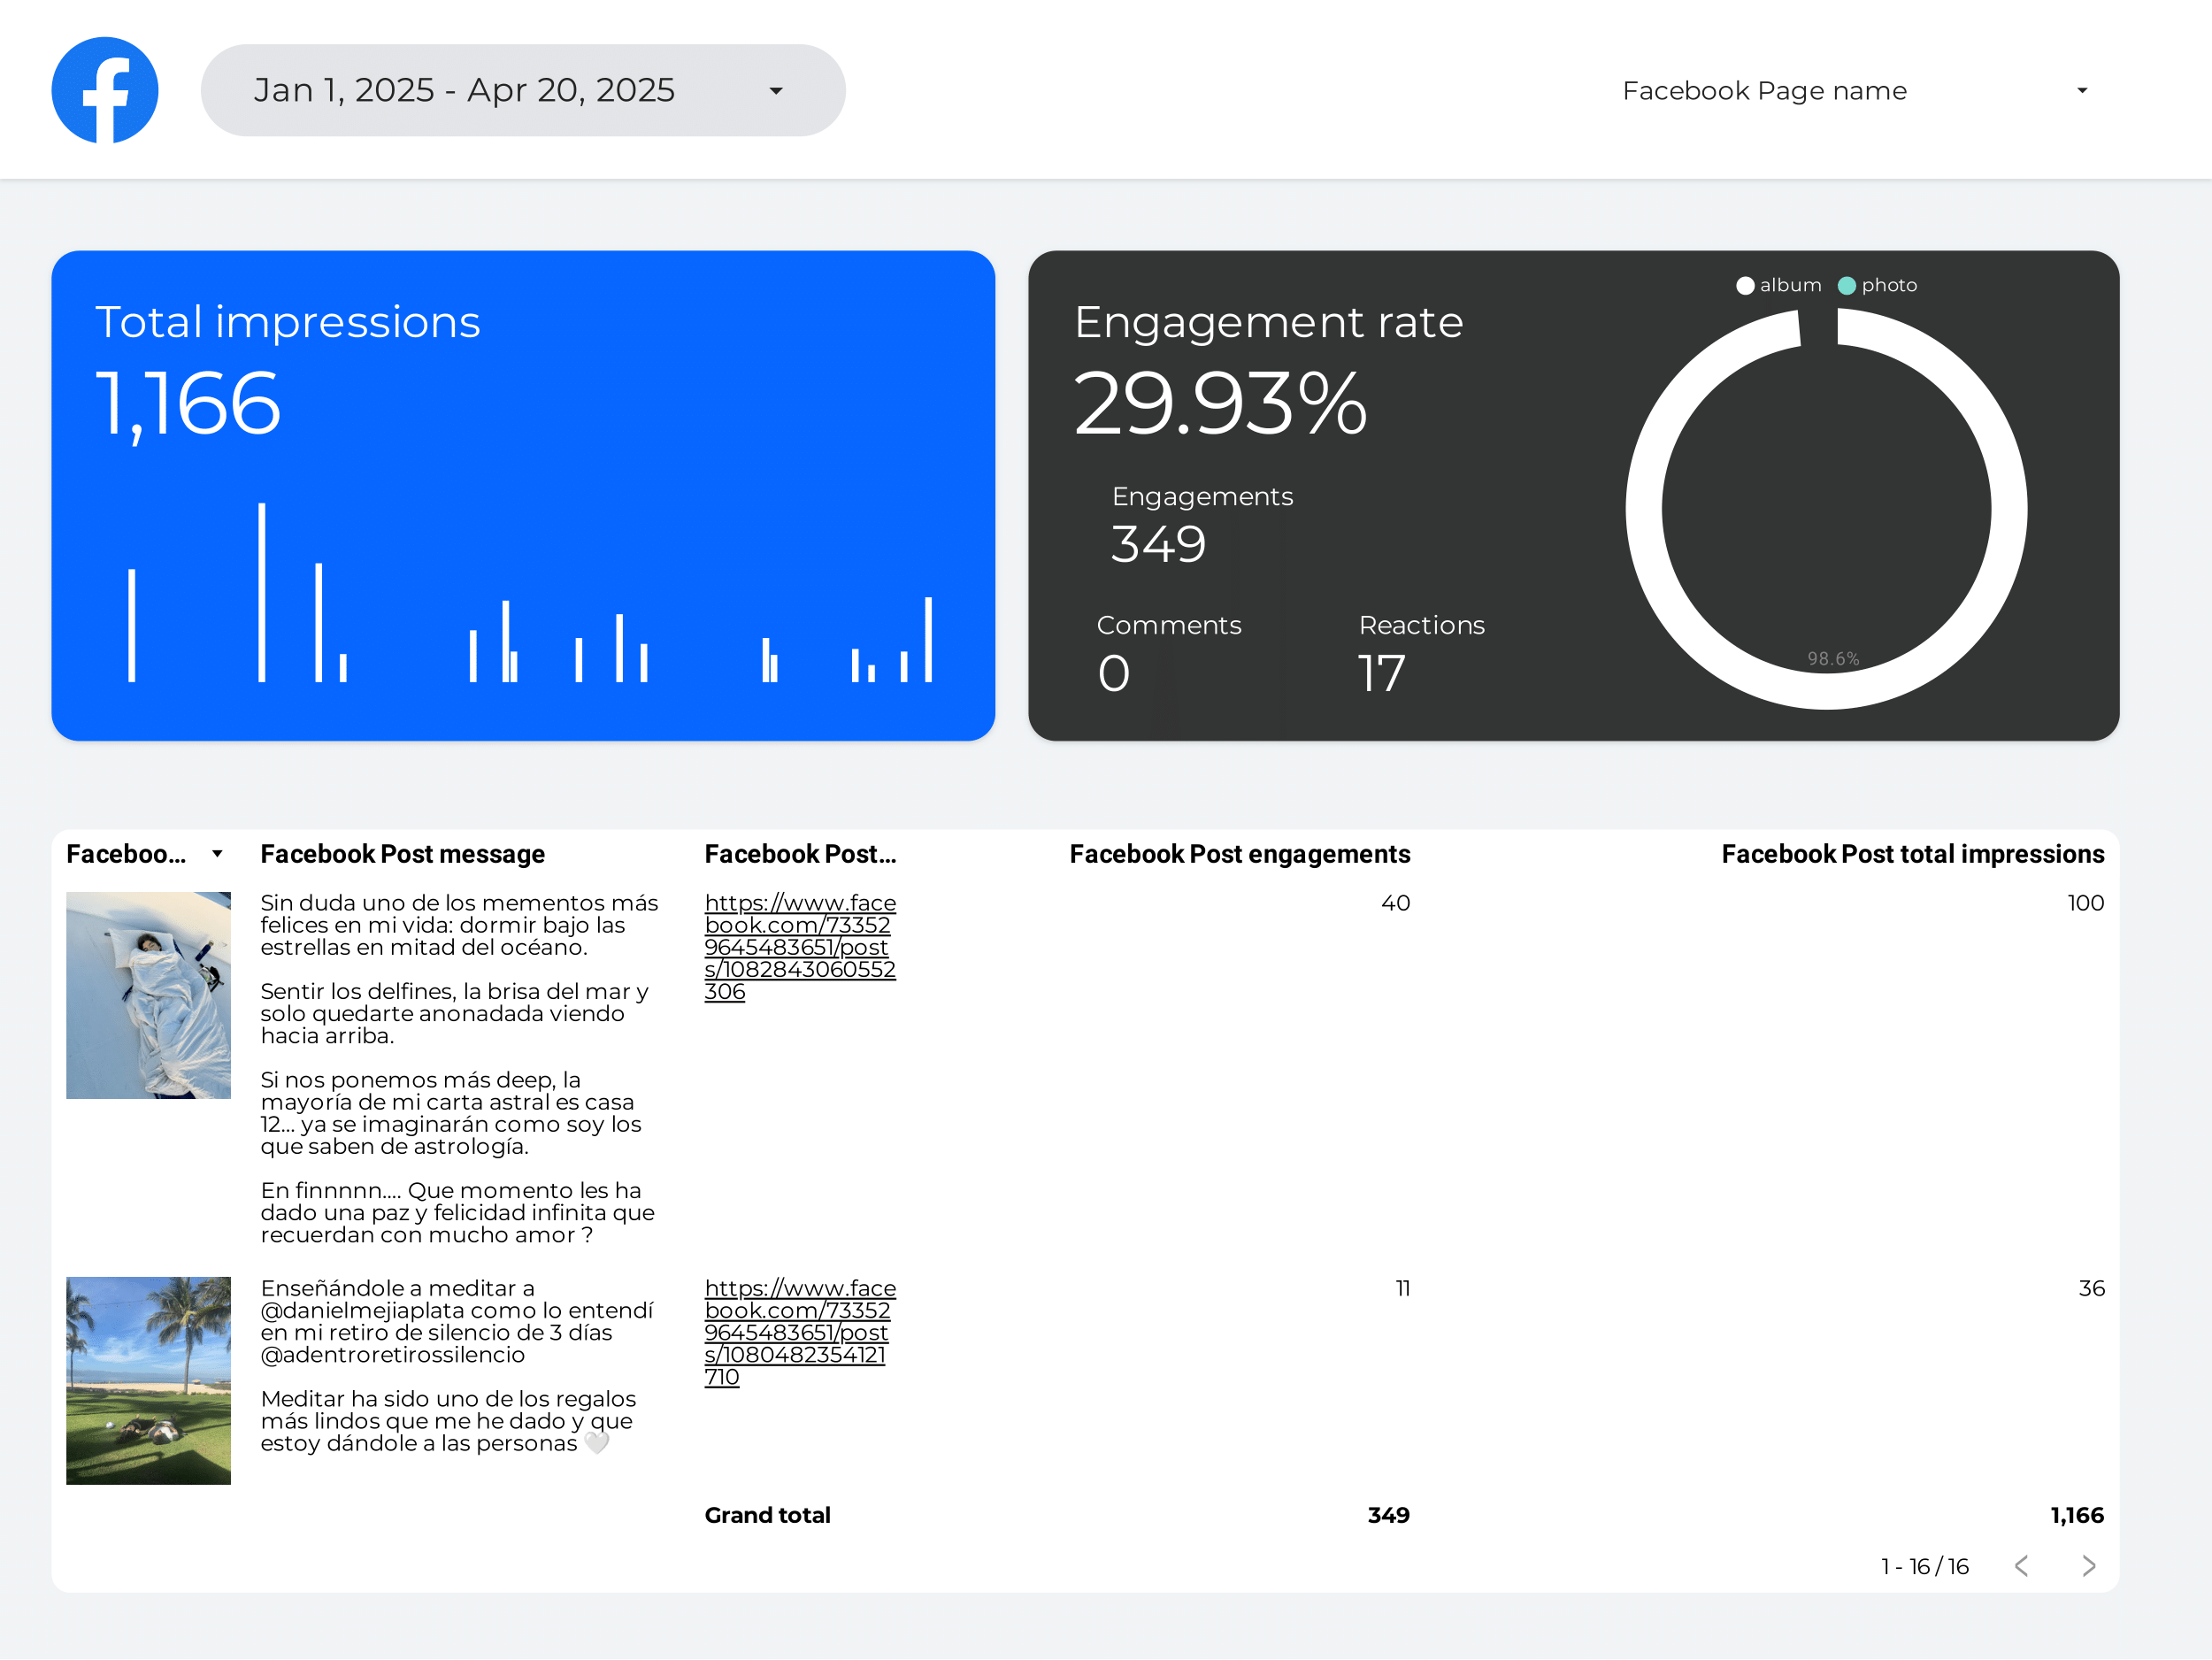
Facebook Insights Report template for Marketing teams and agencies
Optimize your social media strategy with this Facebook Insights report template. Track CTR, conversion rate, and engagement. Analyze metrics by age, gender, and location. View insights by hour, day, or month. Perfect for marketing teams to measure performance and achieve objectives.
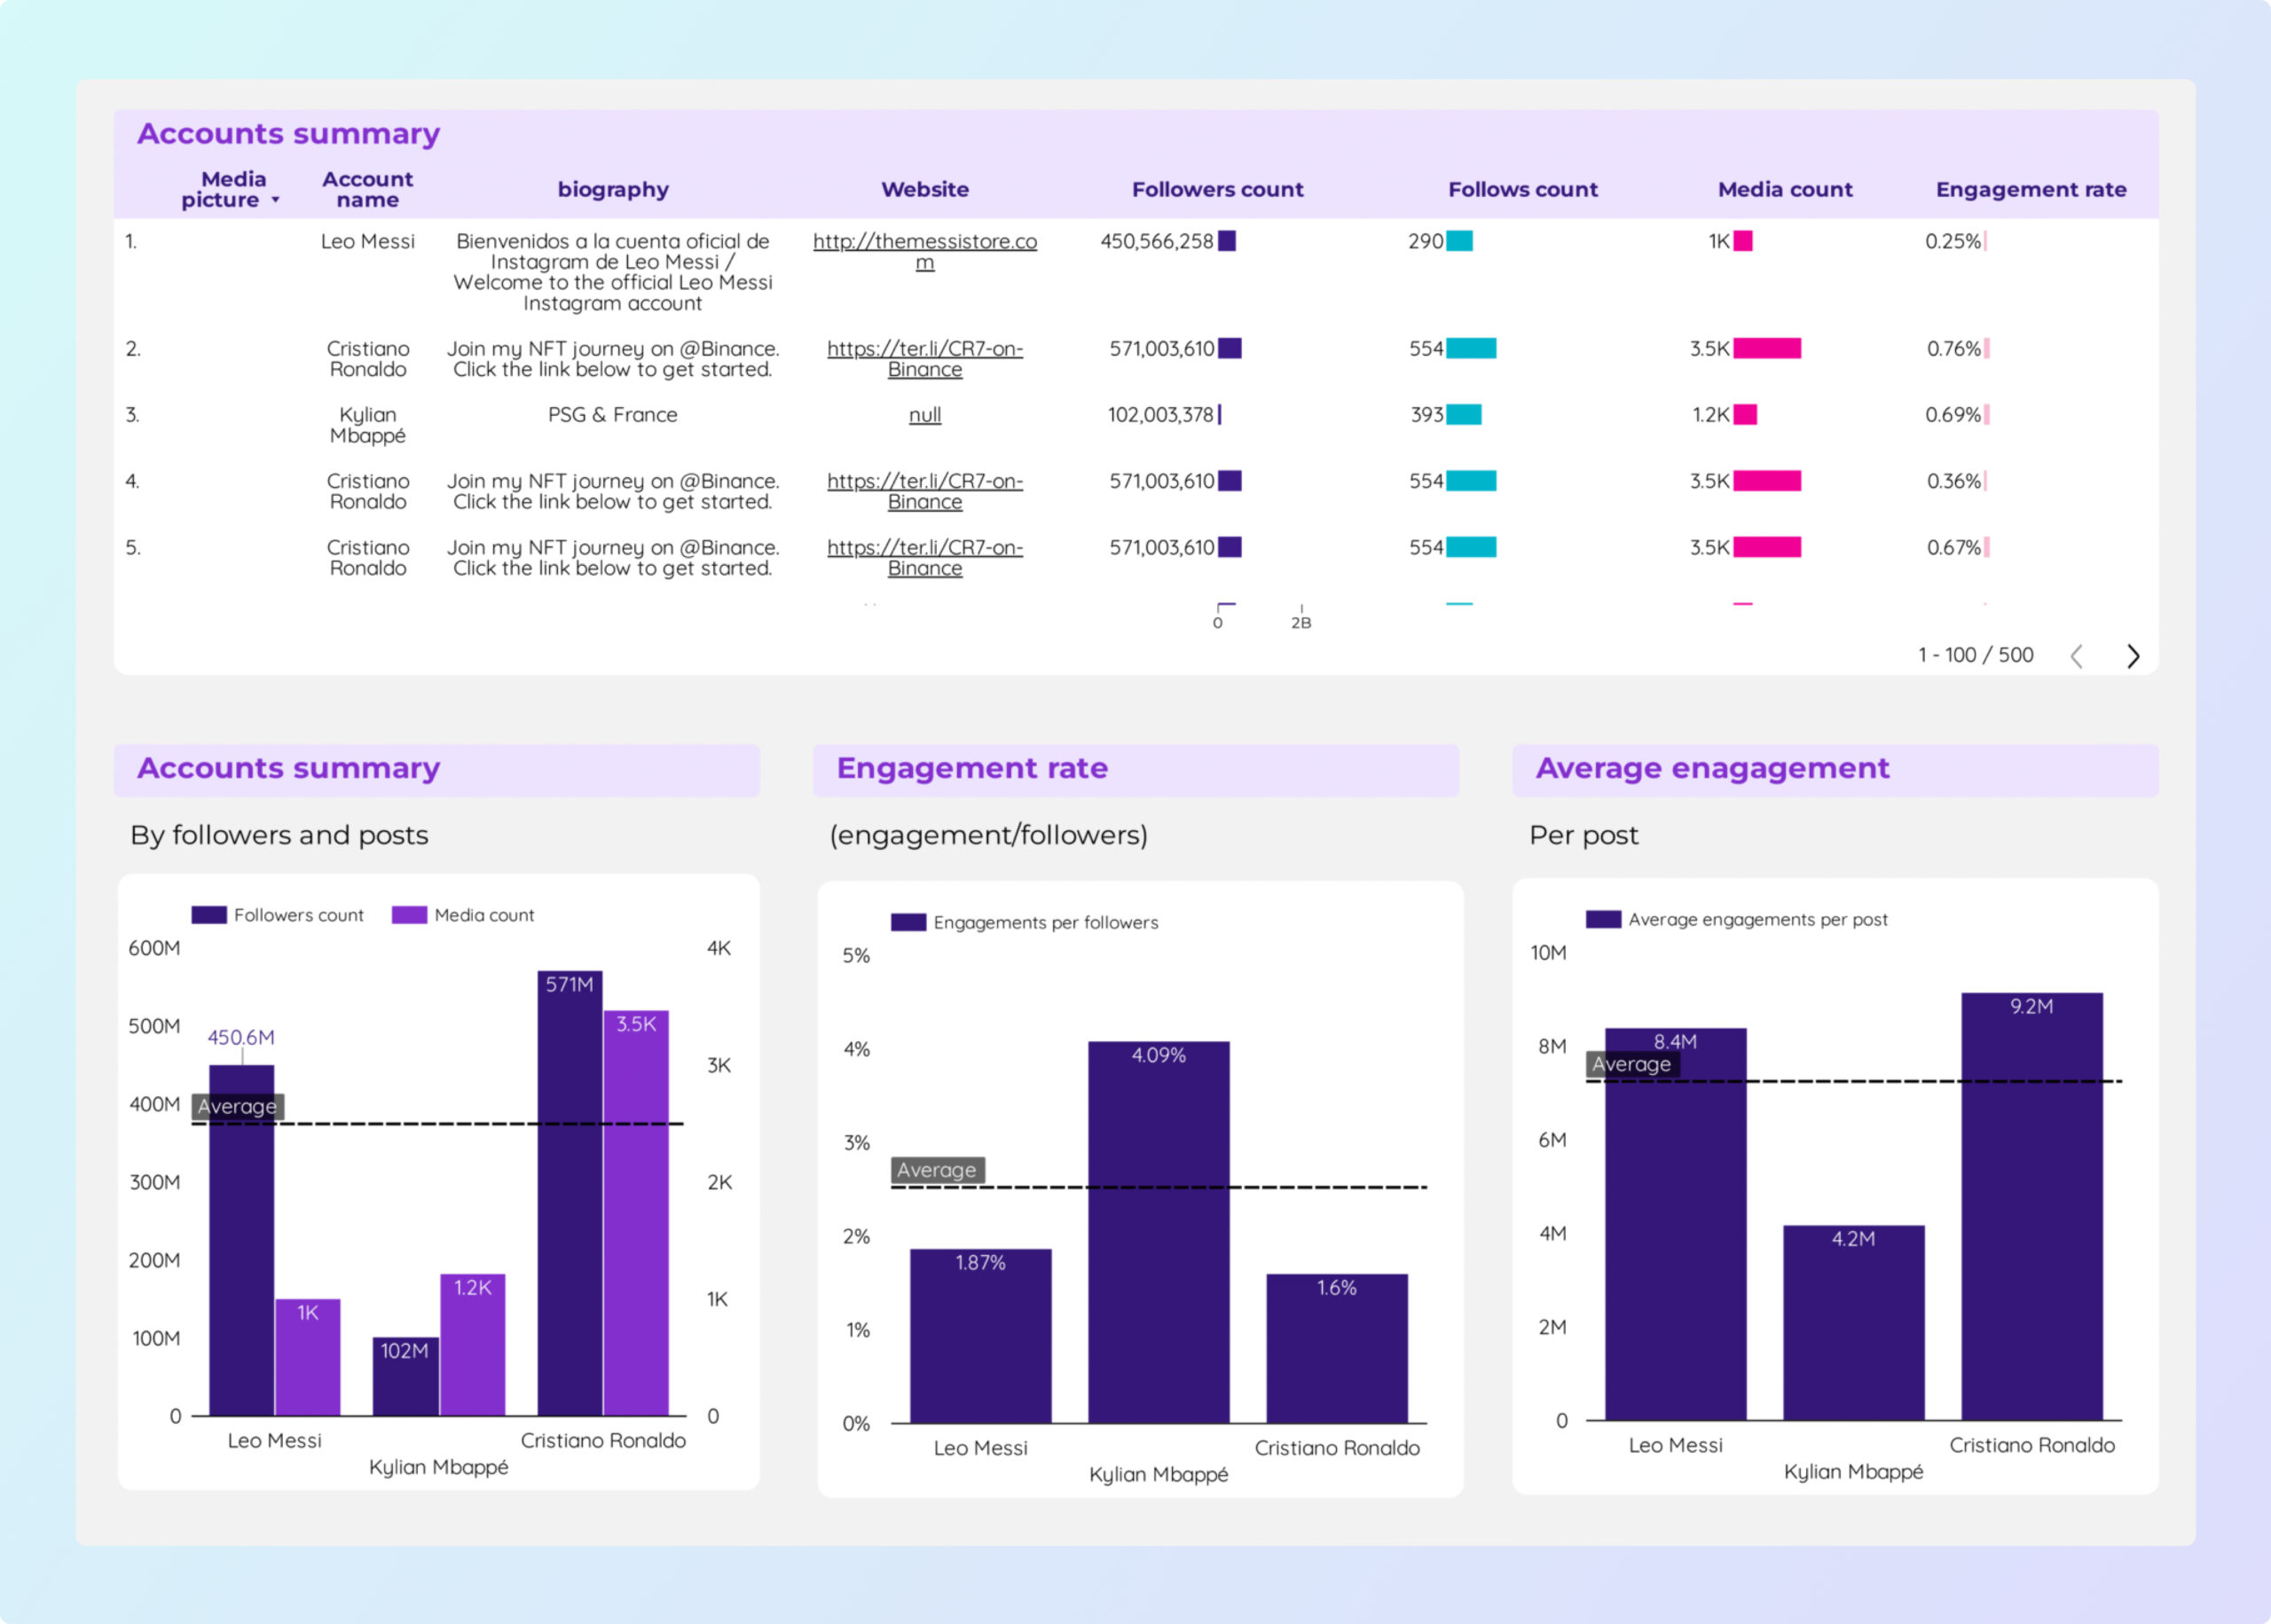
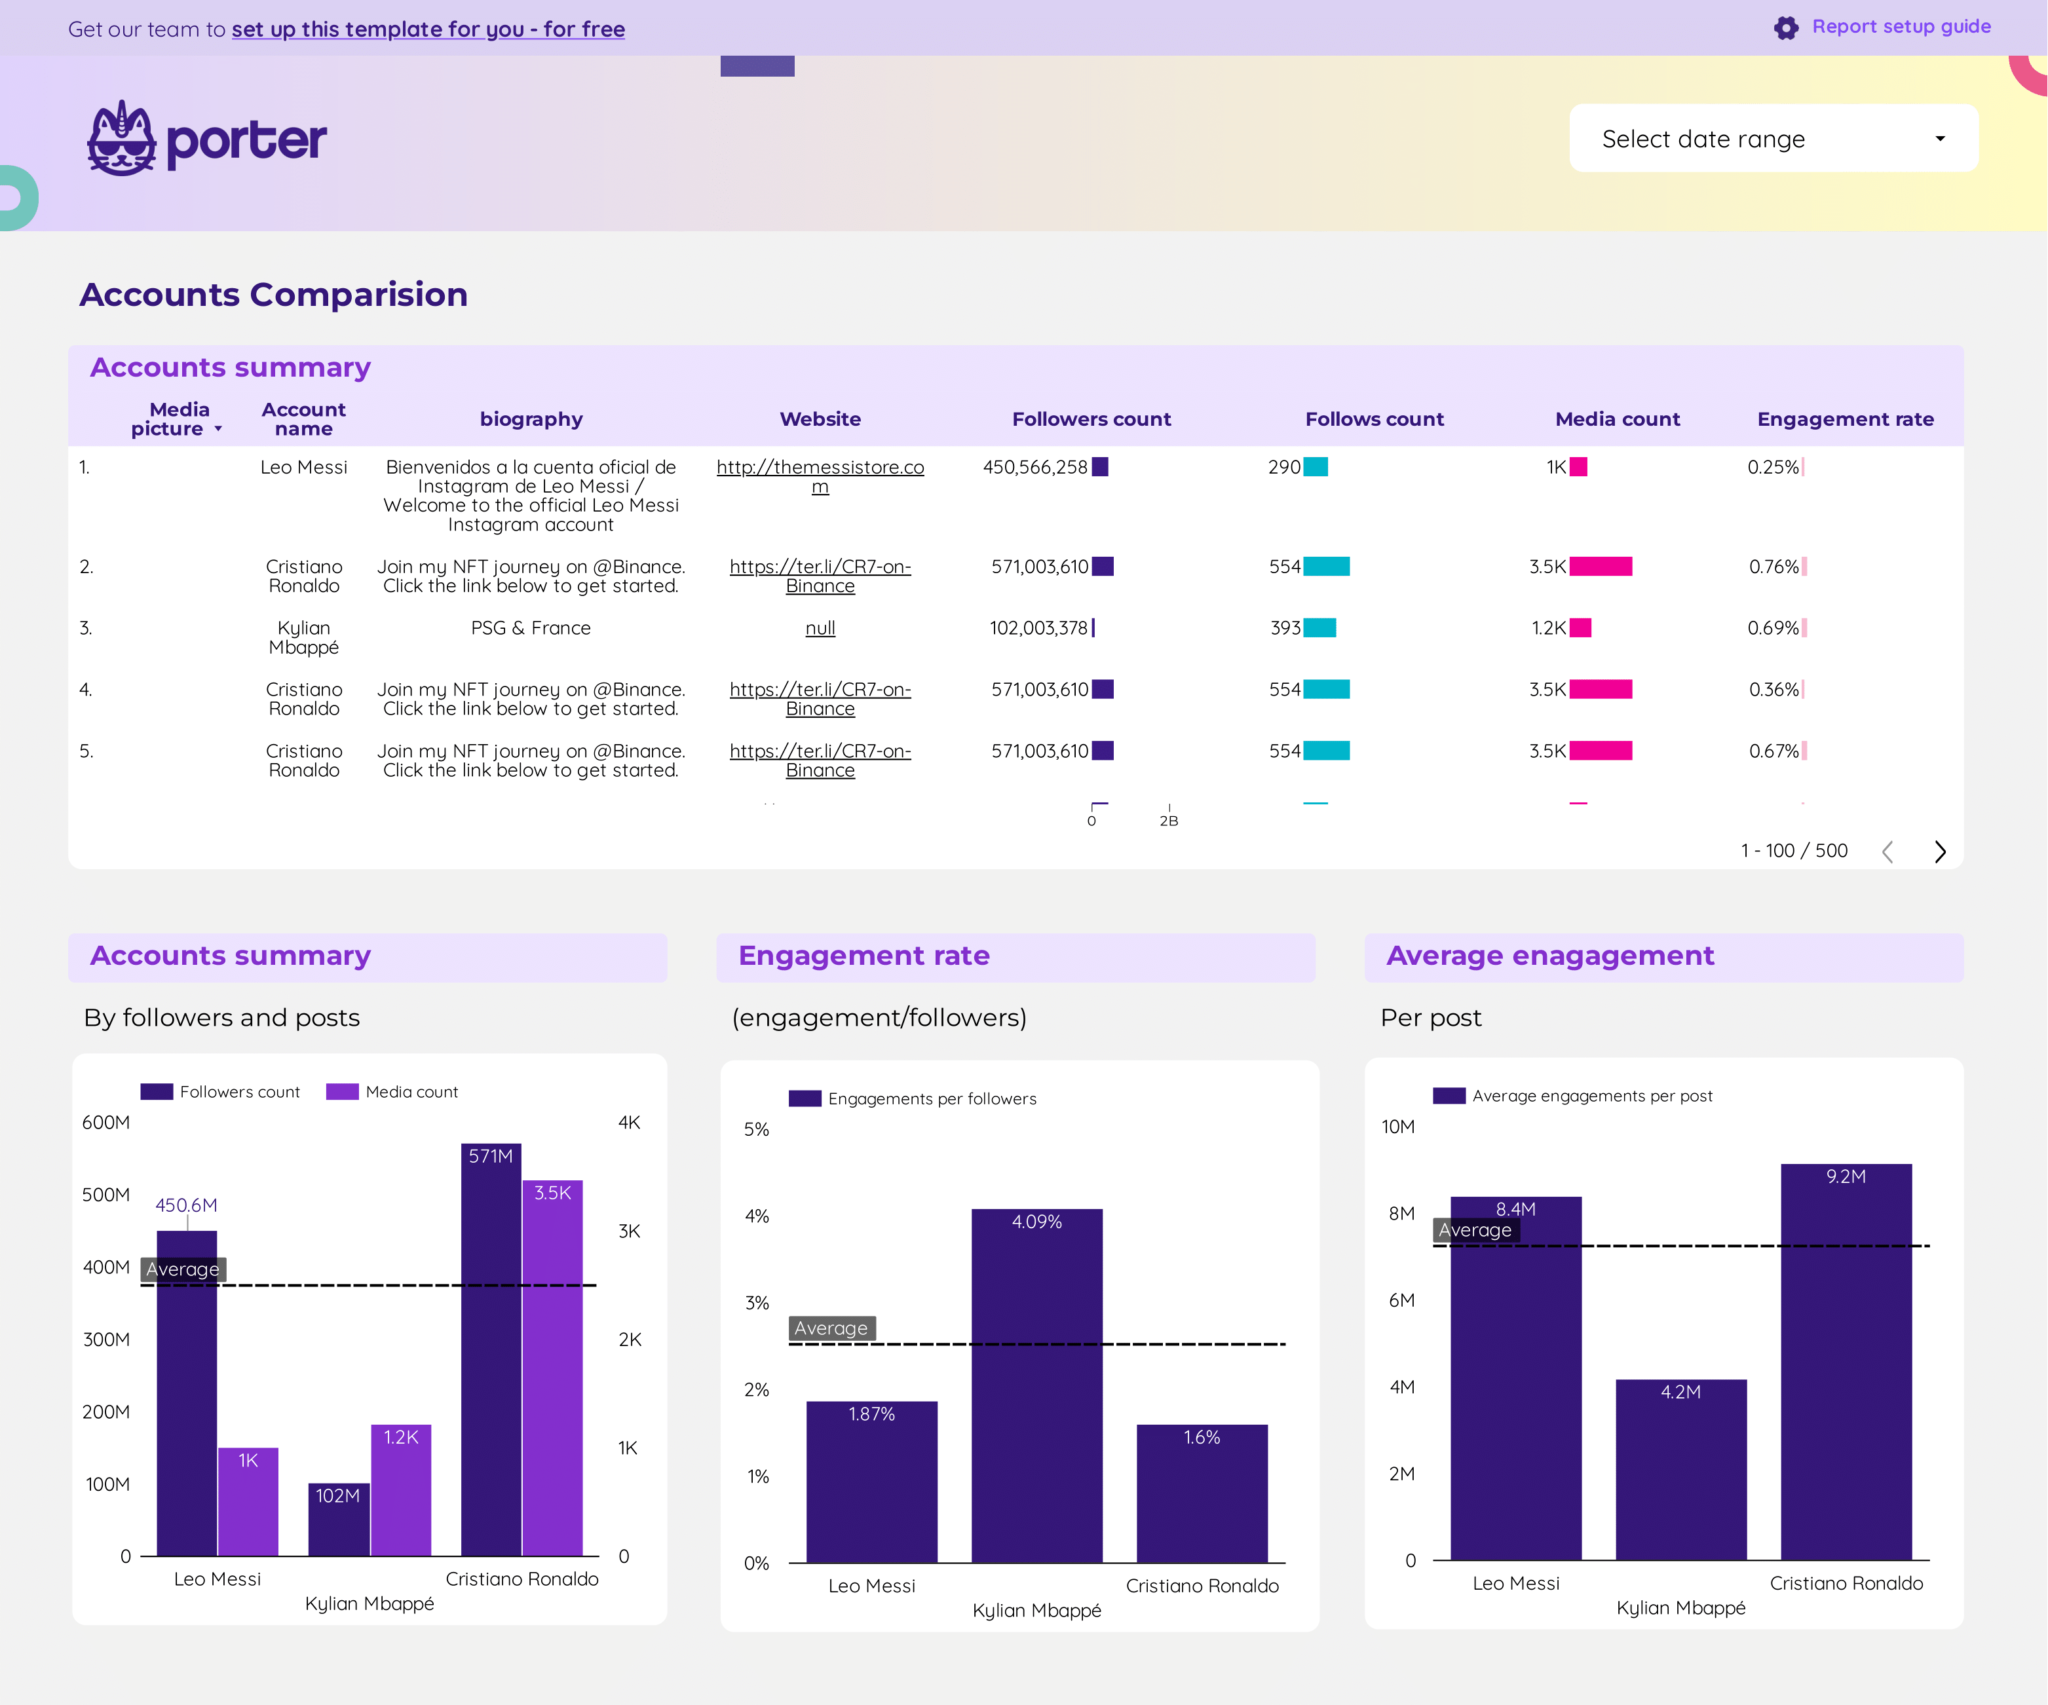
Social Media competitors Report template for Marketing teams and agencies
Analyze key metrics such as CTR, conversion rate, and engagement with the Social Media competitors report template. Utilize data from Social Media and Instagram Public Data. Segment by audience demographics, content strategy, and timeframes. Perfect for marketing teams to assess performance and optimize strategies.
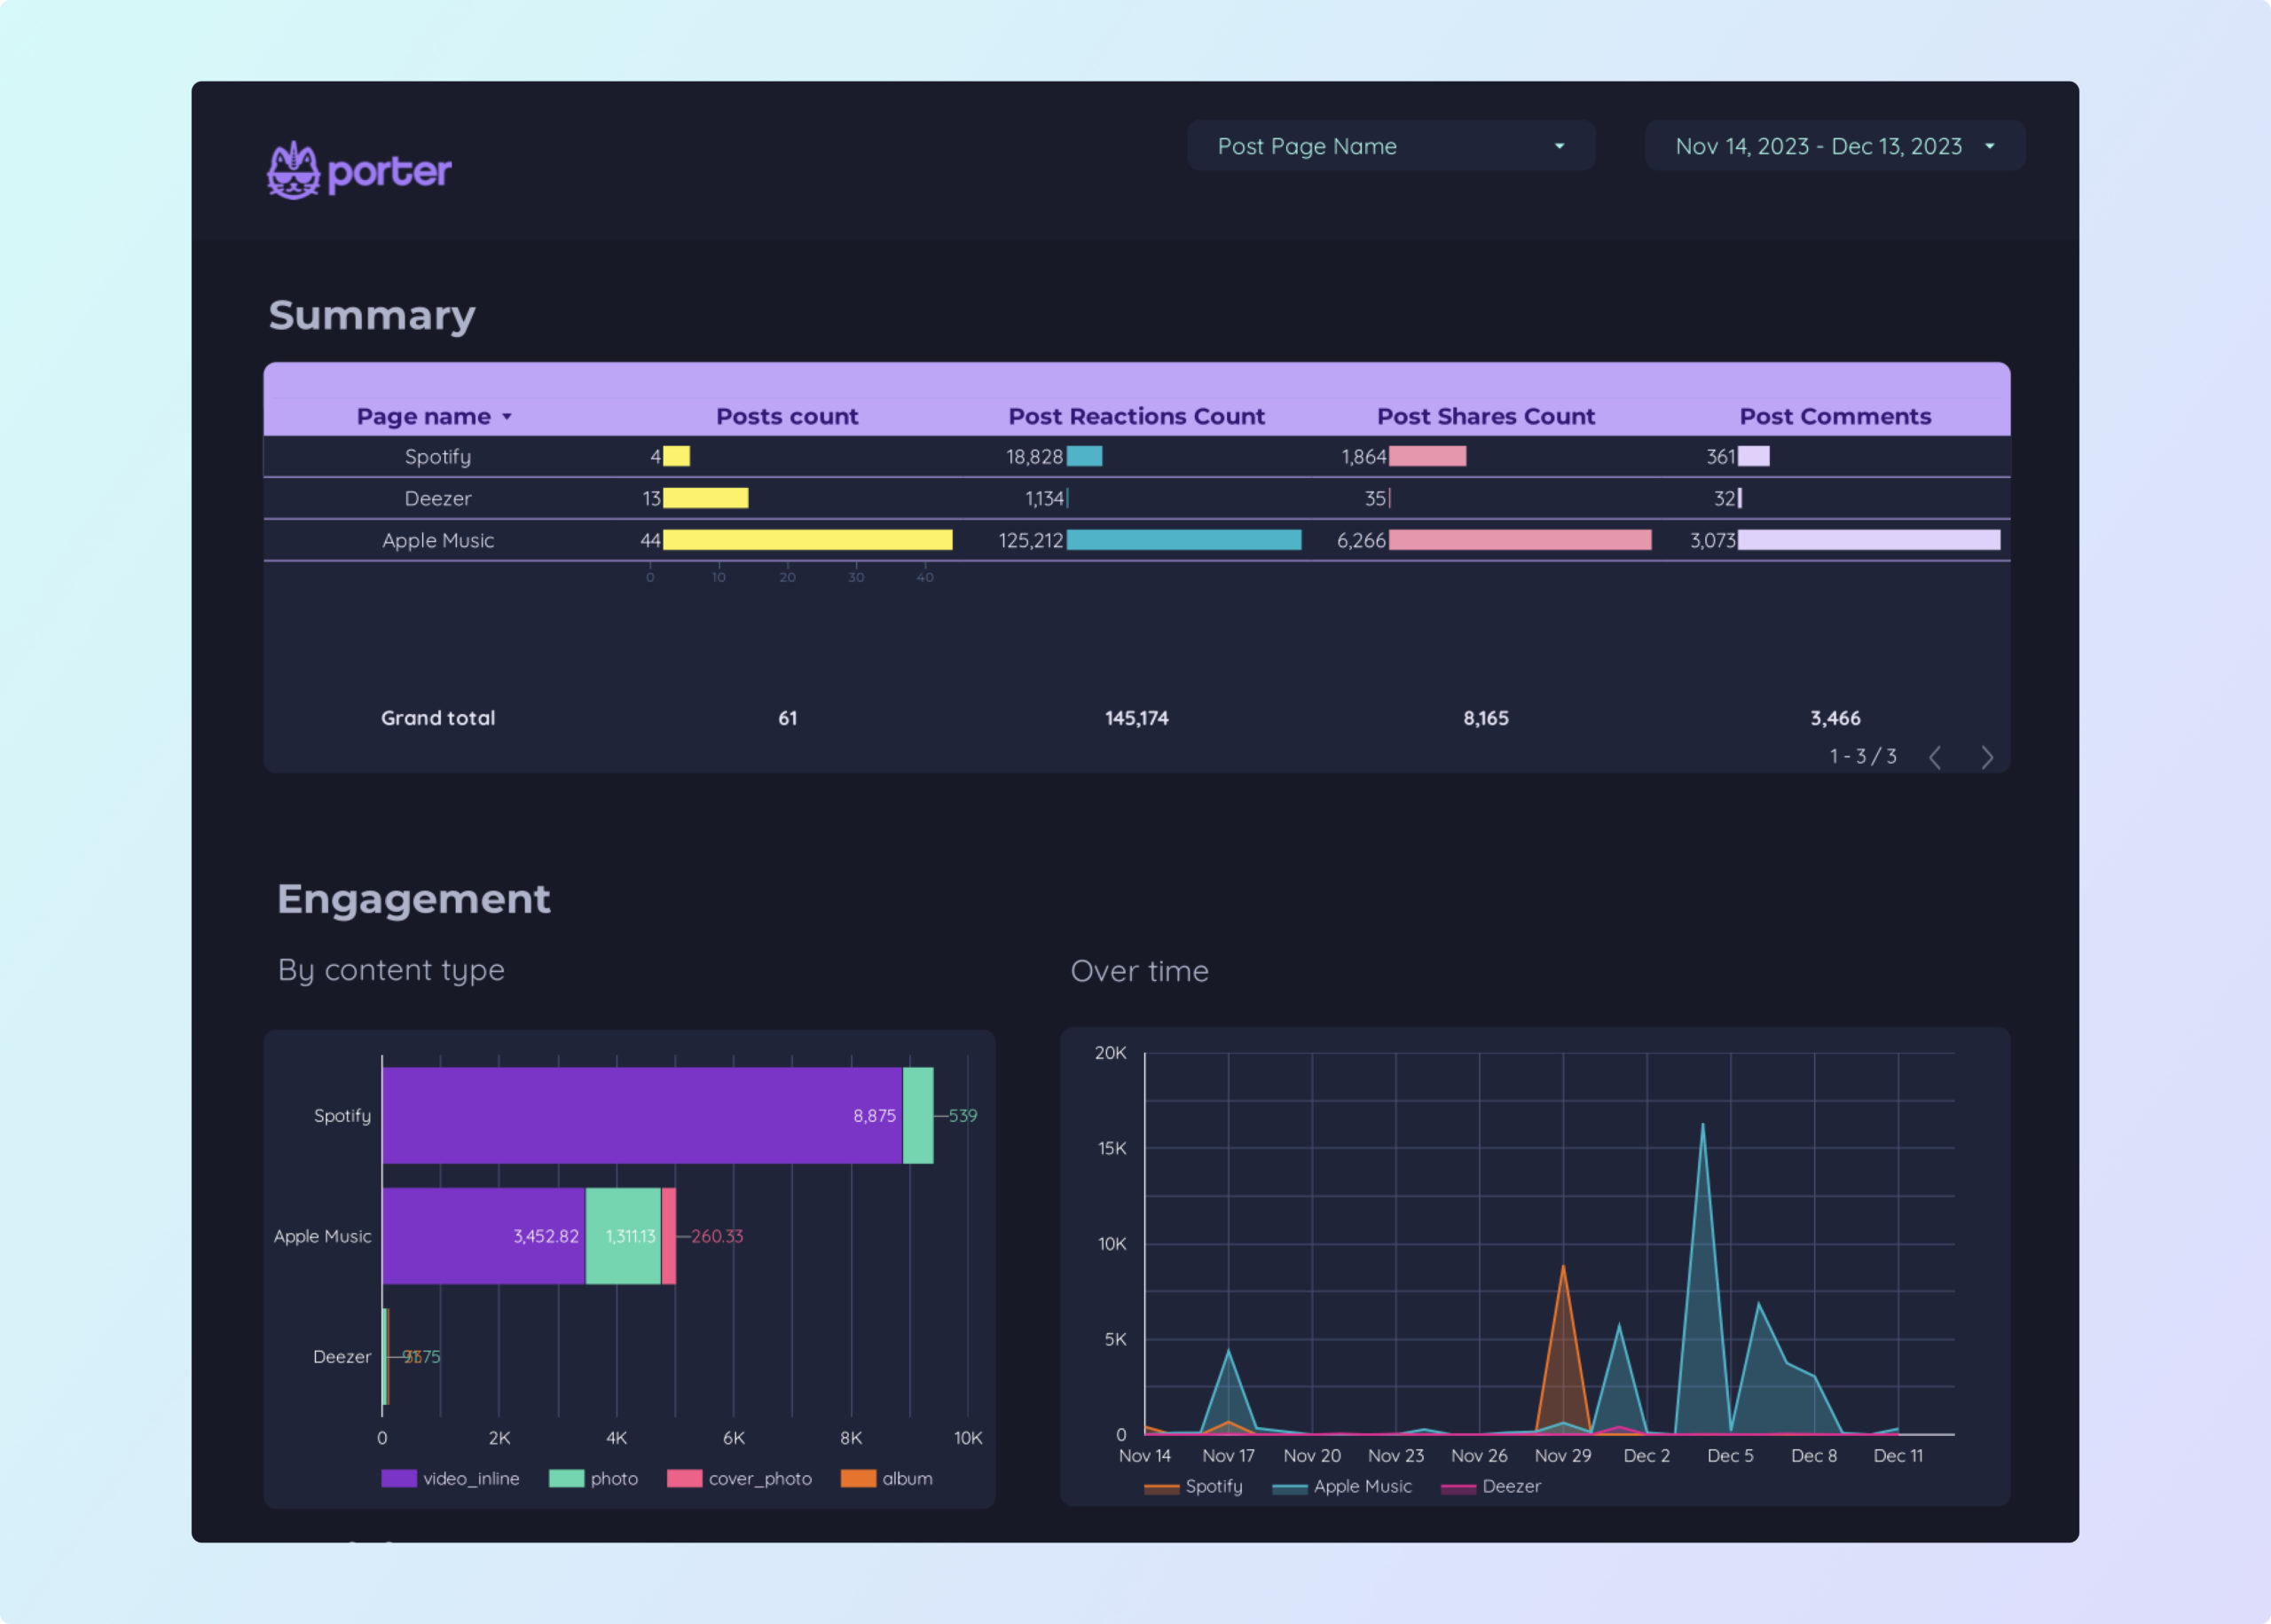
Facebook Insights competitors Report template for Marketing teams and agencies
Track key metrics like CTR, conversion rate, and share of voice with the Facebook Insights competitors report template. Analyze performance across demographics, channels, and timeframes. Leverage social media and Facebook public data to refine your strategy. Perfect for marketing teams aiming to consolidate insights and achieve specific goals.

Social Media Engagement Report template for Marketing teams and agencies
Analyze key metrics like CTR, ROI, and conversion rates with the Social Media Engagement report template. Leverage data from Social Media and Instagram Insights to optimize performance. Ideal for marketers to track audience segmentation, channel selection, and message personalization, enhancing strategy across demographics and timeframes. Perfect for understanding engagement trends and improving marketing efforts.
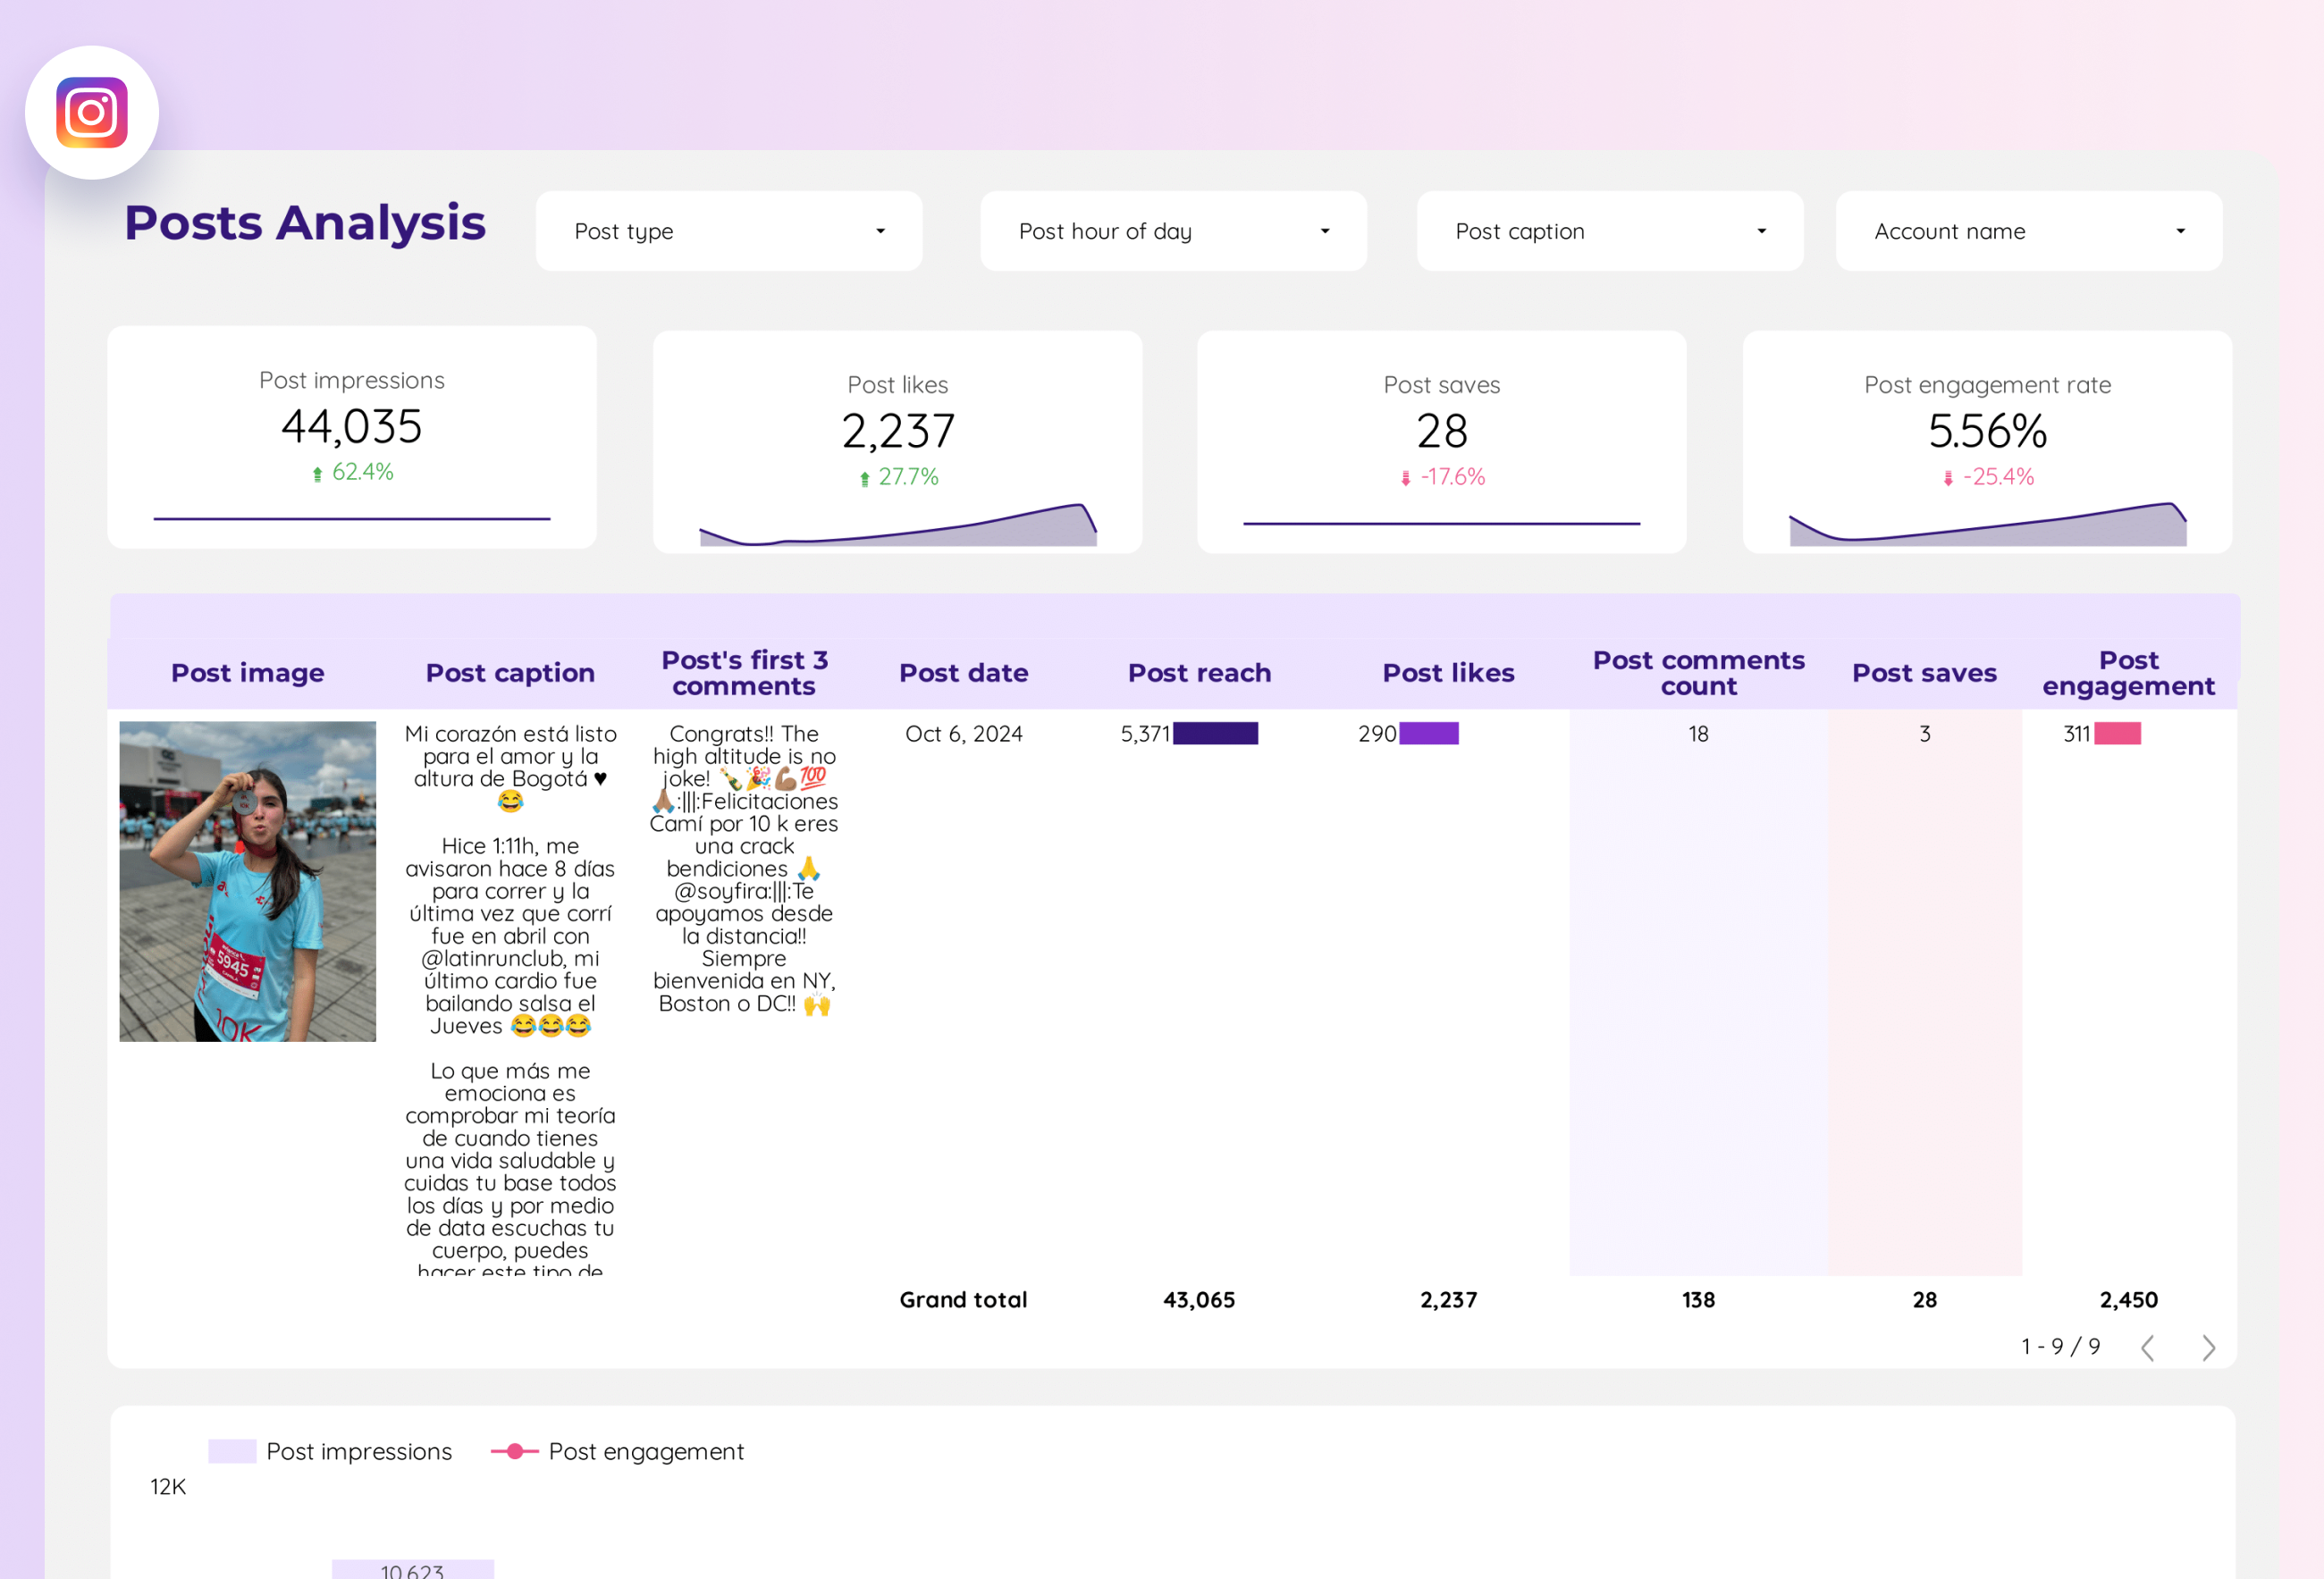
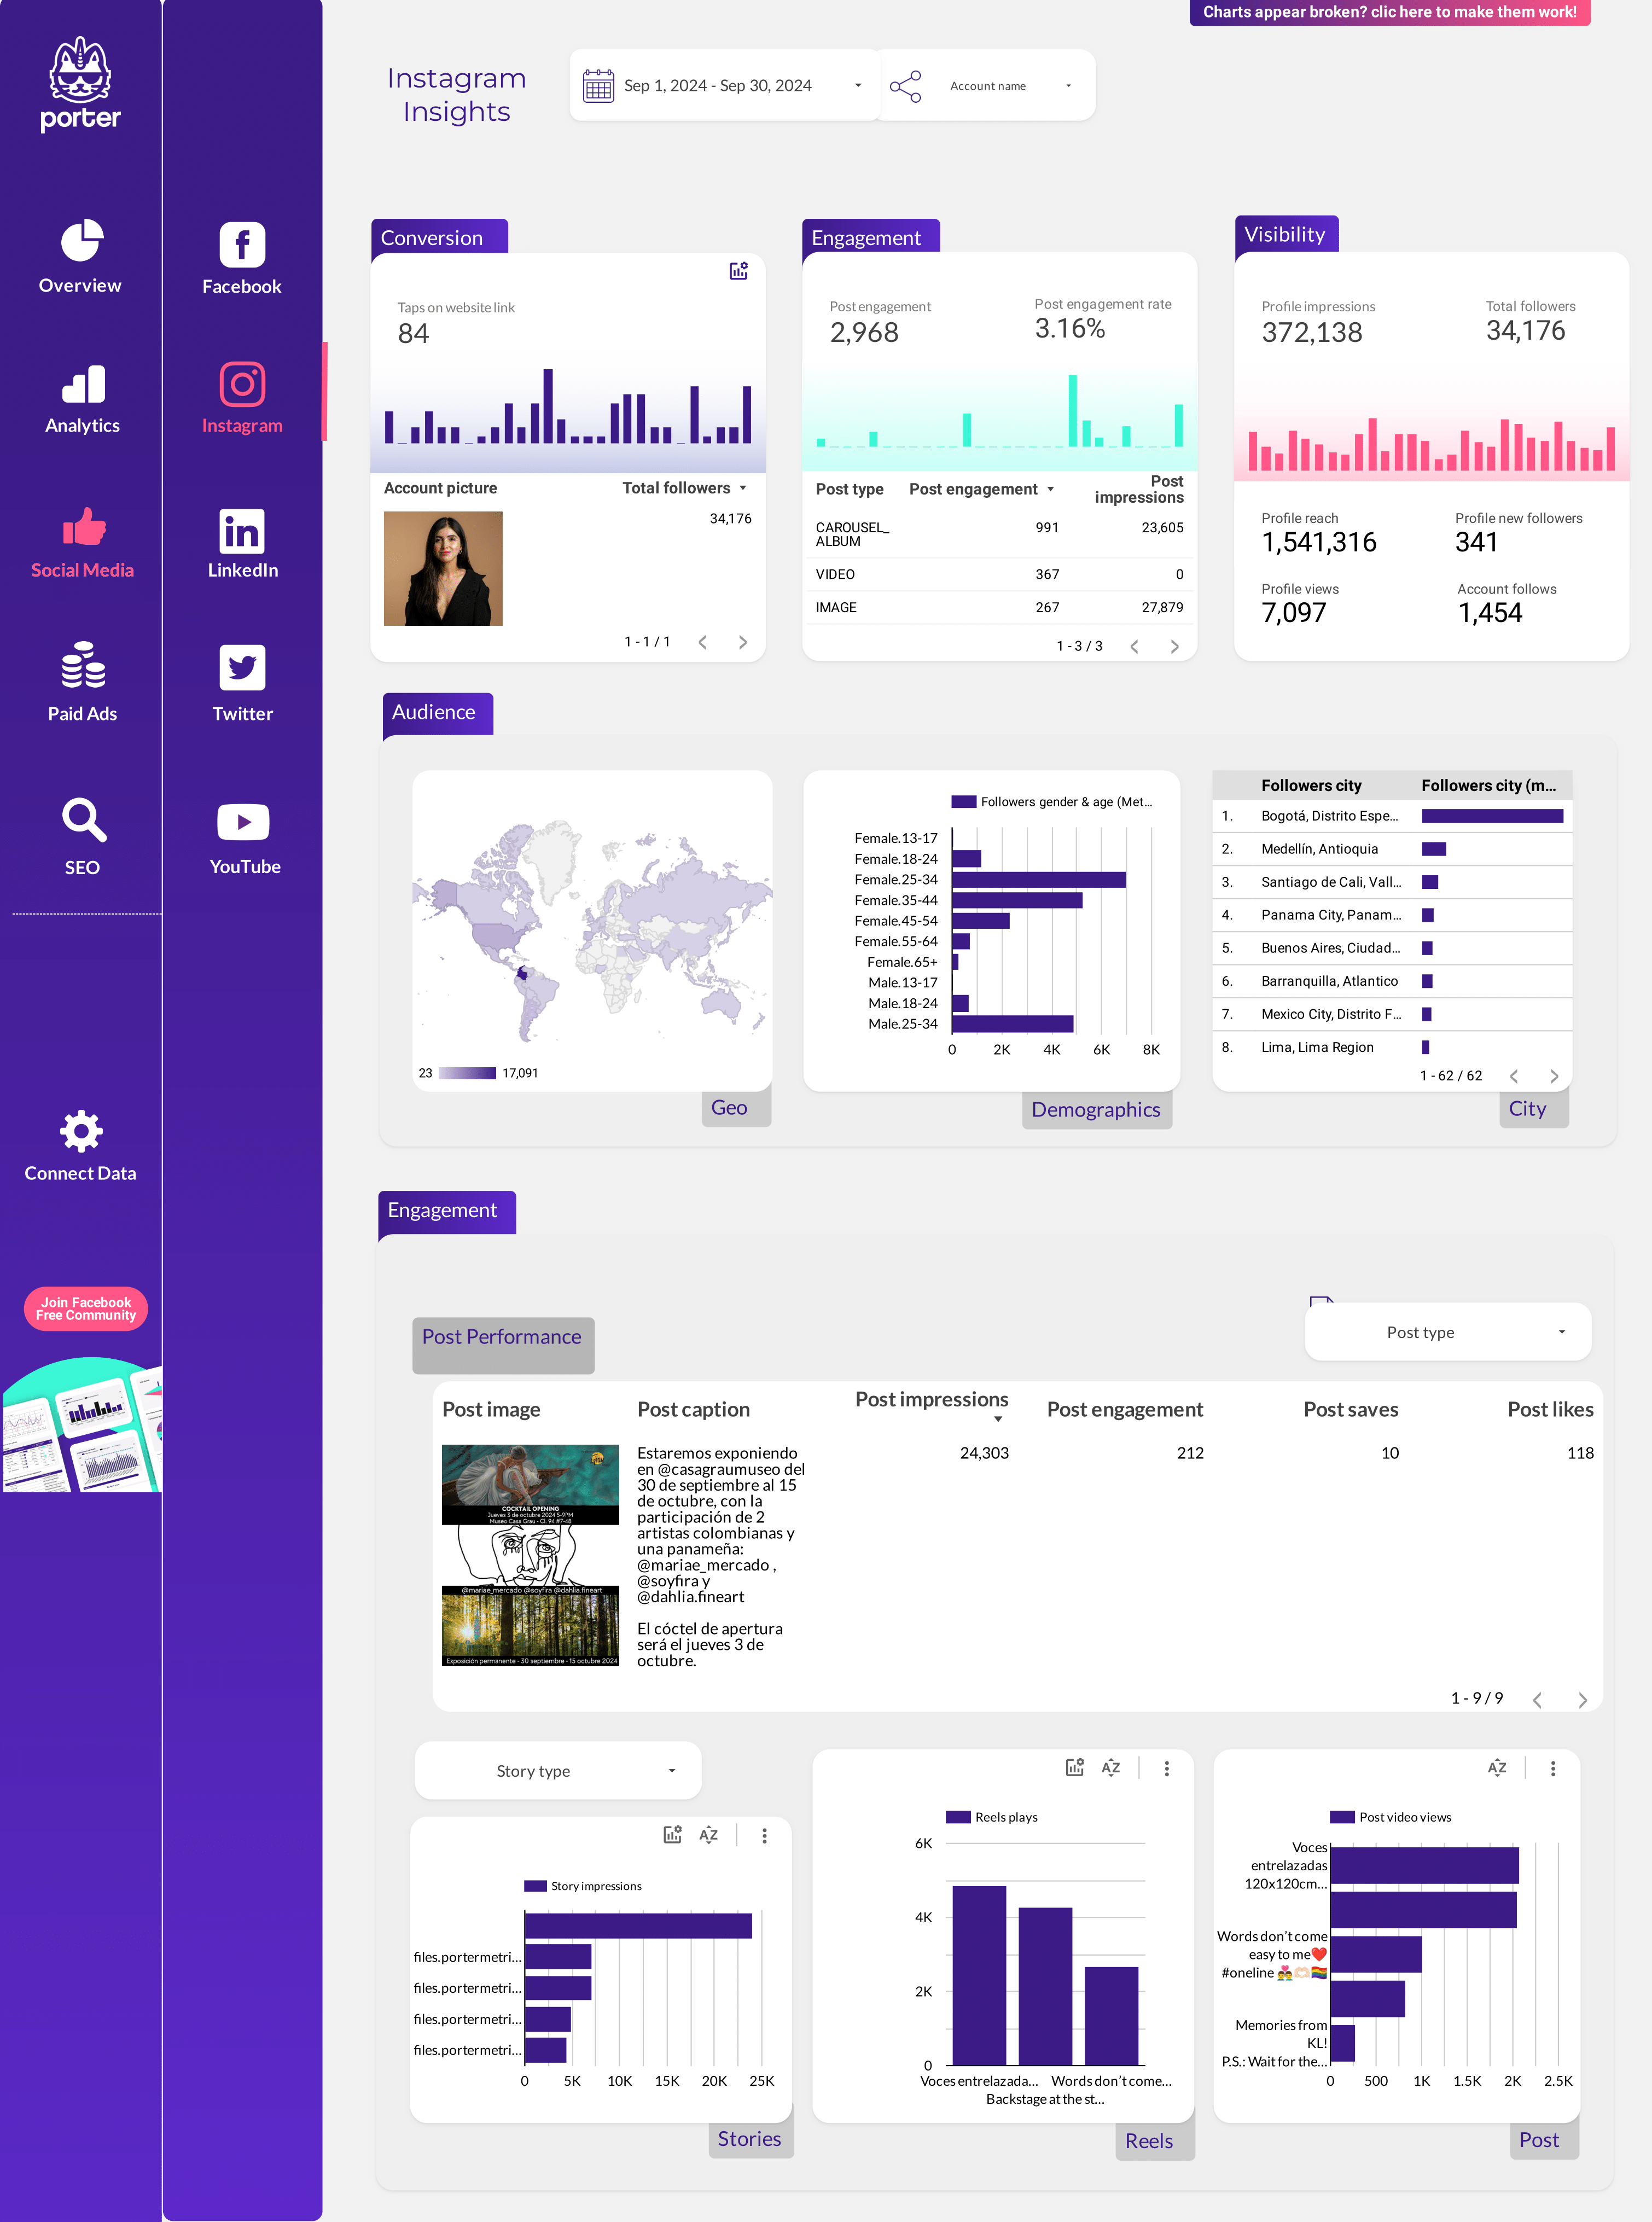
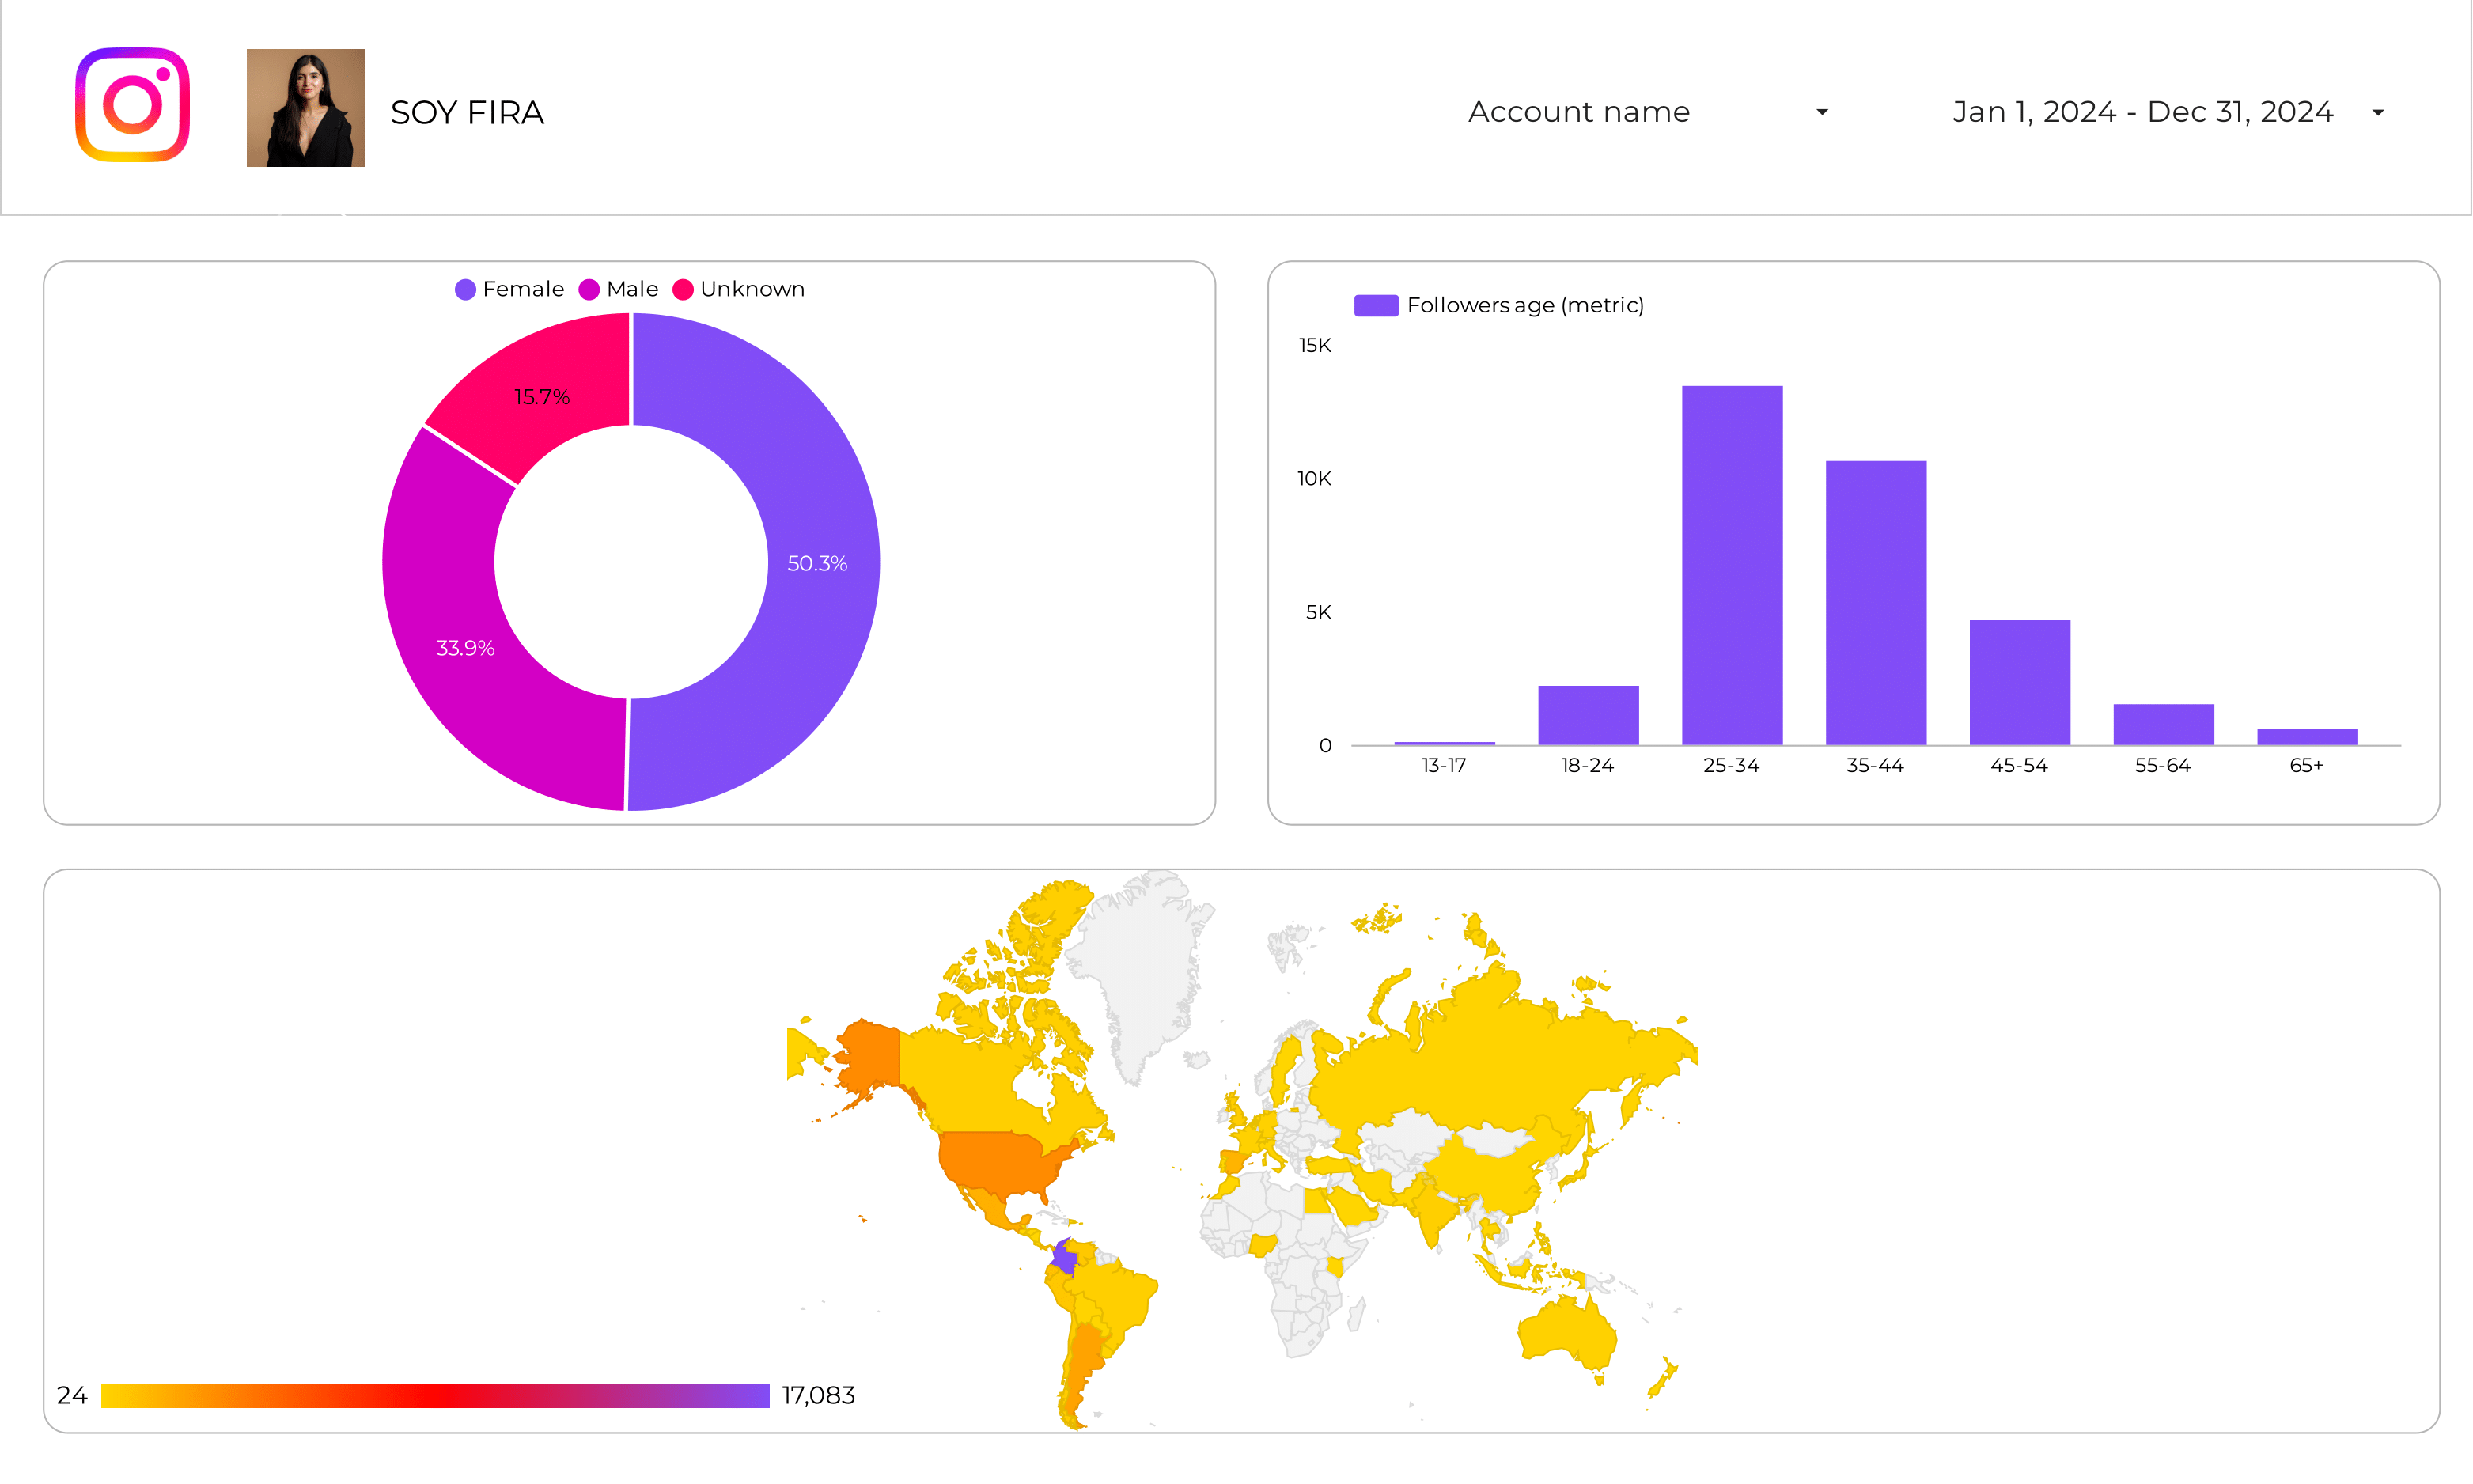
Instagram Insights Report template for Marketing teams and agencies
Analyze key metrics with the Instagram Insights report template. Measure CTR, conversion rate, ROI, likes, comments, shares, impressions, and reach. Segment by age, gender, location, and time. Ideal for social media marketers to consolidate performance data and refine strategies. Gain actionable insights to optimize engagement and ROI.
Social Media Followers tracking Report template for Marketing teams and agencies
Optimize your strategy with the Social Media Followers tracking report template. Track key metrics like conversion rate, engagement rate, and impressions. Analyze audience and campaign breakdowns across platforms using data from Social Media and Instagram Insights. Ideal for marketing teams to measure performance and achieve specific objectives efficiently.
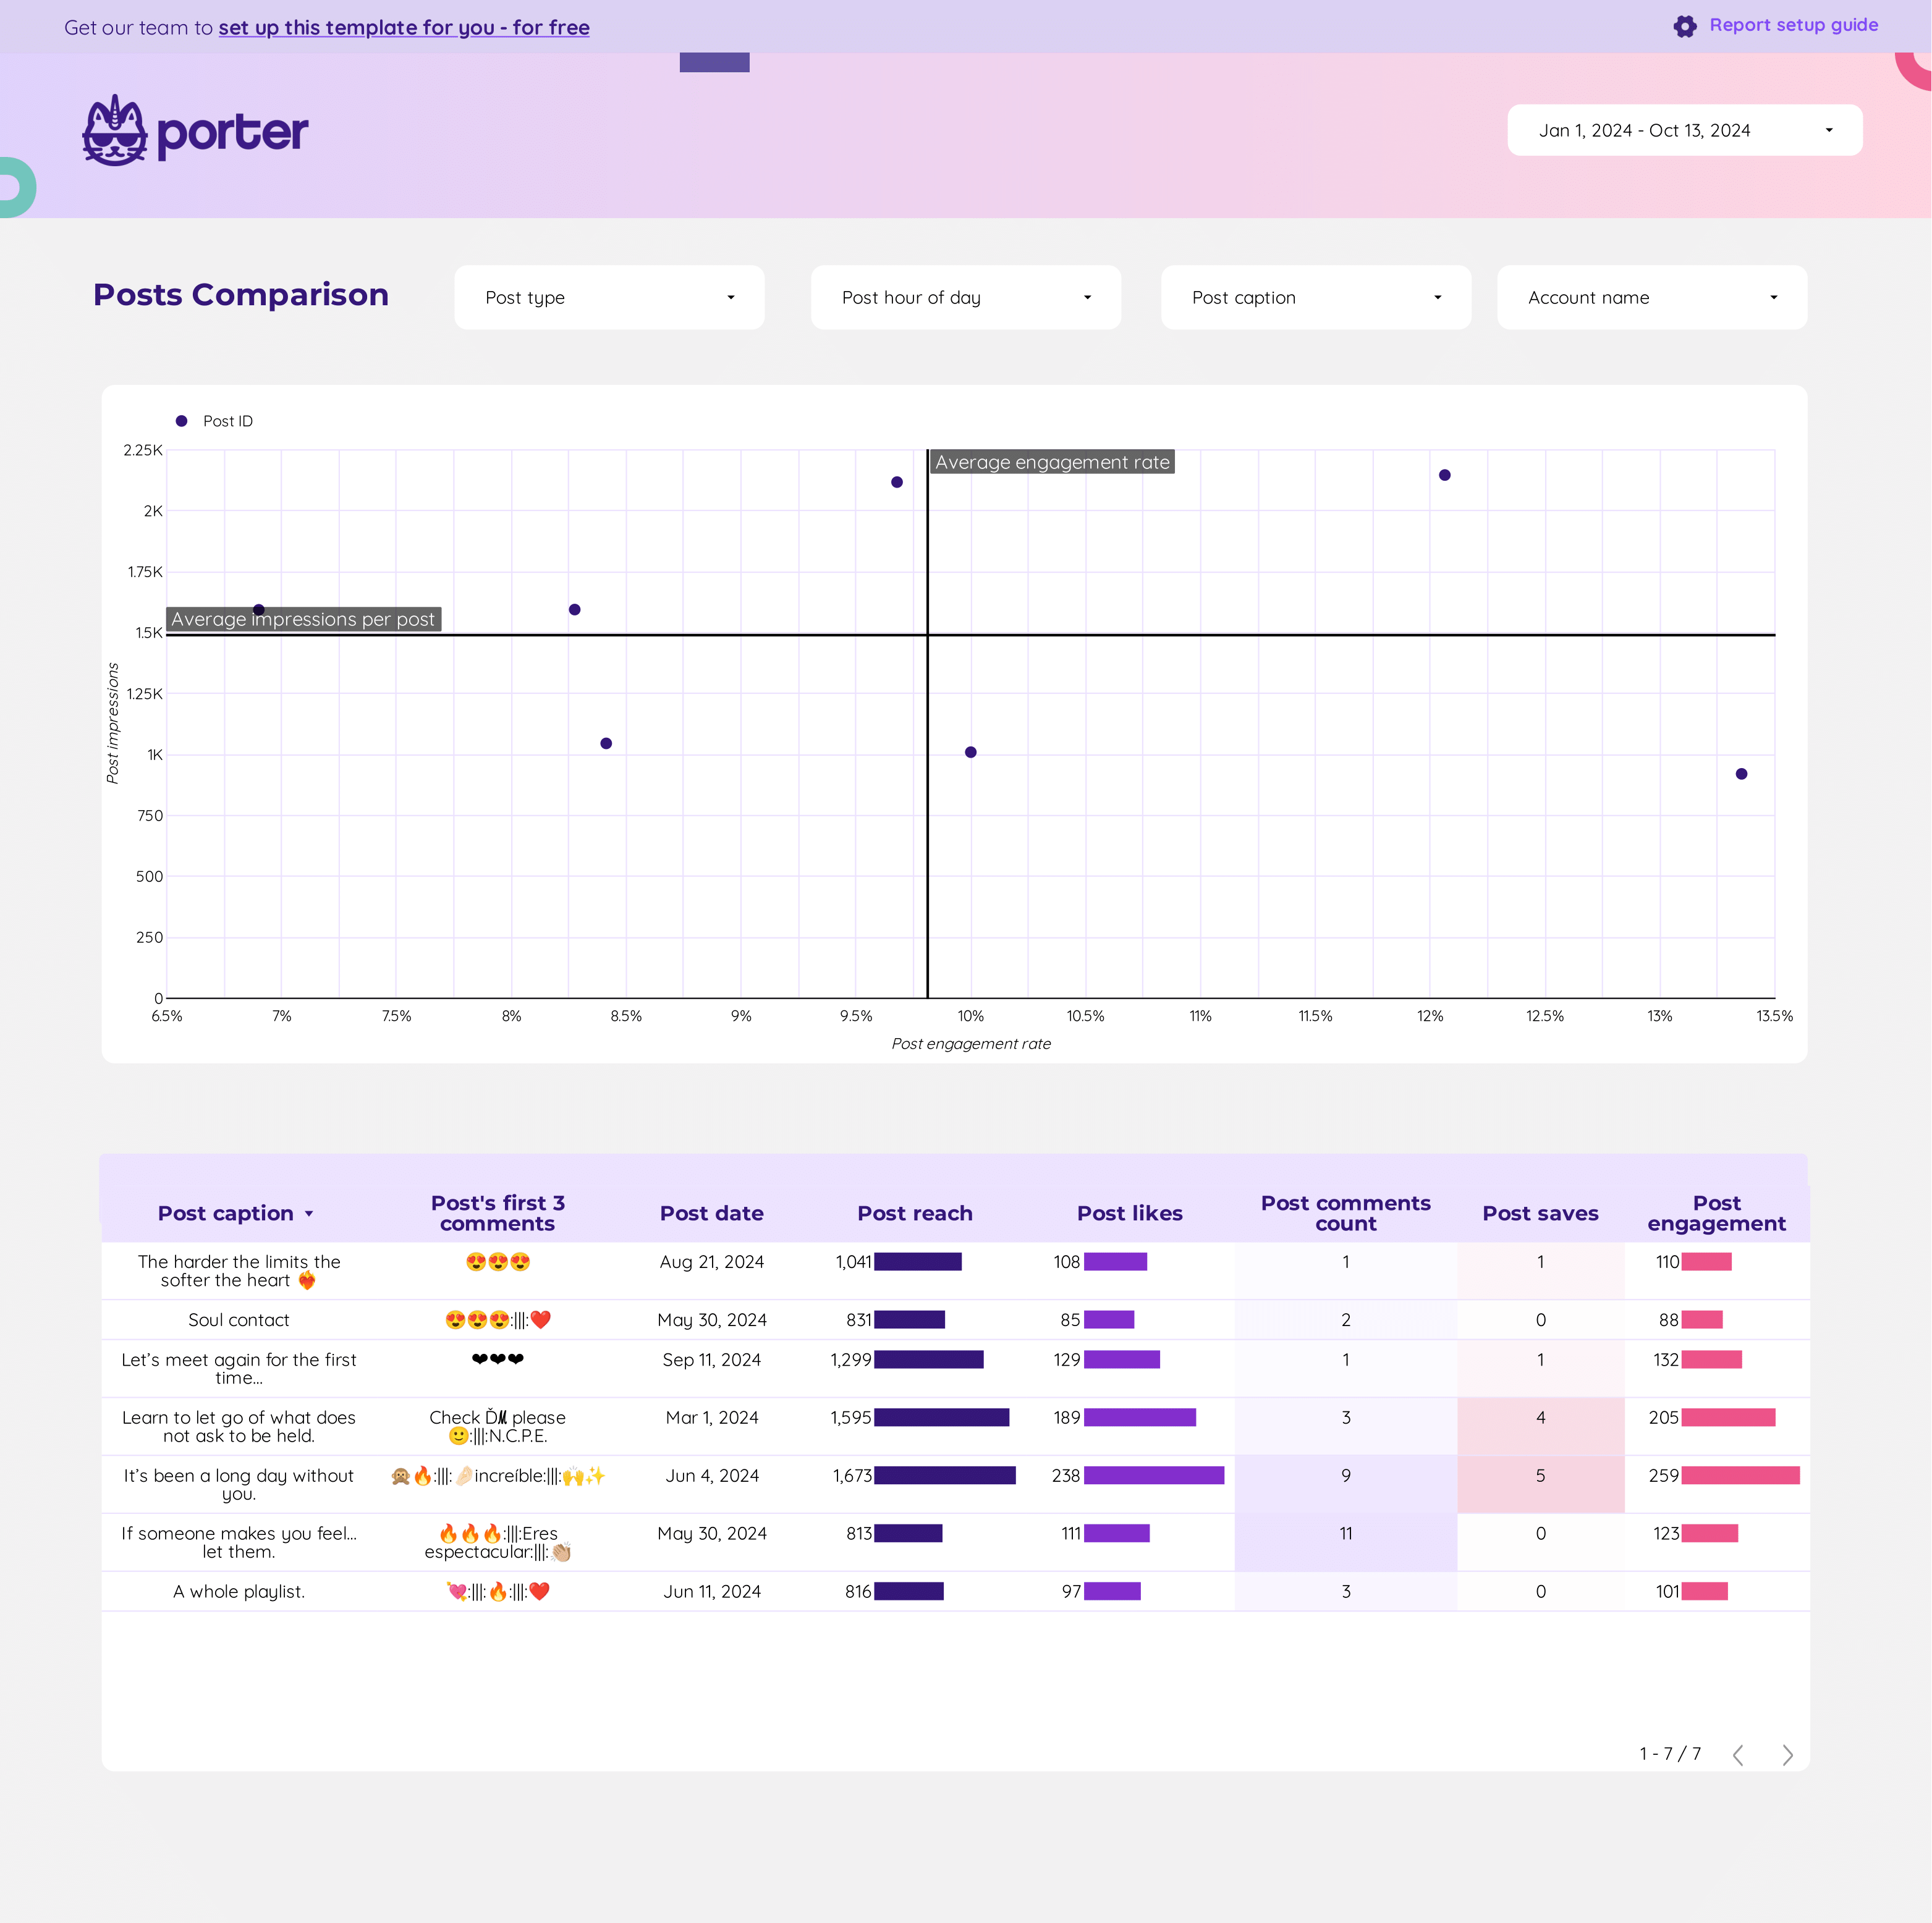
Social Media Post performance Report template for Marketing teams and agencies
Optimize your strategy with the Social Media Post performance report template. Track key metrics like conversion rate, ROI, and CTR. Segment by audience, platform, or campaign objective. Utilize data from Social Media and Instagram Insights. Ideal for marketing teams to enhance engagement and reach.
Instagram Insights competitors Report template for Marketing teams and agencies
Optimize your strategy with the Instagram Insights competitors report template. Analyze CTR, conversion rate, CPA, likes, and engagement. Segment by audience, goals, and duration. Leverage social media and Instagram public data for actionable insights. Perfect for marketing teams to track performance across demographics and timeframes.