What is an executive report?
An executive report is a document that consolidates data from multiple sources (e.g., financial systems, CRM, ERP) to track and display key performance indicators (KPIs) (e.g., revenue growth, profit margins, operational efficiency), enabling executives to monitor organizational performance and make informed strategic decisions.
Executive reports are typically created using flexible tools like Google Looker Studio, Power BI, Google Sheets, or platform-specific solutions to enable high customization and integration of multiple data sources.
What to include in an executive report?
An actionable executive report balances context and specificity based on the audience (executives, managers, and analysts) and their use cases.
Executive reports
Executive reports for CEOs, CFOs, and board members show the organization's overall performance. Reviewed weekly, monthly, or quarterly, they include:
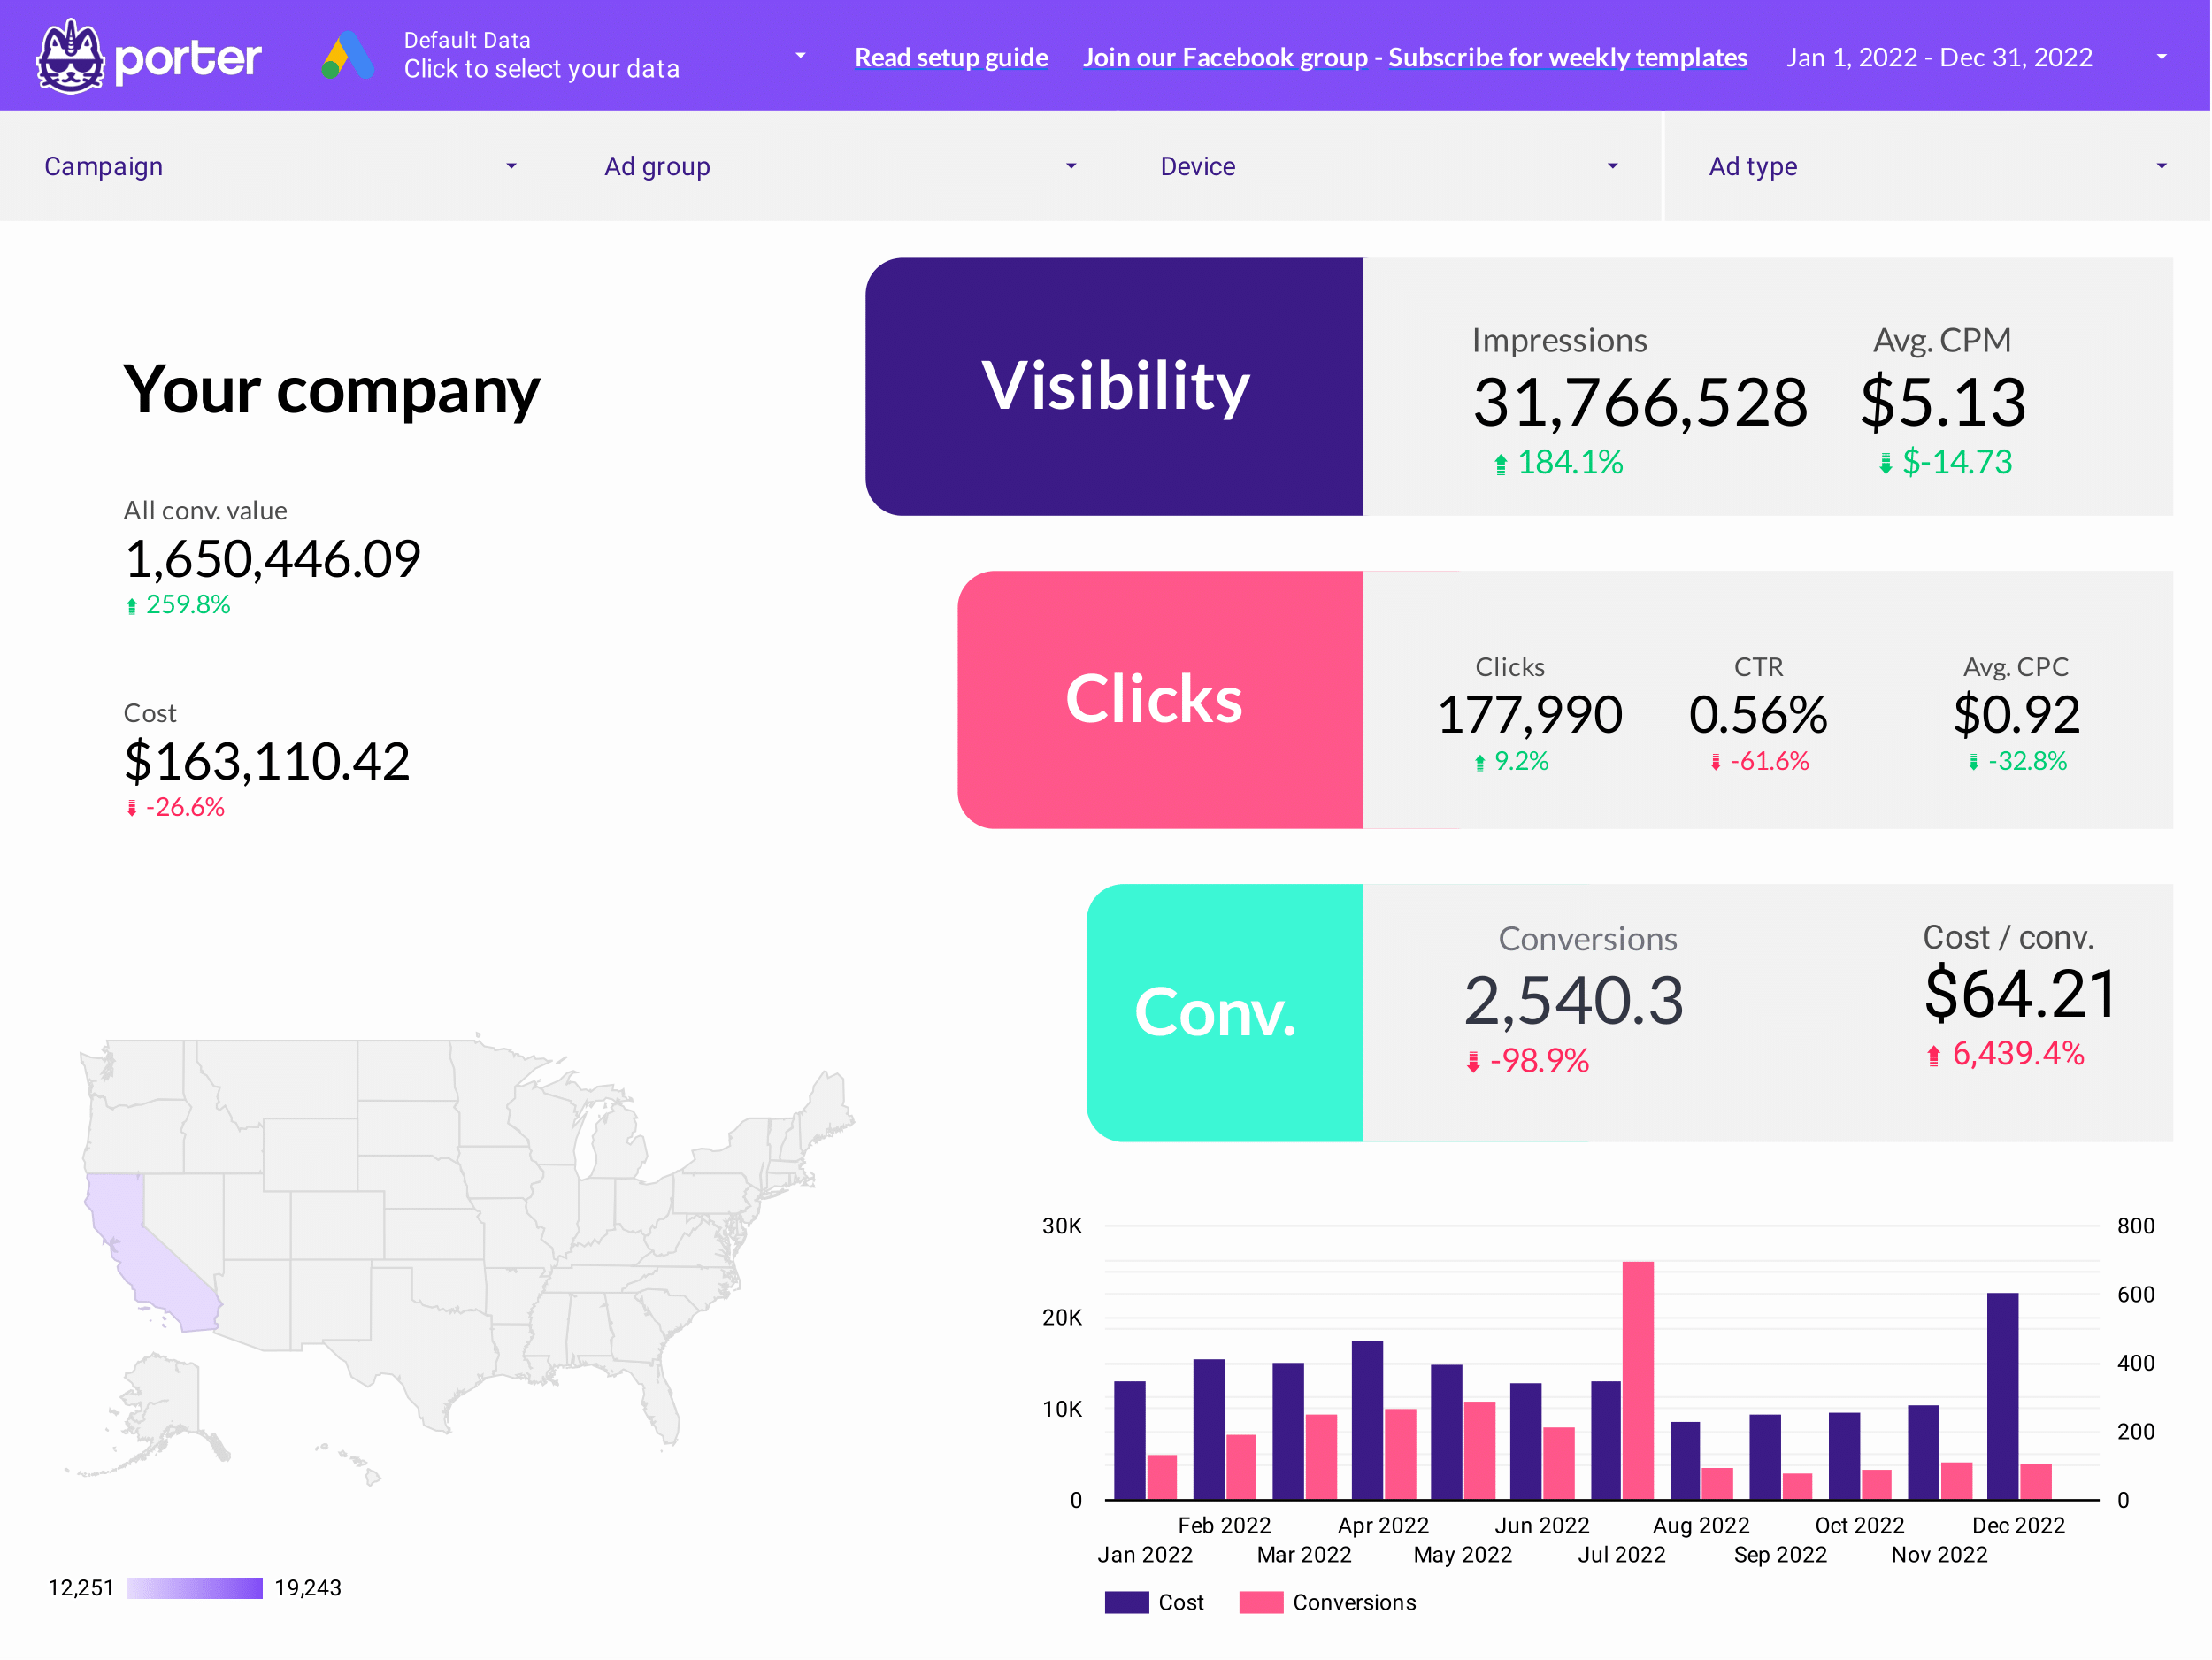
- Financial performance analysis: revenue, profit margins, and cost analysis.
- Operational efficiency analysis: productivity metrics, resource utilization, and process optimization.
- Strategic goal tracking: progress towards strategic objectives and key initiatives.
- Add text for additional context to translate metrics for non-technical audiences. Present in slide decks and simplified Looker Studio reports.
Manager reports
Manager reports have cross-departmental views with drill-downs to see performance by team, project, region, and operational area. They help align teams, define tactics, and include:
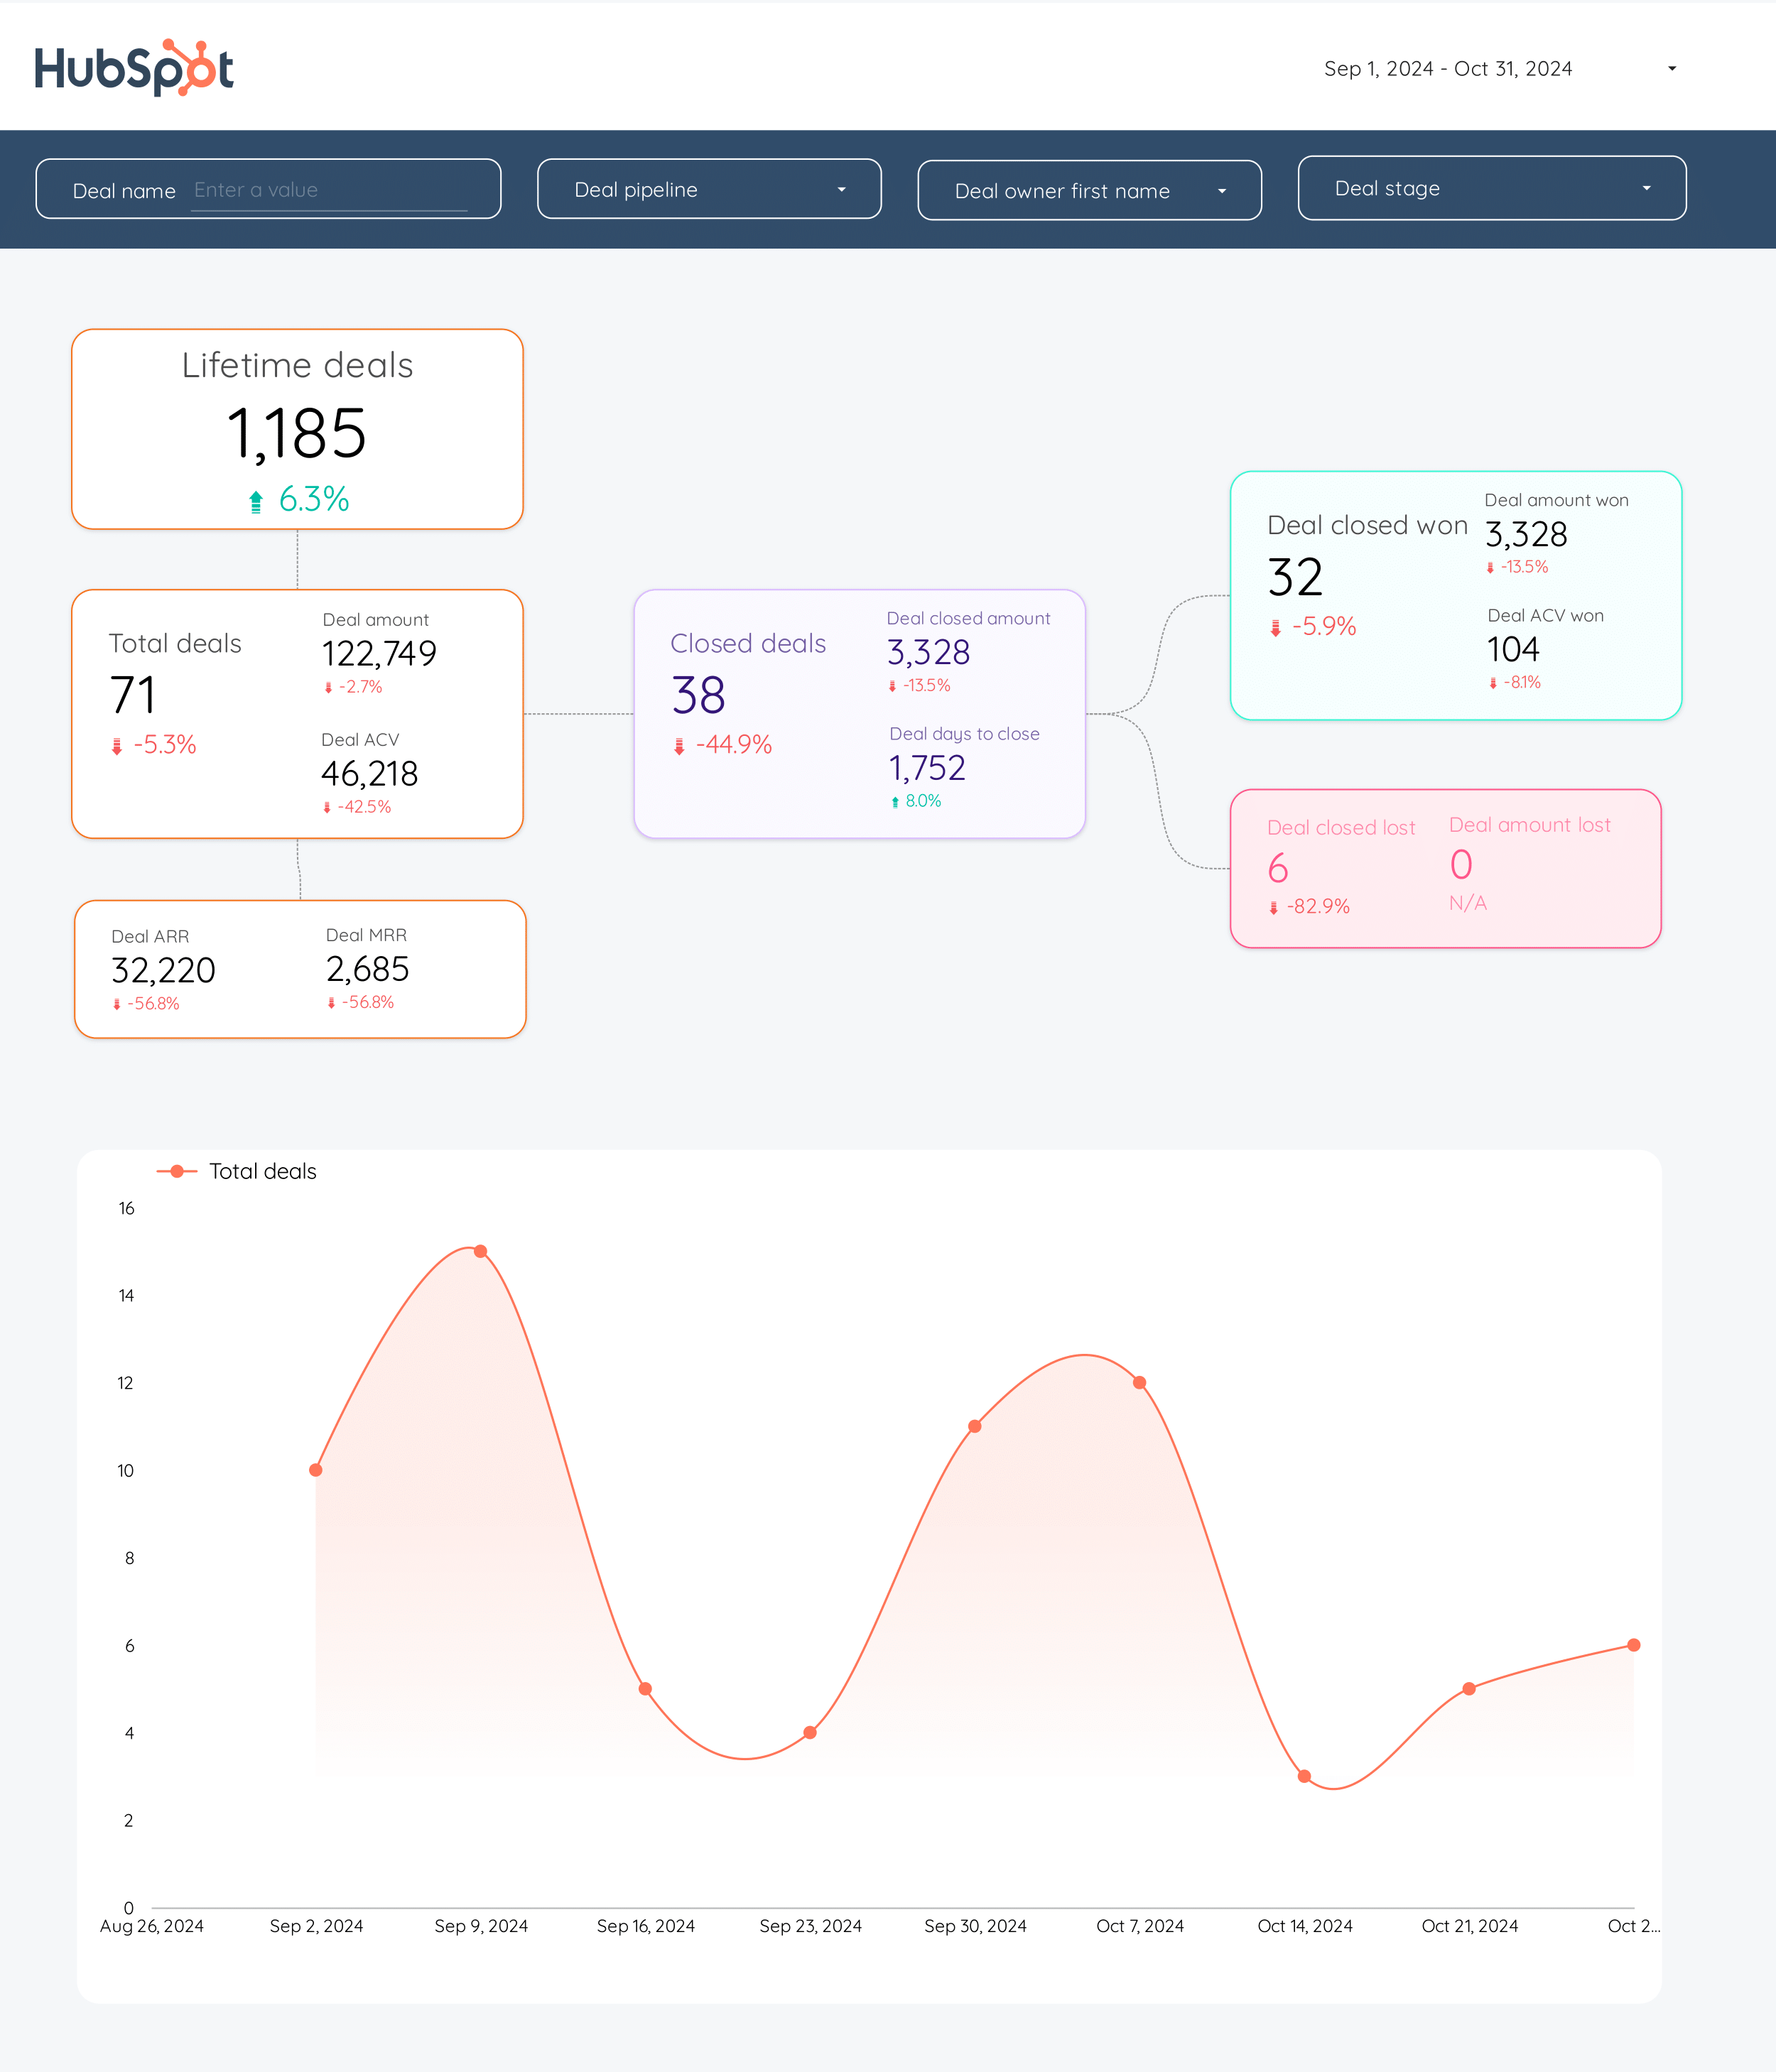
- Cross-departmental reporting: overall performance, project status, and resource allocation.
- Goal tracking: compare current performance vs objectives.
- Audits for prioritization and spotting issues
- Competitive analysis for market positioning and strategy mapping.
- Resource and capacity planning
Operational Reports
Operational reports for analysts and department managers have granular, customizable KPIs to solve technical issues. Monitored hourly, daily, or weekly, they cover:
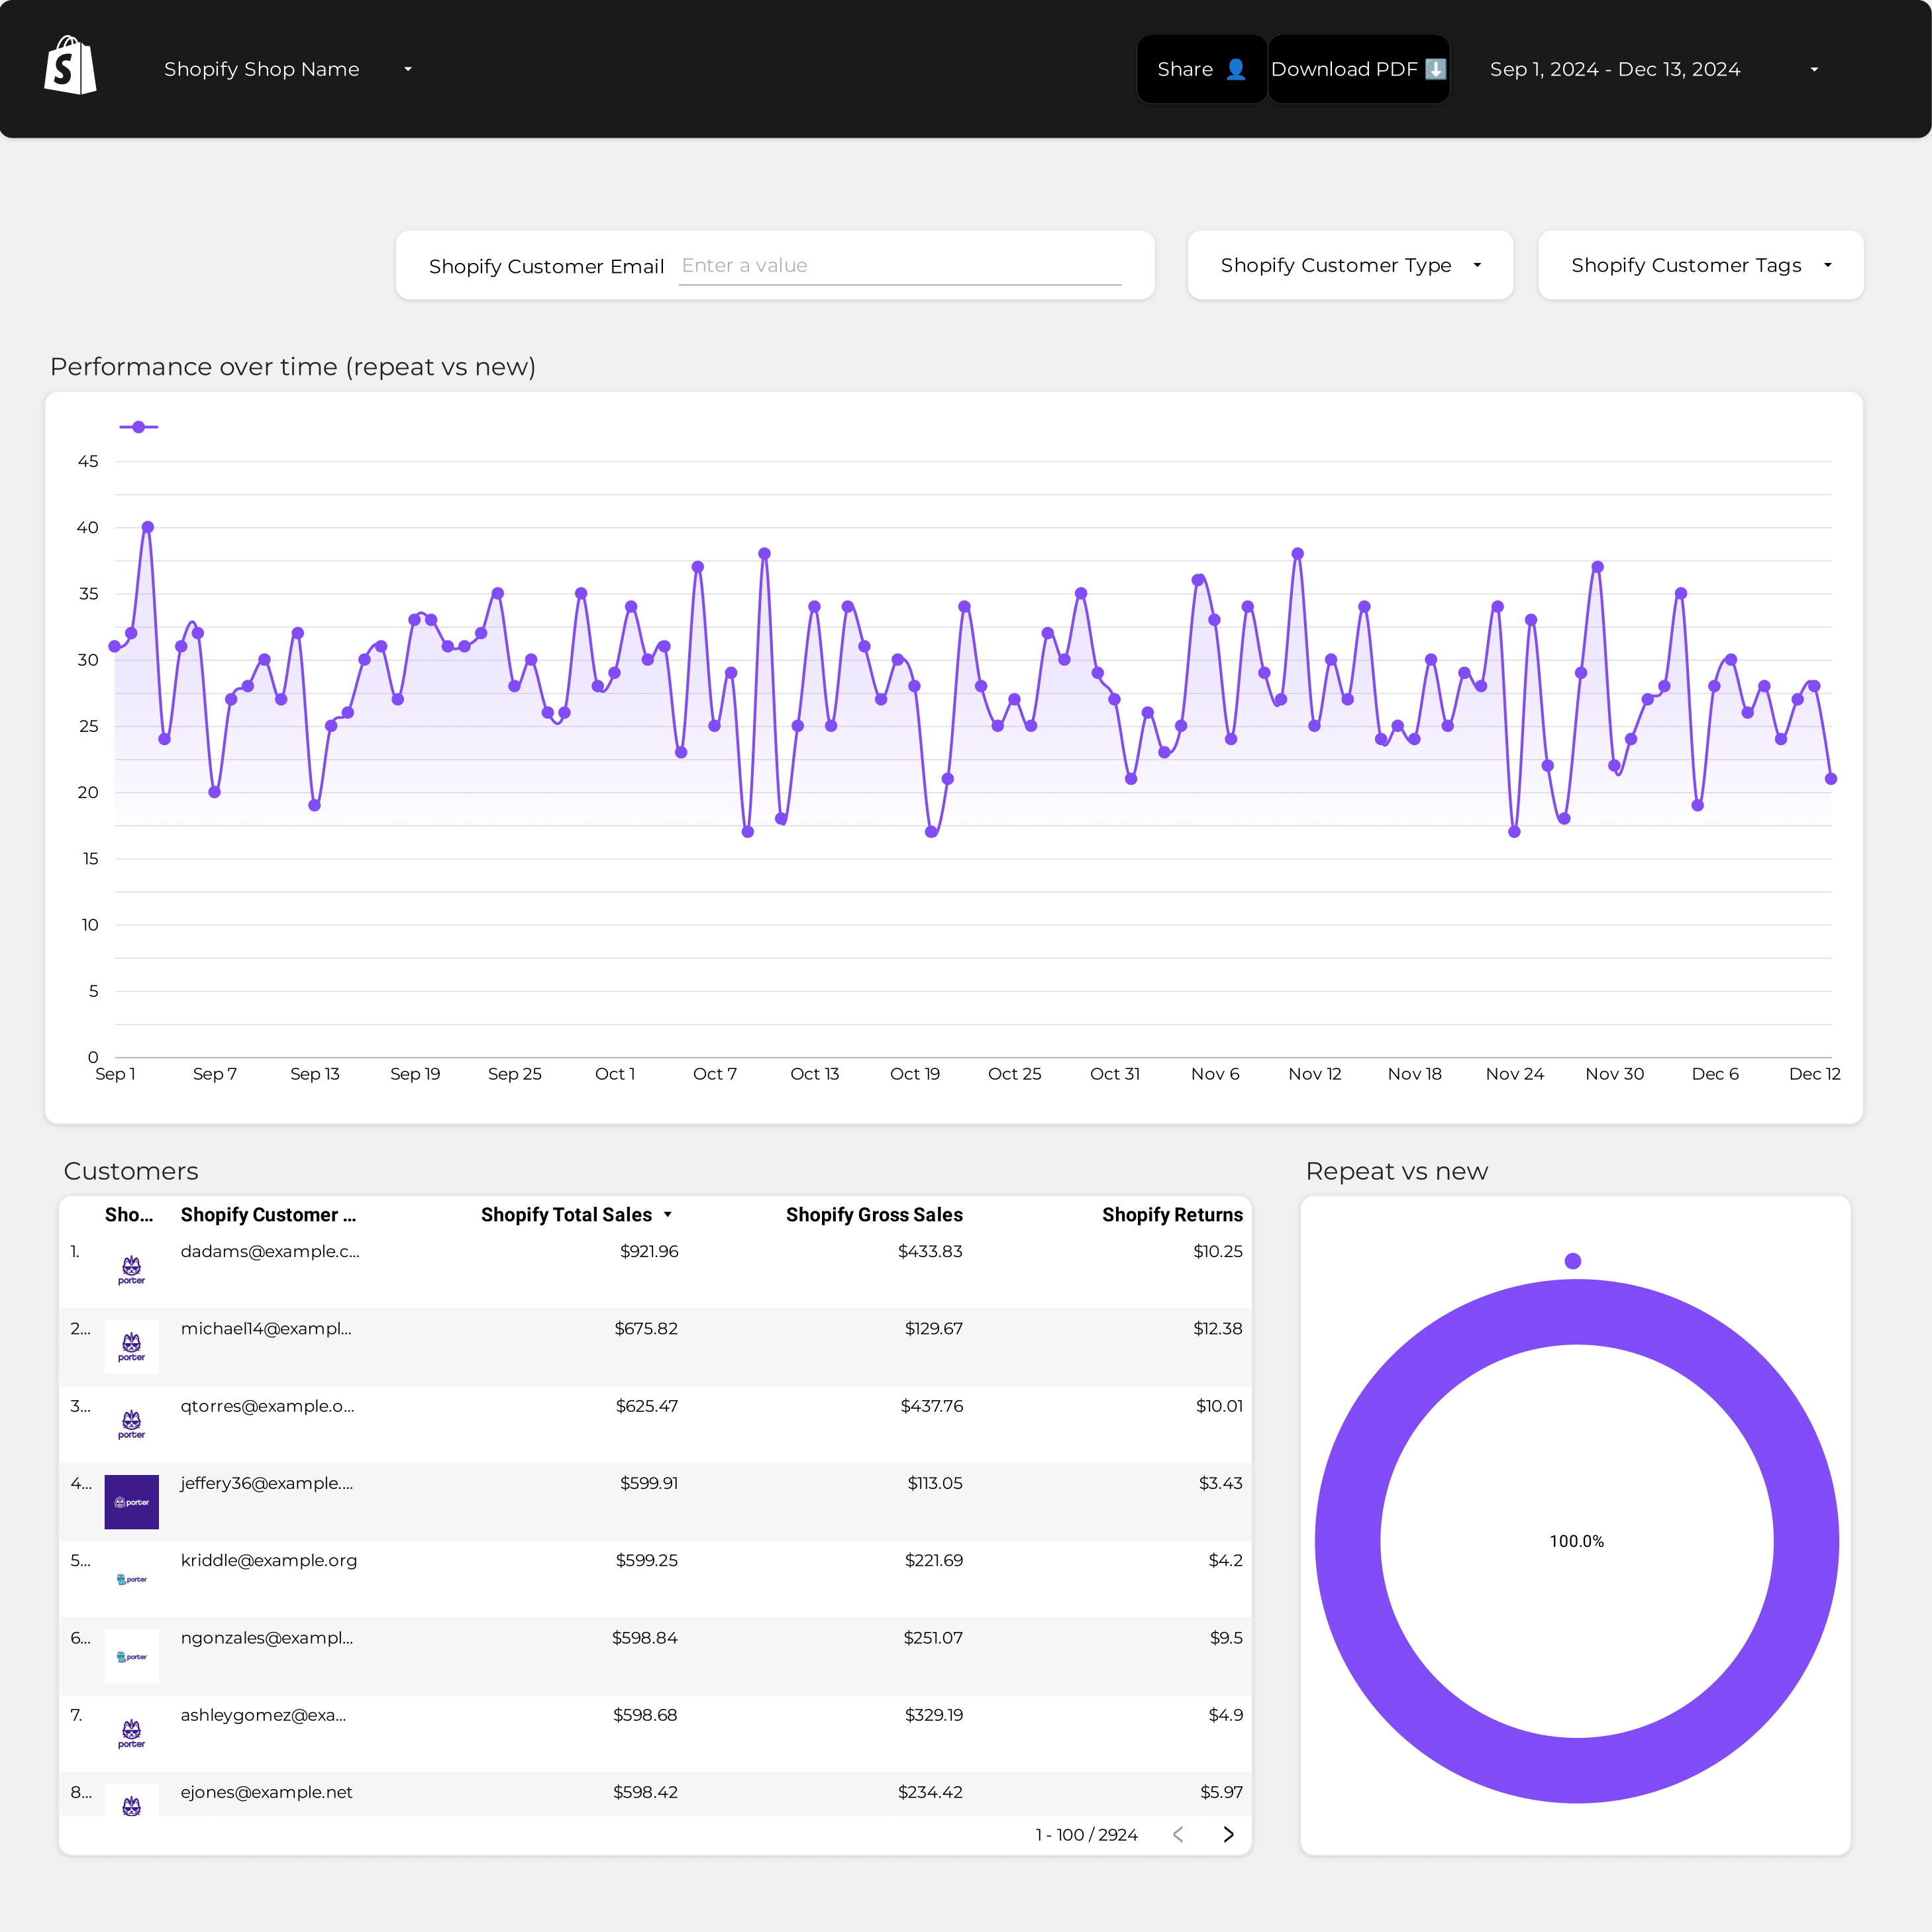
- Financial: budget tracking, expense management, cash flow analysis.
- HR: employee performance, turnover rates, training effectiveness.
- Supply Chain: inventory levels, order fulfillment, logistics efficiency.
- IT: system uptime, incident response, security metrics.
Operational reports are highly customized, built in flexible tools like Google Sheets or Looker Studio to enable data cleaning, blending, annotations, and integrating multiple sources.
How to build an executive report?
To build an executive report, connect your data sources, choose a template on Looker Studio or Sheets, build your queries by selecting metrics and dimensions, choose charts to visualize your data, customize the report, design and share via link, PDF or email.
Here’s the breakdown:
Connect data sources
Define and connect the data sources to bring to your report. Common sources are ERP systems for financial data, CRM for customer insights, HR systems for workforce data, and supply chain systems for operational metrics.
To connect your data sources, go to portermetrics.com, choose the data sources to bring to your report.
You can follow these tutorials on connecting your data:
Choose a template
Choose from dozens of executive report templates in Google Sheets or Looker Studio, designed for use cases like financial monitoring, operational efficiency, strategic goal tracking, and resource management.
Learn to copy Looker Studio templates.
While templates are the starting point. Make them specific for your business or organization. Map your specific metrics, especially custom financial metrics, CRM data, operational KPIs, and all the fields and metrics that you define as "key performance indicators" and "strategic goals".
Depending on your reporting tool—Google Sheets or Google Looker Studio, pick any of the dozens of templates created by our team and customers to solve your executive reporting use cases, such as financial monitoring, operational efficiency, strategic goal tracking, and resource management.
Select metrics, dimensions, and charts
Once your report template is downloaded, you may 1)modify it or 2) create a blank page to build it from scratch. Whatever the case, setting up a query always follows these steps:
- Select the data source and the account connected to it
- Choose metrics (e.g. Revenue, profit, operational efficiency, etc.).
- Choose breakdowns to segment your data (e.g. by date, department, project, etc.)
You can follow these tutorials on adding data to your reports
Design
To make your executive reports truly white-label you can add logos, colors, fonts, and styling to mirror your brand.
Follow these tutorials to design your executive reports:
Share
Share your executive reports via links, PDF, schedule emails, and control permissions.
KPIs to include in an executive report?
Executive reports should include a mix of financial, operational, strategic, and efficiency metrics and KPIs to fully understand the performance of the organization towards business goals. They include:
Financial KPIs measure the financial health and performance of the organization:
- Revenue metrics: total revenue, revenue growth, revenue per product/service
- Profitability metrics: gross profit, net profit, profit margins
- Cost metrics: total costs, cost of goods sold, operational expenses
Operational KPIs measure the efficiency and effectiveness of business operations:
- Productivity: output per employee, process cycle time
- Resource utilization: capacity utilization, inventory turnover
- Quality: defect rates, customer satisfaction
Strategic KPIs track progress towards strategic goals and initiatives:
- Goal achievement: percentage of goals met, milestone completion
- Innovation: new product launches, R&D investment
- Market position: market share, competitive analysis
To analyze these executive KPIs, segment them by:
- Department: finance, operations, HR, IT
- Time: Hourly, daily, weekly, monthly
- Project: strategic initiative, operational improvement
- Region: branch, country, global
- Customer: demographics, behavior, satisfaction
- Product/Service: category, lifecycle stage, performance