

B2B KPI tracker Dashboard template
The B2B KPI Tracker Dashboard Template is designed for businesses using HubSpot to monitor and analyze their performance metrics effectively. This template provides a structured approach to track essential KPIs, ensuring that your business objectives align with your operational activities.
With this dashboard, you can:
- Visualize critical performance indicators in real-time.
- Integrate seamlessly with HubSpot for automated data updates.
- Customize the dashboard to focus on specific metrics relevant to your business goals.
Utilize this template to maintain a clear overview of your business’s performance, facilitating data-driven decision-making and strategic planning.
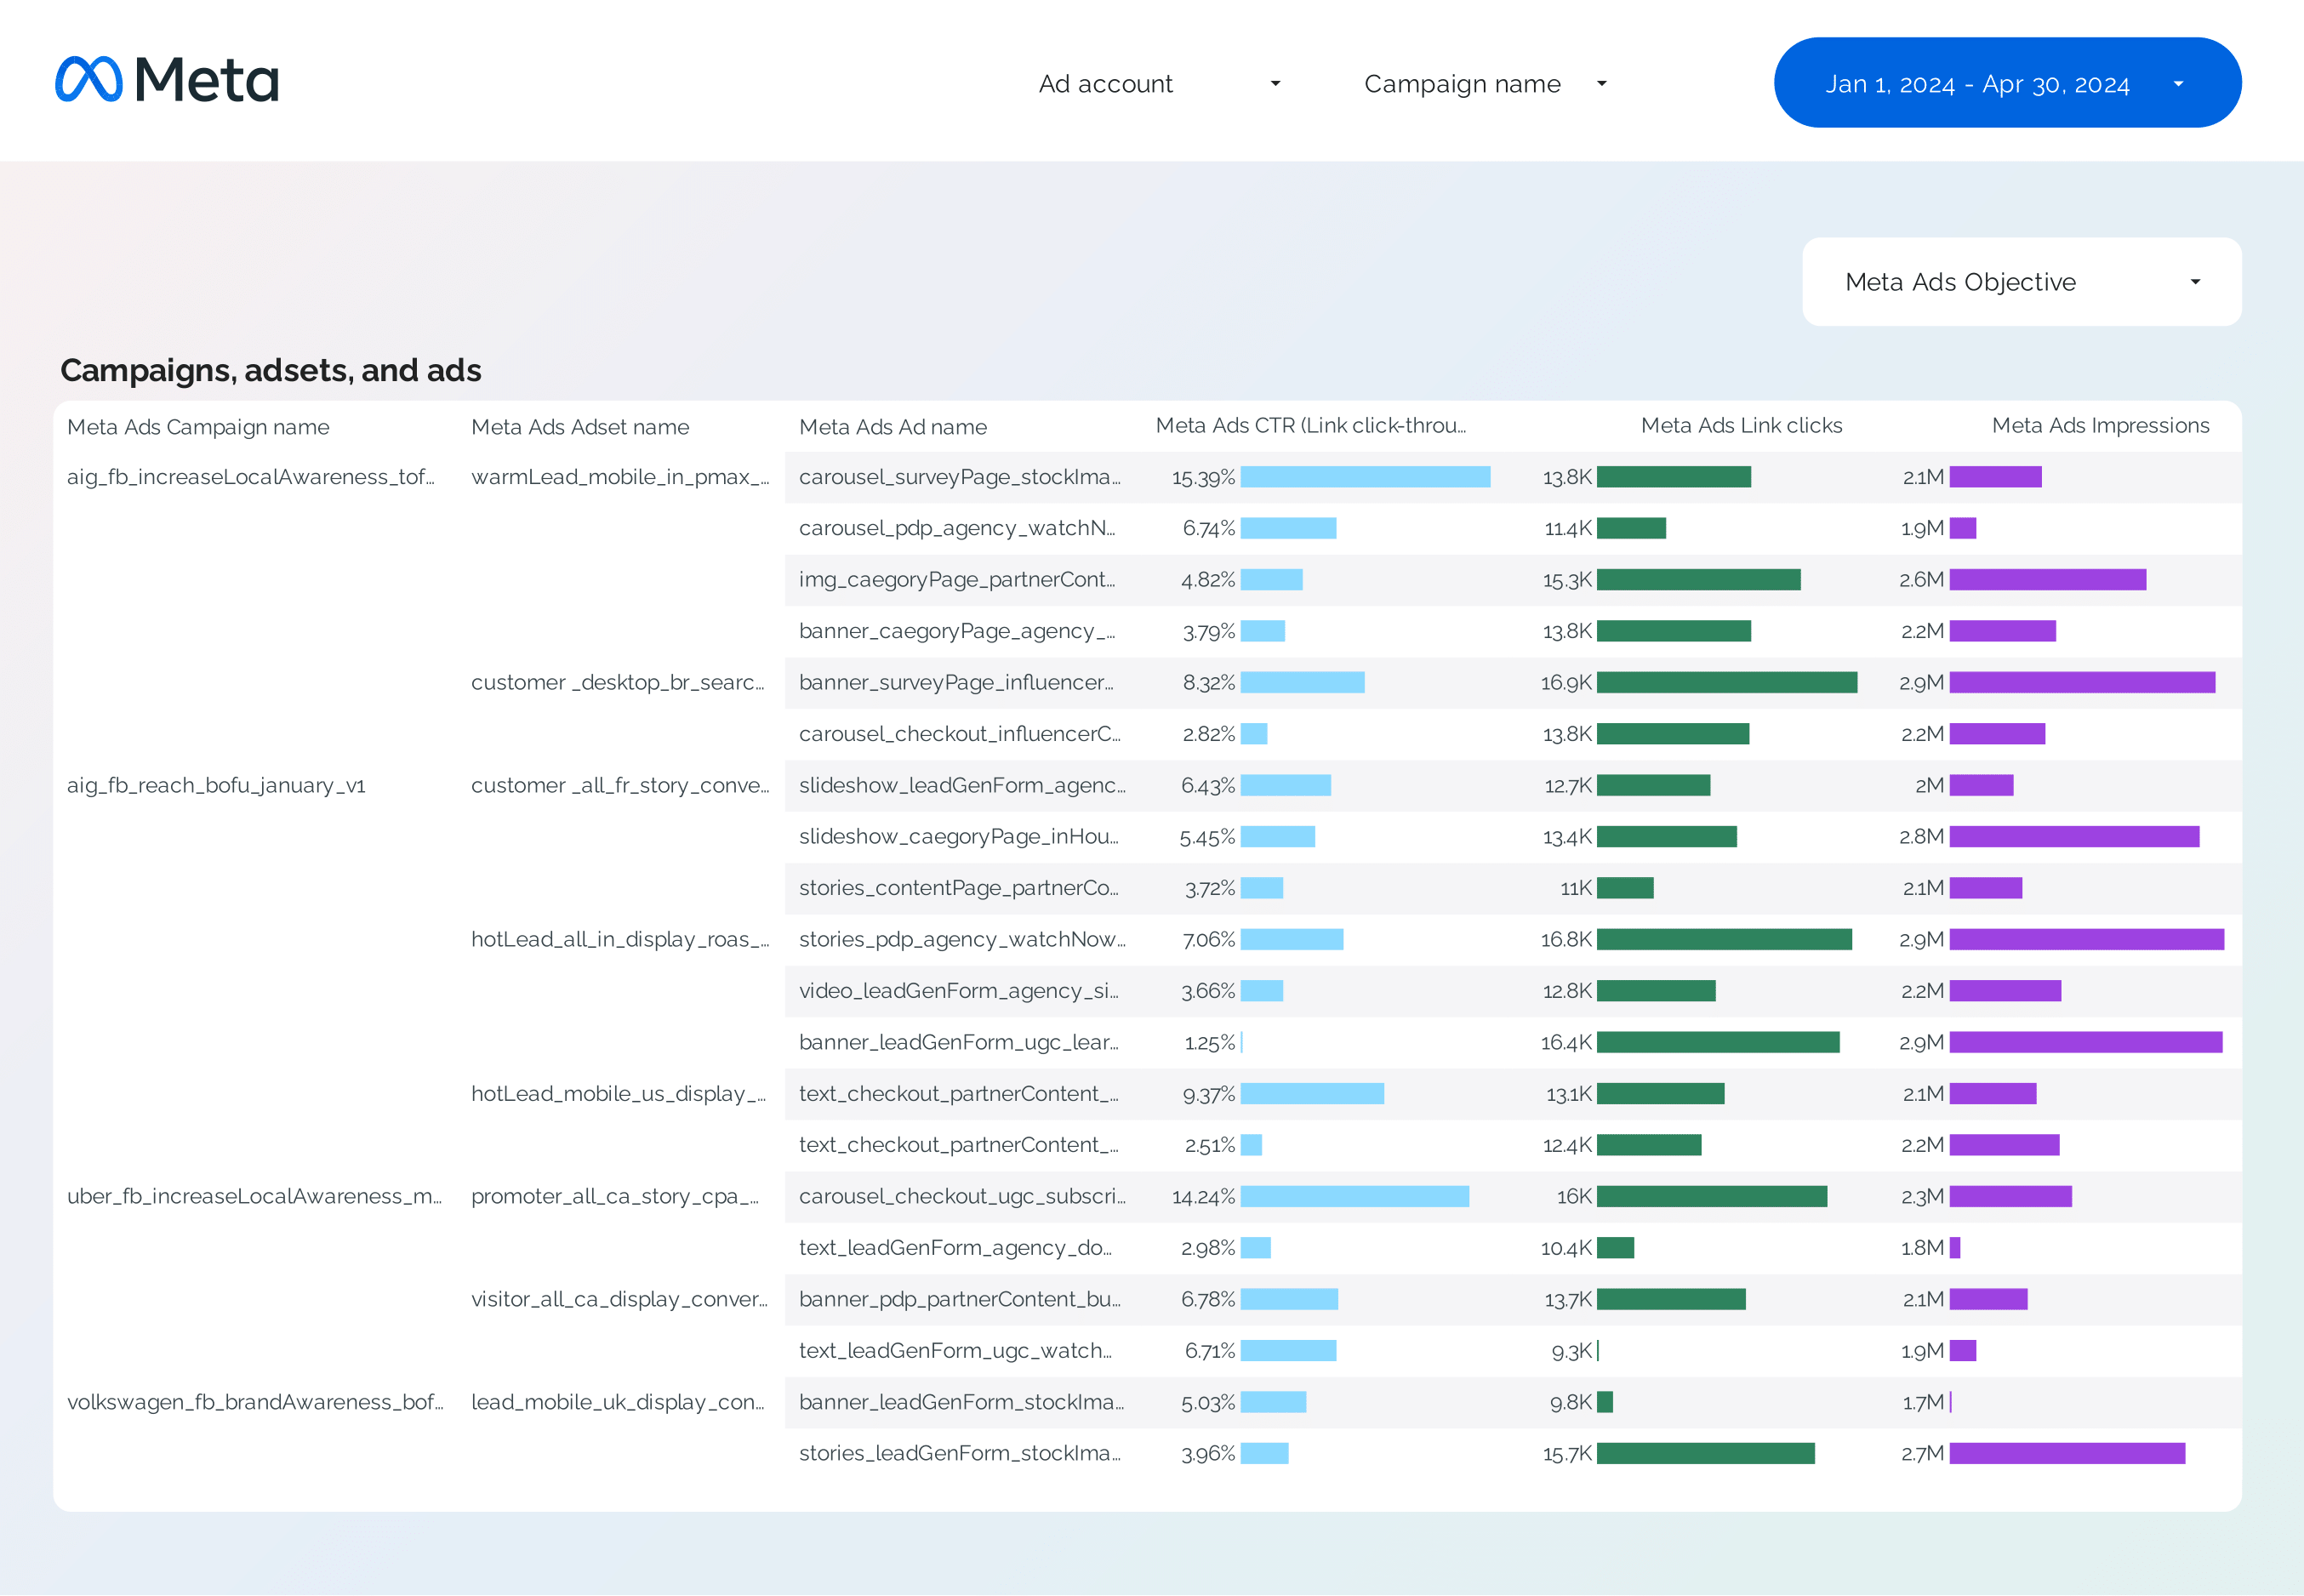
Facebook Ads Campaign performance Dashboard template
This Facebook Ads Campaign Performance Dashboard template provides a detailed overview of your PPC campaigns. It is designed to help you monitor and analyze the performance of your Facebook Ads in real-time.
Features include:
- Impressions and Reach: Track the number of times your ads are displayed and the unique users reached.
- Click-Through Rate (CTR): Measure the percentage of users who clicked on your ad after seeing it.
- Conversion Tracking: Monitor the actions users take after interacting with your ad, such as purchases or sign-ups.
- Cost Analysis: Evaluate your ad spend, cost per click (CPC), and cost per acquisition (CPA).
- Audience Insights: Analyze demographic data to understand who is engaging with your ads.
This dashboard is essential for marketers looking to optimize their Facebook Ads strategy and maximize ROI.
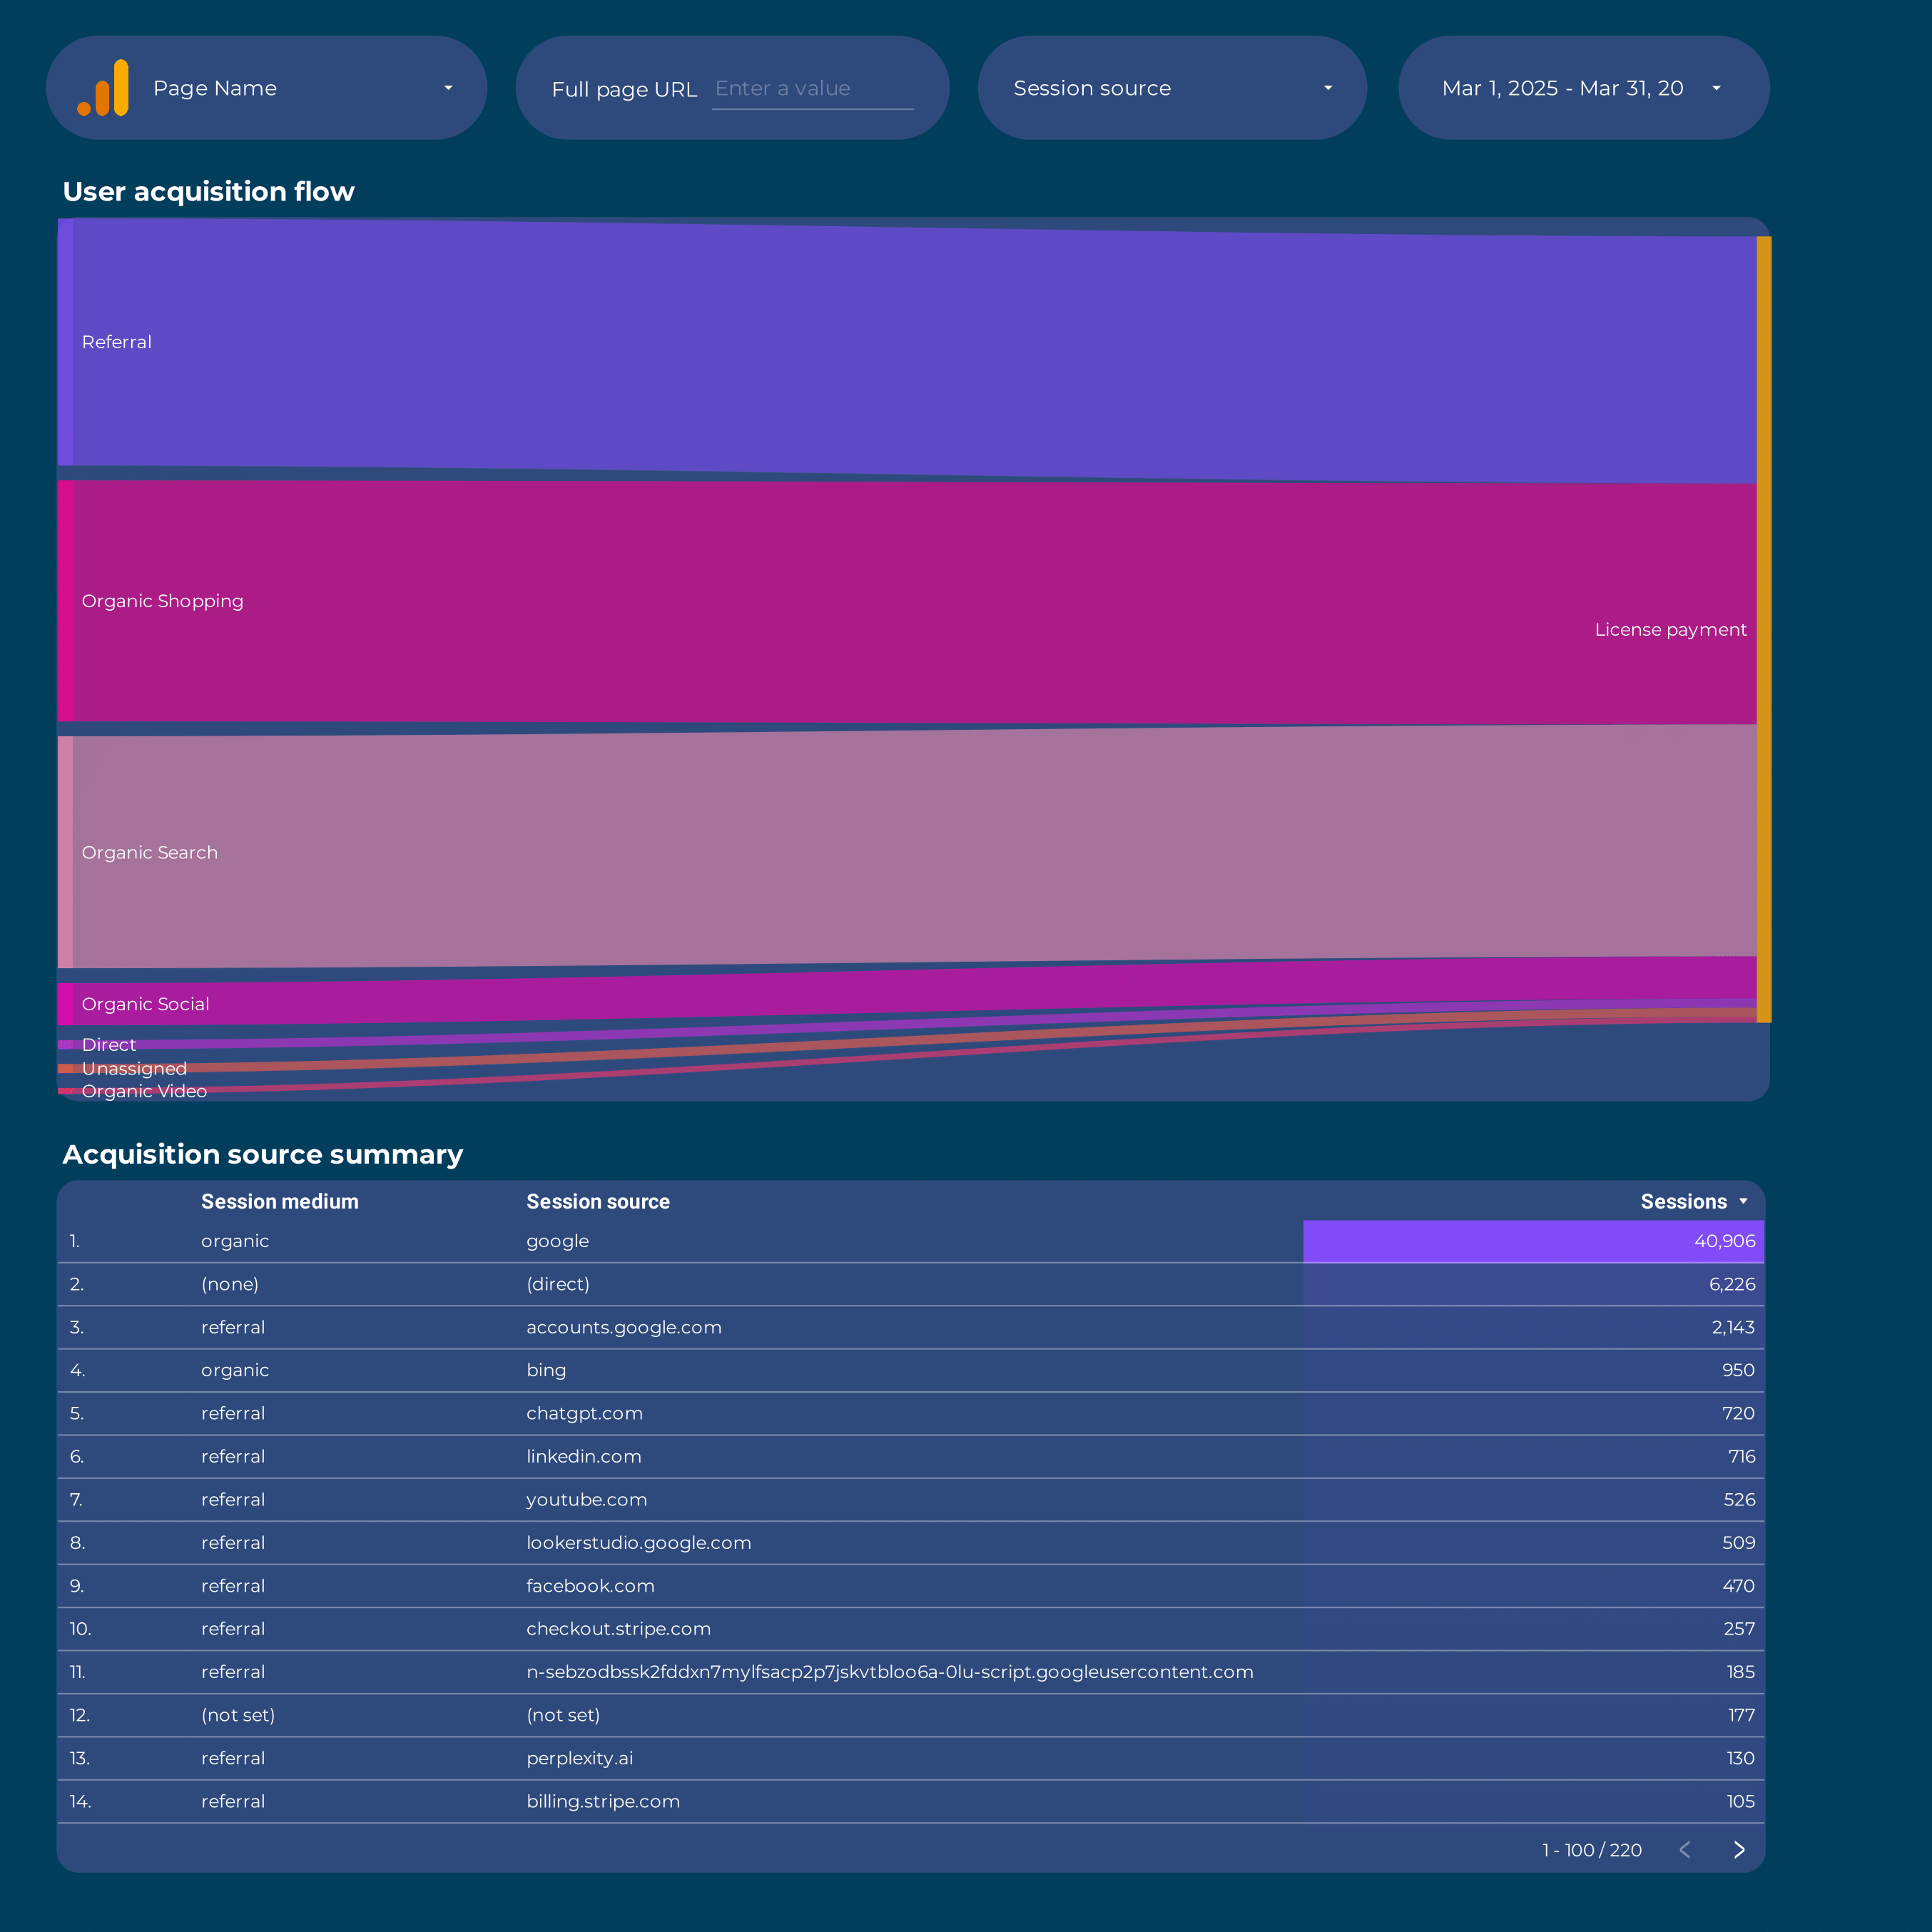
Google Analytics 4 Attribution Dashboard template
The Google Analytics 4 Attribution Dashboard template provides a detailed view of your marketing channels’ performance. This dashboard is designed to help marketers understand the attribution paths that lead to conversions, offering insights into how different channels contribute to your business goals.
With this dashboard, you can:
- Analyze multi-channel attribution to see how various marketing efforts work together.
- Track conversion paths to identify the most effective sequences of interactions.
- Evaluate the impact of each channel on your overall marketing strategy.
Utilize this template to gain a deeper understanding of your customer journey and optimize your marketing strategies based on data-driven insights.
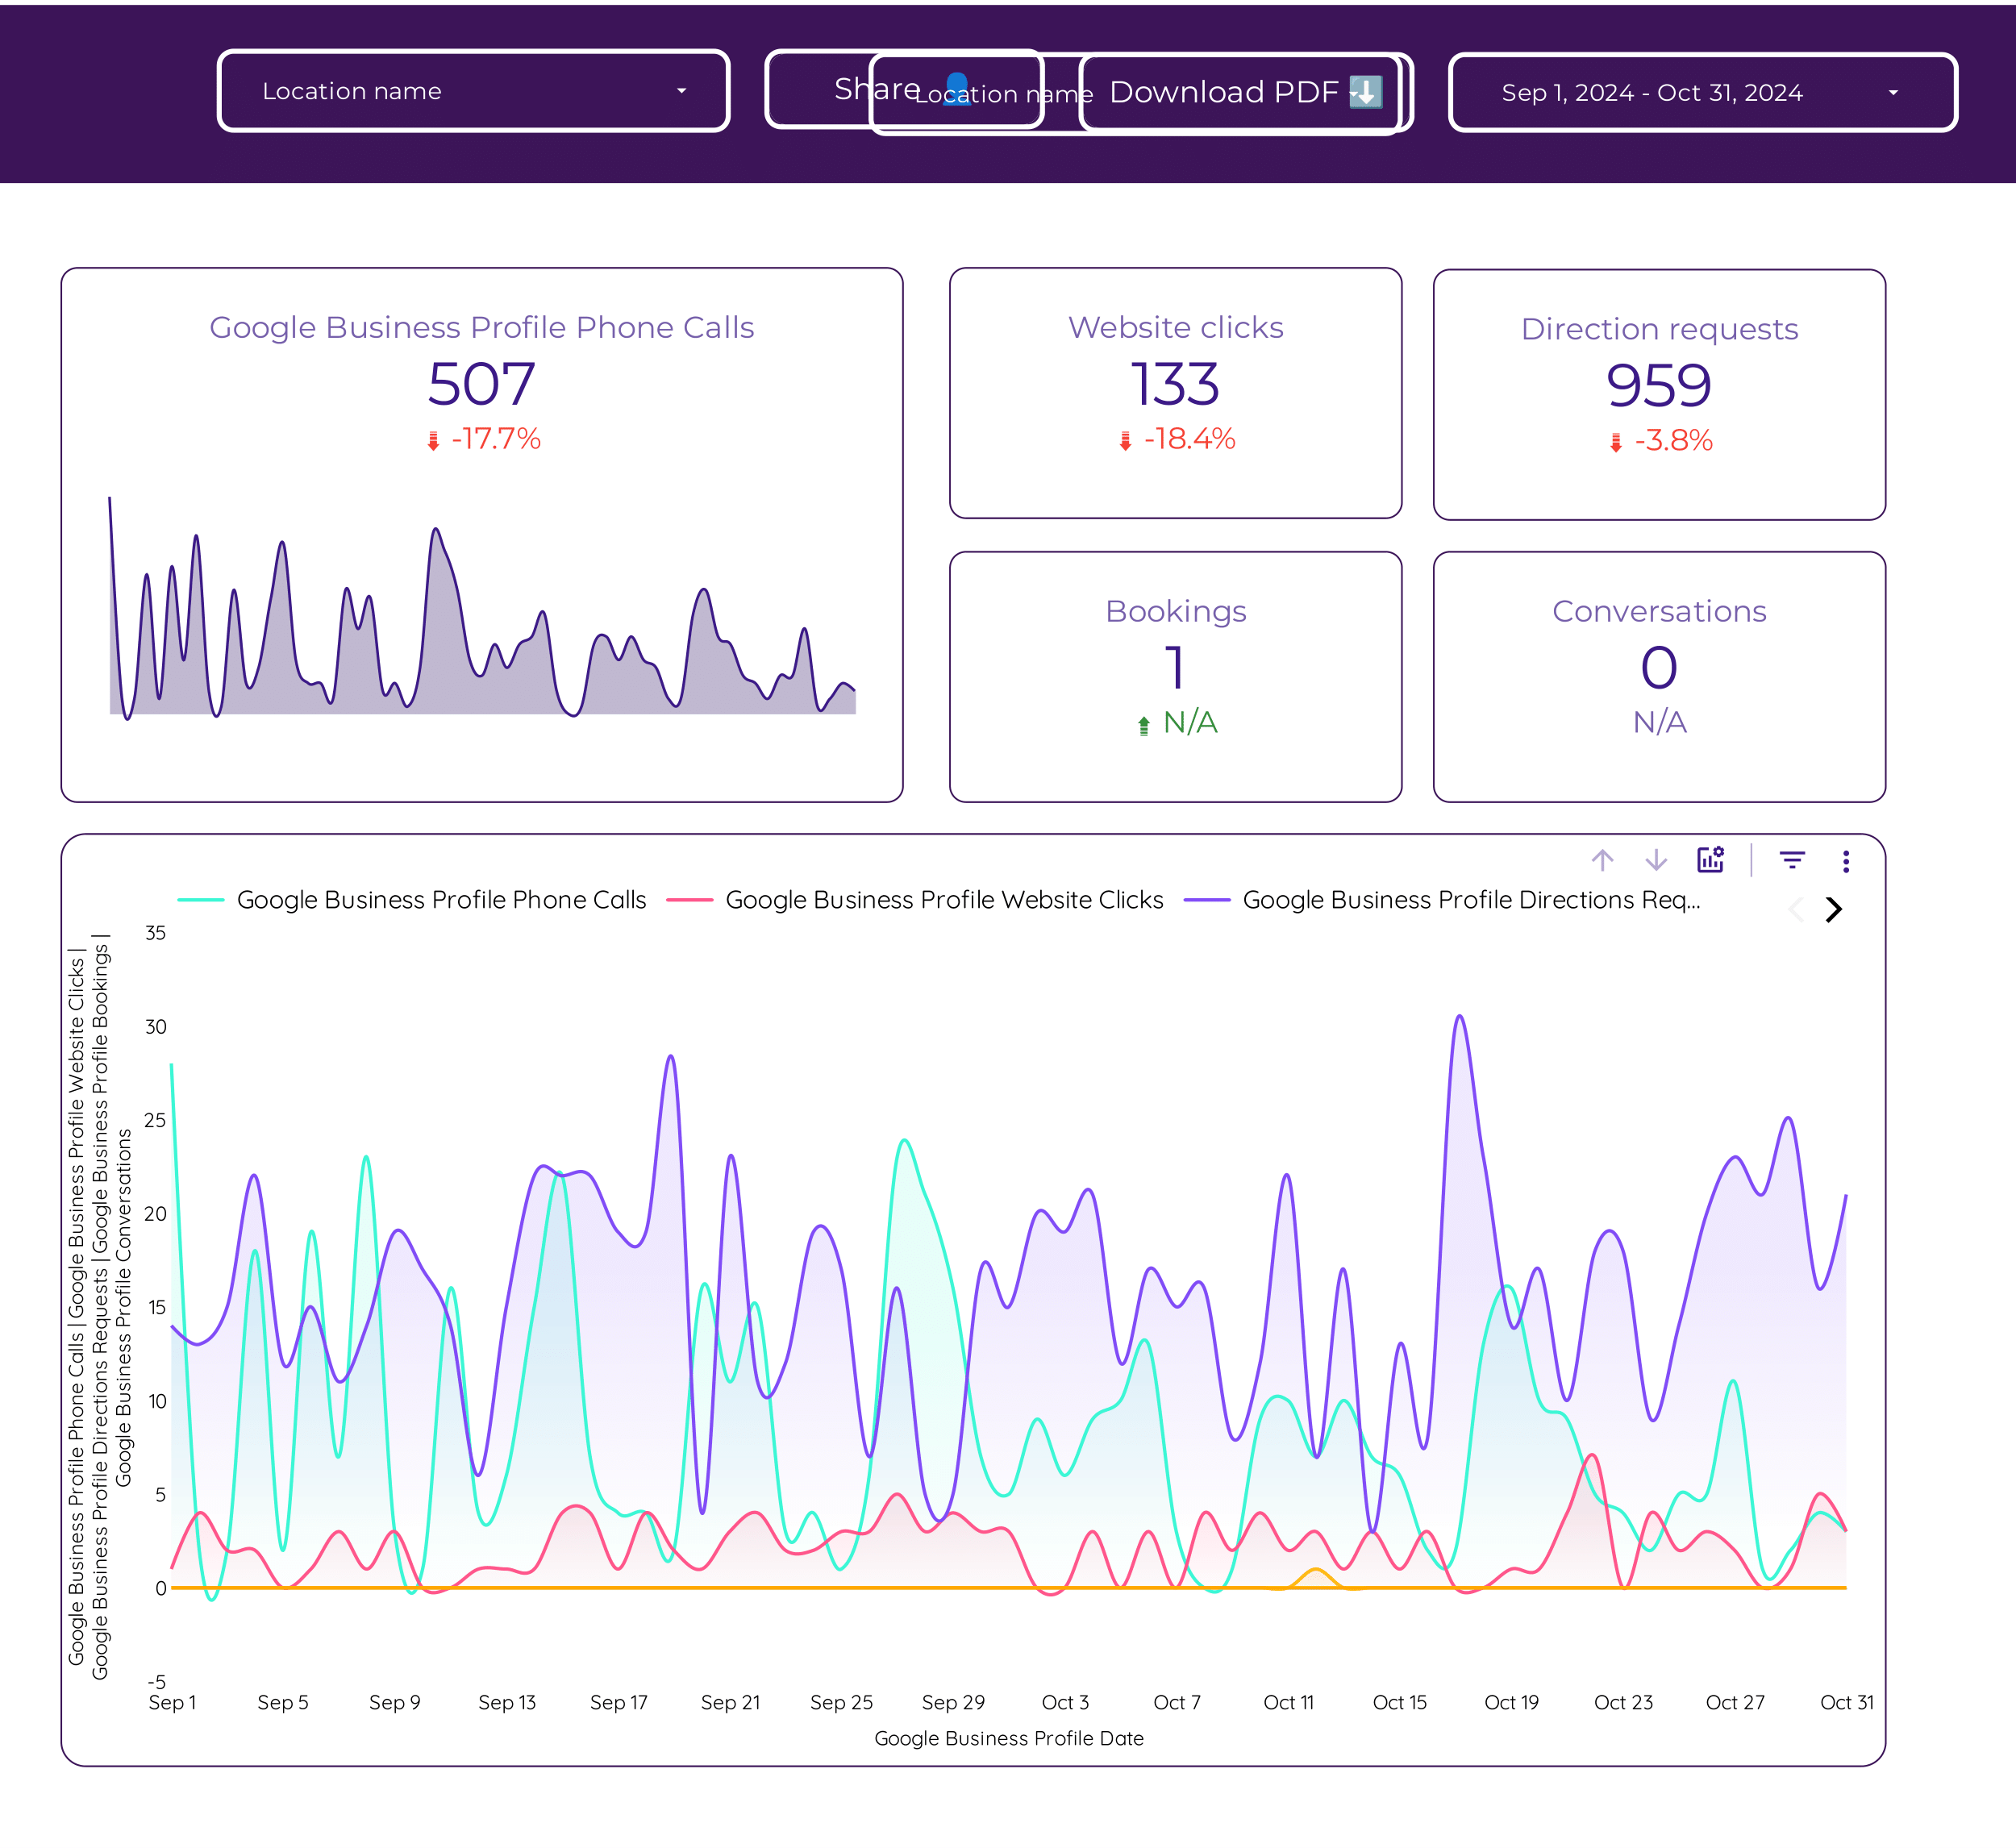
Local SEO Dashboard template
The Local SEO Dashboard template is designed to streamline the management of your Google Business Profile and enhance your local search visibility. This tool provides a centralized platform to monitor and analyze your local SEO performance.
With this dashboard, you can:
- Track your Google Business Profile metrics, including views, clicks, and customer actions.
- Monitor local search rankings and identify trends over time.
- Analyze customer reviews and ratings to understand public perception.
- Identify opportunities for improvement in your local SEO strategy.
Utilize this dashboard to maintain a competitive edge in local search results and ensure your business is easily discoverable by potential customers.

SEO Dashboard template
The SEO Dashboard Template is designed to streamline your SEO strategy by integrating data from Google Search Console and other analytics tools. This template provides a centralized view of your website’s performance metrics, enabling data-driven decisions for content marketing and branding.
Features include:
- Google Search Console Integration: Automatically pull search performance data to monitor clicks, impressions, and average position.
- Content Performance Analysis: Evaluate the effectiveness of your content marketing efforts by tracking page views, bounce rates, and user engagement.
- Brand Visibility Metrics: Assess your brand’s online presence with insights into search queries and audience demographics.
Utilize this dashboard to align your SEO efforts with business objectives, ensuring a cohesive approach to improving search rankings and online visibility.
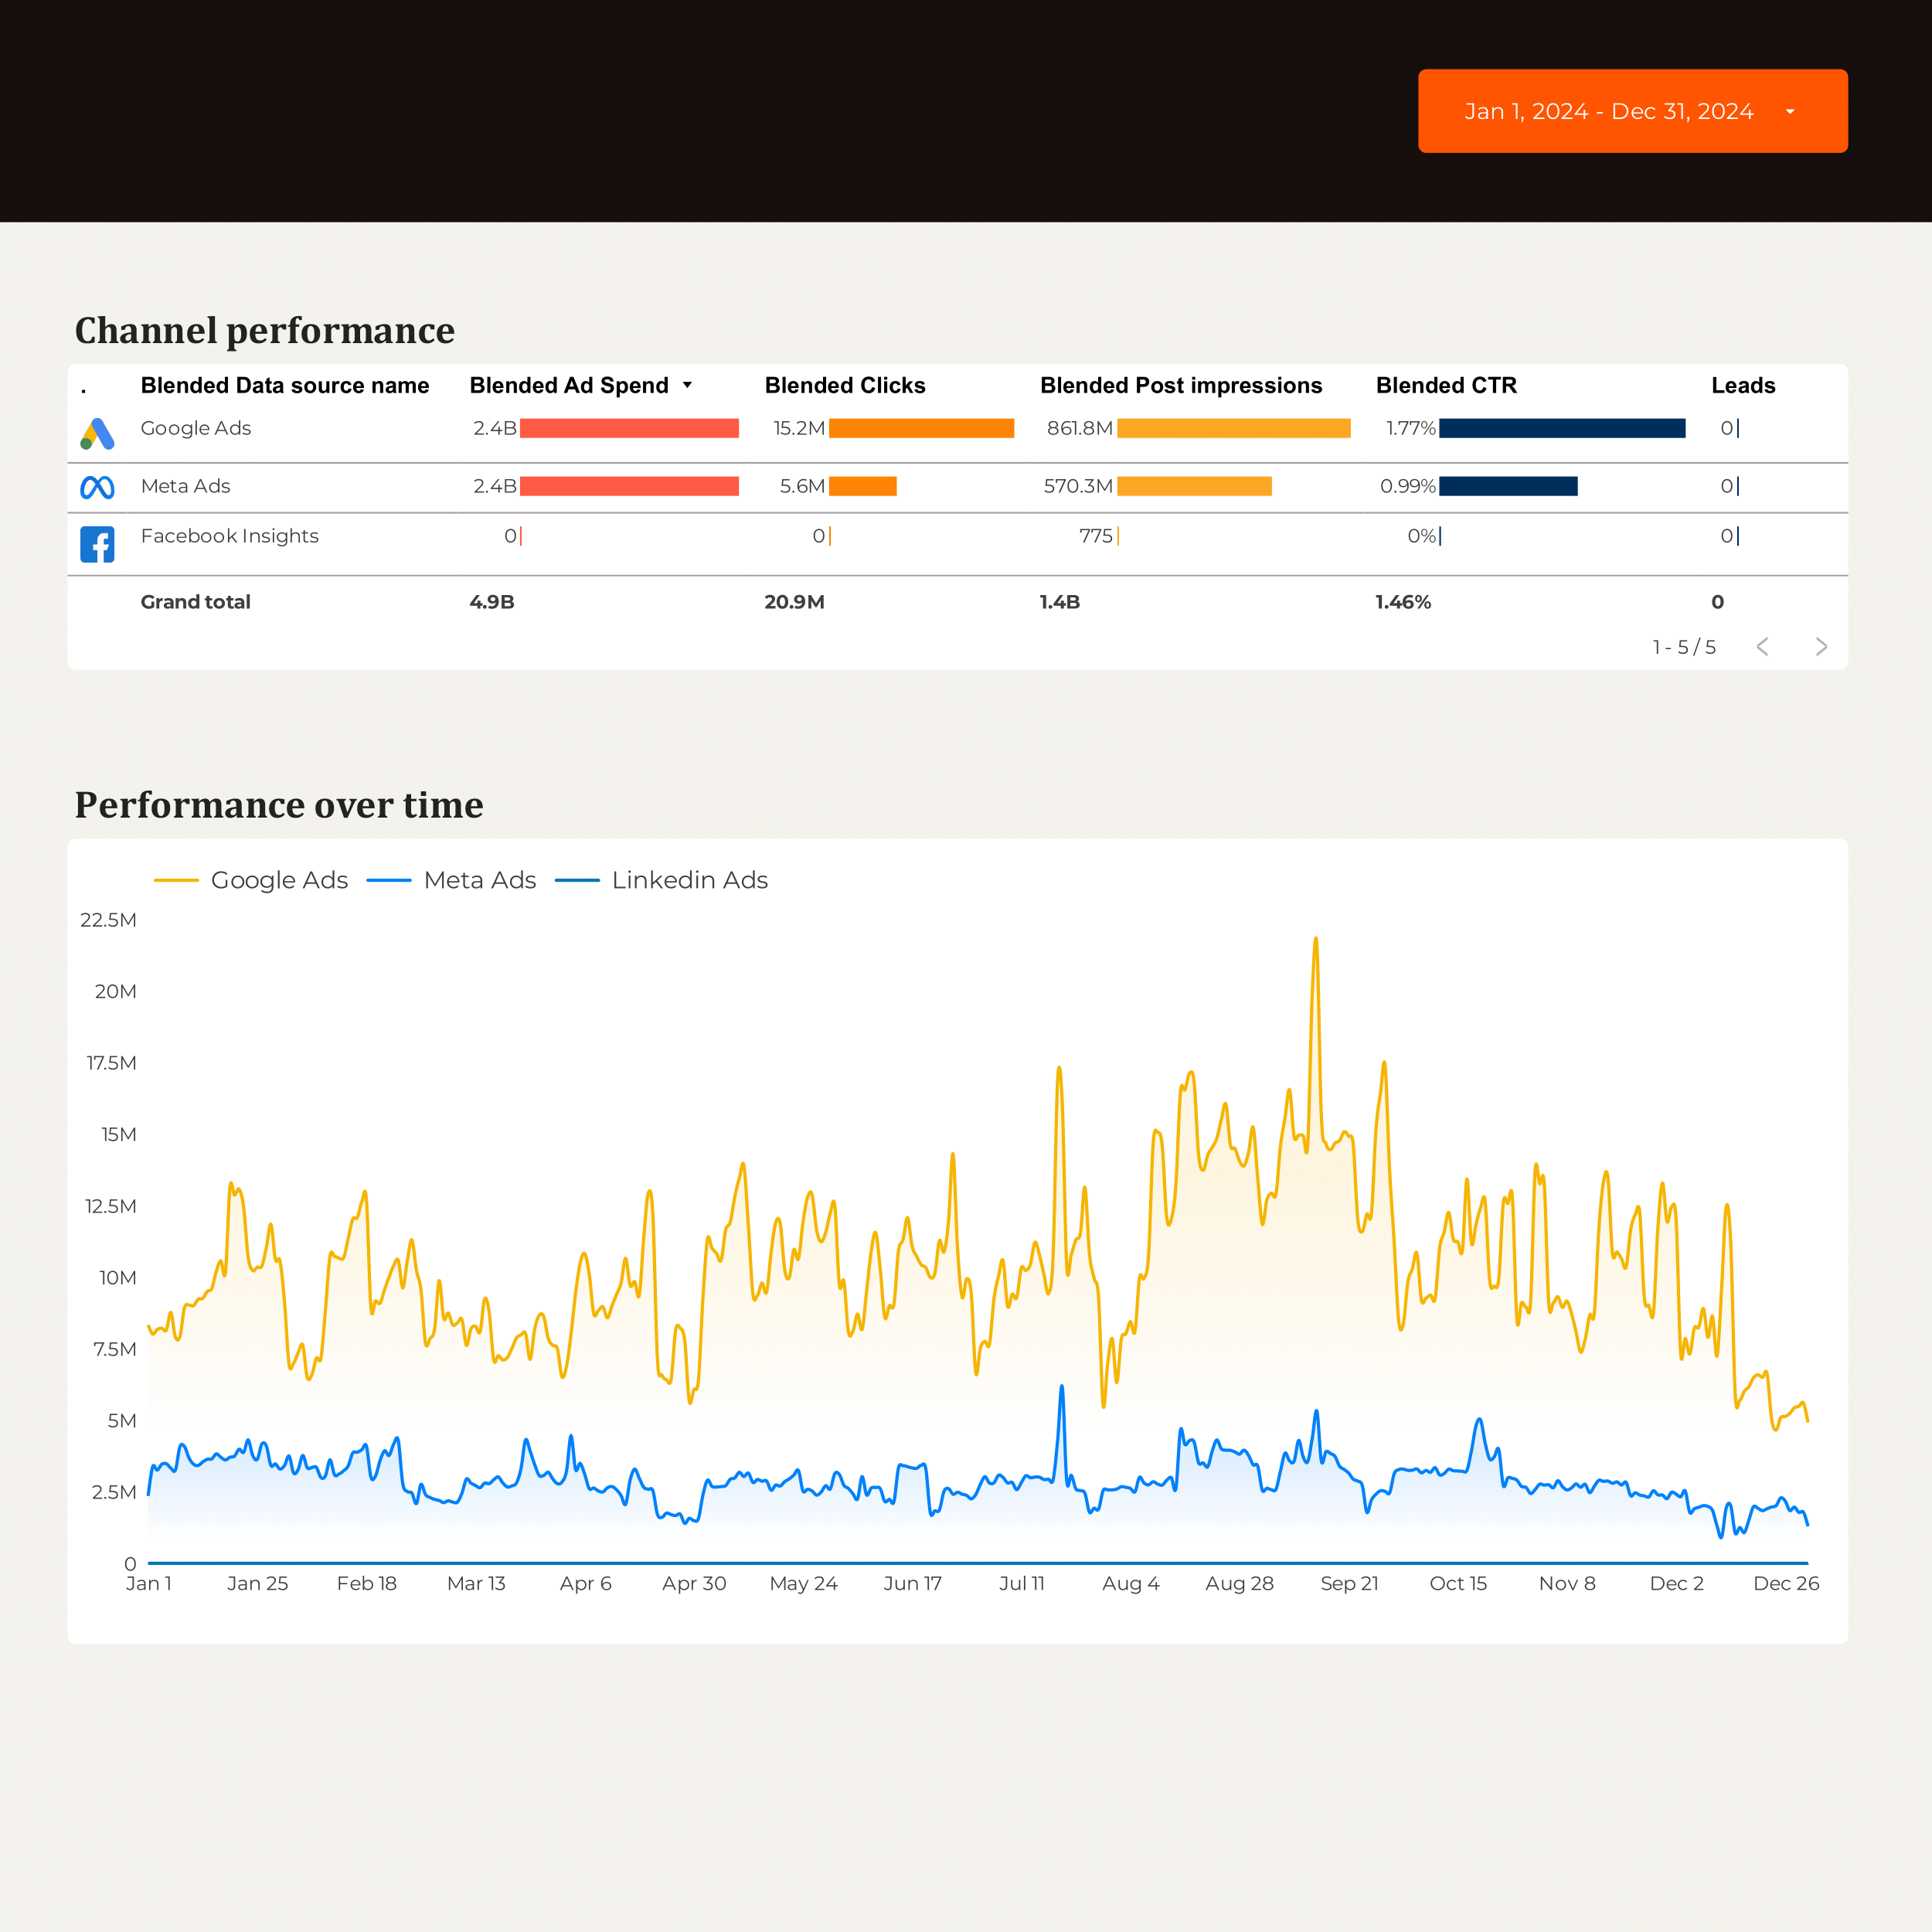
B2B Marketing performance Dashboard template
The B2B Marketing Performance Dashboard template provides a centralized view of your marketing efforts across multiple channels. This dashboard integrates data from CRM systems, Email Marketing platforms, and advertising networks to offer a complete picture of your marketing performance.
Track and analyze data from:
- HubSpot for CRM insights and lead management.
- Google Ads and Facebook Ads for PPC campaign performance.
- LinkedIn Ads to monitor B2B engagement and conversions.
- Google Analytics 4 for web traffic and user behavior analysis.
This dashboard template allows you to monitor campaign performance, lead generation, and ROI metrics, providing actionable insights for strategic decision-making.
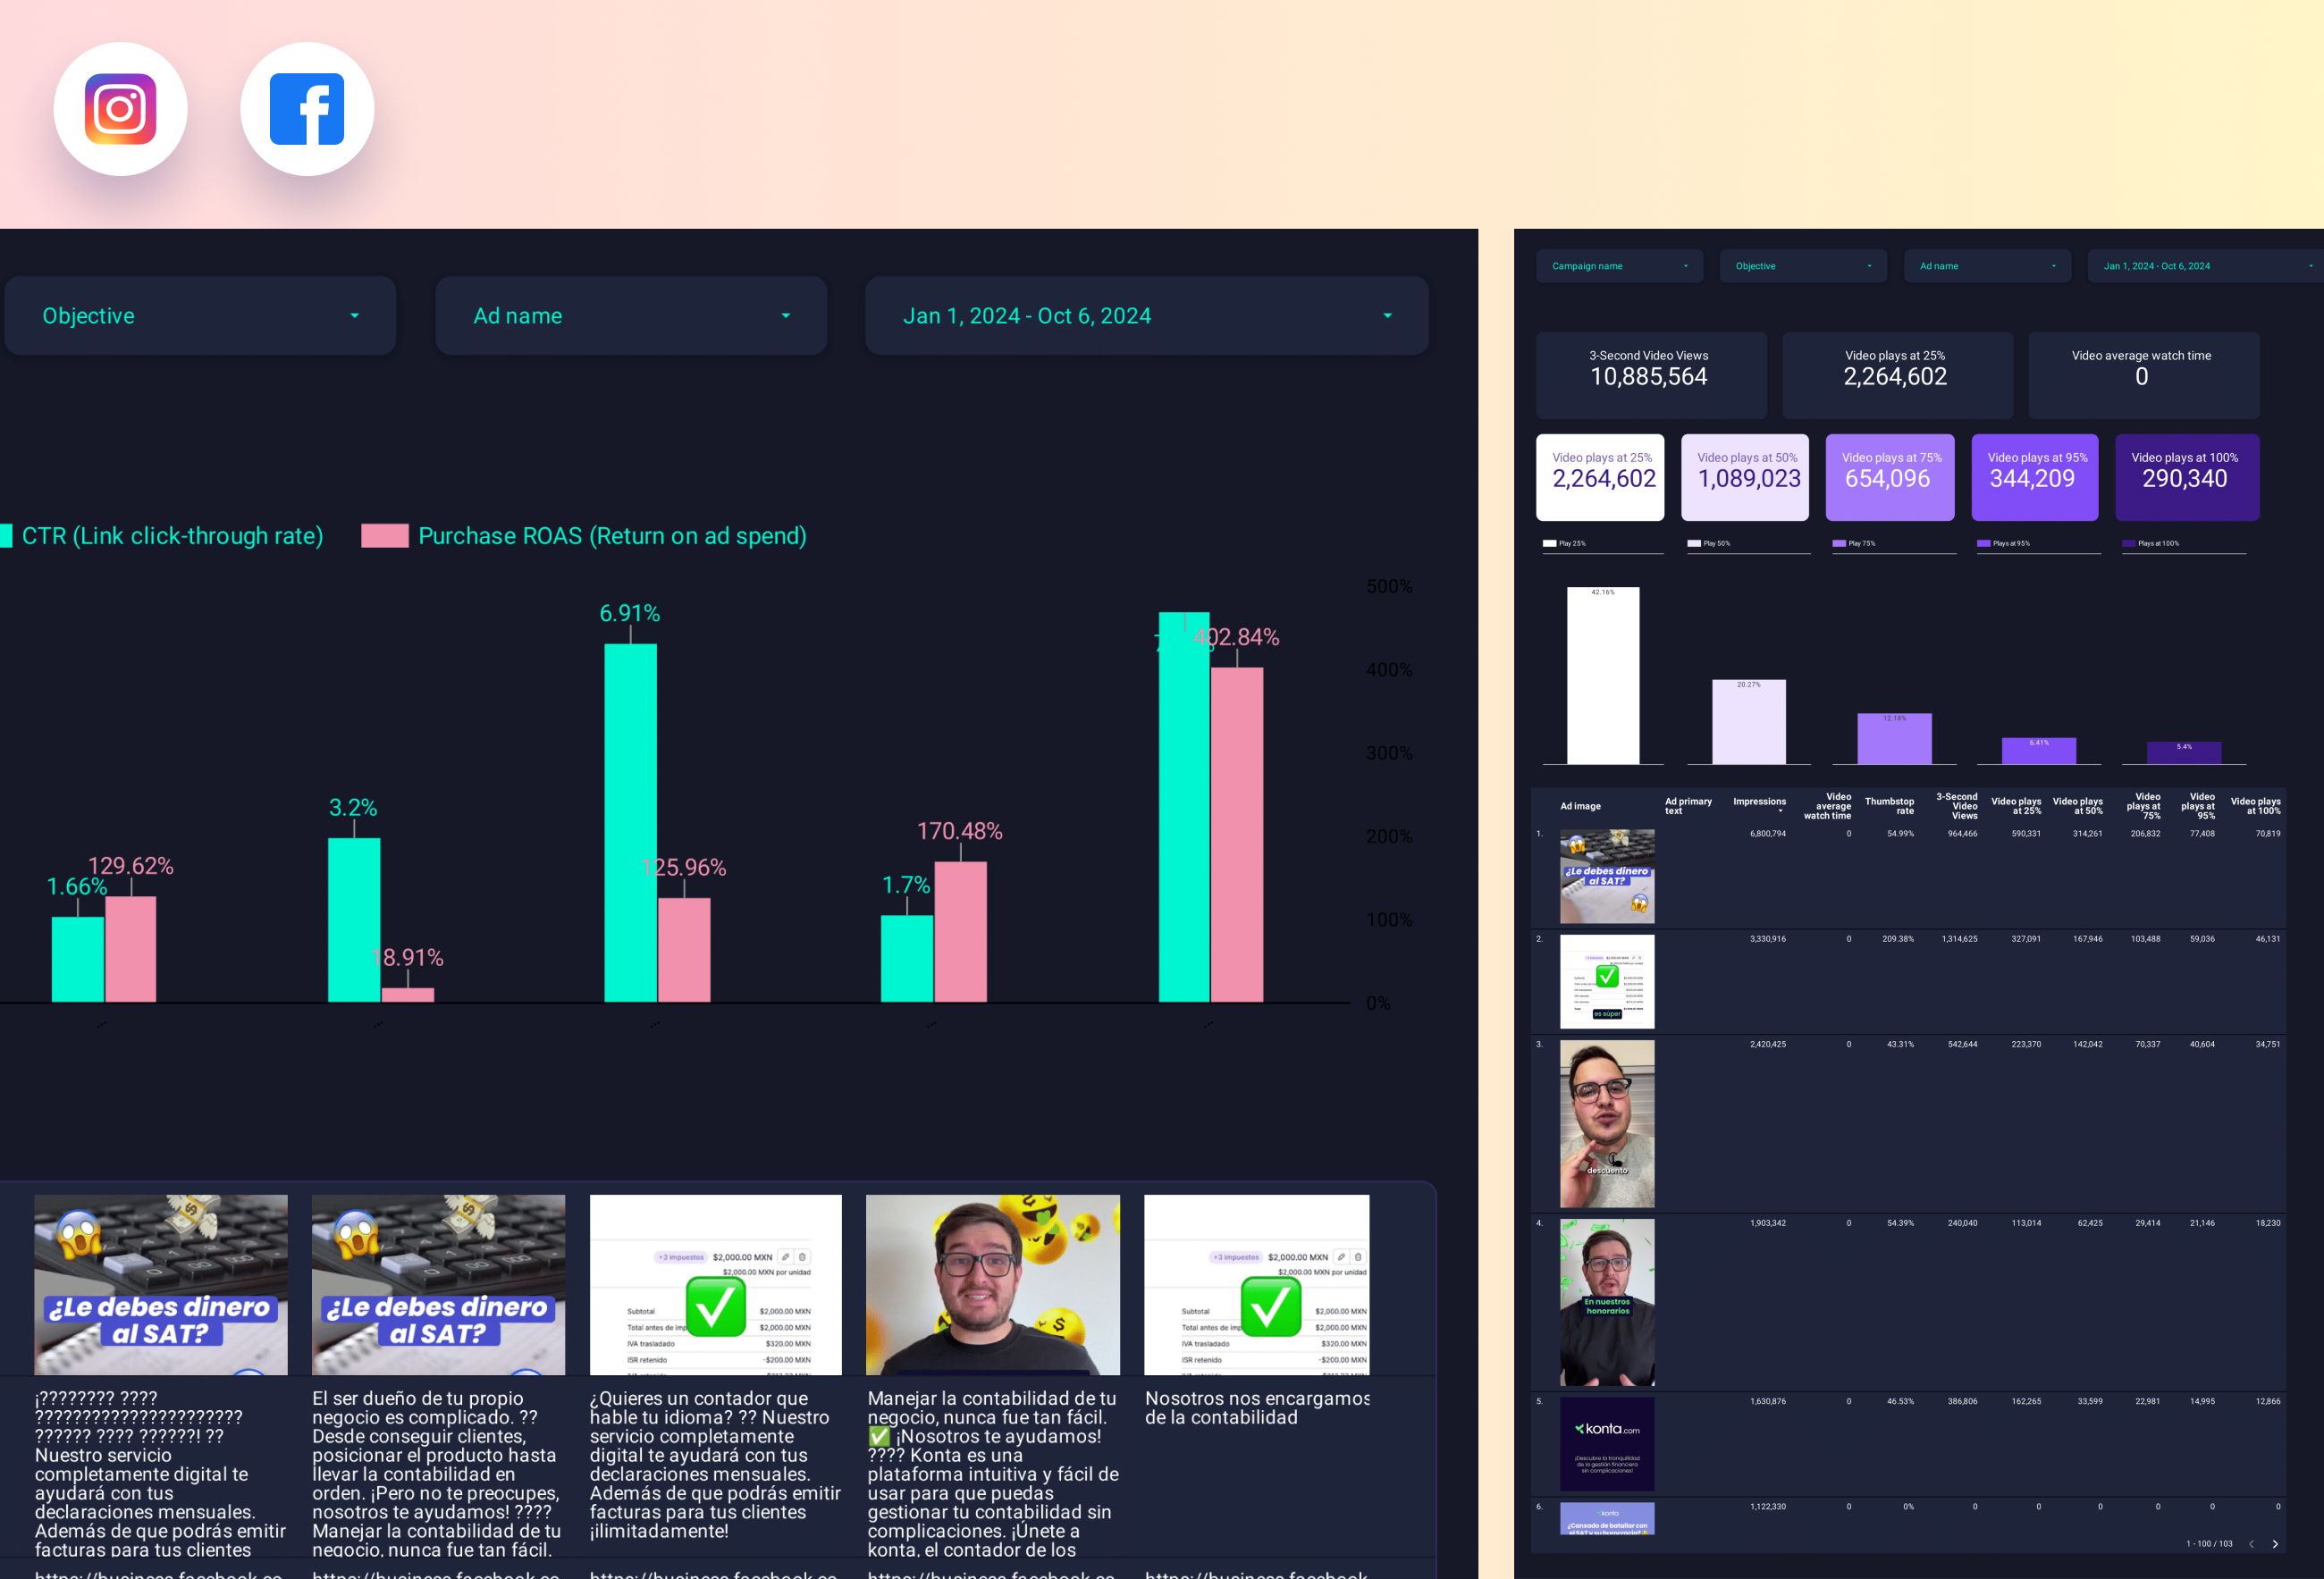
Facebook Ads Creative performance Dashboard template
The Facebook Ads Creative Performance Dashboard template is designed for marketers focused on PPC campaigns. This tool provides a structured view of your Facebook Ads performance, allowing for detailed analysis of creative elements.
With this dashboard, users can:
- Track ad performance metrics such as CTR, CPC, and conversion rates.
- Analyze creative variations to determine which visuals and copy drive the most engagement.
- Monitor audience interactions and demographic insights to refine targeting strategies.
Utilize this template to streamline your Facebook Ads analysis and optimize your PPC strategies effectively.
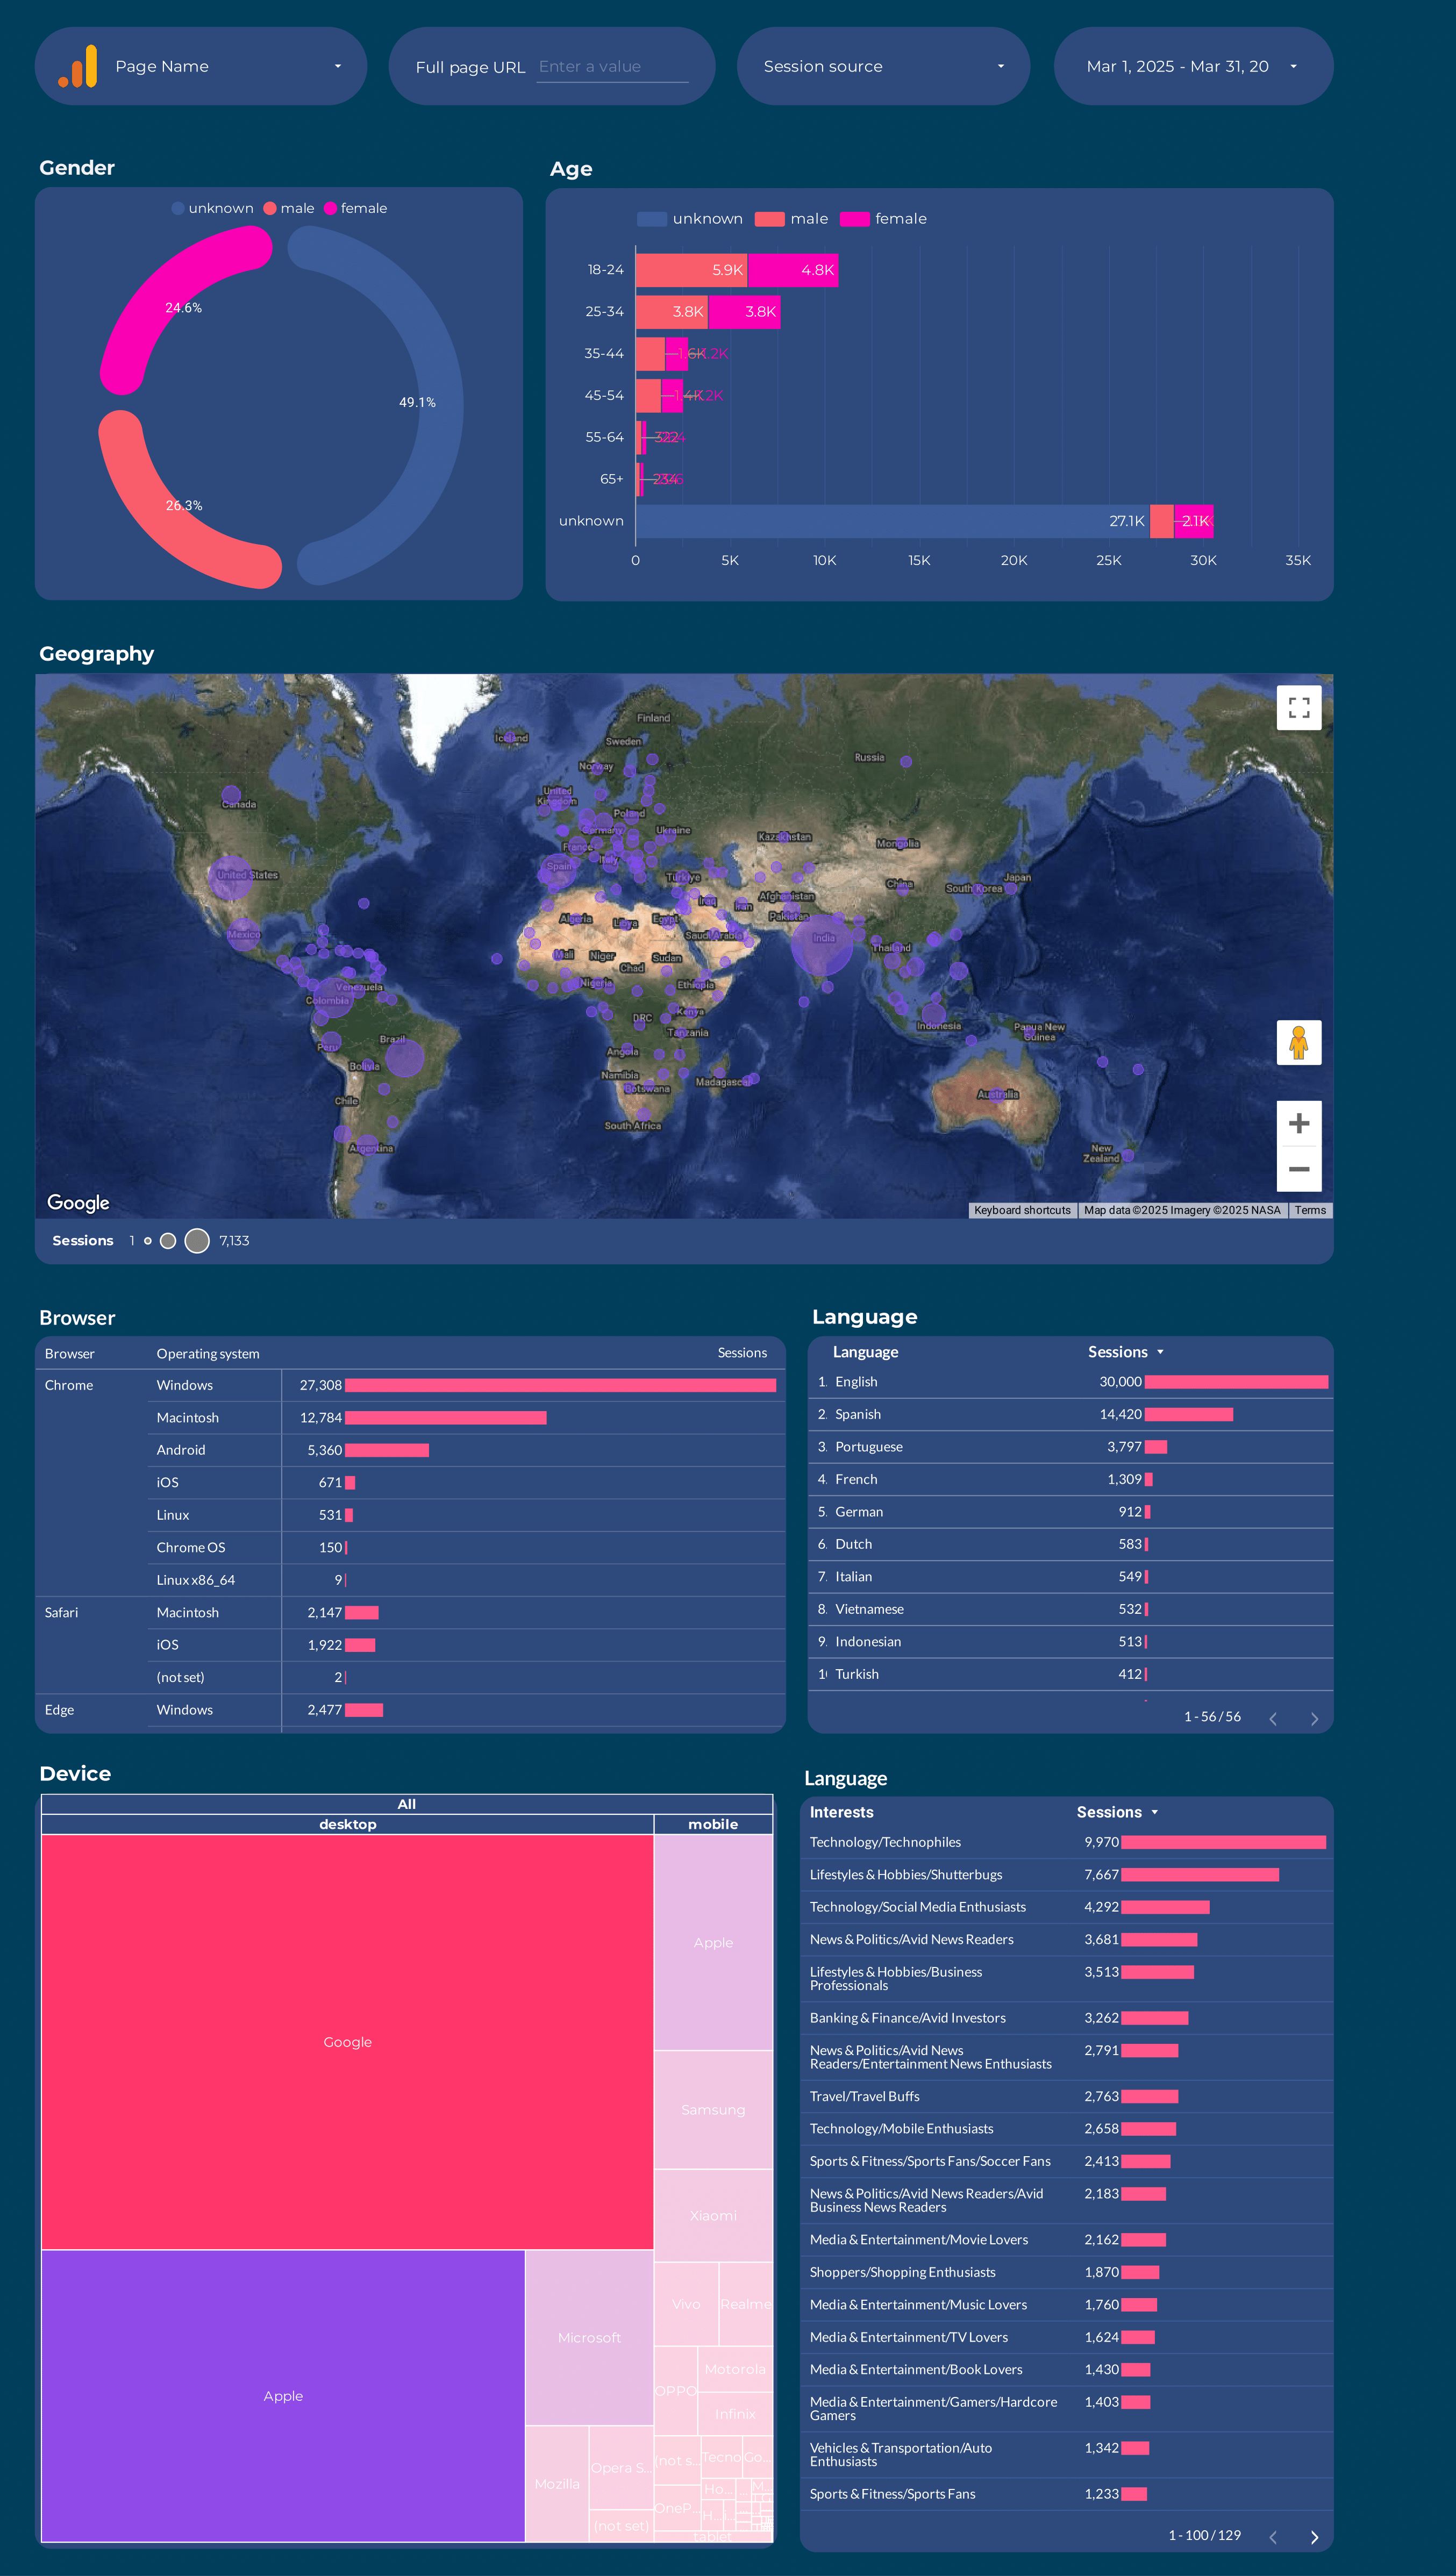
Google Analytics 4 Audience Dashboard template
The Google Analytics 4 Audience Dashboard template provides a structured view of your audience data, enabling marketers to make informed decisions. This template is designed to help you understand your audience’s behavior and demographics.
Features include:
- Real-time Audience Insights: Monitor live data to track user interactions as they happen.
- Demographic Breakdown: Analyze user demographics such as age, gender, and location.
- Behavioral Analysis: Examine user behavior patterns, including session duration and page views.
- Custom Segments: Create and analyze custom audience segments to tailor marketing strategies.
This dashboard template is essential for marketers looking to leverage Google Analytics 4 for audience analysis and strategic planning.
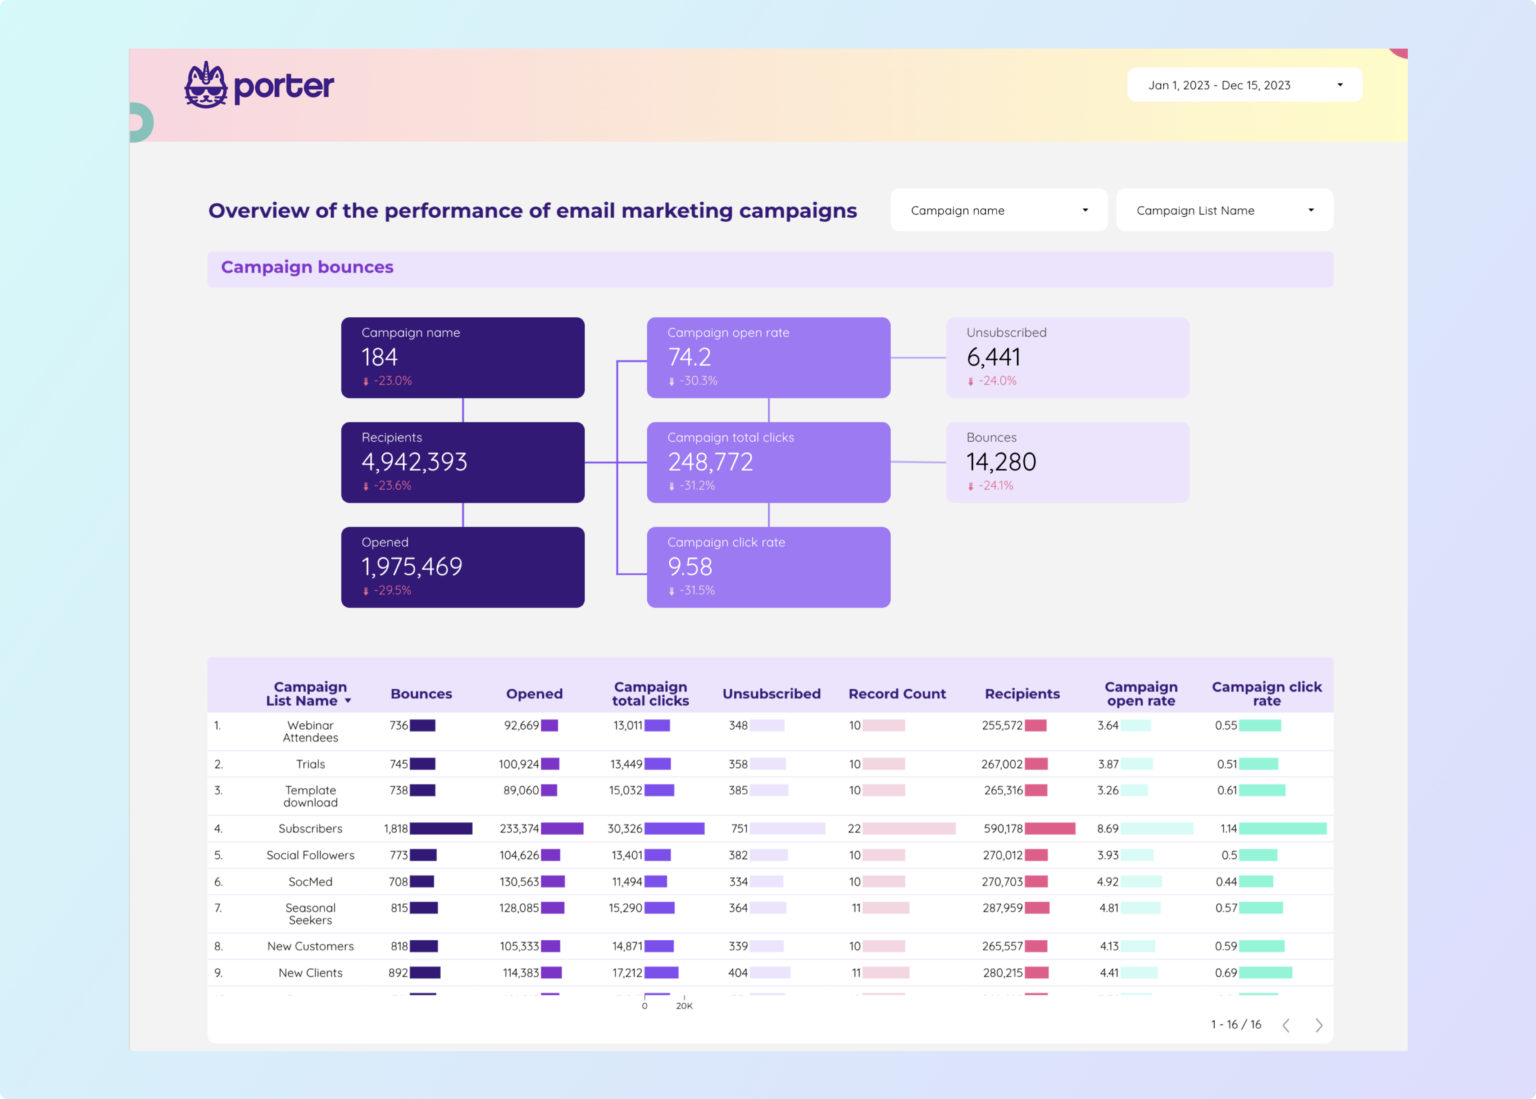
Mailchimp Dashboard template
The Mailchimp Dashboard Template is designed to streamline your email marketing efforts by providing a centralized hub for all your campaign activities. This template allows you to monitor and manage your email marketing campaigns with ease.
With this dashboard, you can:
- Track Campaign Performance: View real-time analytics on open rates, click-through rates, and subscriber engagement.
- Manage Subscriber Lists: Organize and segment your audience for targeted email campaigns.
- Automate Workflows: Set up automated email sequences to nurture leads and engage customers.
- Access Reporting Tools: Generate detailed reports to analyze the success of your email marketing strategies.
Utilize the Mailchimp Dashboard Template to gain insights into your email marketing performance and make data-driven decisions to optimize your campaigns.
SEO Keyword ranking tracker Dashboard template
Welcome to the SEO Keyword Ranking Tracker Dashboard, a powerful tool designed to streamline your SEO efforts by providing real-time insights into your keyword performance. This dashboard integrates seamlessly with Google Search Console to deliver accurate and up-to-date data.
With this dashboard, you can:
- Monitor the ranking positions of your targeted keywords.
- Analyze search visibility trends over time.
- Identify high-performing keywords and areas for improvement.
- Track click-through rates and impressions for each keyword.
Utilize this dashboard to make informed decisions and optimize your SEO strategy effectively. Stay ahead in the competitive landscape by keeping a close watch on your keyword rankings and search performance metrics.
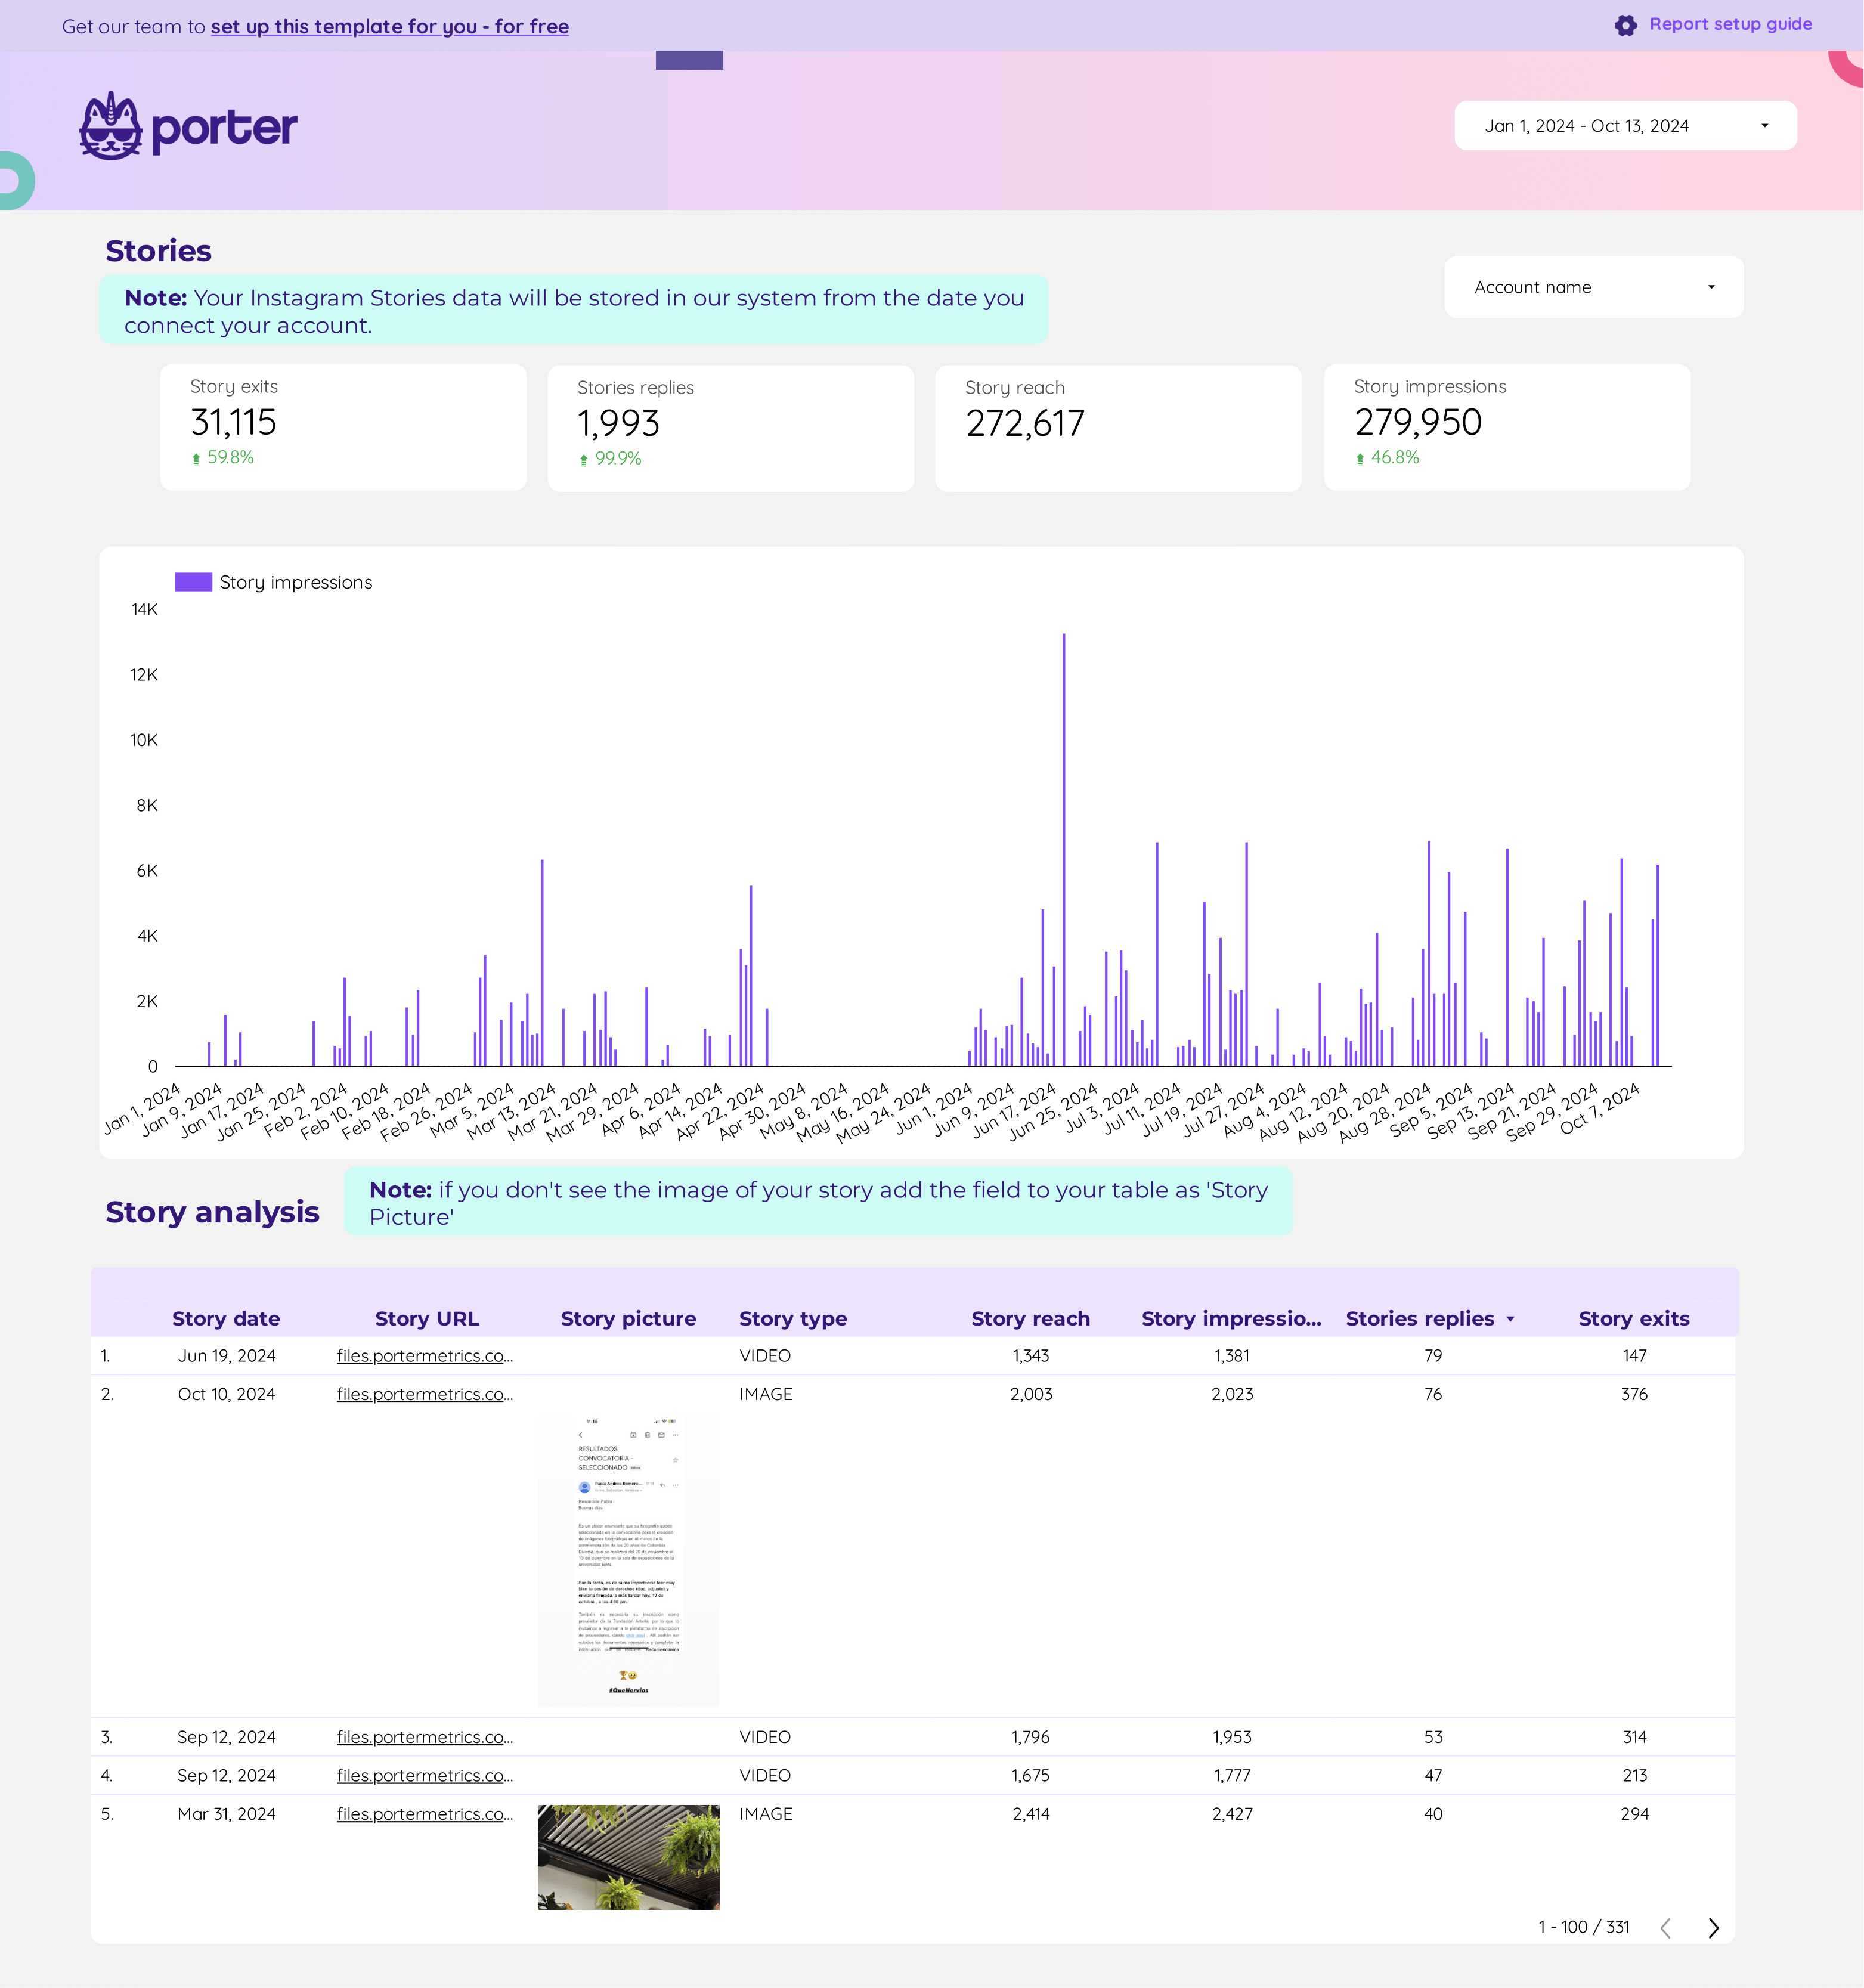
Community manager Dashboard template
The Community Manager Dashboard template is designed for social media professionals managing multiple platforms. This template provides a centralized view of Instagram Insights, Facebook Insights, LinkedIn Pages, Google Business Profile, Pinterest, and TikTok.
With this dashboard, users can:
- Track engagement metrics across all platforms.
- Analyze audience demographics and behavior.
- Monitor content performance and trends.
- Access real-time data for informed decision-making.
This tool is essential for maintaining a cohesive social media strategy and ensuring consistent brand messaging across various channels.
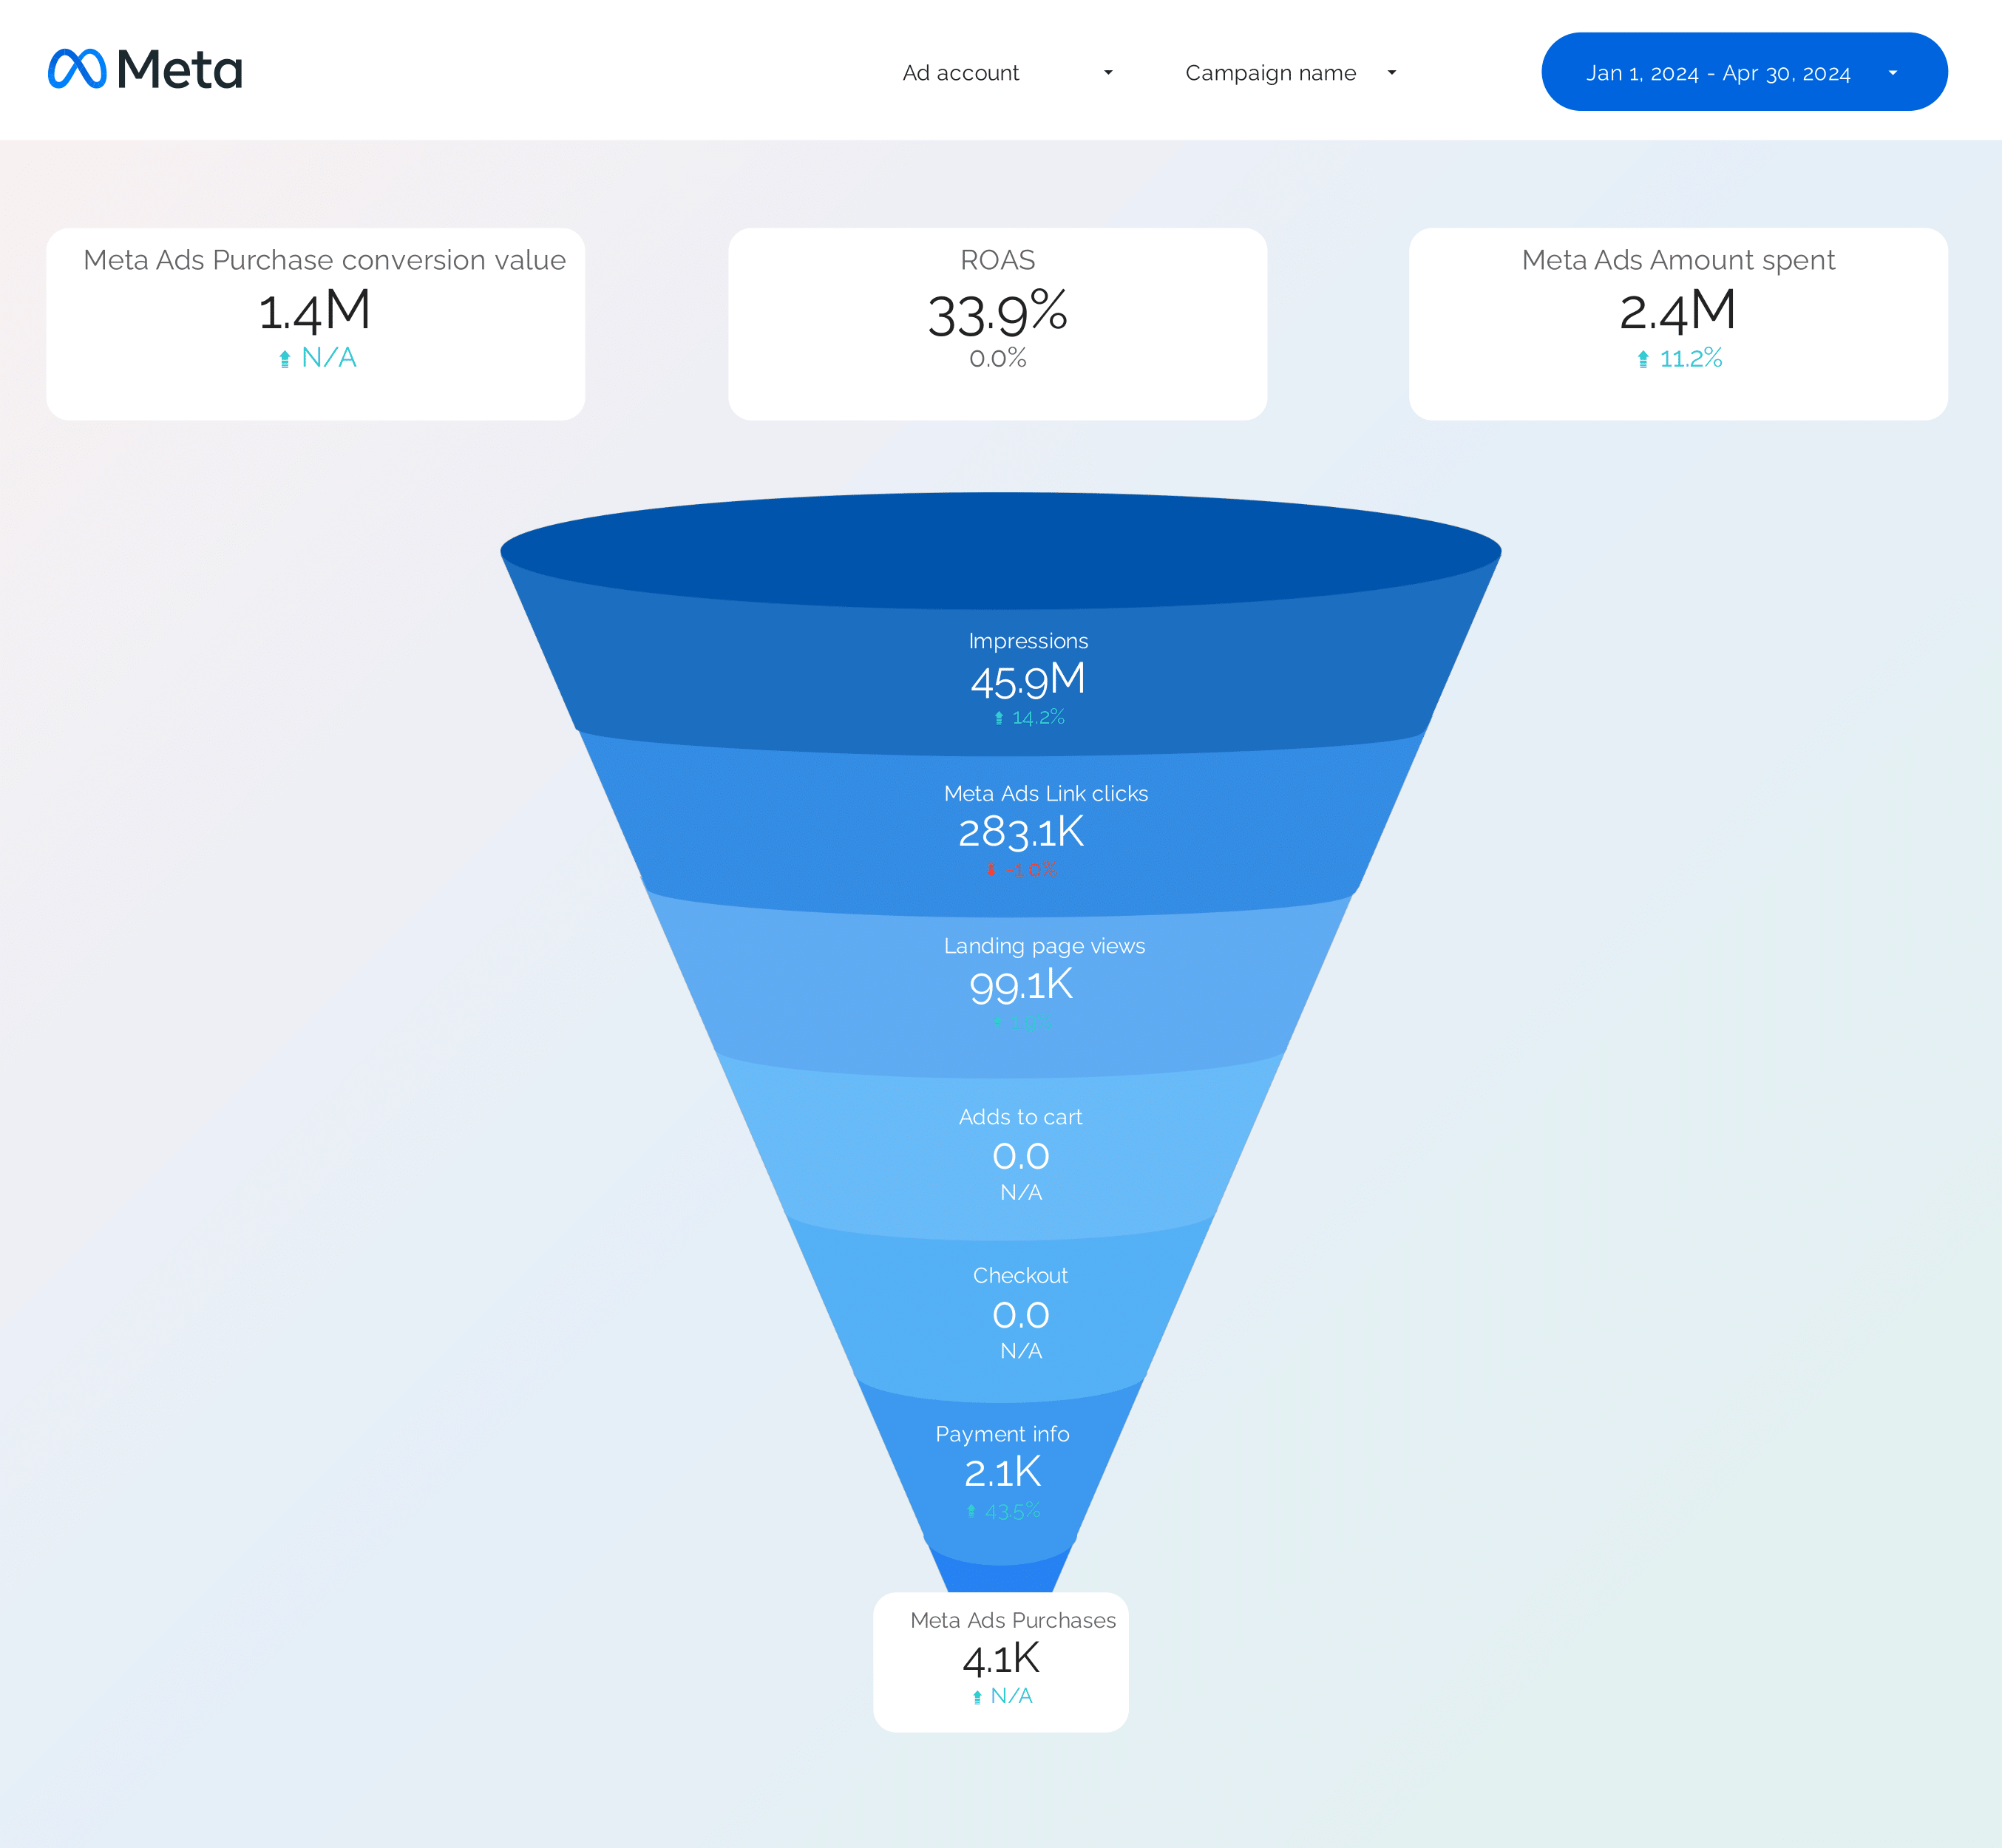
Facebook Ads Funnel Dashboard template
The Facebook Ads Funnel Dashboard template is designed for marketers focusing on PPC campaigns and Facebook Ads. This dashboard provides a structured view of your advertising funnel, allowing you to track and analyze the performance of your campaigns.
With this template, you can:
- Monitor ad spend and ROI across different stages of the funnel.
- Analyze conversion rates from initial engagement to final purchase.
- Identify bottlenecks in the funnel that may affect campaign performance.
- Track audience engagement metrics to optimize targeting strategies.
This dashboard is an essential tool for managing and optimizing your Facebook Ads campaigns, providing clear insights into each stage of the customer journey.