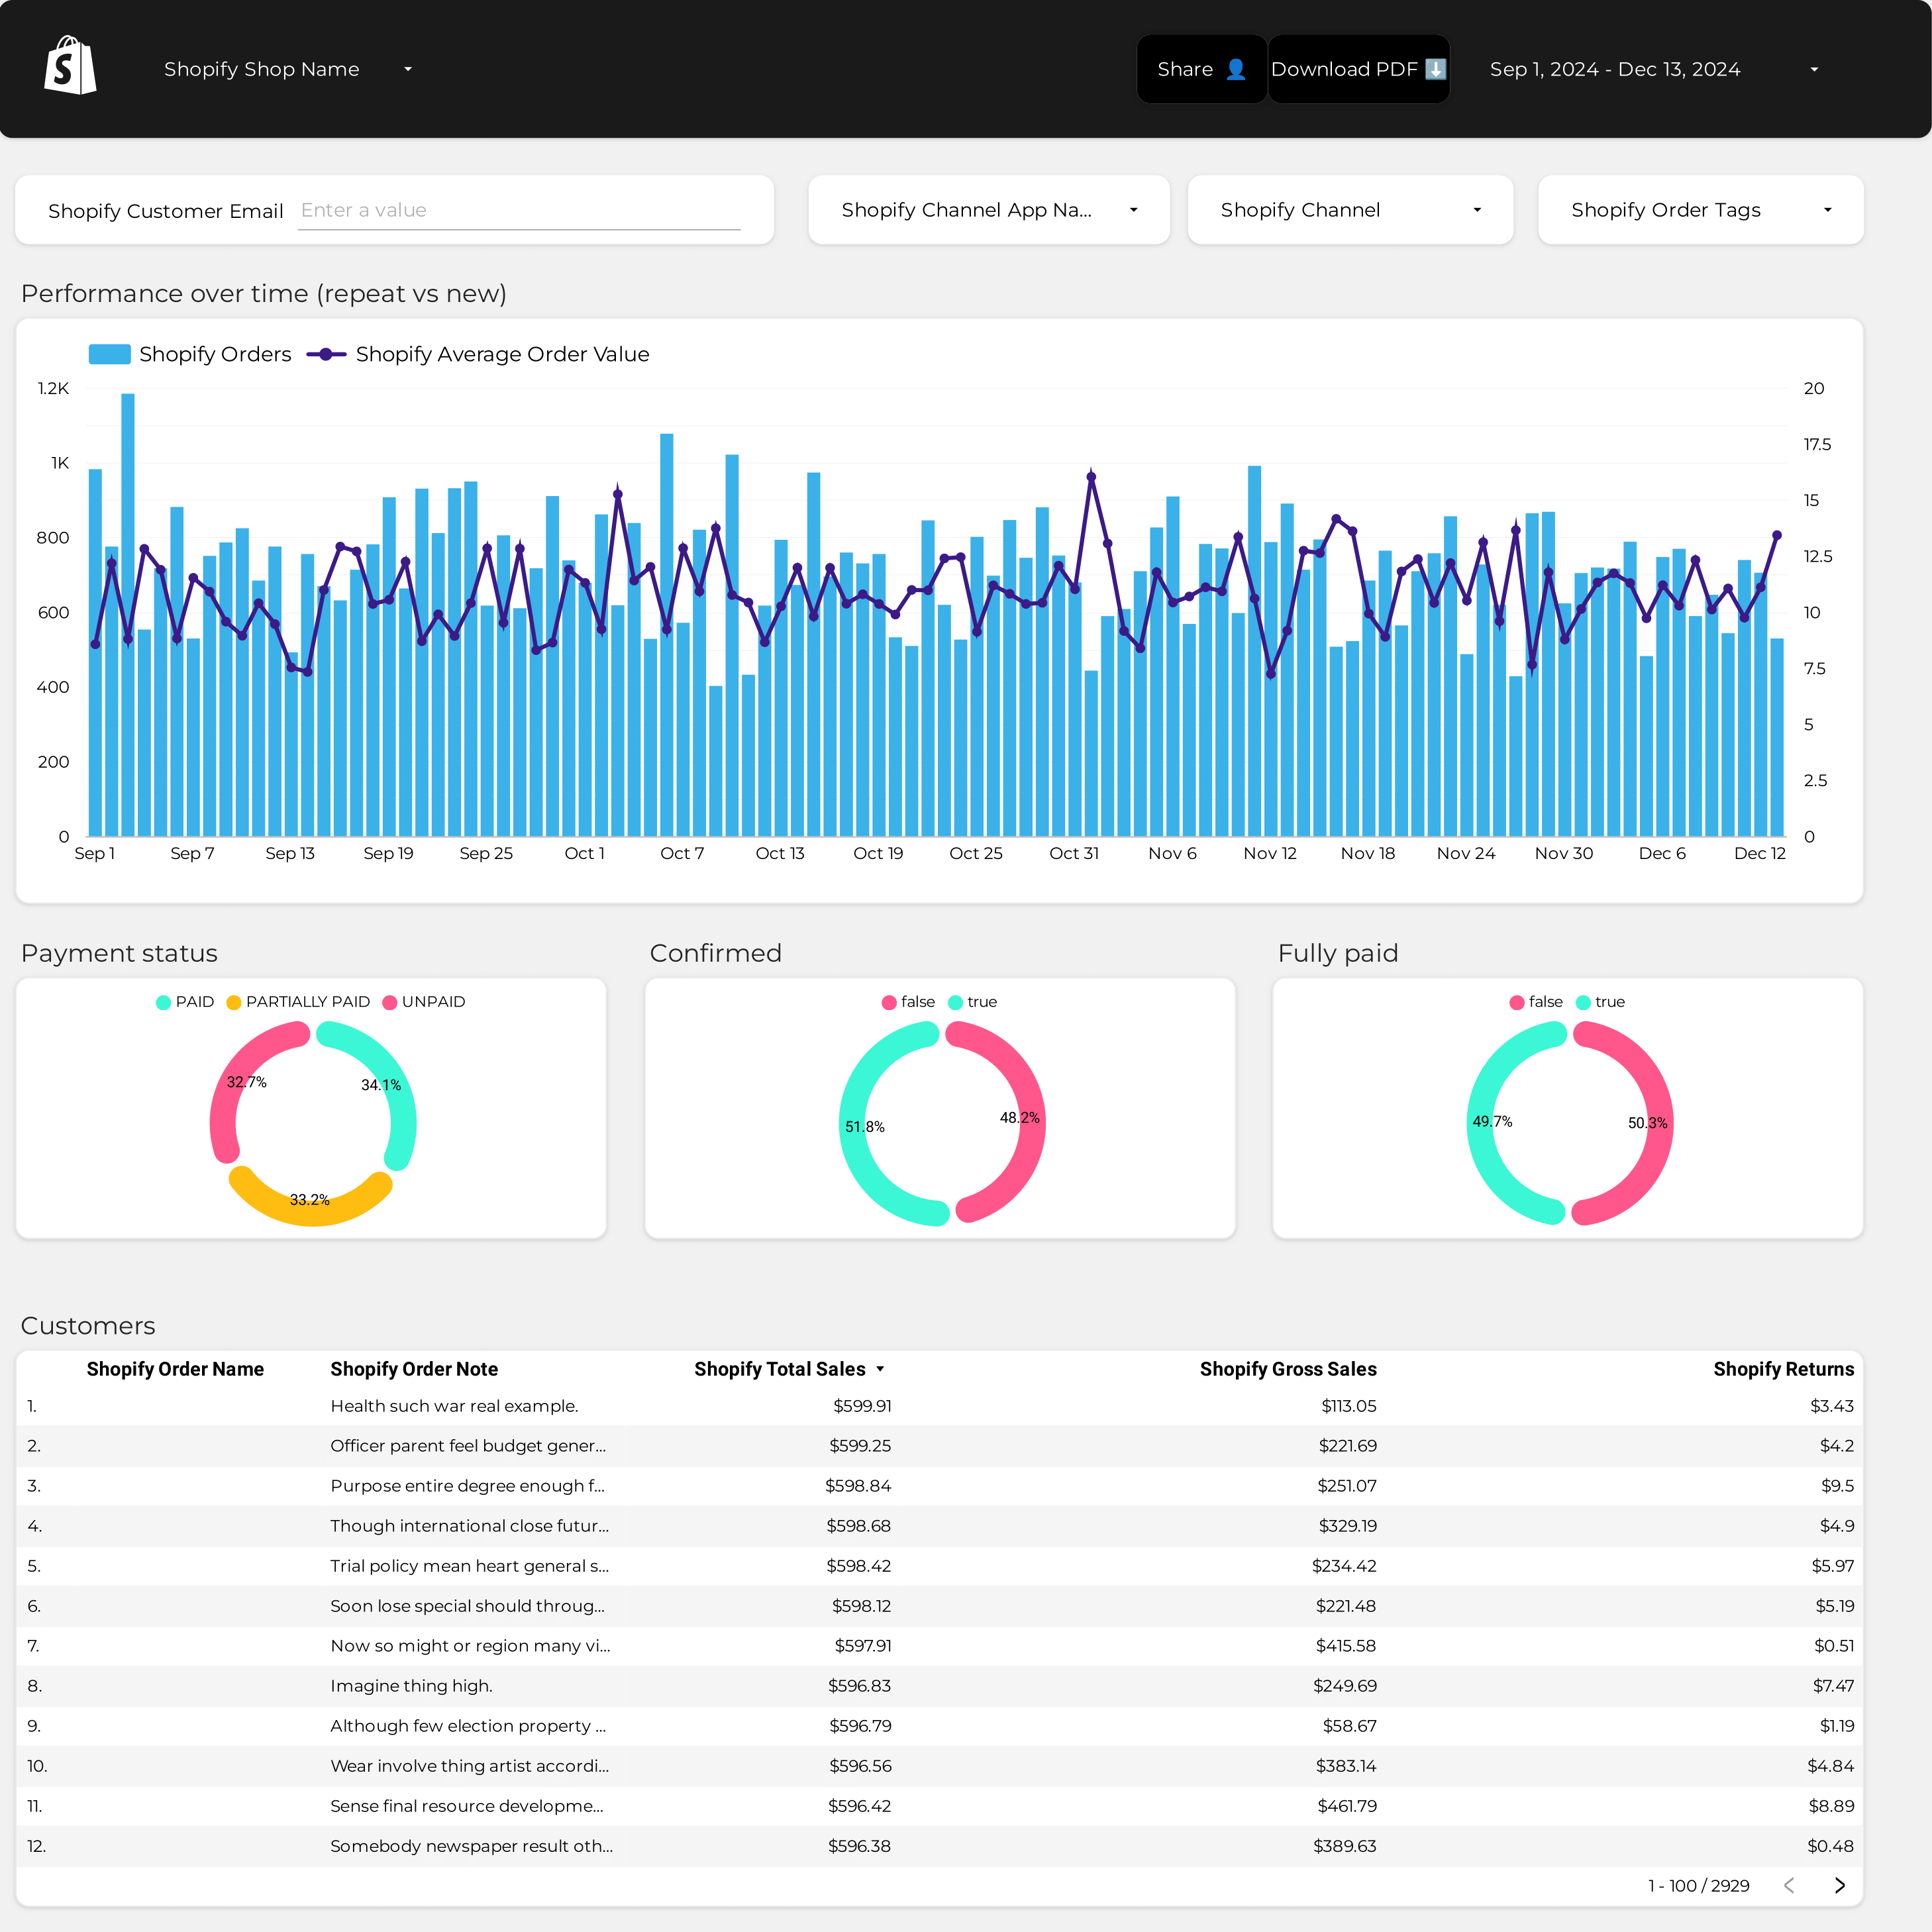
AOV Dashboard template
The AOV Dashboard Template is designed for e-commerce businesses using Shopify. This template provides a structured view of your Average Order Value (AOV) metrics, enabling data-driven decision-making.
Features include:
- Real-time Data Integration: Seamlessly connect with your Shopify store to access up-to-date AOV statistics.
- Customizable Widgets: Tailor the dashboard to display the most relevant AOV data for your business needs.
- Visual Analytics: Utilize charts and graphs to interpret AOV trends and patterns effectively.
This template is essential for monitoring and analyzing your store’s performance, providing insights into customer purchasing behavior and sales strategies.
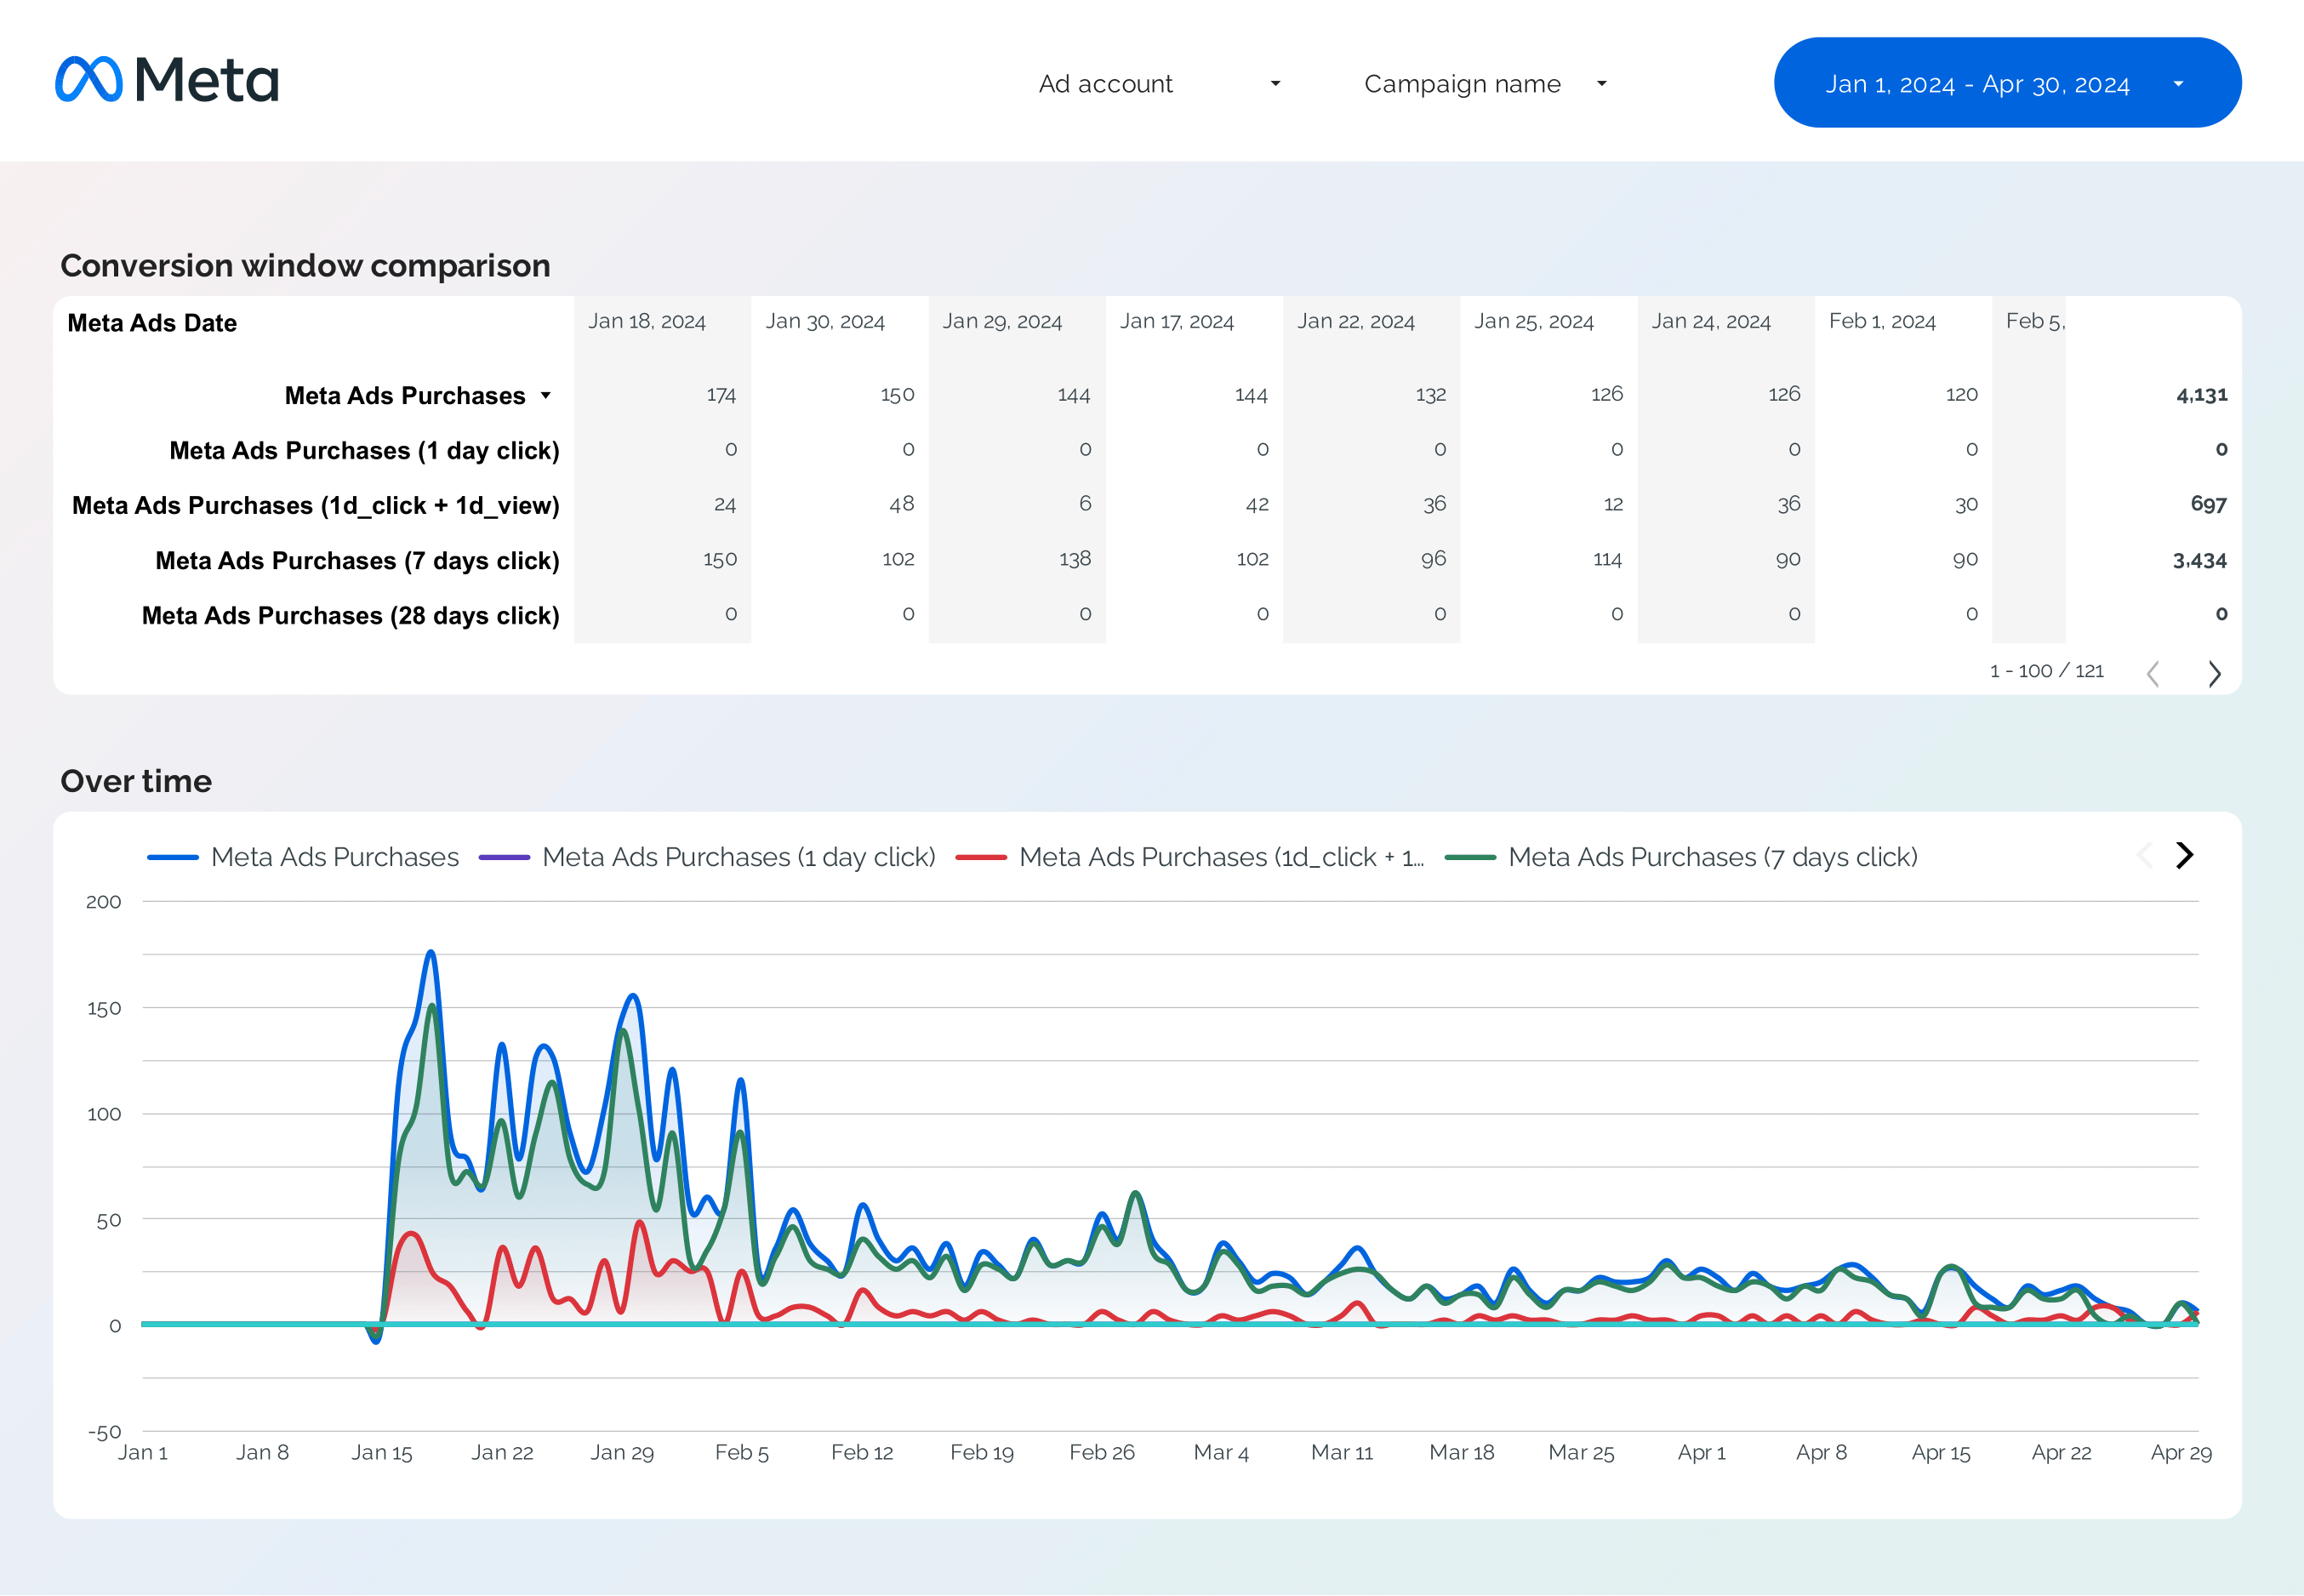
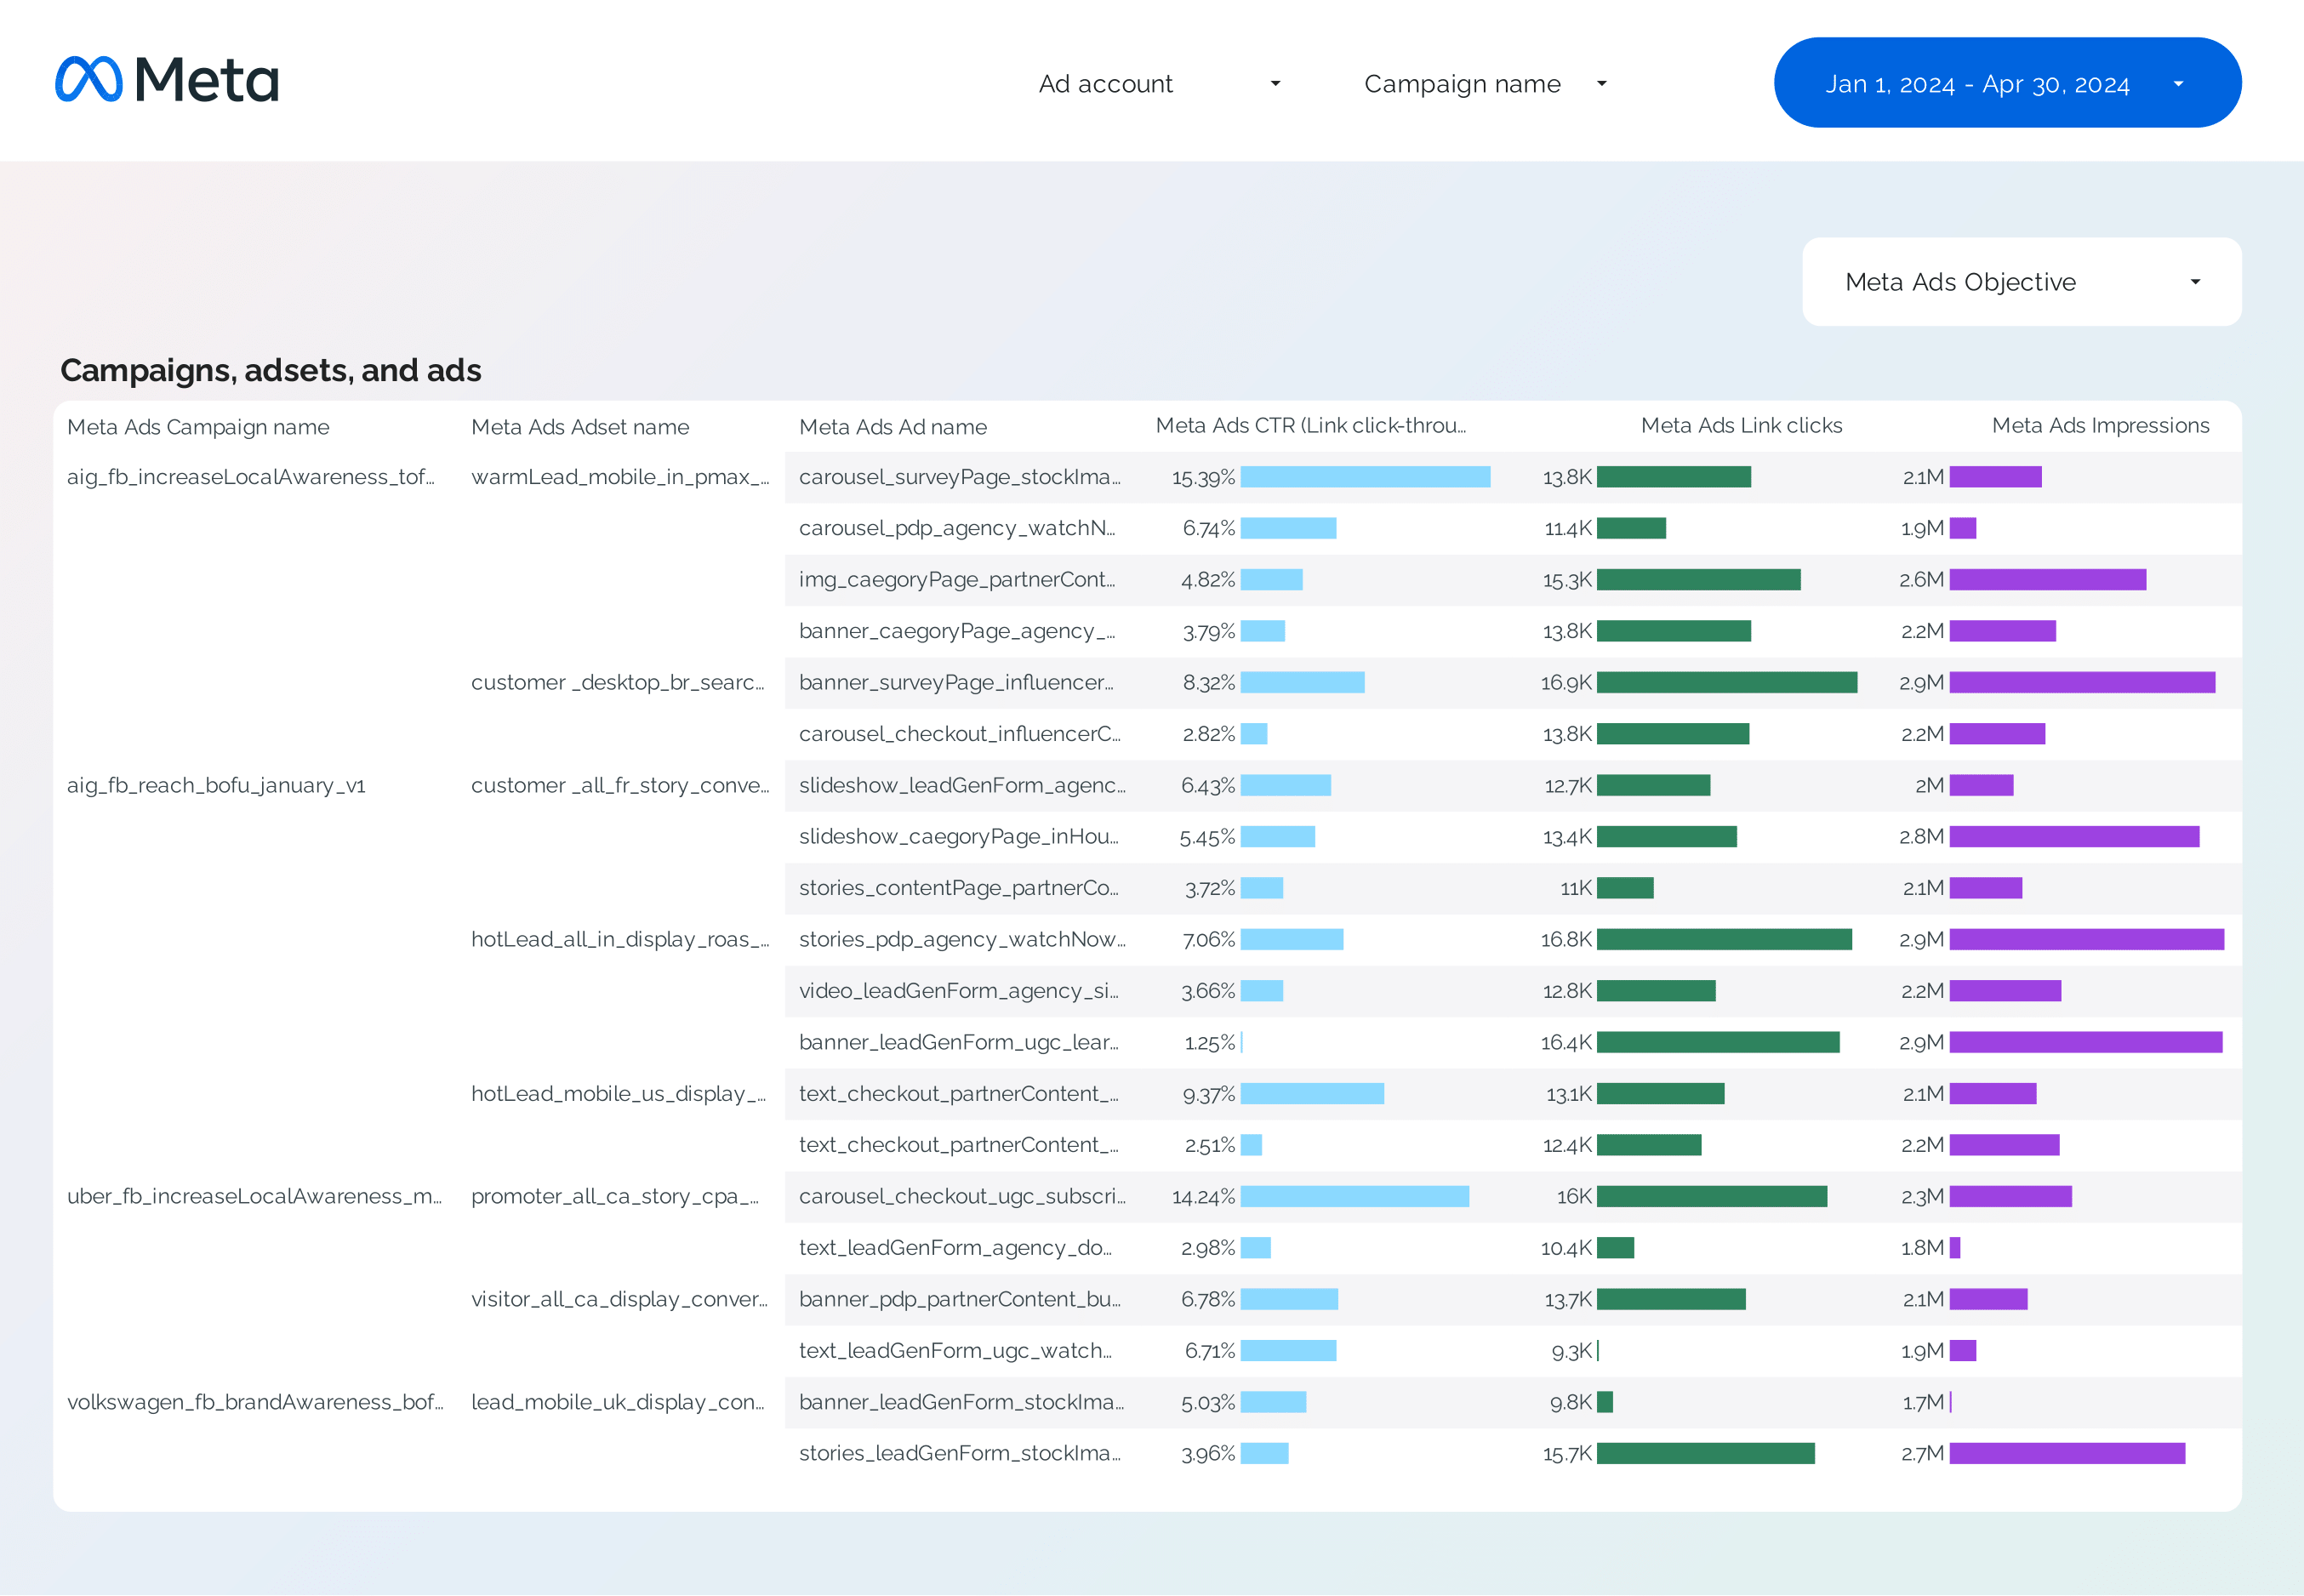
Facebook Ads Attribution Dashboard template
The Facebook Ads Attribution Dashboard template provides a structured view of your PPC campaigns performance. This tool is designed to help marketers understand the attribution of conversions across different touchpoints within Facebook Ads.
With this dashboard, you can:
- Track the performance metrics of your Facebook Ads campaigns.
- Analyze the conversion paths to identify which ads contribute to conversions.
- View multi-touch attribution data to understand the customer journey.
Utilize this template to gain insights into your advertising strategy and make informed decisions based on data-driven analysis.
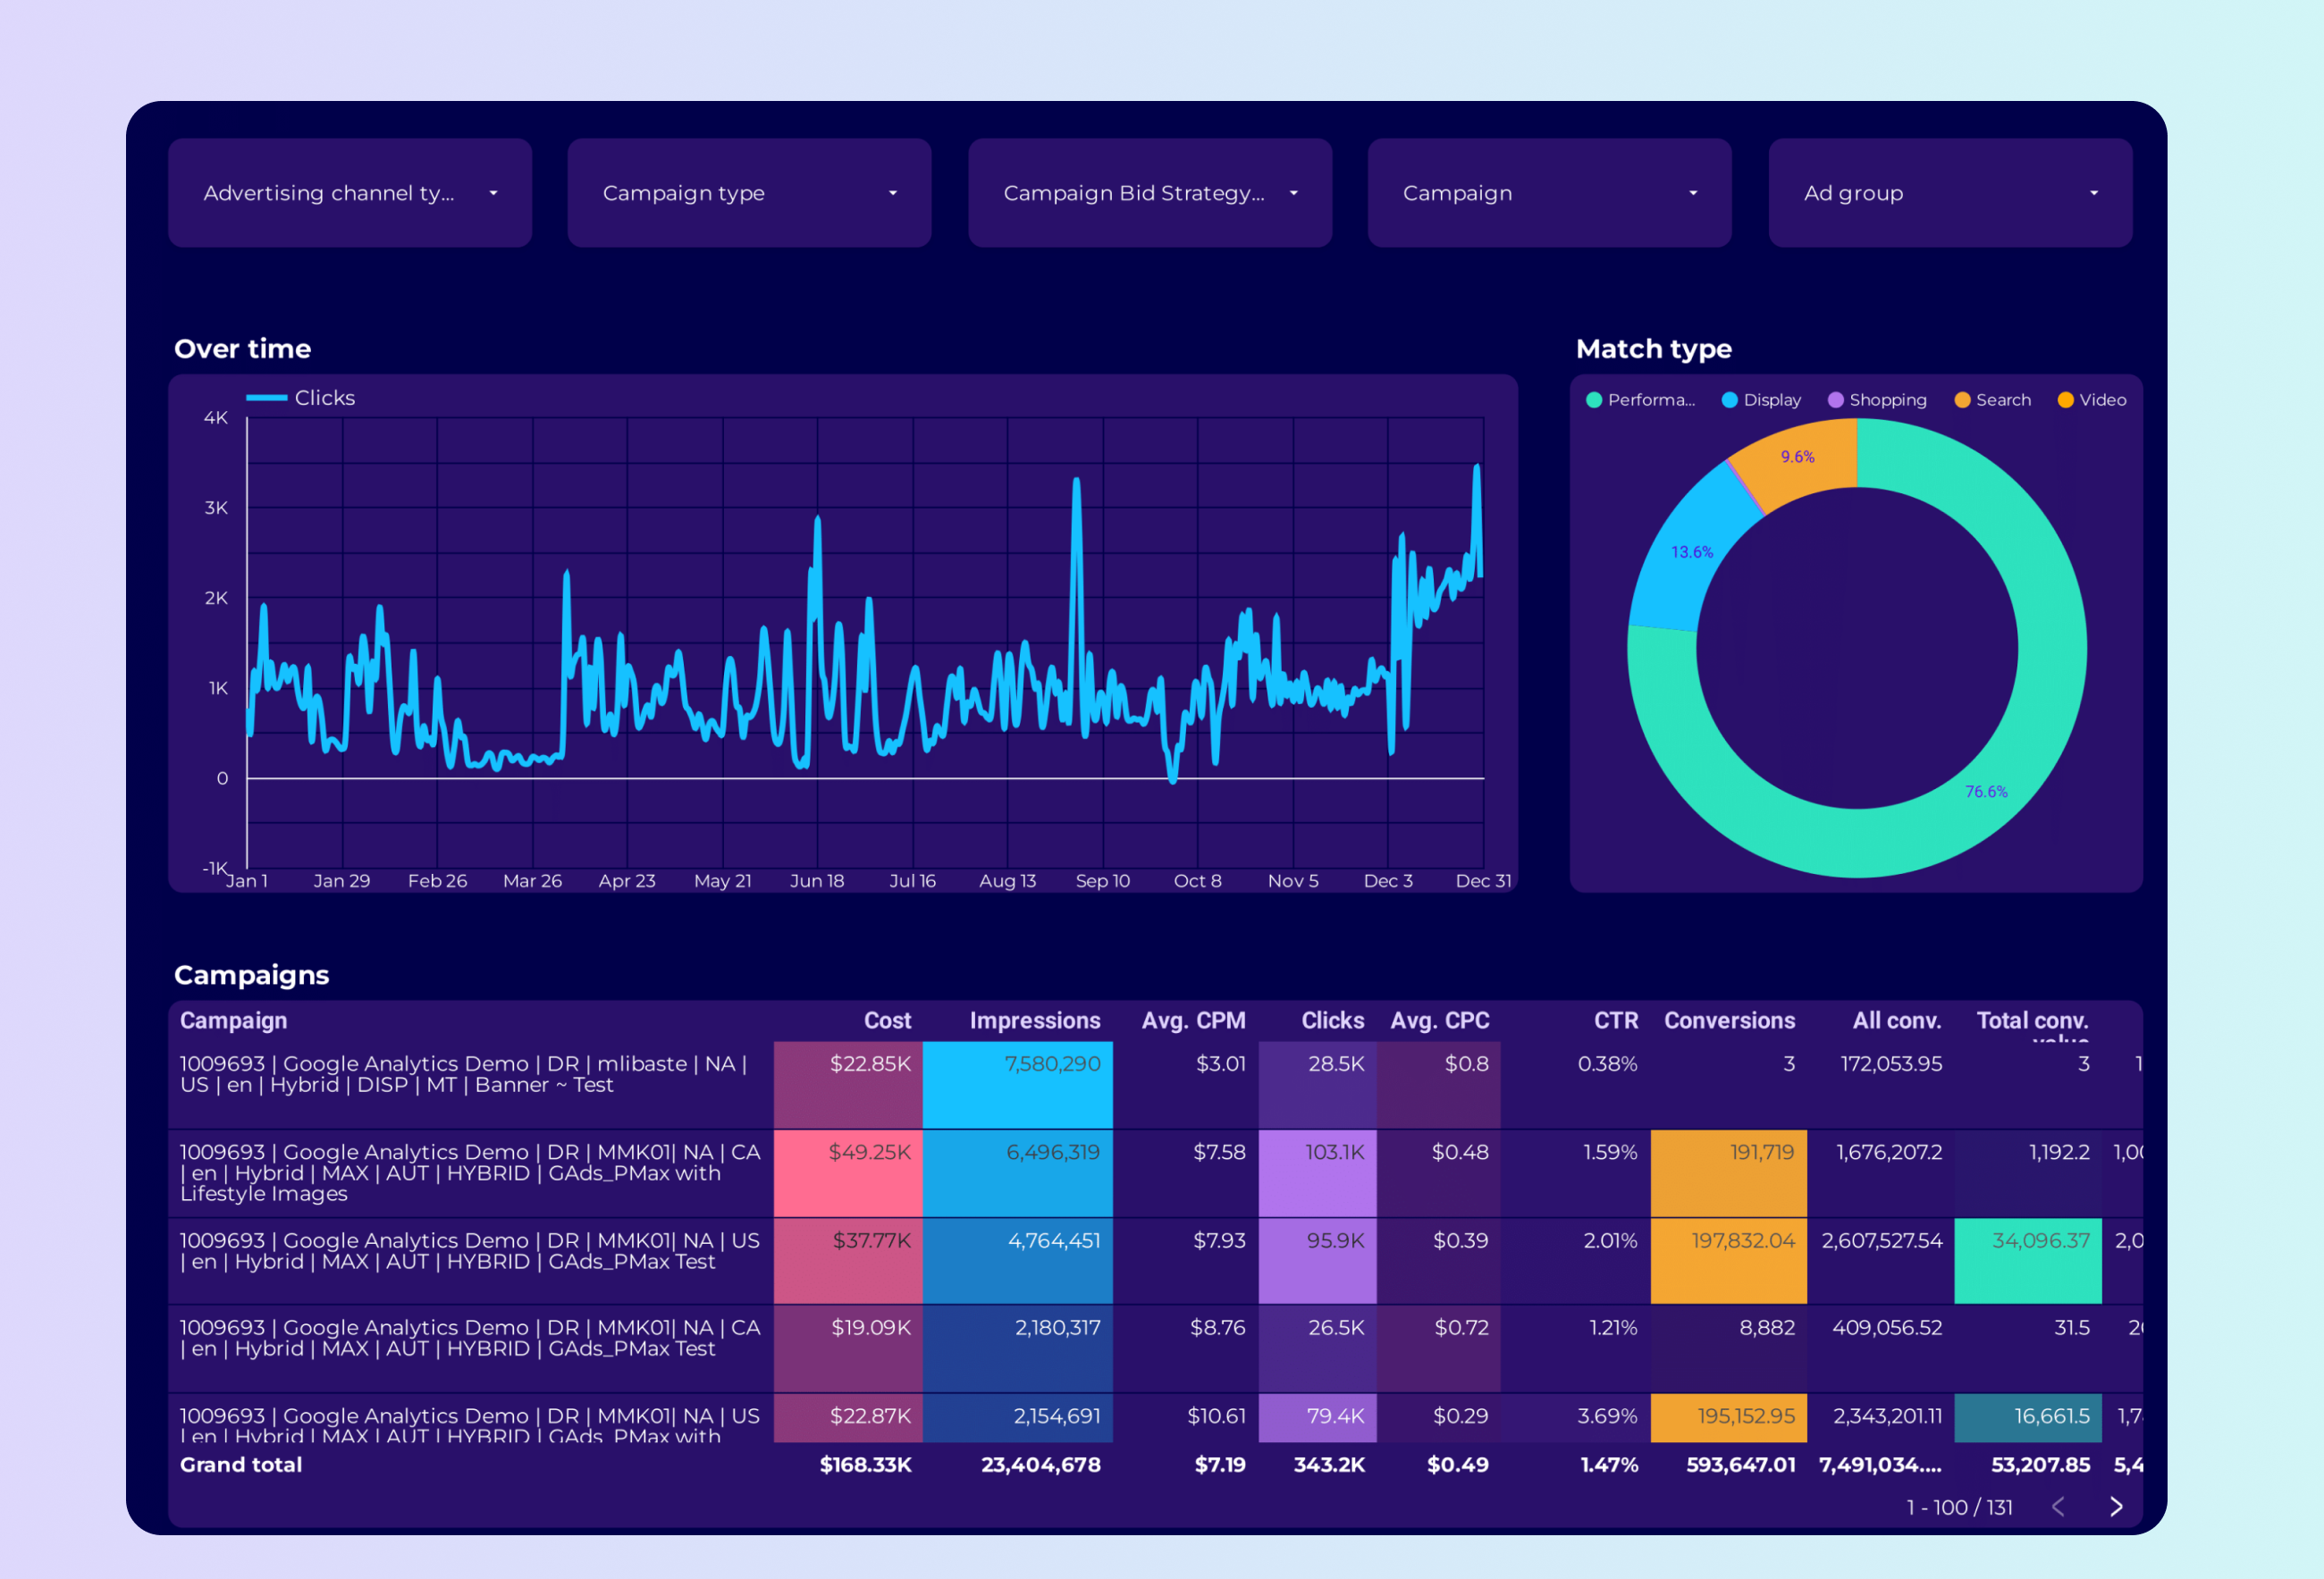
Google Ads PMax Dashboard template
The Google Ads PMax Dashboard template is designed for PPC professionals managing Google Ads campaigns. This template provides a structured view of your Performance Max campaigns, allowing for detailed analysis and reporting.
Features include:
- Campaign Performance Metrics: View metrics such as impressions, clicks, and conversions.
- Budget Tracking: Monitor daily and monthly spend to ensure alignment with campaign goals.
- Audience Insights: Analyze audience segments and their impact on campaign performance.
- Asset Performance: Evaluate the effectiveness of different creative assets within your campaigns.
This dashboard is essential for PPC managers looking to optimize their Google Ads strategies and achieve better results with Performance Max campaigns.
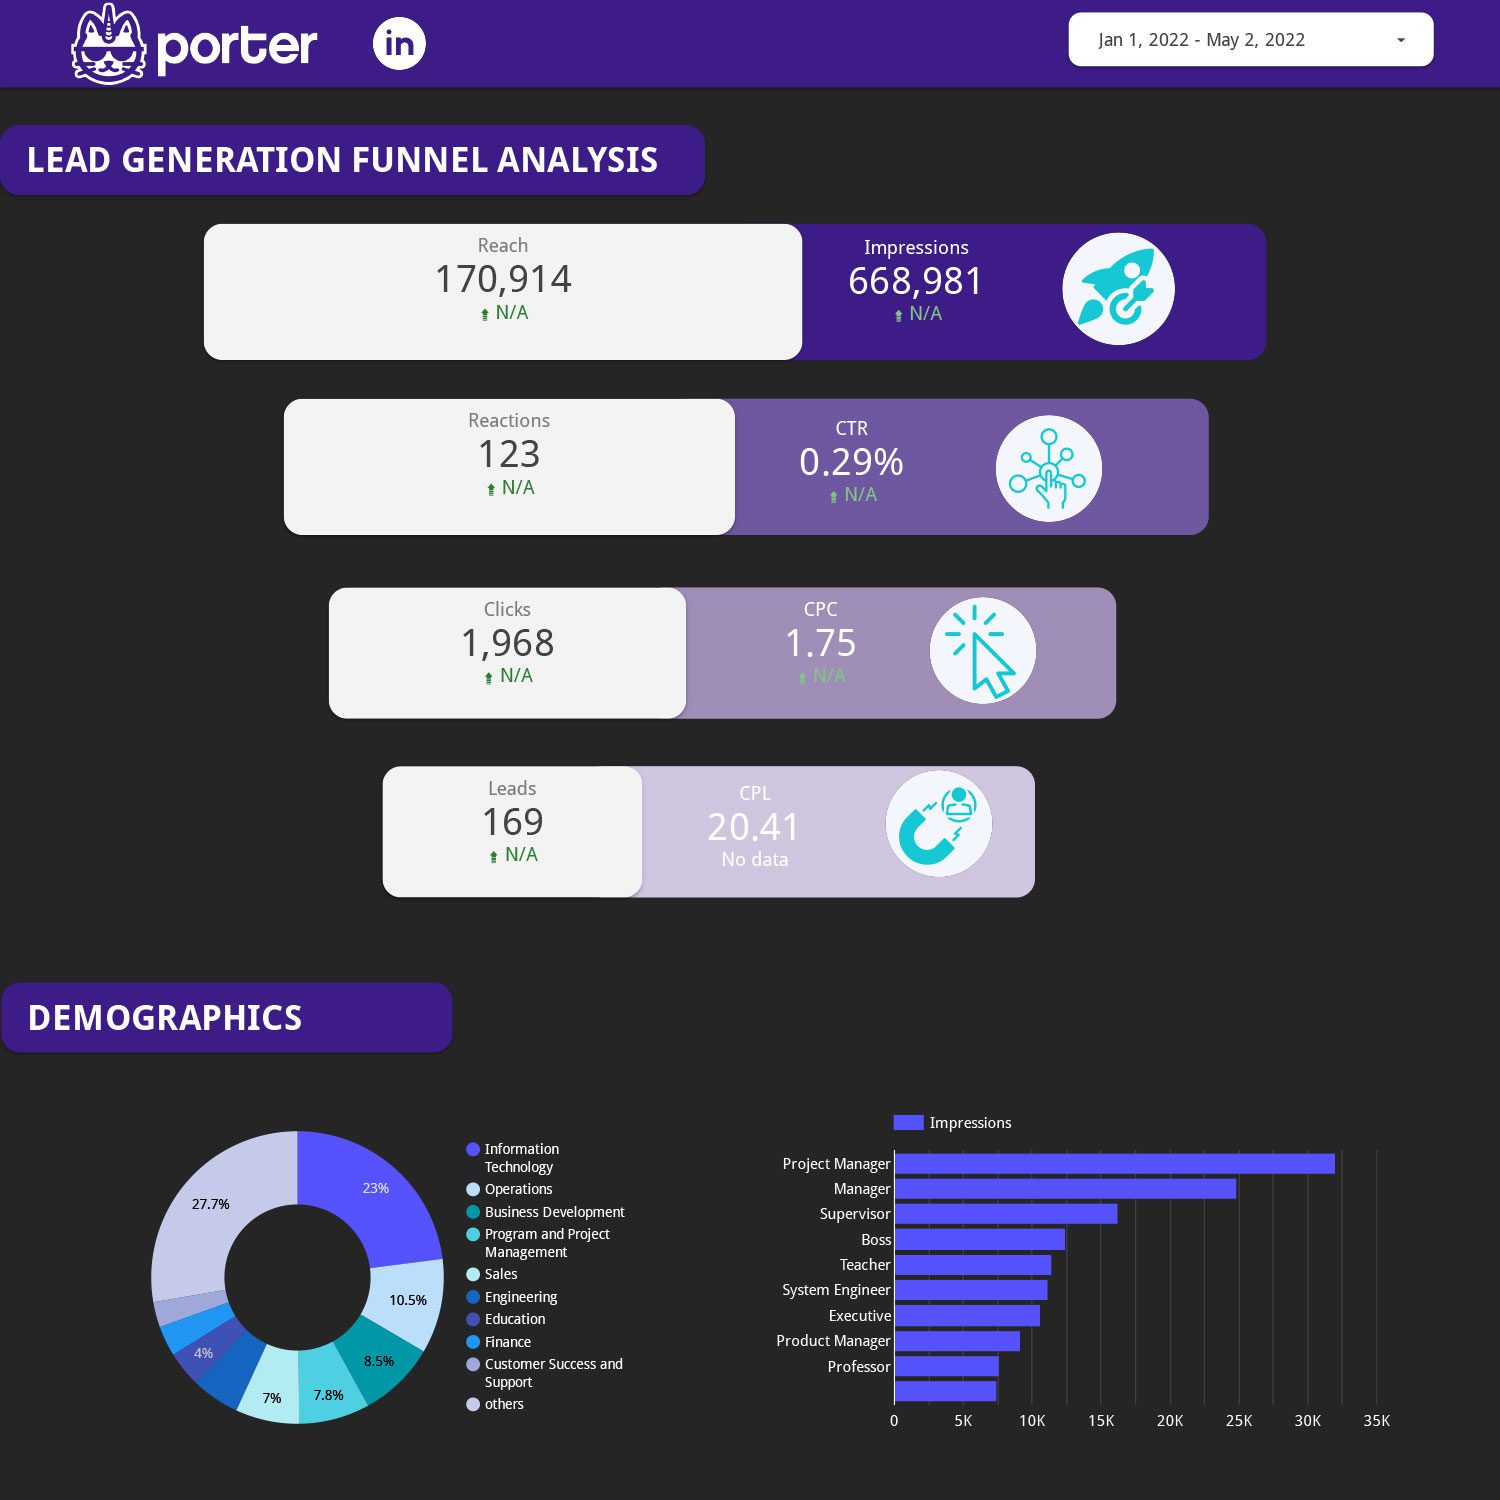
LinkedIn Ads Dashboard template
The LinkedIn Ads Dashboard Template is designed for professionals focused on PPC and Lead Generation in the B2B sector. This template provides a structured view of your Paid Media campaigns on LinkedIn, offering insights into performance metrics and audience engagement.
Key features include:
- Campaign Performance Metrics: Track impressions, clicks, and conversions to understand the effectiveness of your LinkedIn Ads.
- Audience Insights: Analyze demographic data to refine targeting strategies and improve lead quality.
- Budget Management: Monitor spend and ROI to optimize your advertising budget.
- Conversion Tracking: Measure lead generation success and identify high-performing campaigns.
This dashboard is essential for marketers aiming to maximize their LinkedIn Ads impact and drive business growth through targeted PPC strategies.
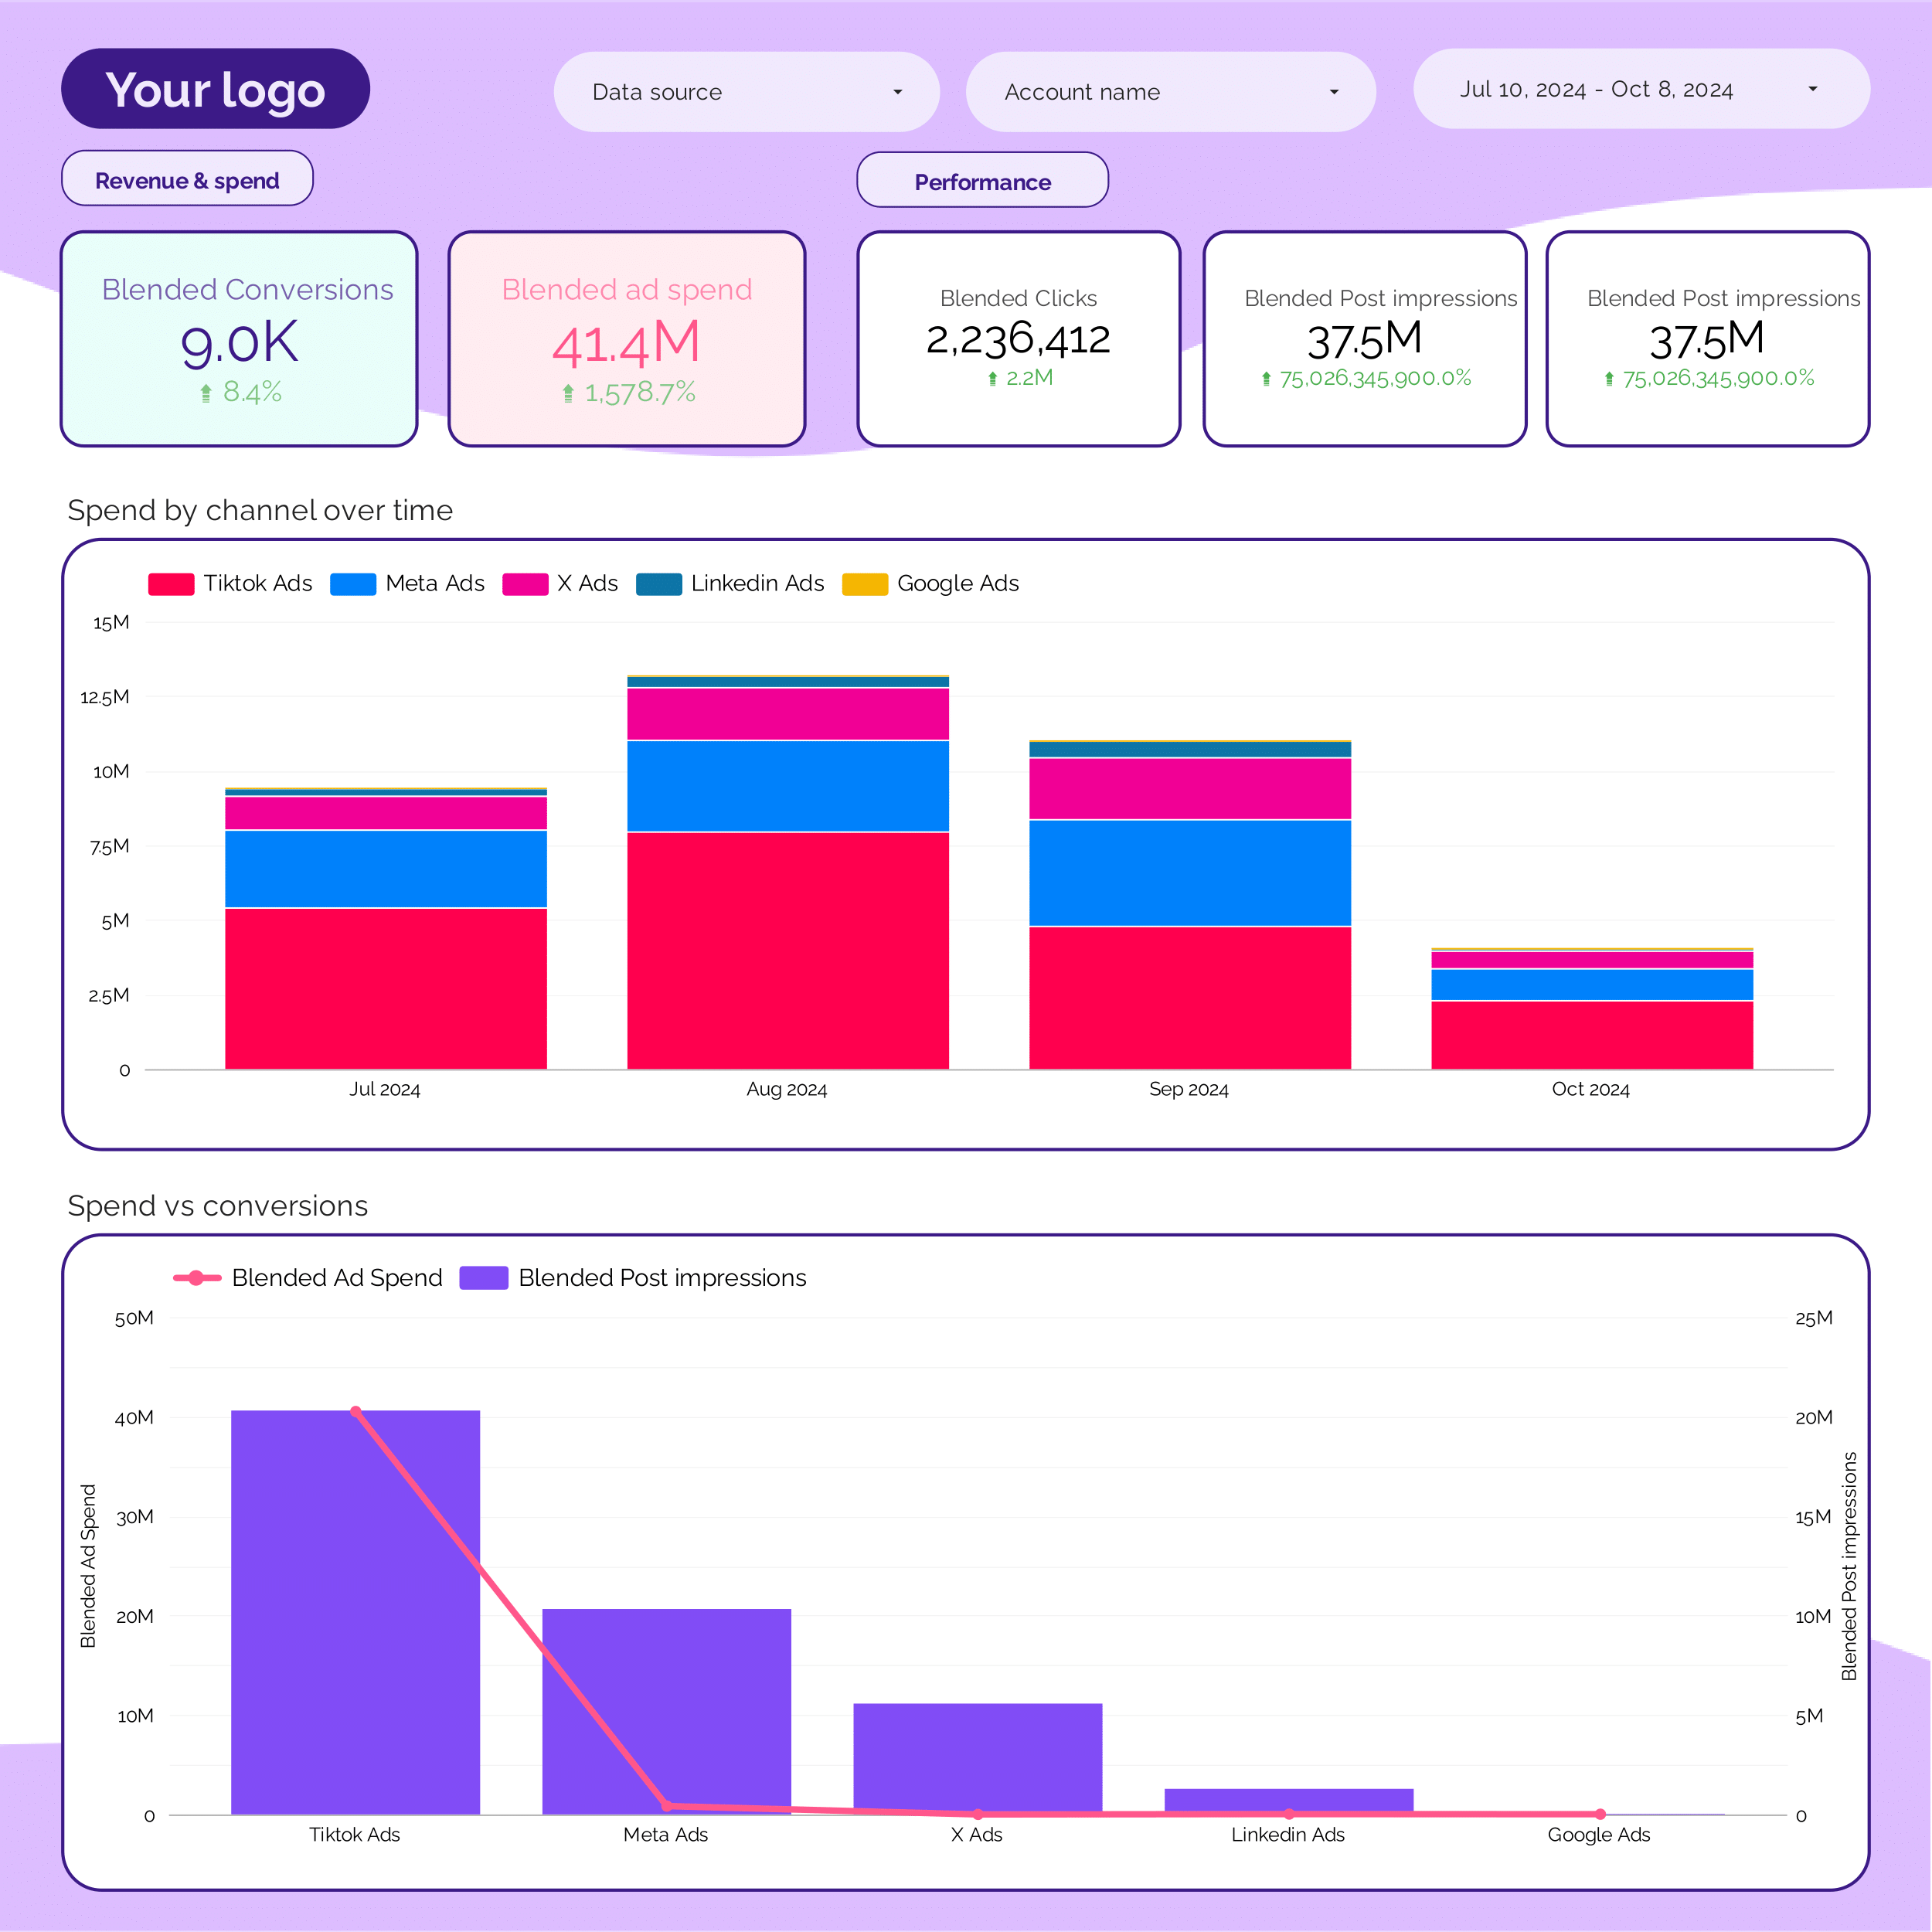
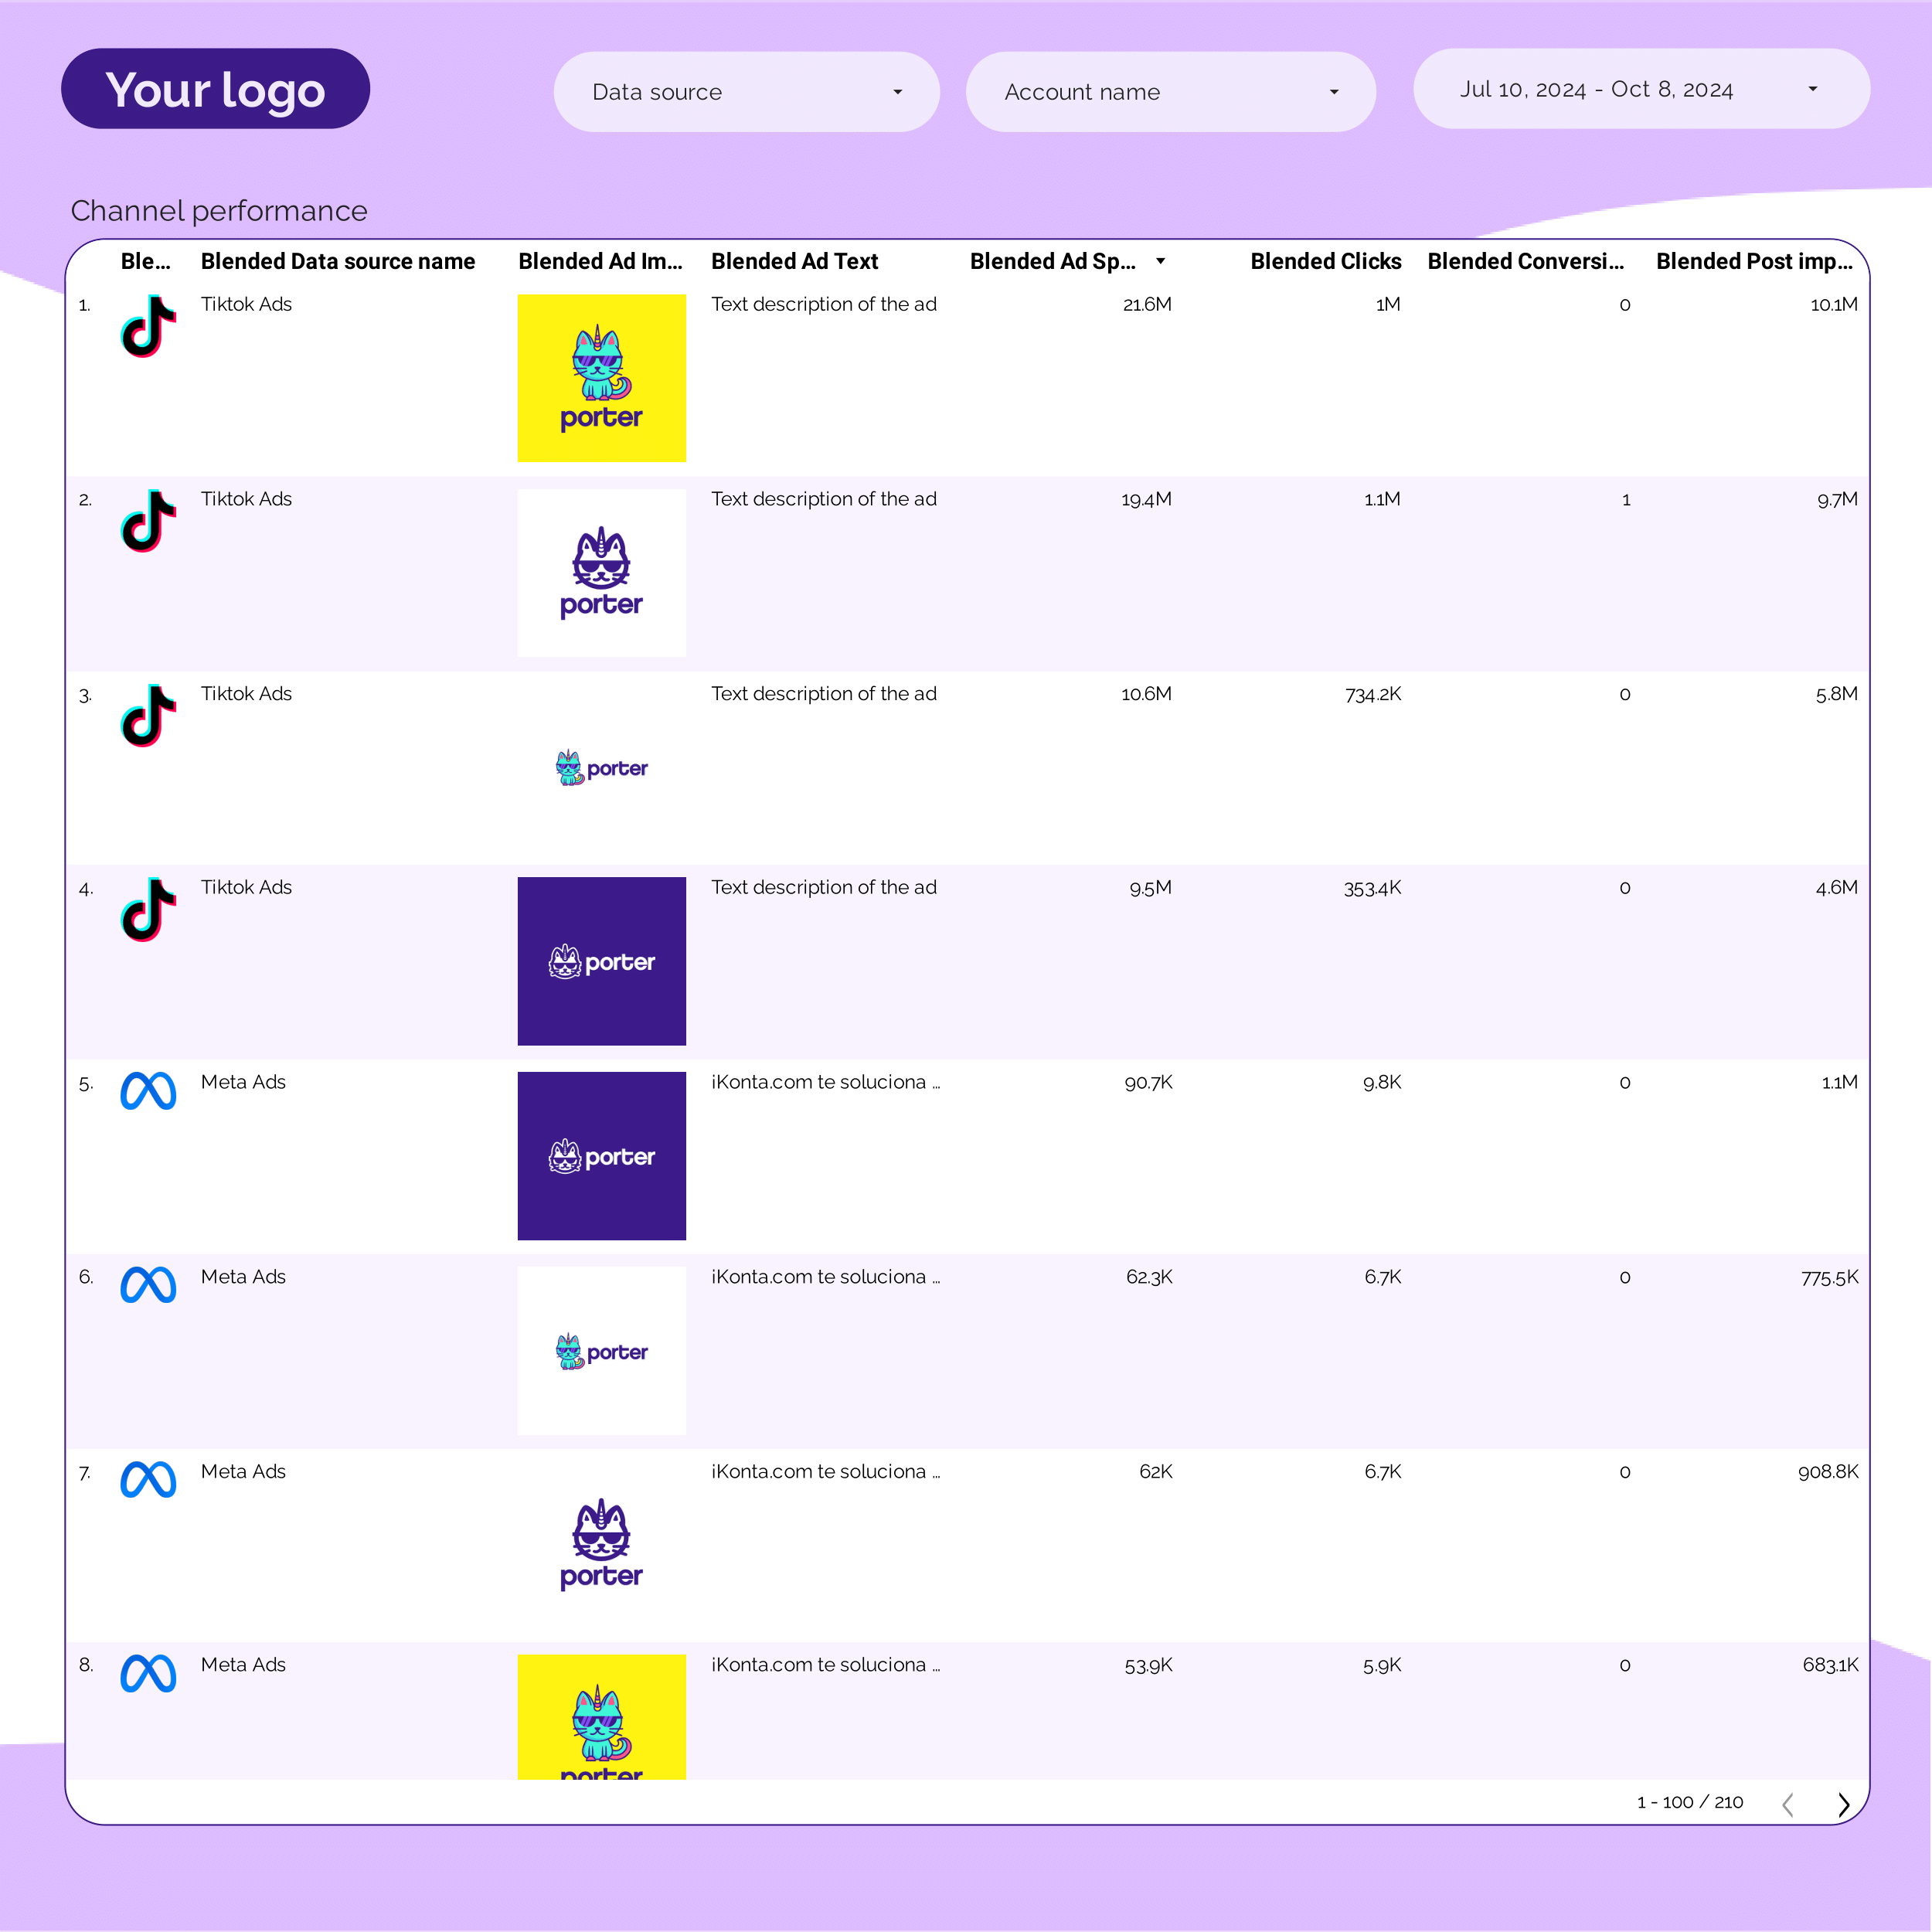
PPC monthly Dashboard template
The PPC Monthly Dashboard Template provides a structured overview of your advertising performance across multiple platforms. This template is designed to streamline the analysis of your campaigns on Facebook Ads, Google Ads, LinkedIn Ads, TikTok Ads, and Twitter Ads.
Each section of the dashboard focuses on specific metrics and data points relevant to each platform:
- Facebook Ads: Analyze metrics such as impressions, clicks, and conversion rates.
- Google Ads: Review data on cost-per-click (CPC), click-through rate (CTR), and quality score.
- LinkedIn Ads: Monitor engagement metrics, including sponsored content performance and lead generation.
- TikTok Ads: Evaluate video views, engagement rates, and audience demographics.
- Twitter Ads: Track tweet engagement, follower growth, and ad spend efficiency.
This template is updated monthly to provide a consistent view of your advertising efforts, allowing for data-driven decision-making and strategic planning.
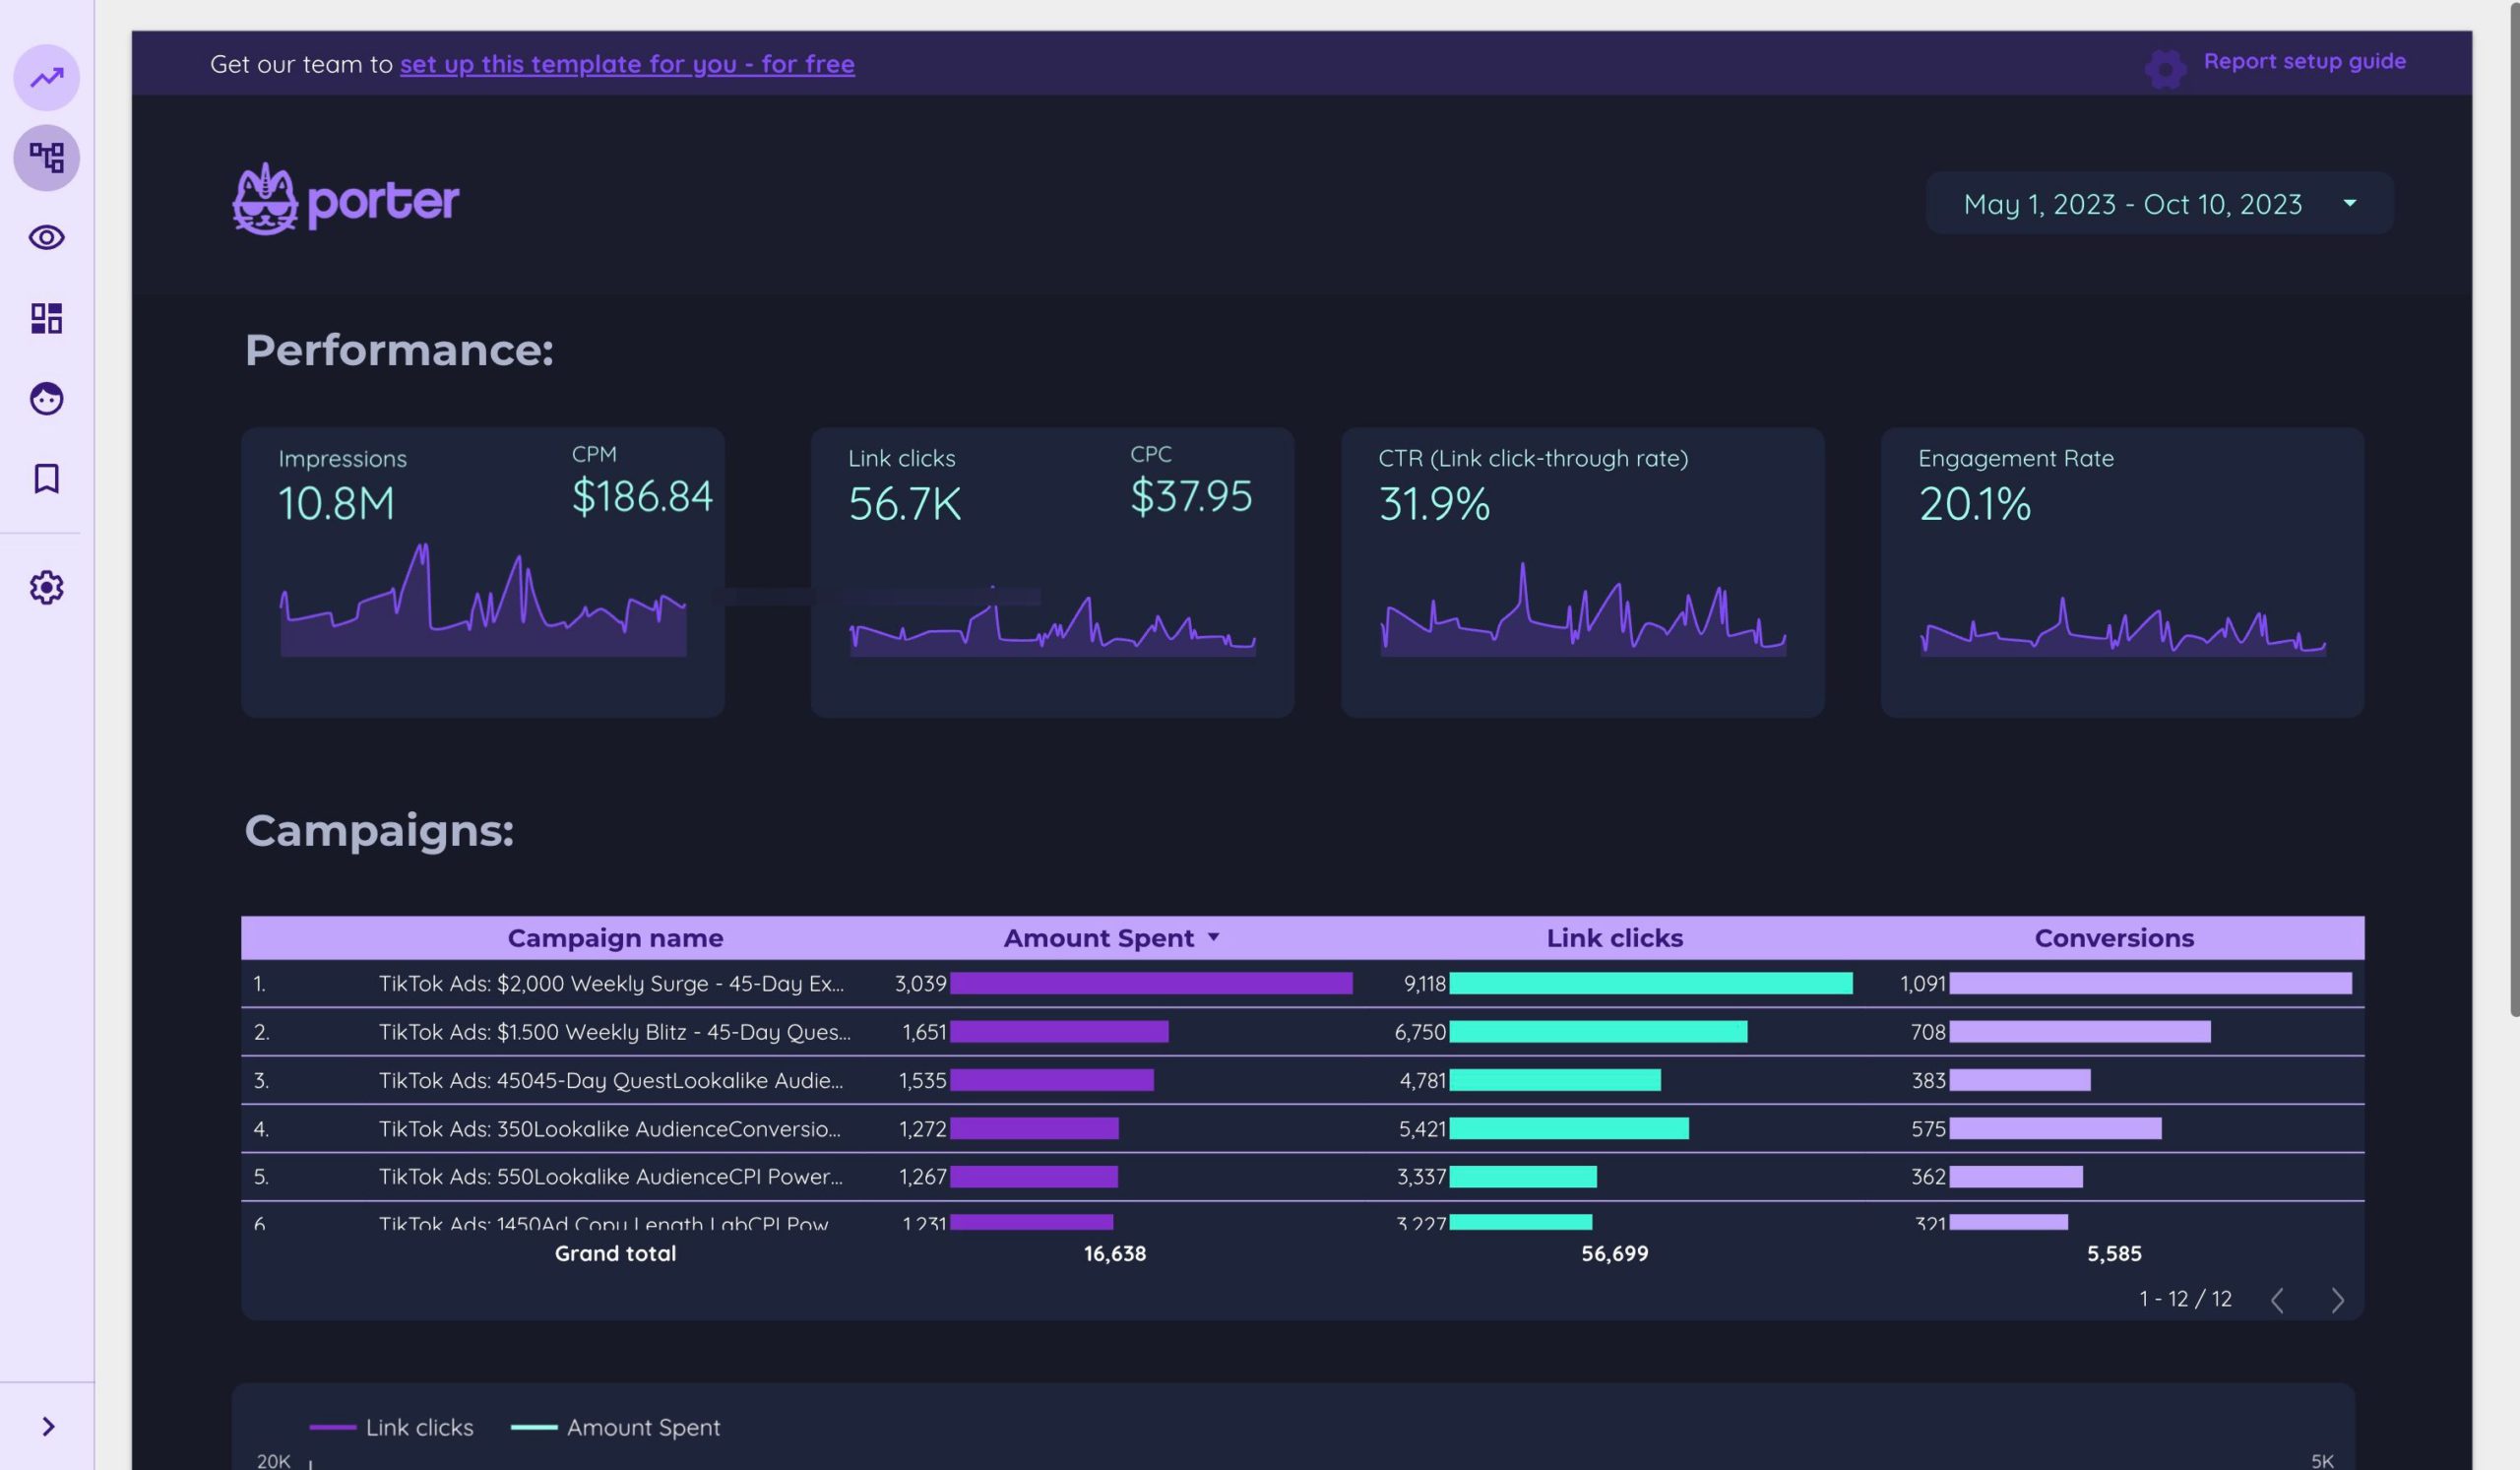
TikTok Ads Dashboard template
The TikTok Ads Dashboard Template is designed for PPC professionals managing TikTok advertising campaigns. This template provides a structured approach to monitor and analyze your ad performance effectively.
With this dashboard, you can:
- Track Ad Spend: Monitor your daily, weekly, and monthly ad expenditures to ensure budget adherence.
- Analyze Performance Metrics: Evaluate crucial metrics such as impressions, clicks, and conversions to assess campaign success.
- Visualize Data Trends: Utilize charts and graphs to identify patterns and make informed decisions.
- Optimize Campaigns: Use data insights to adjust targeting, creatives, and bidding strategies for improved results.
This template is an essential tool for PPC managers aiming to maximize their TikTok advertising efforts.
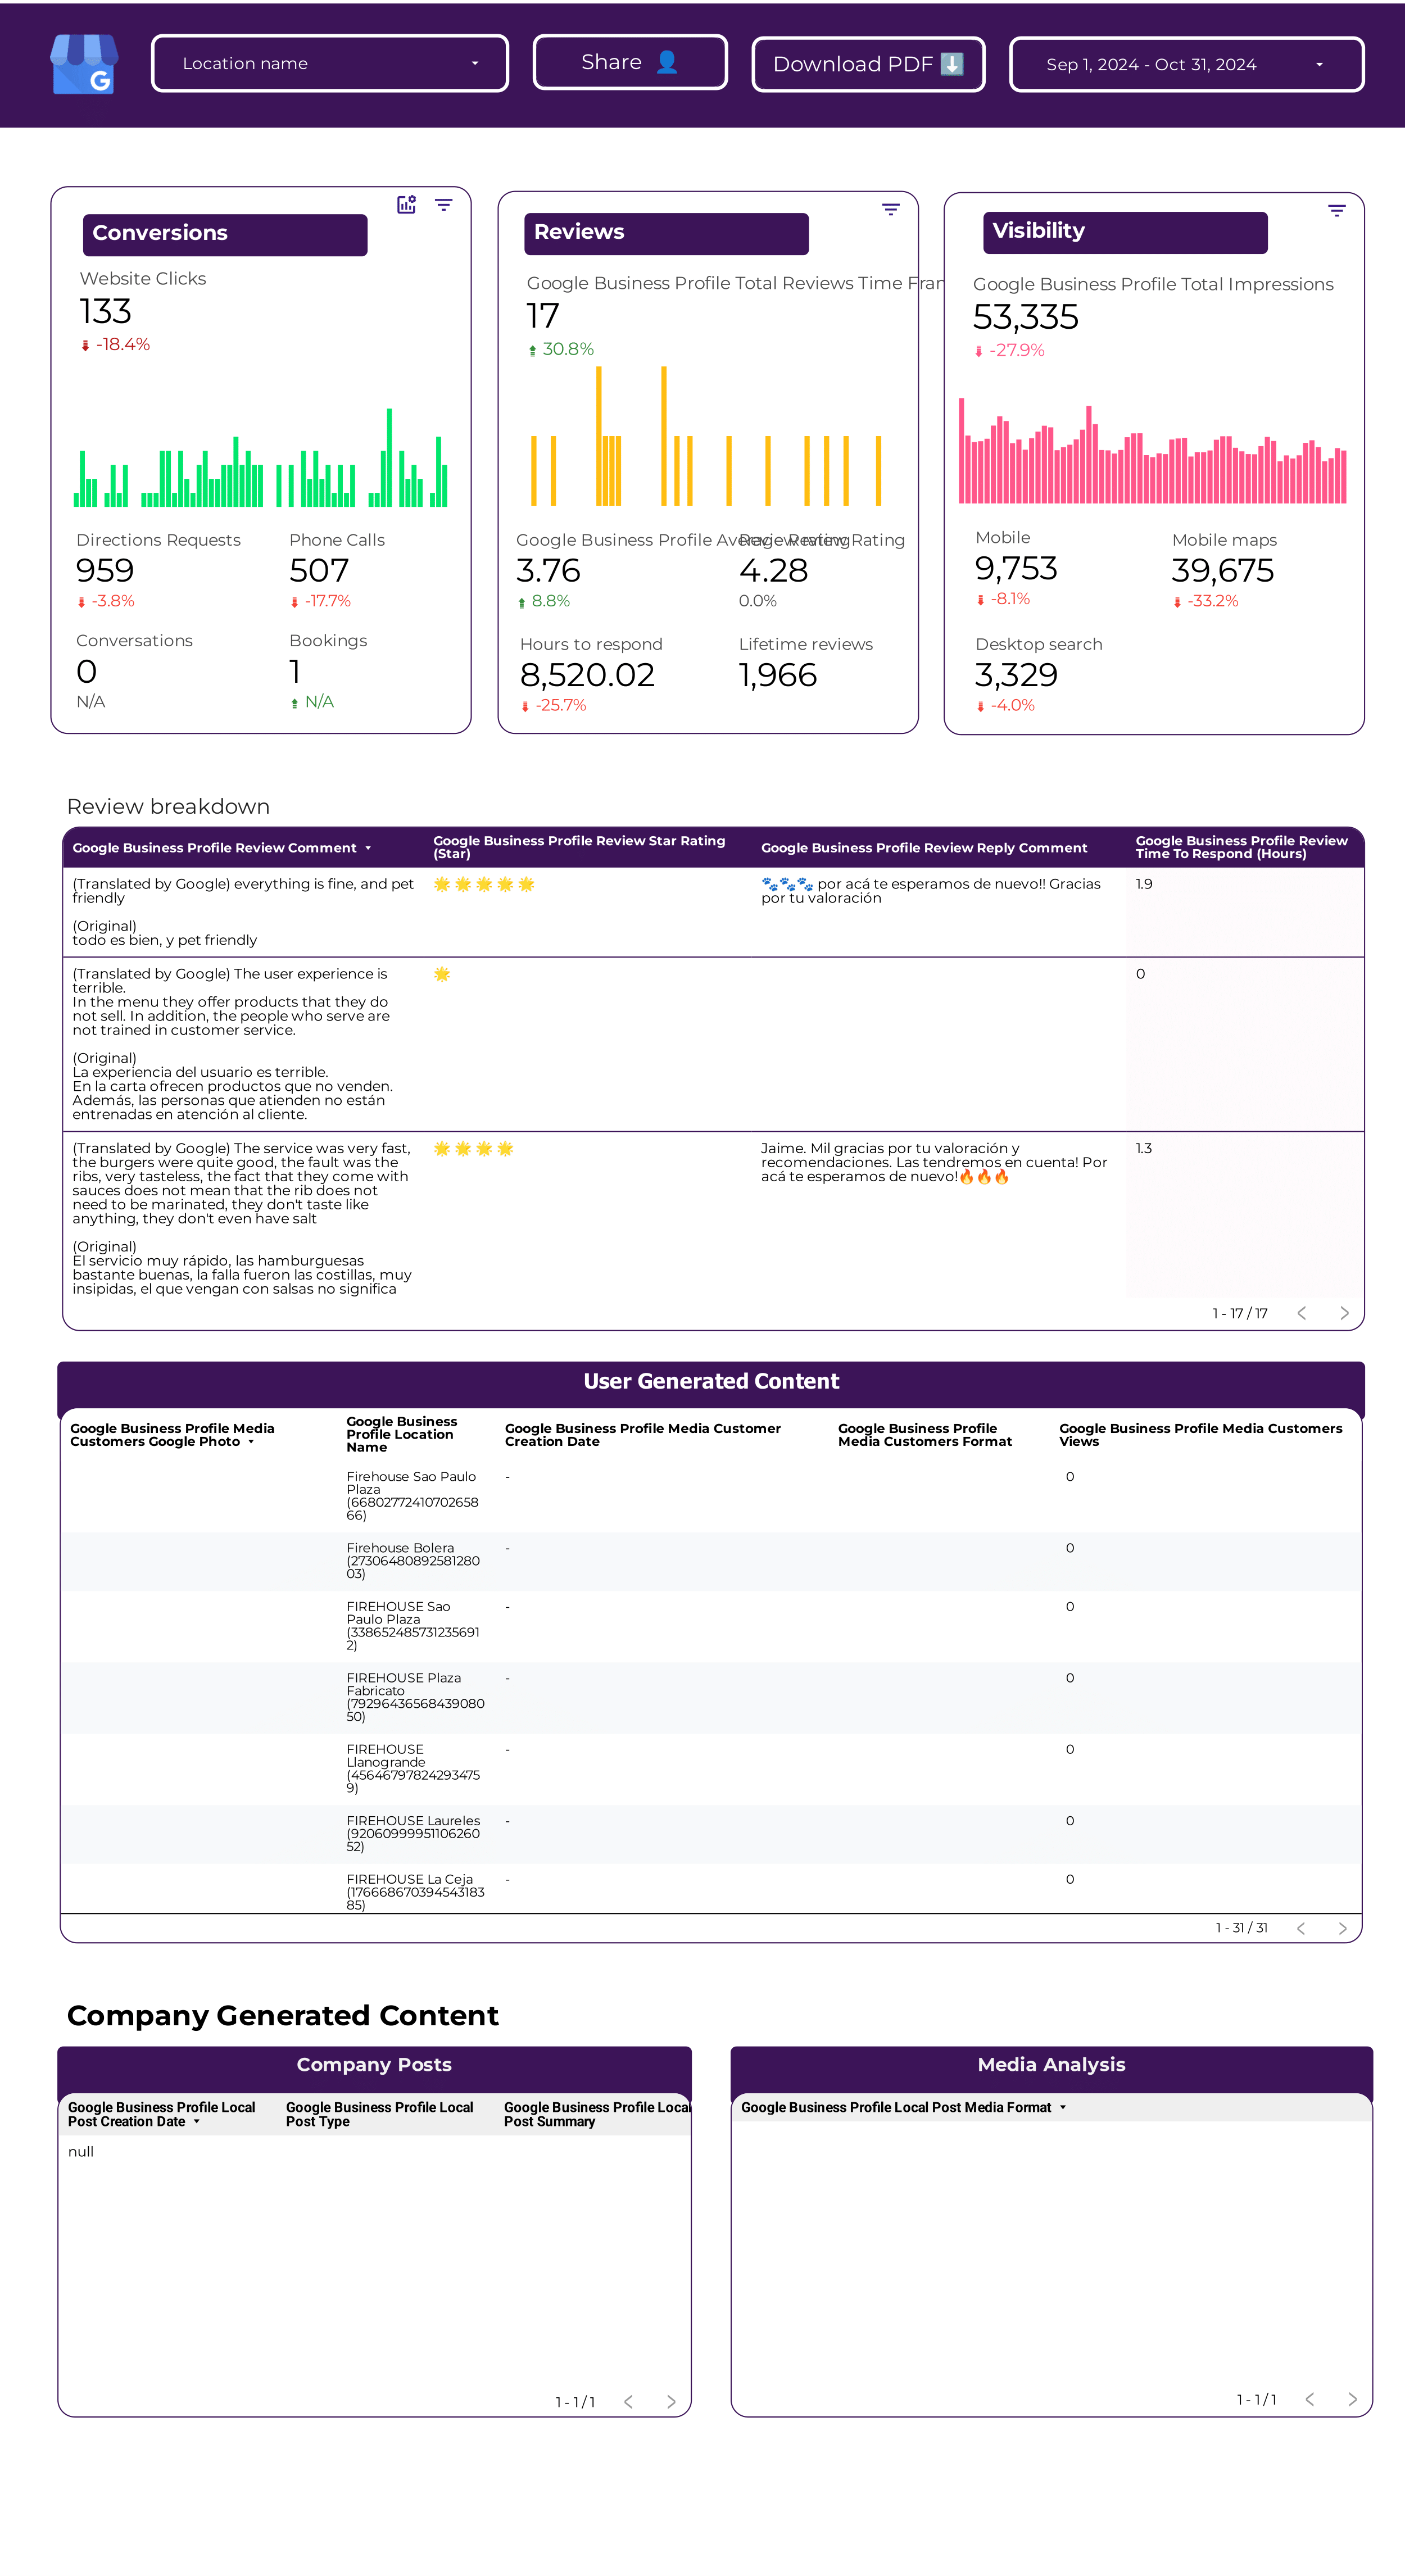
Google Business Profile dashboard example
Google Business Profile dashboard example: Analyze CTR, conversion rate, CAC, clicks, and impressions. Segment by location, age, gender, and time. Perfect for local SEO strategies, it empowers marketing teams to consolidate performance insights and meet specific goals.
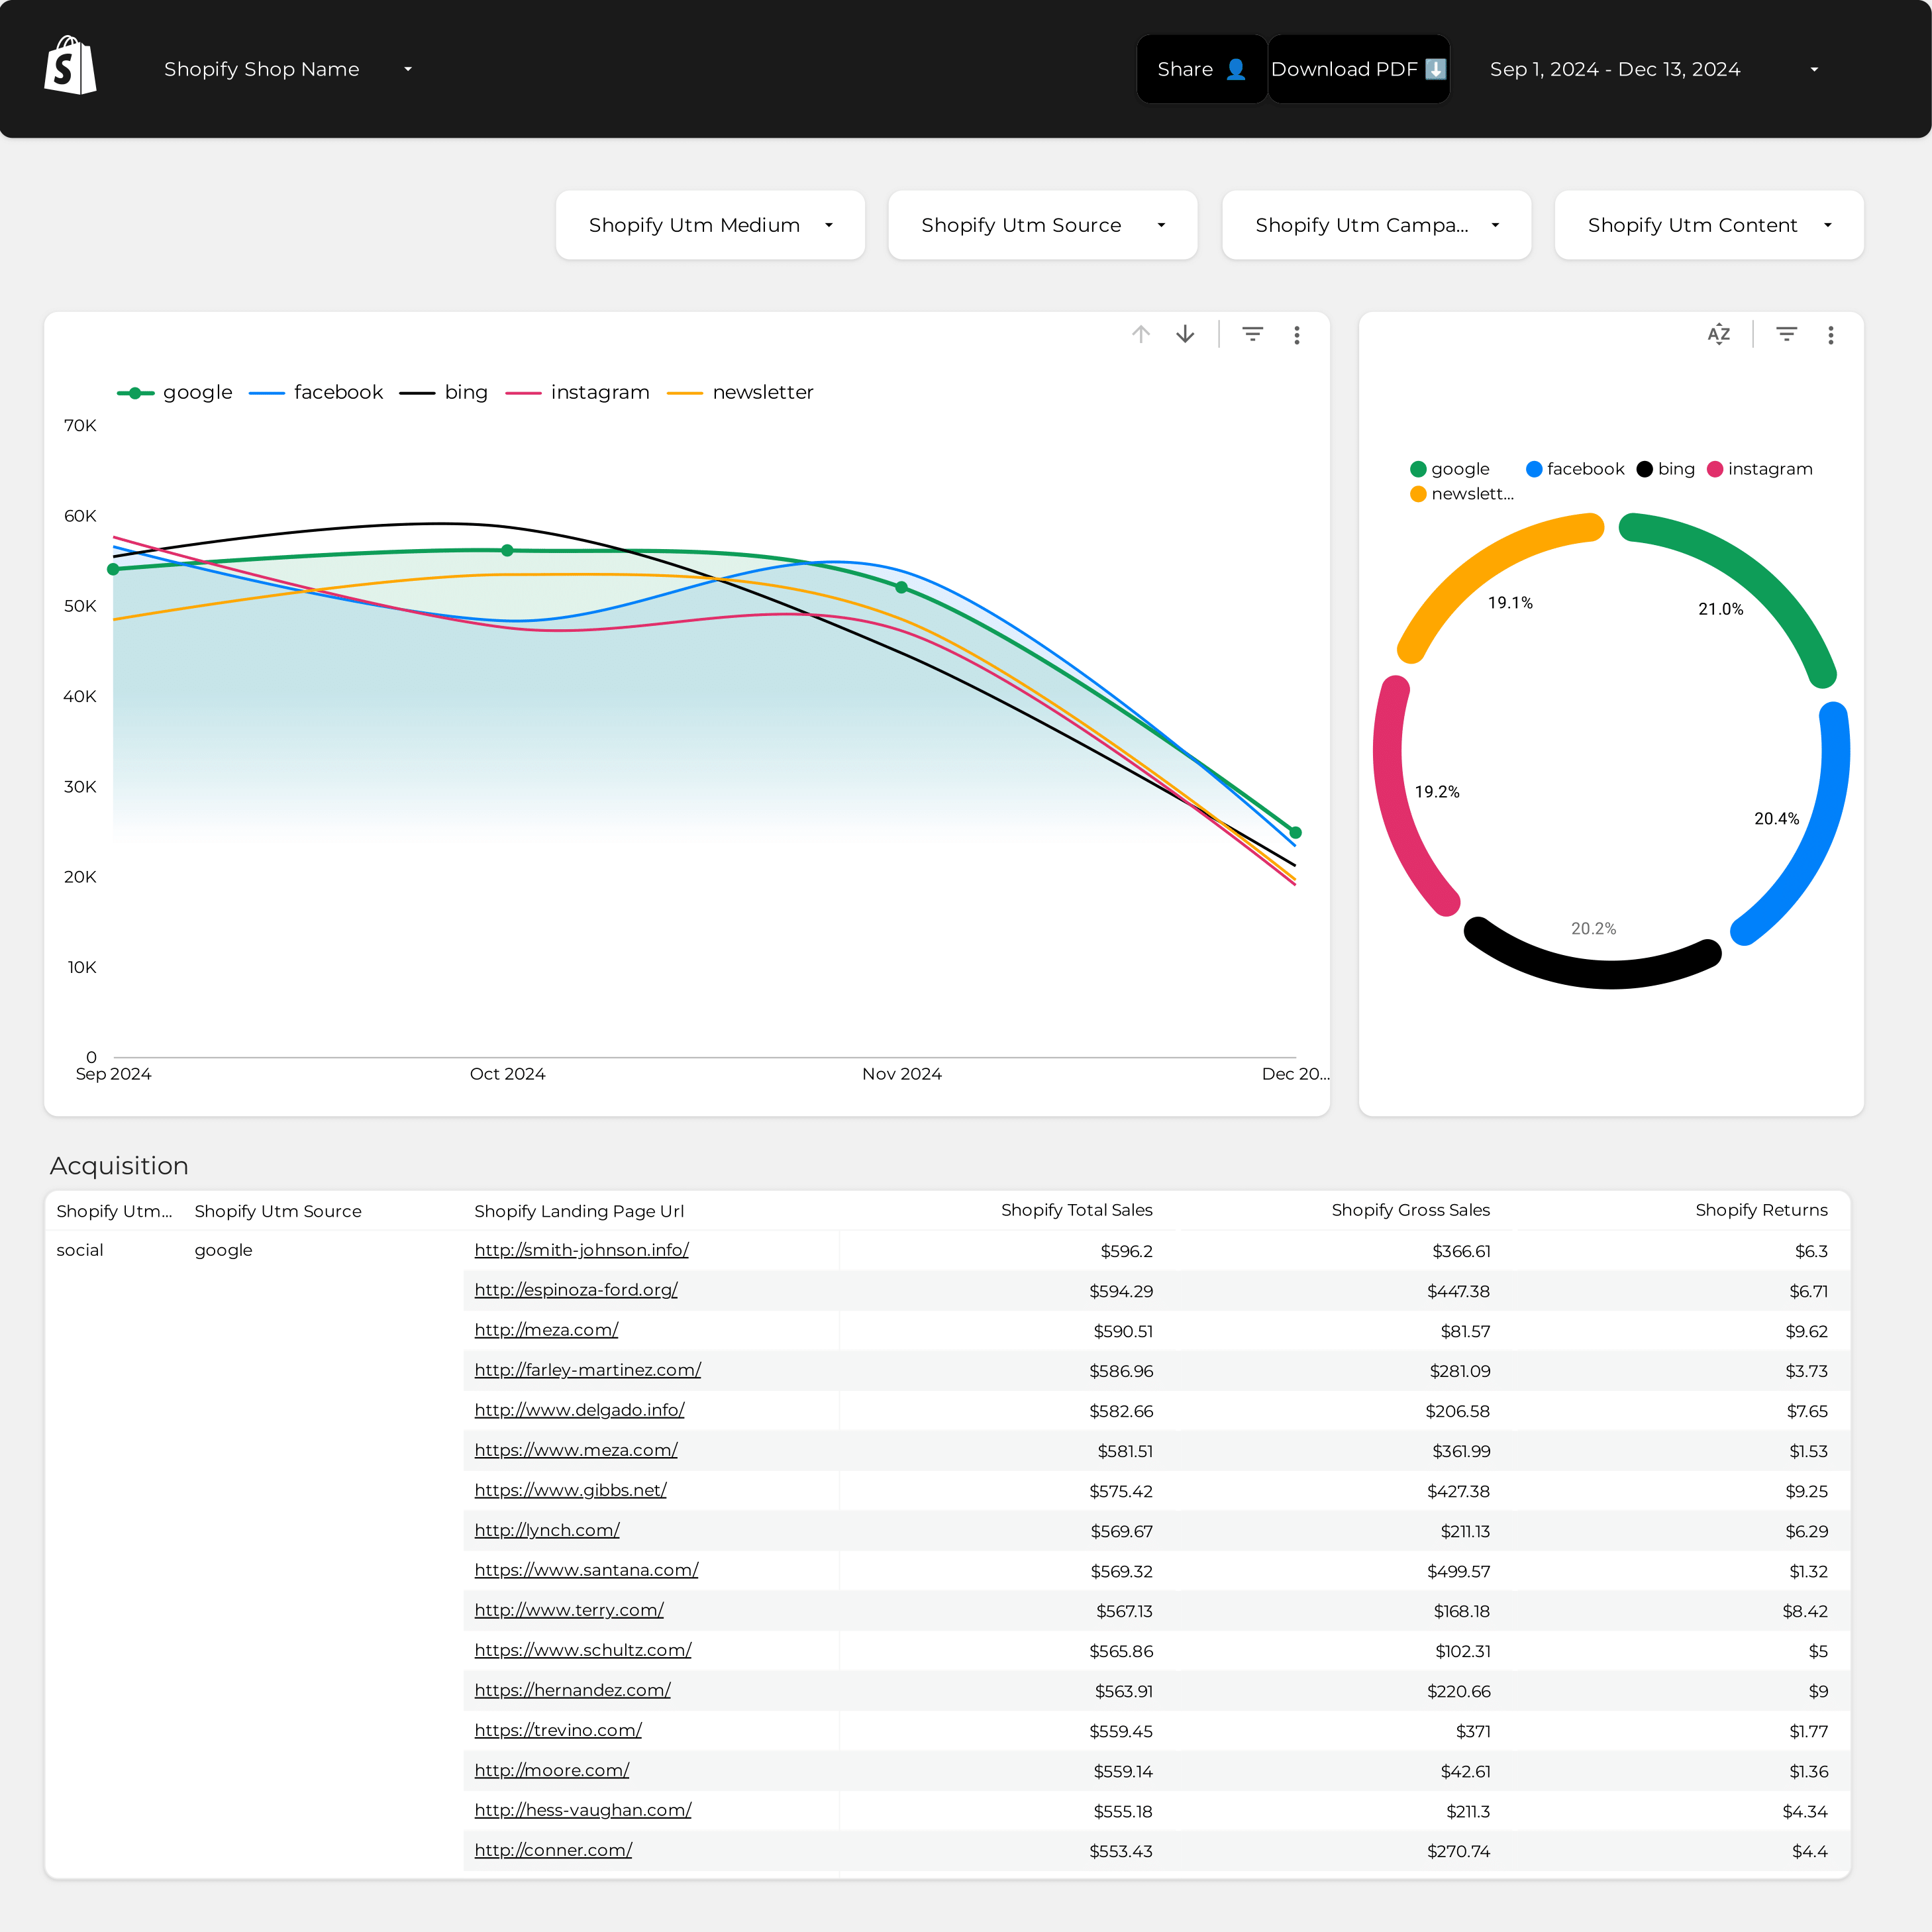
AOV dashboard example
Analyze key metrics with the AOV dashboard example. Track conversion rates, average order value, and CPC. Integrate data from E-commerce, Google Analytics 4, Shopify, Google Ads, and Facebook Ads. Segment by audience, campaign, and time. Perfect for marketing teams to measure performance and refine strategies.
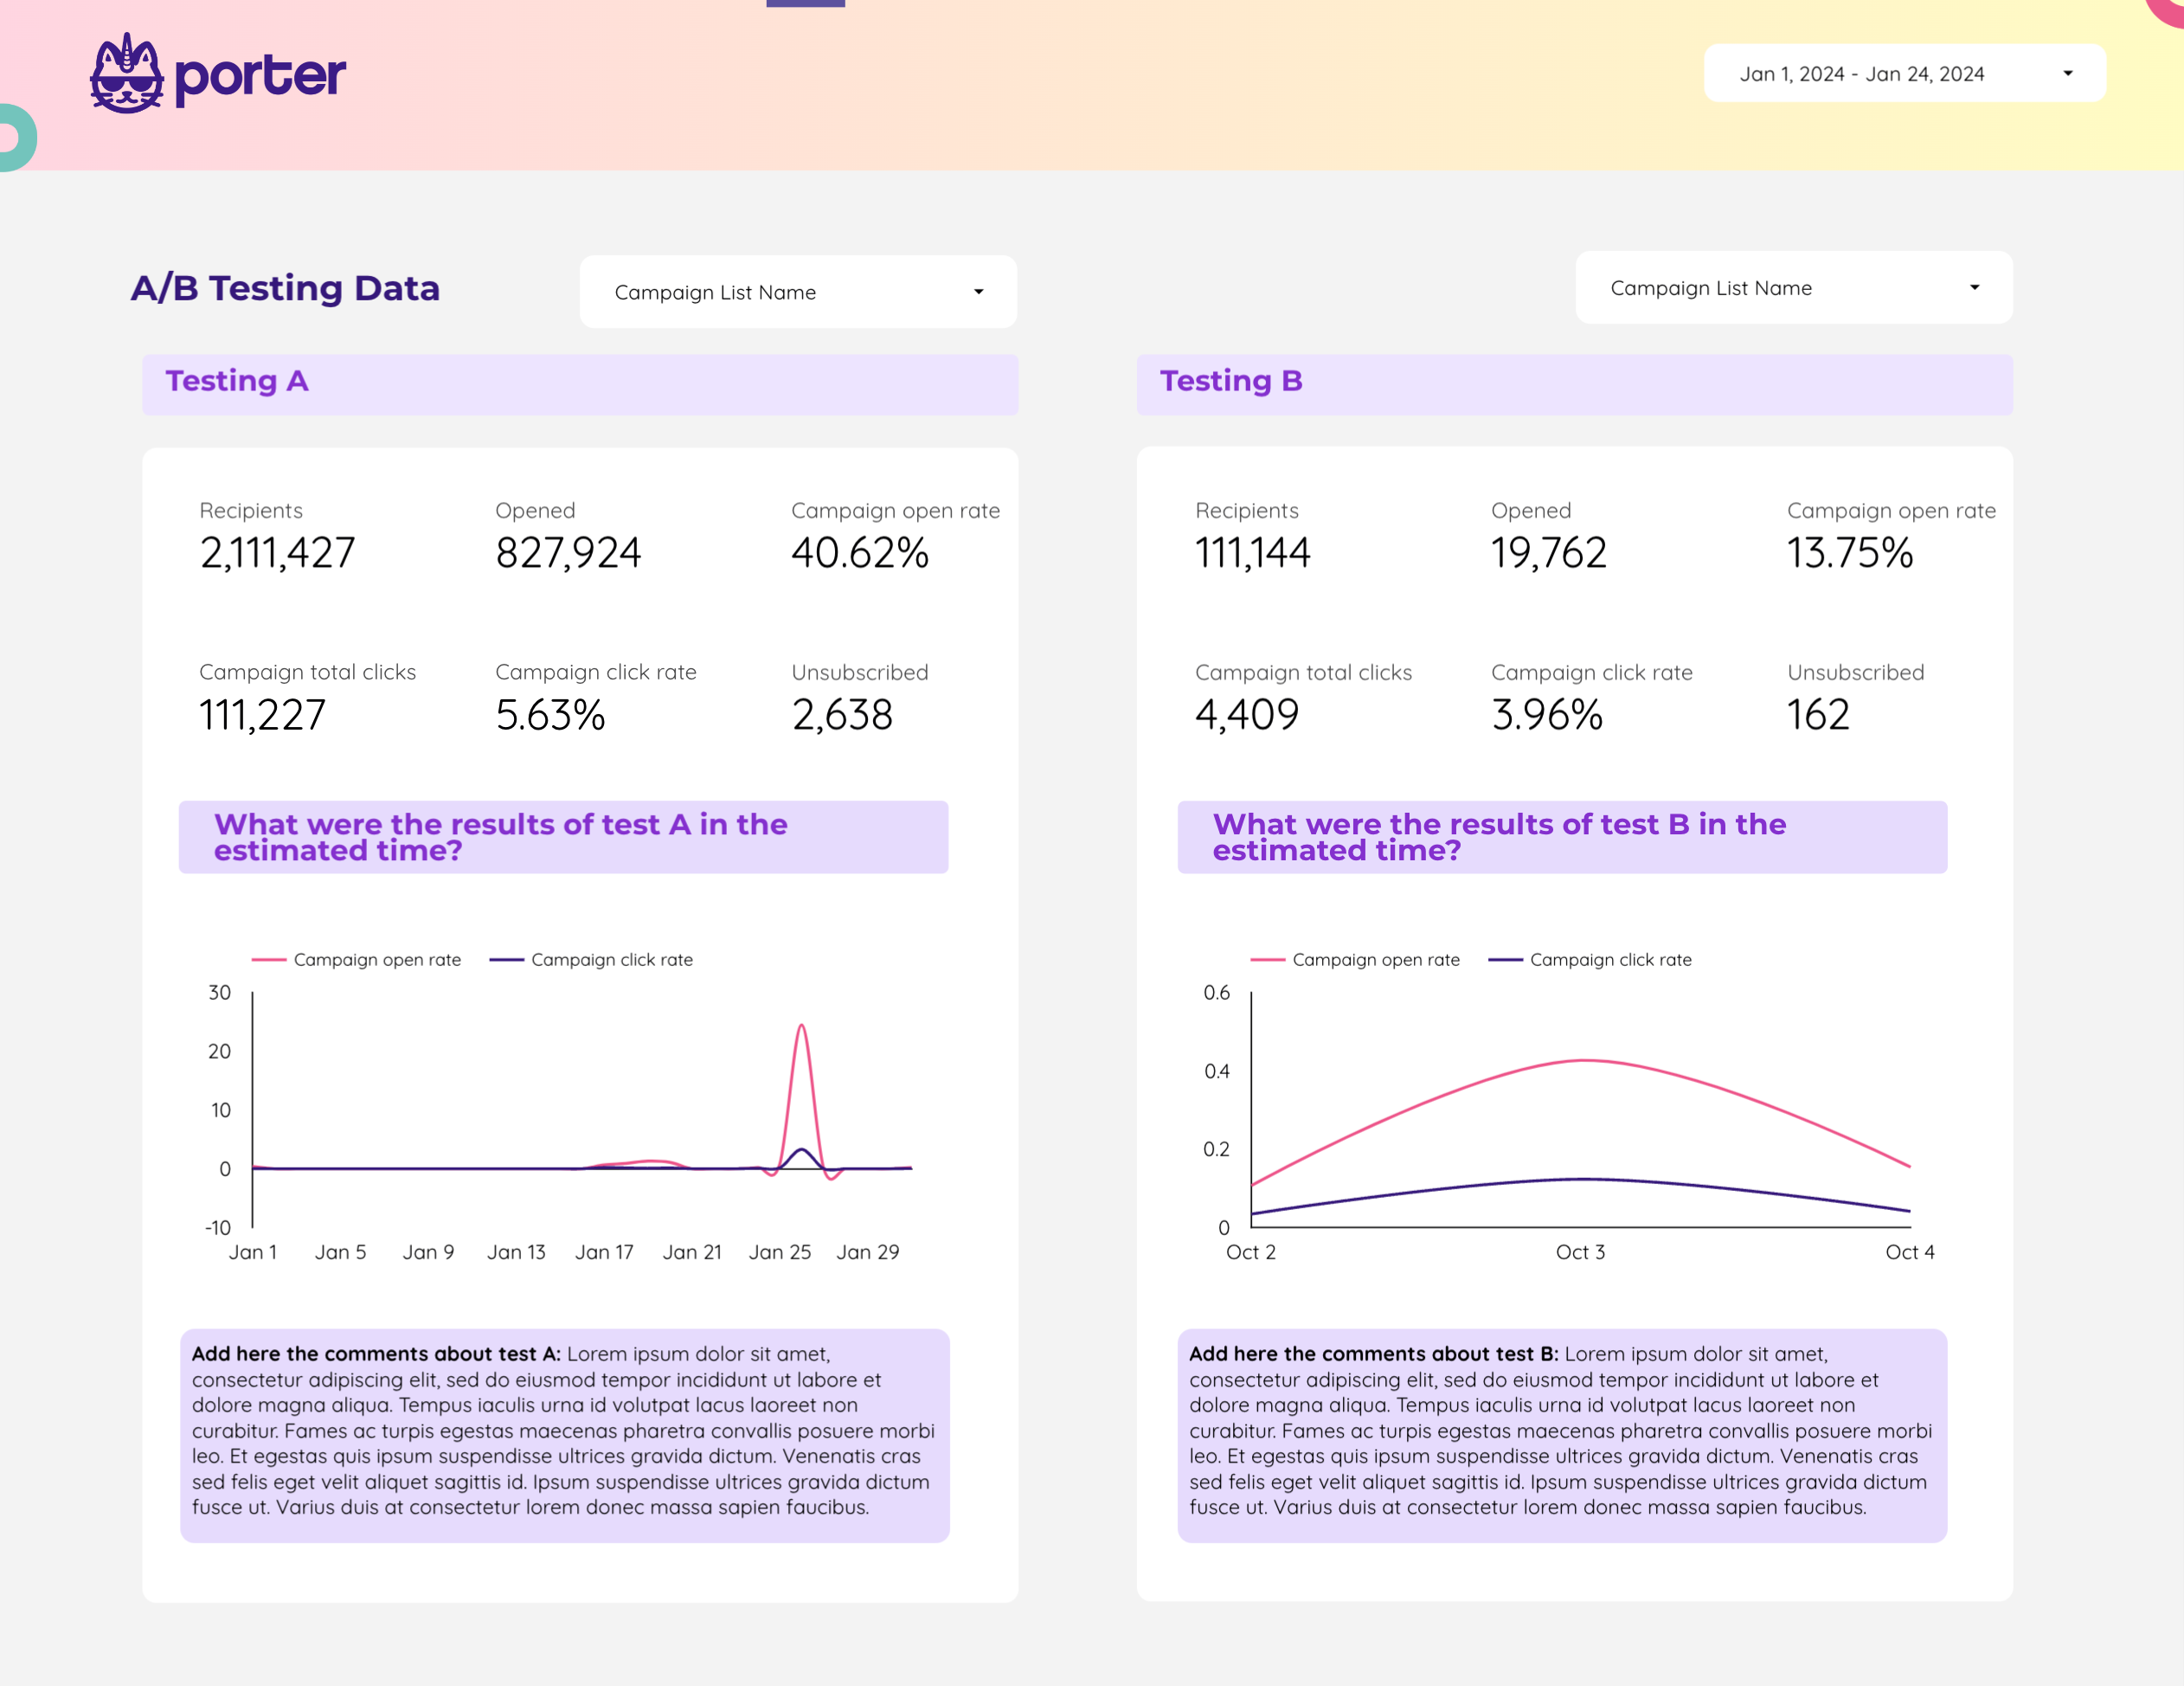
Modelo de relatório de Pruebas A/B para agências e equipes de marketing
Optimiza tus campañas con esta plantilla de informe de pruebas A/B. Mide las tasas de conversión, ROI y click-through rates. Analiza el público objetivo, demografía y mensajes de campaña. Consolida datos de Email Marketing y Copy para obtener insights accionables. Ideal para que los equipos de marketing rastreen el rendimiento y refinen estrategias.