

Lead generation Dashboard template
The Lead Generation Dashboard Template is designed for B2B marketers and sales teams to streamline their lead management process. This template integrates with popular platforms such as Google Ads, LinkedIn Ads, Facebook Ads, and HubSpot, providing a centralized view of your lead generation efforts.
Utilize data from Google Analytics 4 to track and analyze the performance of your campaigns. The dashboard offers insights into:
- Lead Sources: Identify which channels are driving the most leads.
- Conversion Rates: Monitor the effectiveness of your PPC campaigns.
- CRM Integration: Seamlessly connect with HubSpot to manage and nurture leads.
This template is essential for businesses looking to optimize their B2B lead generation strategy by leveraging data from multiple advertising and analytics platforms.
HubSpot Dashboard template
The HubSpot Dashboard Template is designed for B2B companies focusing on CRM and Email Marketing. This template provides a structured view of your marketing and sales data, enabling you to track and analyze your funnels and inbound marketing efforts effectively.
With this dashboard, you can:
- Monitor lead generation and conversion rates through detailed funnel analysis.
- Track email campaign performance metrics, including open rates and click-through rates.
- Analyze customer interactions and engagement within the HubSpot CRM.
Utilize this template to align your marketing strategies with your business objectives, ensuring a data-driven approach to inbound marketing.
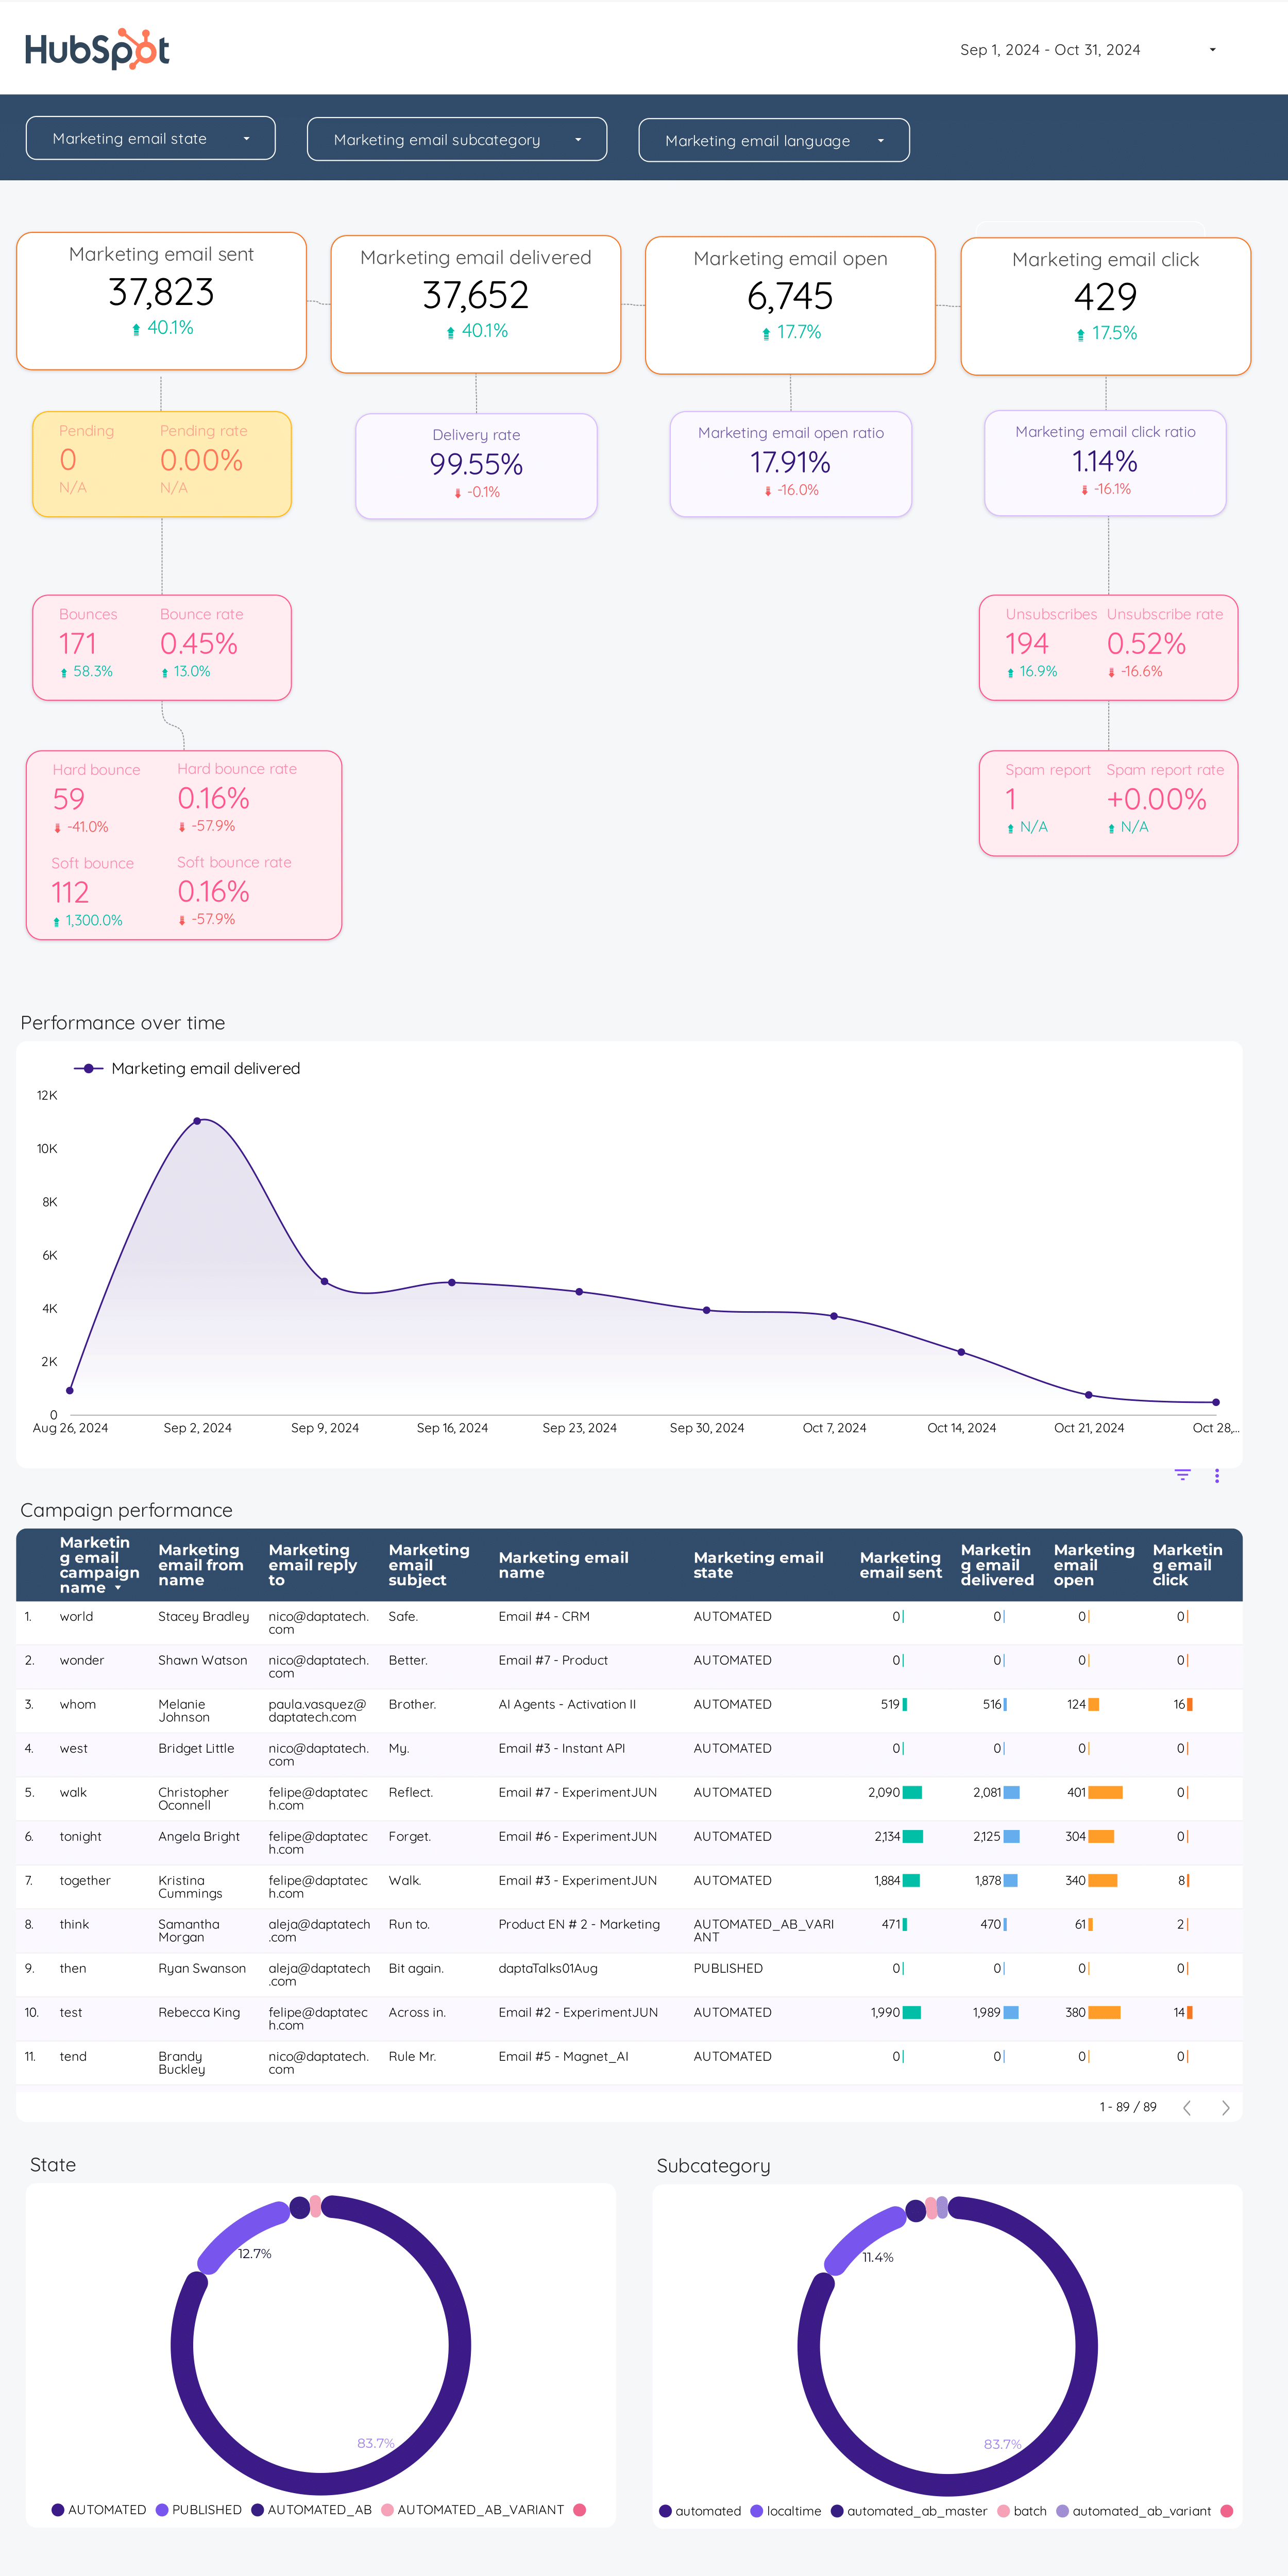
Email marketing Dashboard template
The Email Marketing Dashboard template is designed to streamline your email campaigns across platforms like Mailchimp, Klaviyo, ActiveCampaign, and HubSpot. This dashboard provides a centralized view of your email marketing performance, allowing you to track and analyze critical metrics.
With this template, you can:
- Monitor open rates, click-through rates, and conversion rates in real-time.
- Compare performance across different email platforms.
- Identify trends and patterns in subscriber engagement.
- Access detailed reports on campaign performance.
Utilize this dashboard to make data-driven decisions and optimize your email marketing strategies effectively.
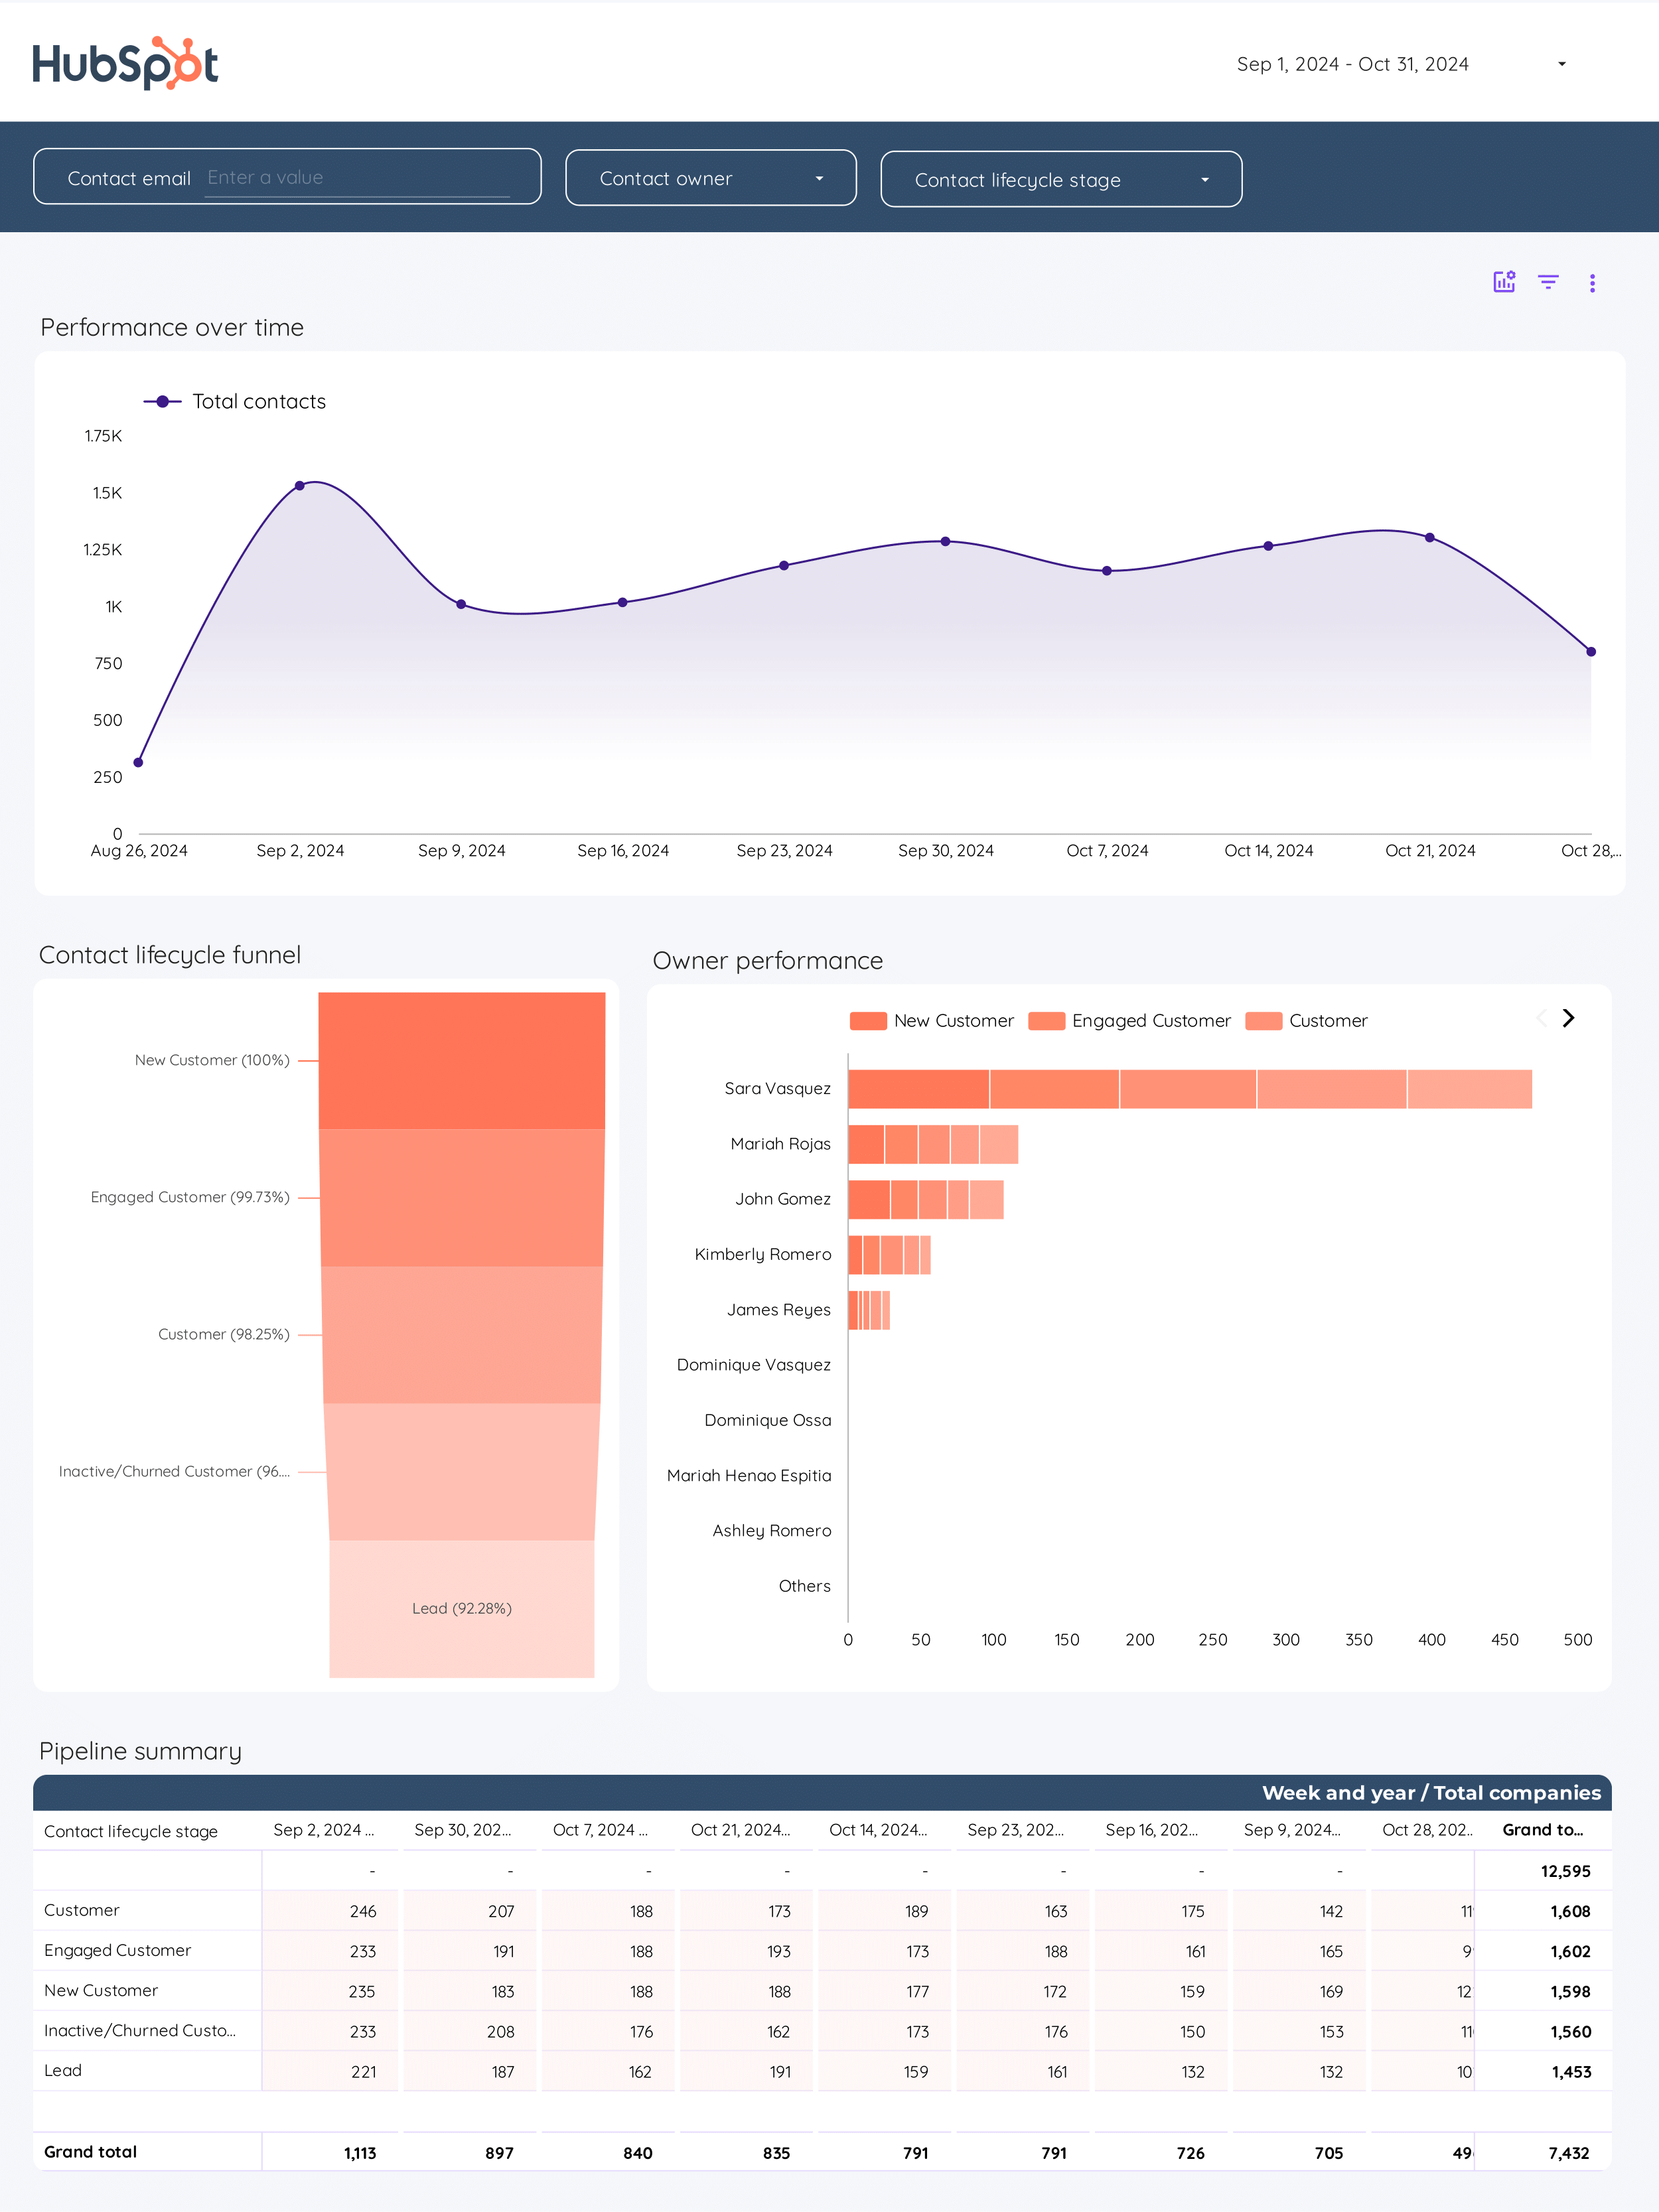
CRM Dashboard template
The CRM Dashboard Template is designed for B2B companies focusing on CRM and Email Marketing strategies. This template integrates seamlessly with platforms like HubSpot, Mailchimp, and ActiveCampaign, providing a centralized view of your sales and marketing activities.
Utilize this dashboard to:
- Track and manage sales pipelines efficiently.
- Monitor email marketing campaigns and their performance metrics.
- Analyze customer interactions and engagement levels.
- Access real-time data from HubSpot and other CRM tools.
This template serves as a foundational base for businesses aiming to streamline their CRM processes and optimize their email marketing efforts.
B2B KPI tracker Dashboard template
The B2B KPI Tracker Dashboard Template is designed for businesses using HubSpot to monitor and analyze their performance metrics effectively. This template provides a structured approach to track essential KPIs, ensuring that your business objectives align with your operational activities.
With this dashboard, you can:
- Visualize critical performance indicators in real-time.
- Integrate seamlessly with HubSpot for automated data updates.
- Customize the dashboard to focus on specific metrics relevant to your business goals.
Utilize this template to maintain a clear overview of your business’s performance, facilitating data-driven decision-making and strategic planning.
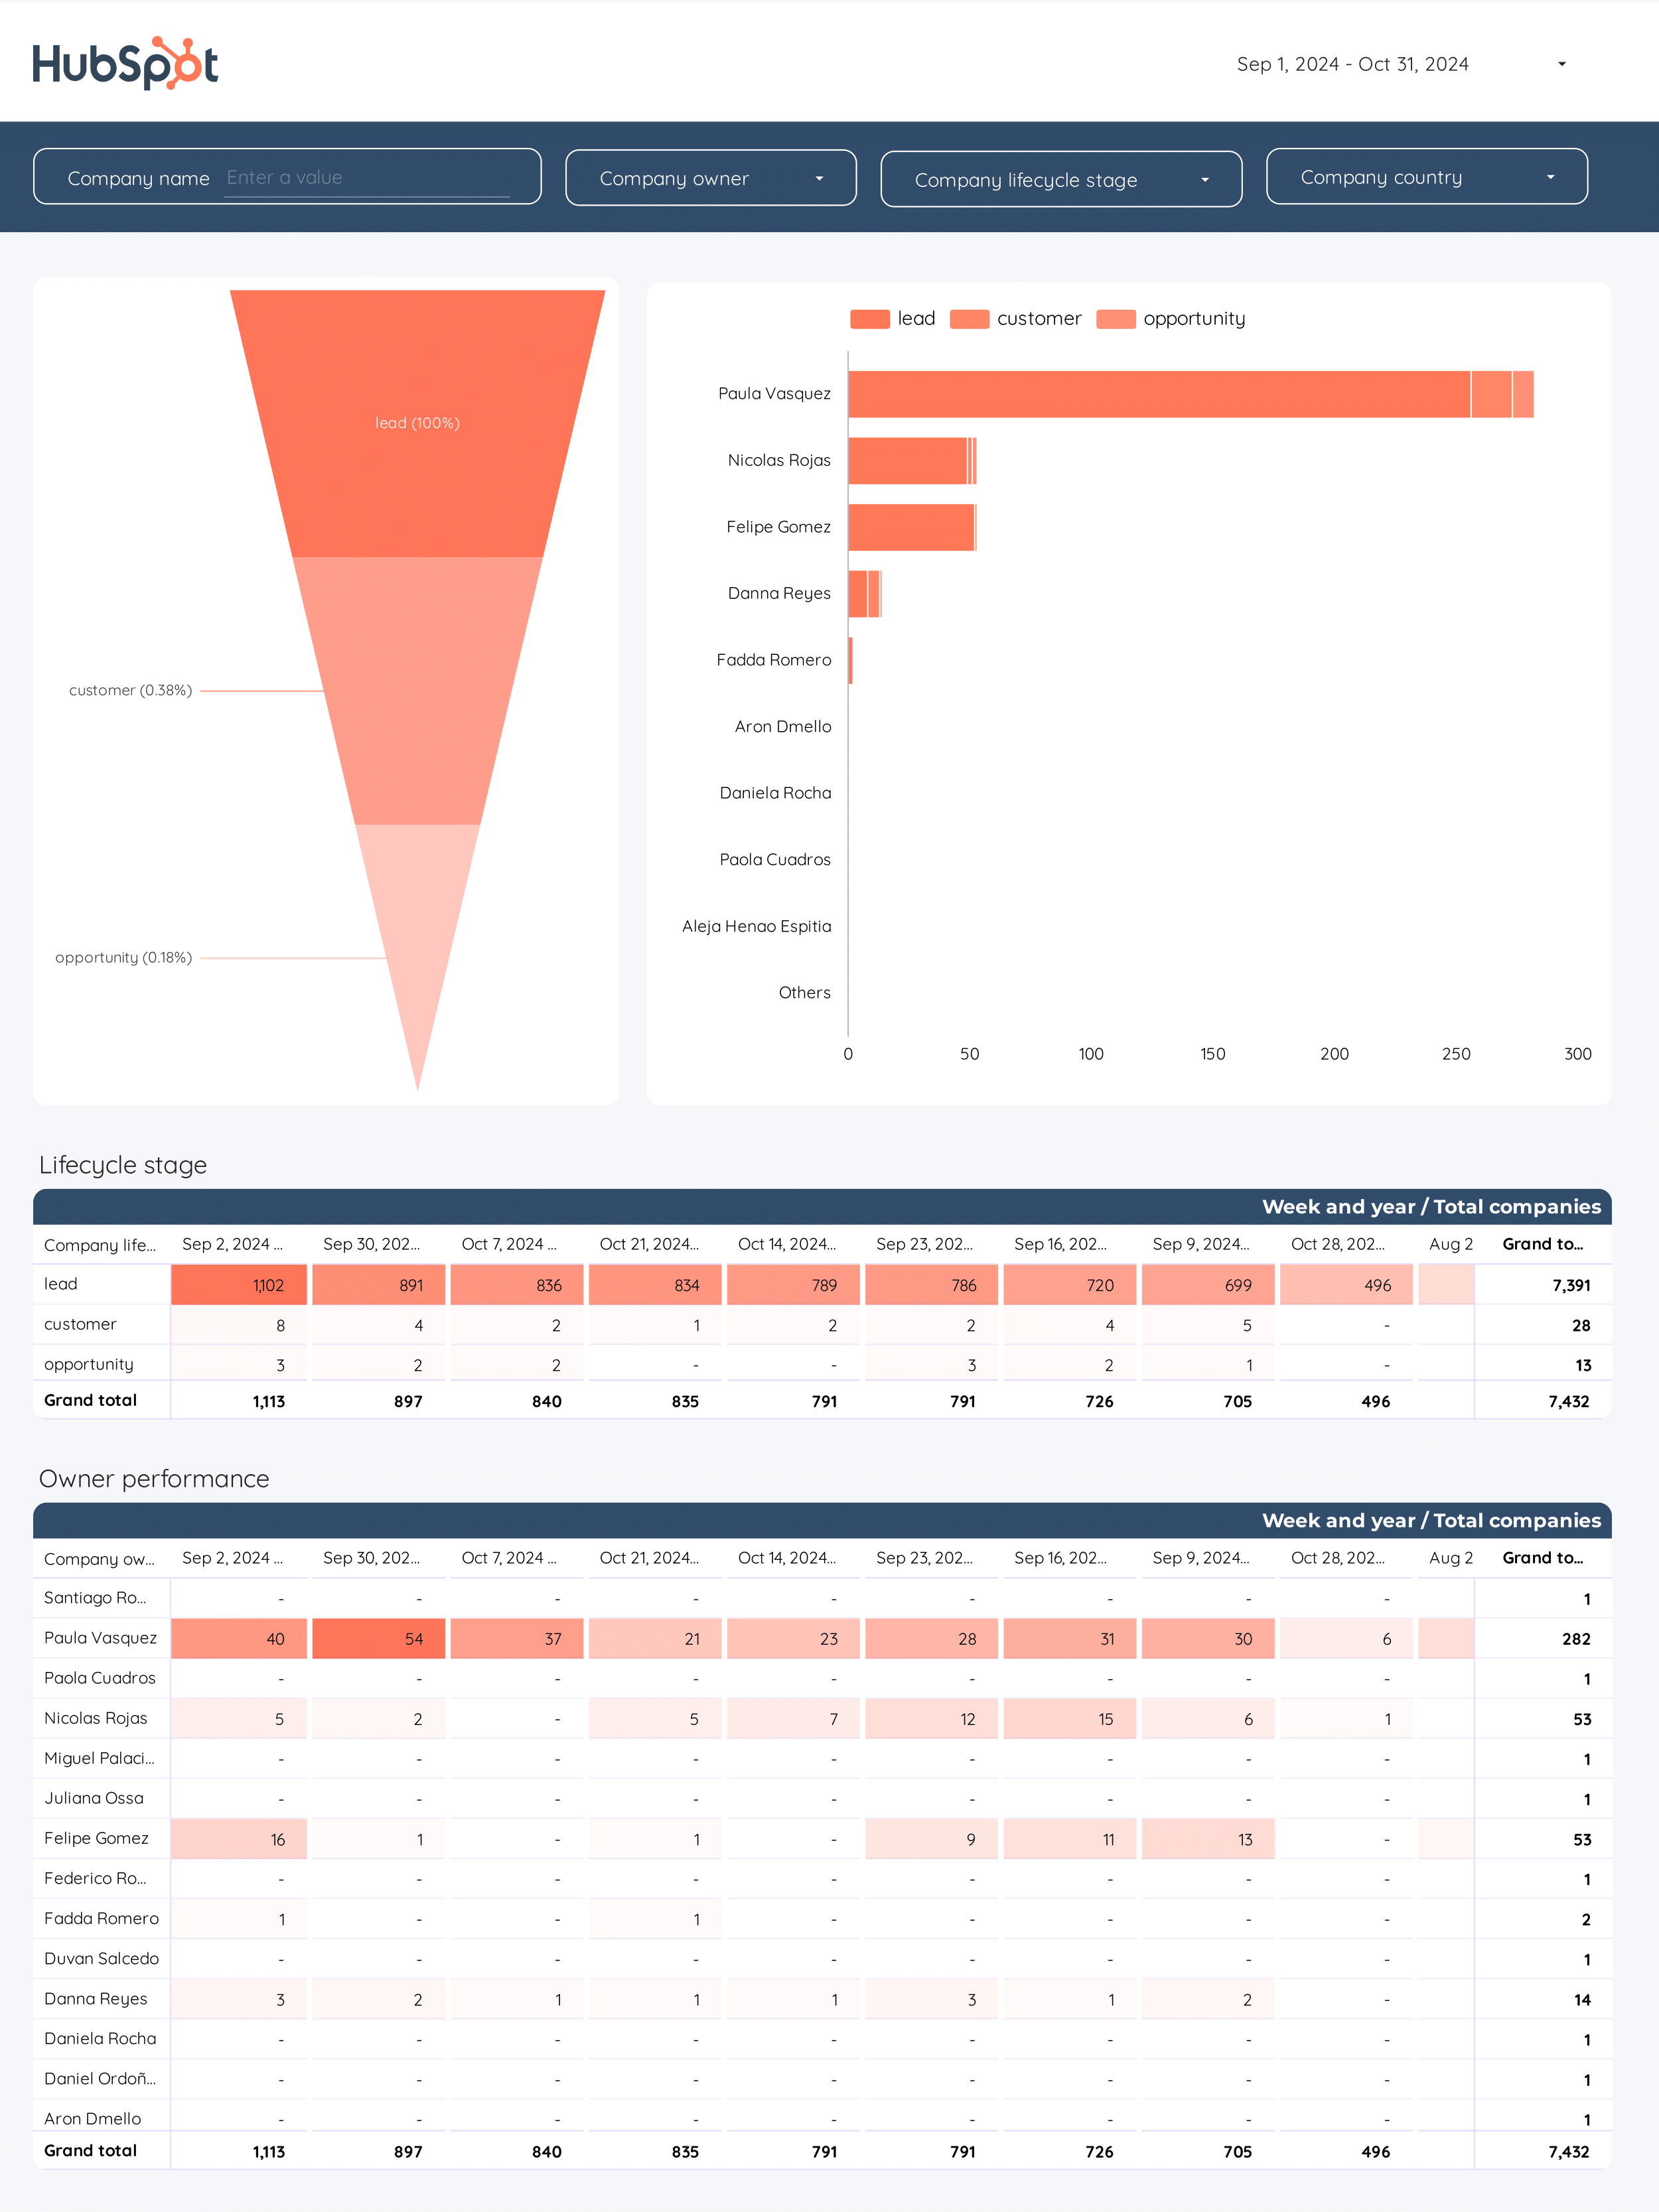
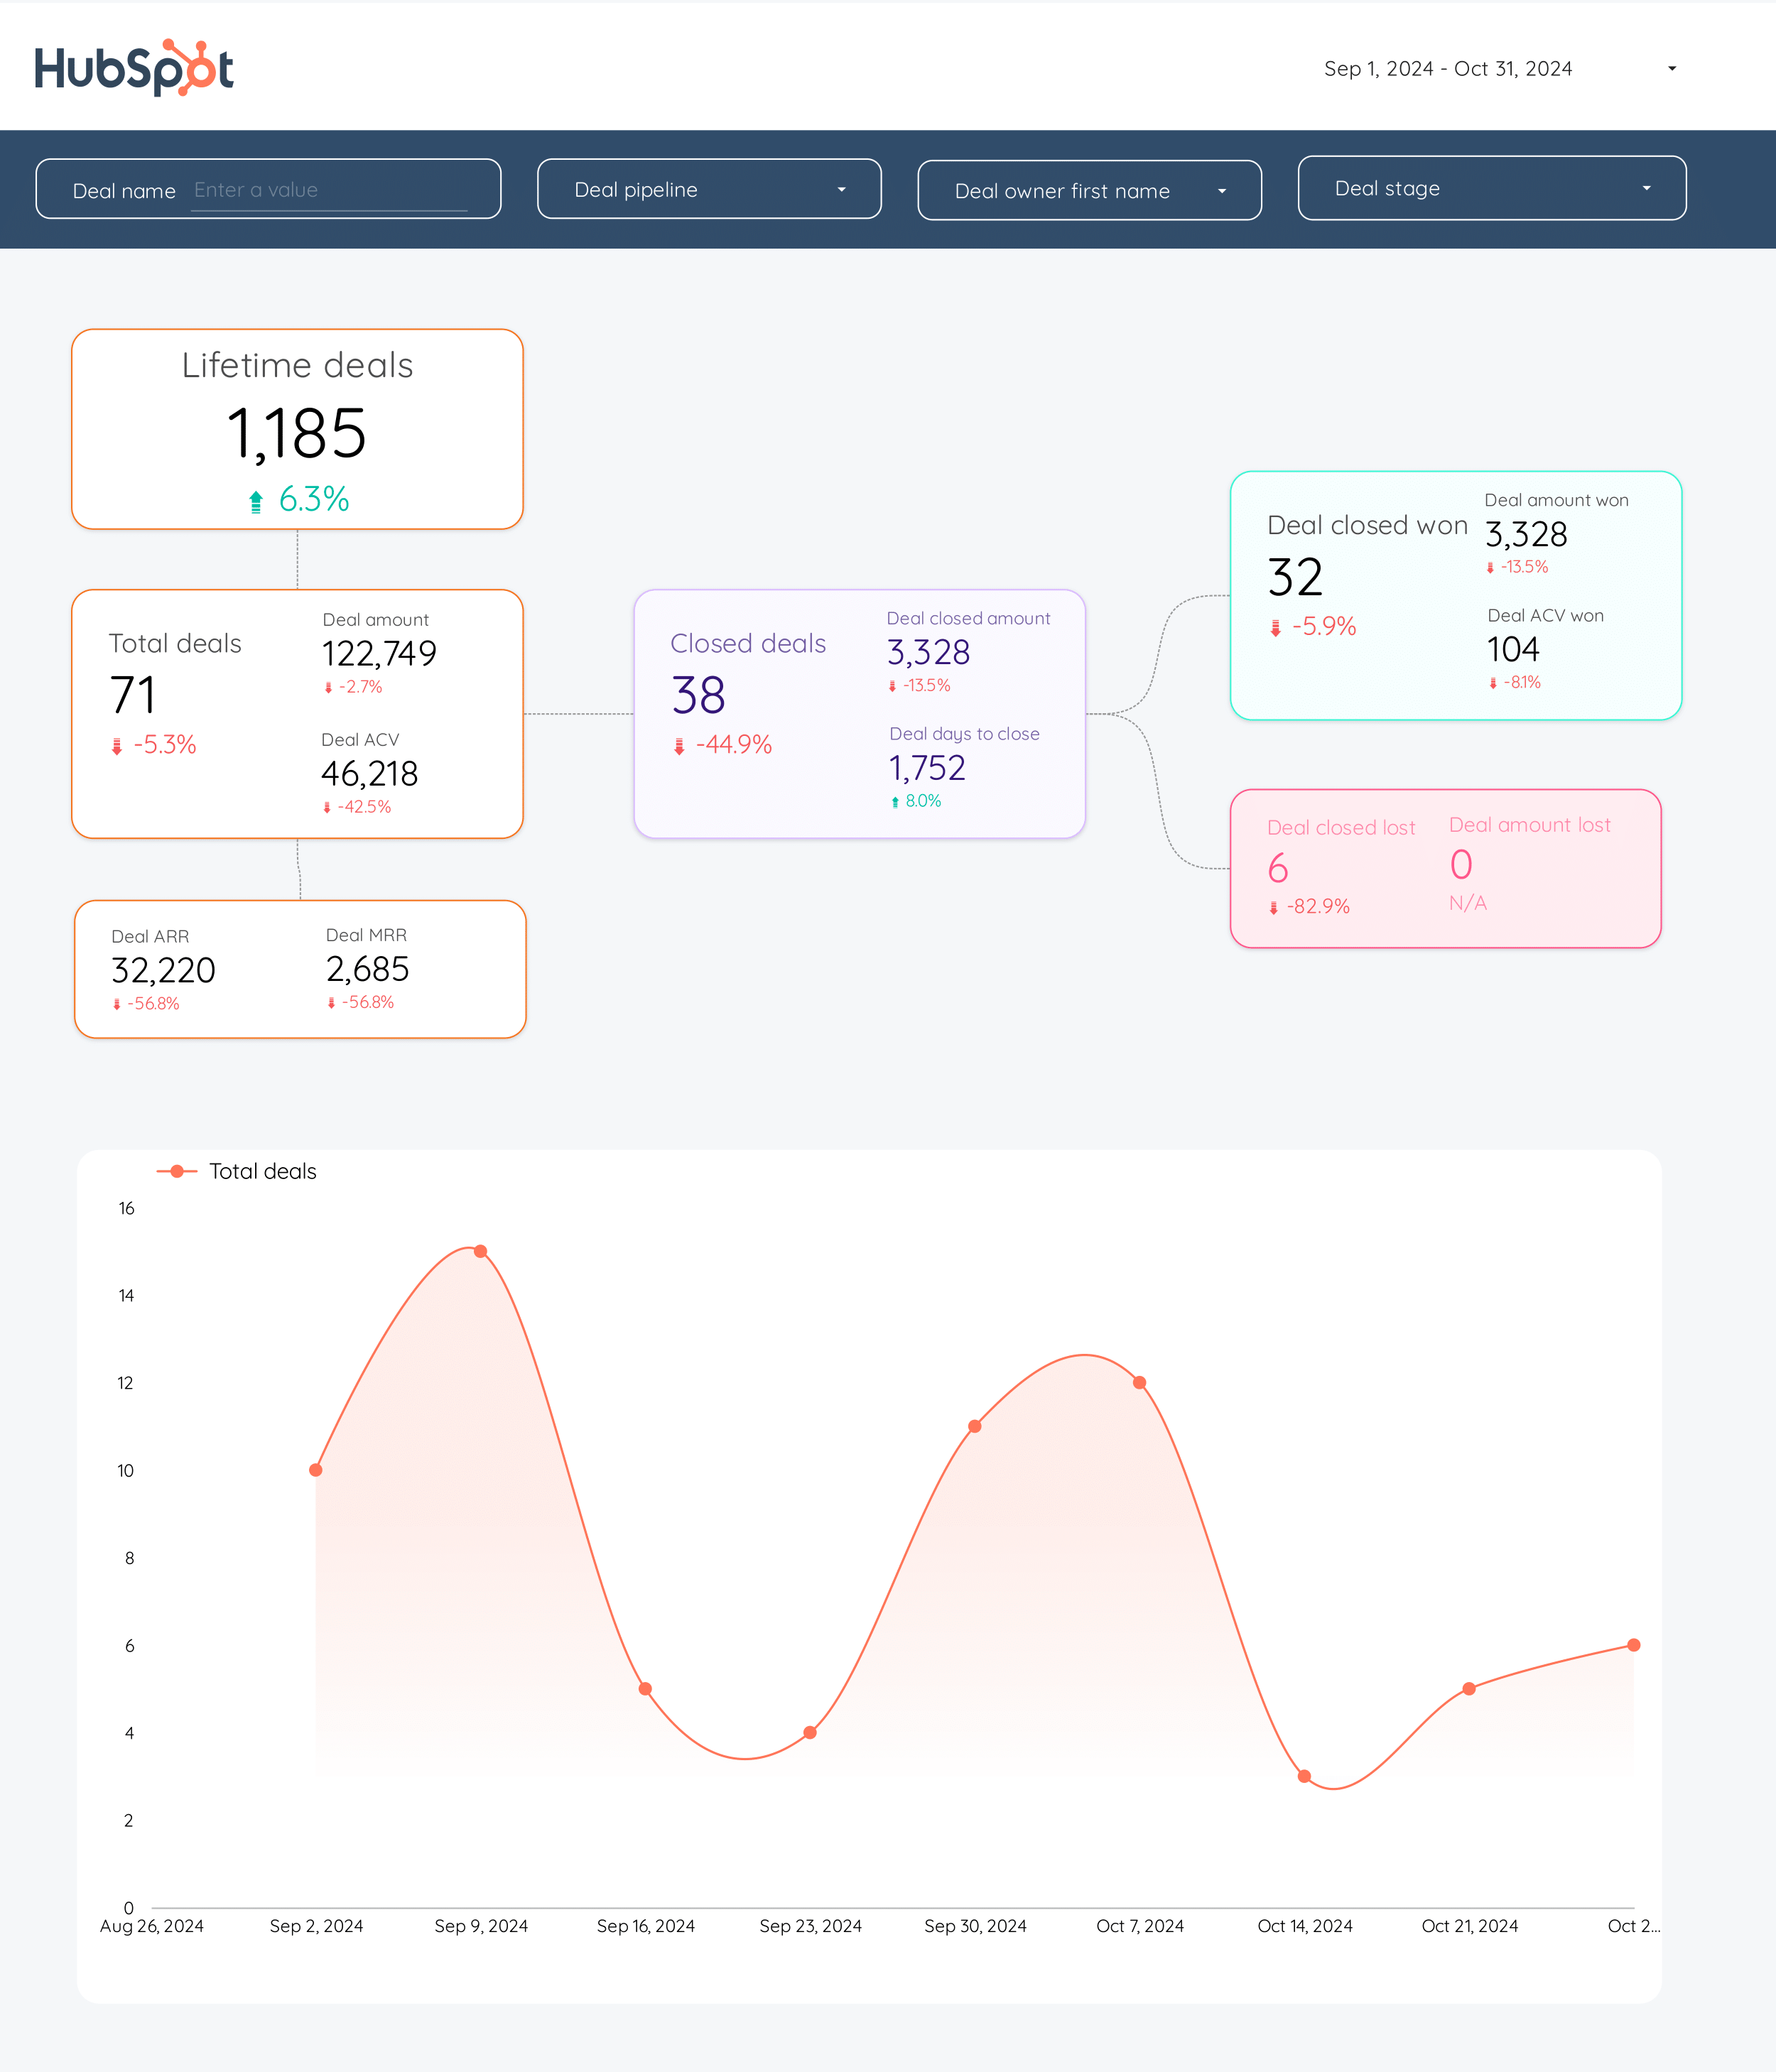
B2B Funnel Dashboard template
The B2B Funnel Dashboard template is designed for businesses using HubSpot to track and manage their sales funnels effectively. This template provides a structured view of your sales process, allowing you to monitor each stage of the funnel with precision.
With this dashboard, you can:
- Visualize the entire sales funnel from lead generation to deal closure.
- Analyze conversion rates at each stage to identify potential bottlenecks.
- Track the performance of sales teams and individual representatives.
- Integrate seamlessly with HubSpot for real-time data updates.
This template is essential for B2B companies aiming to optimize their sales strategies and improve their overall sales process management.
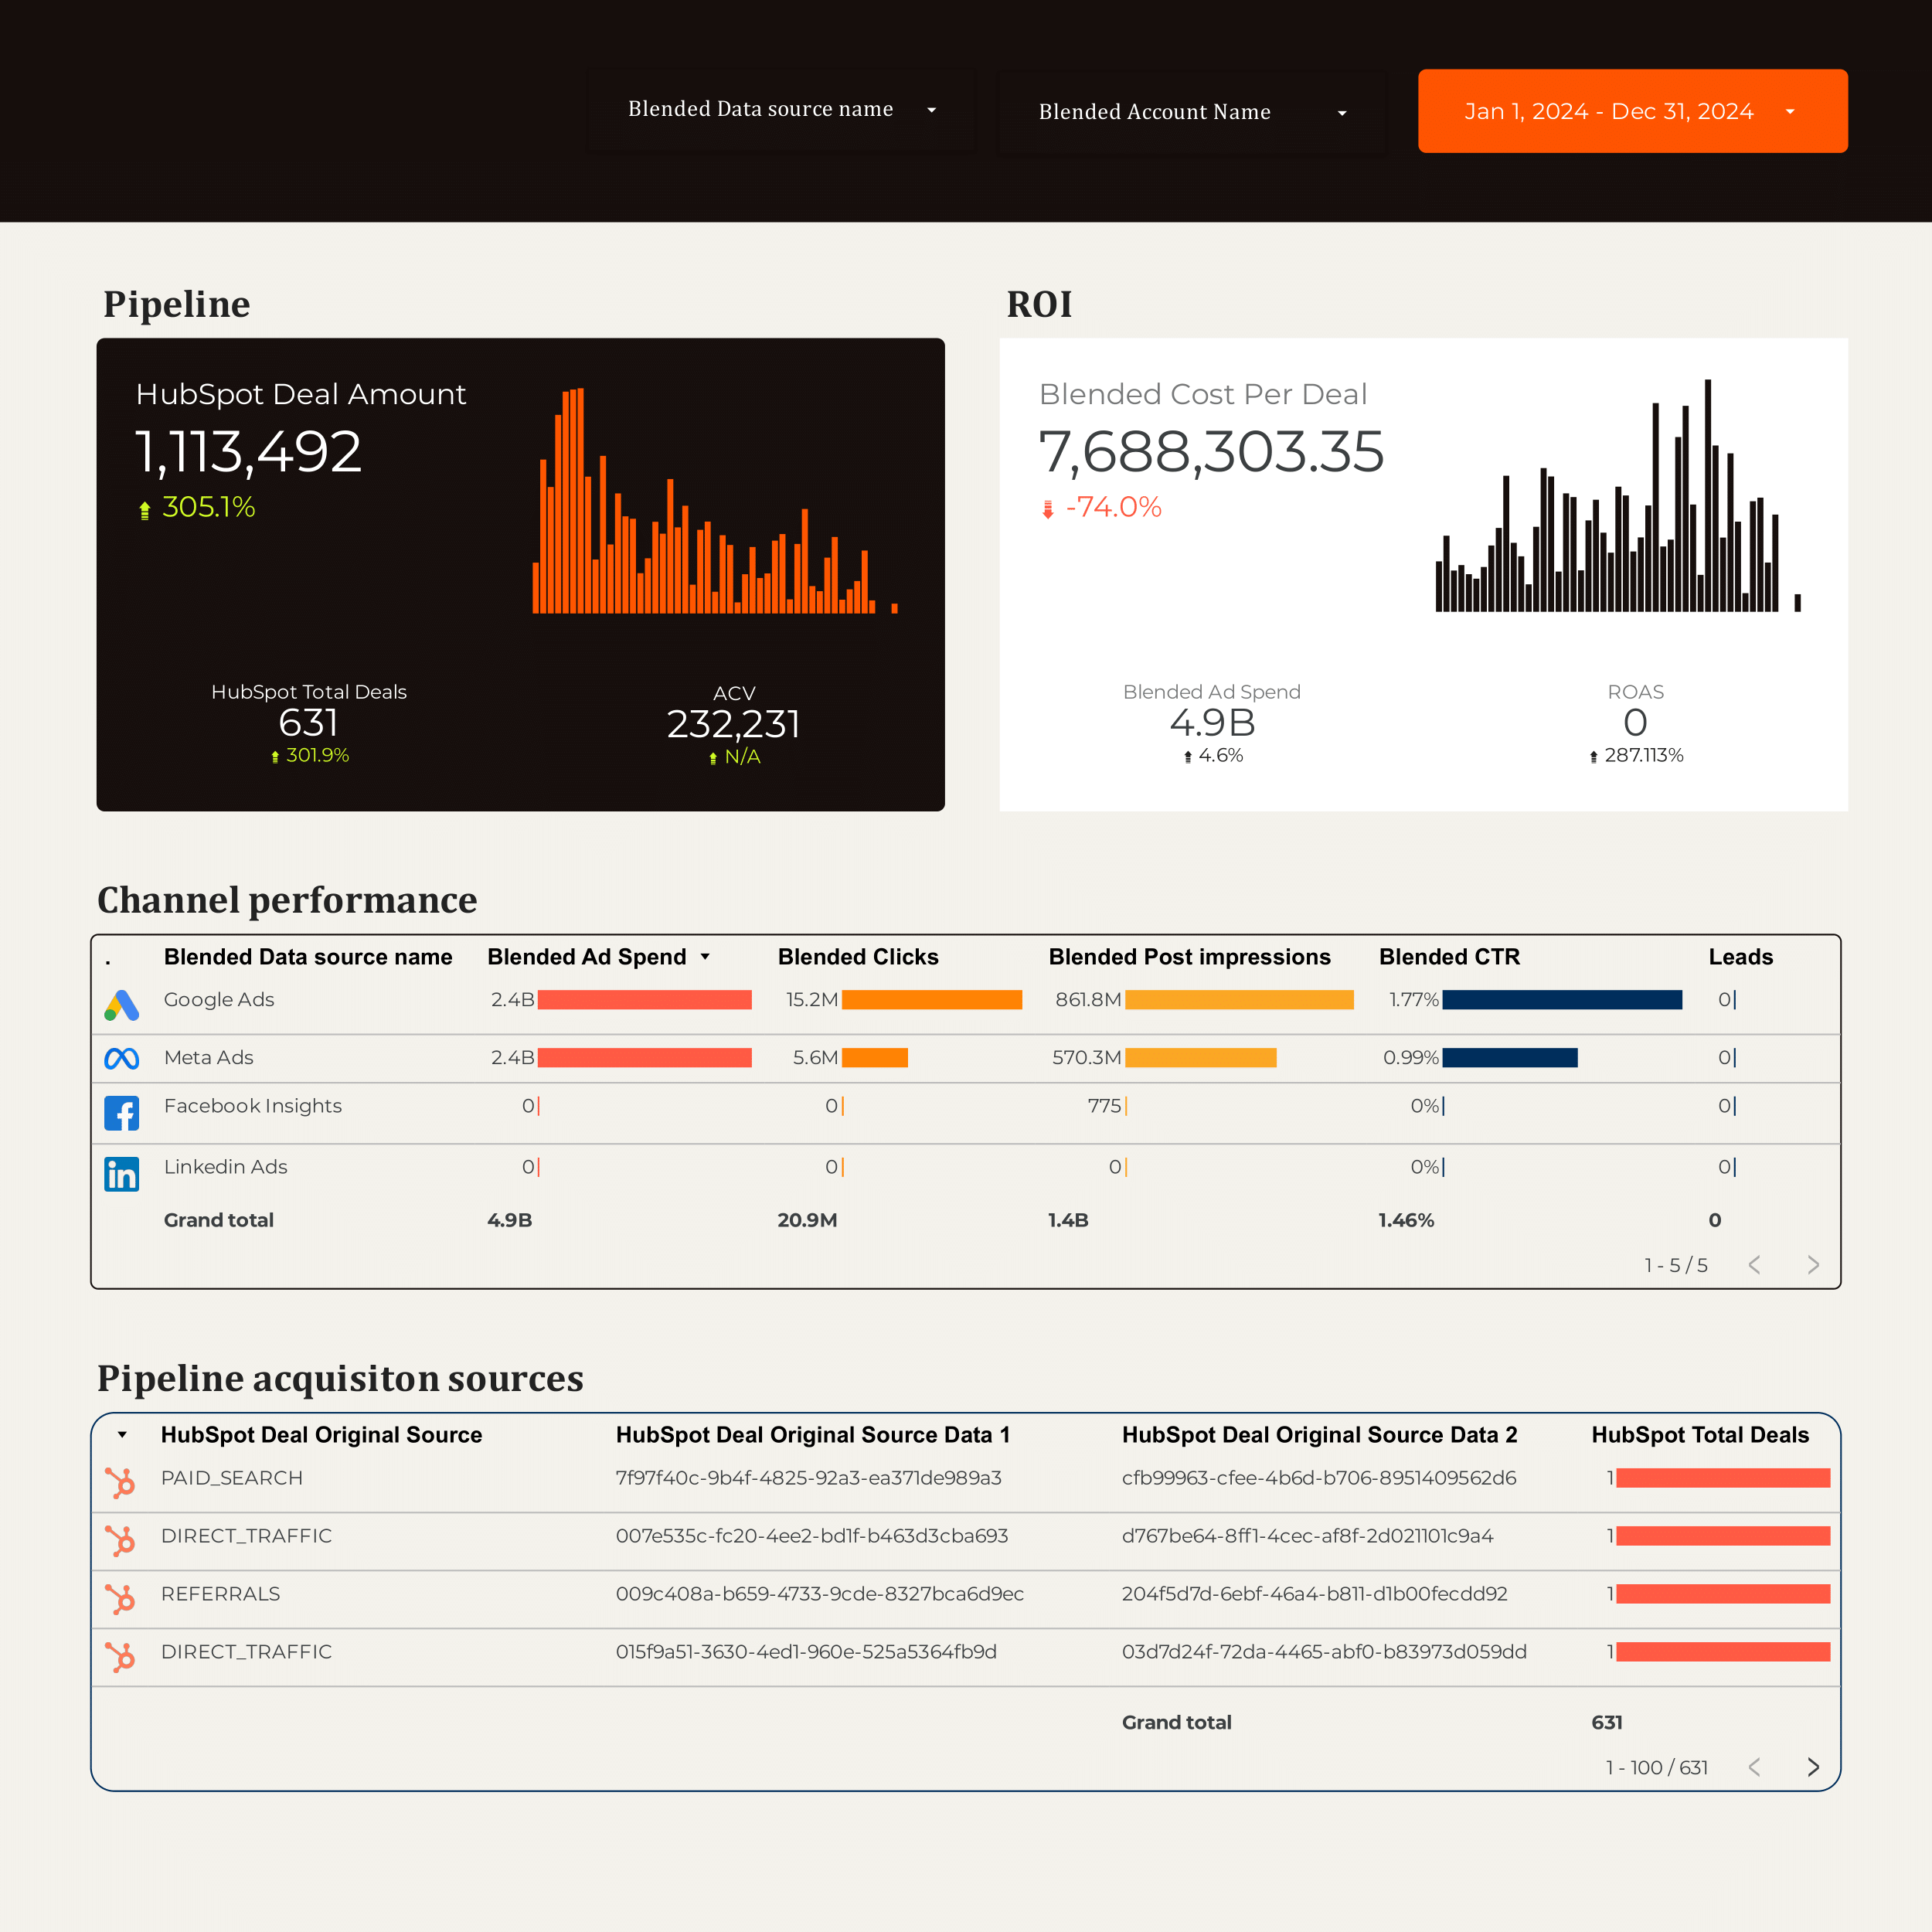
B2B Dashboard template
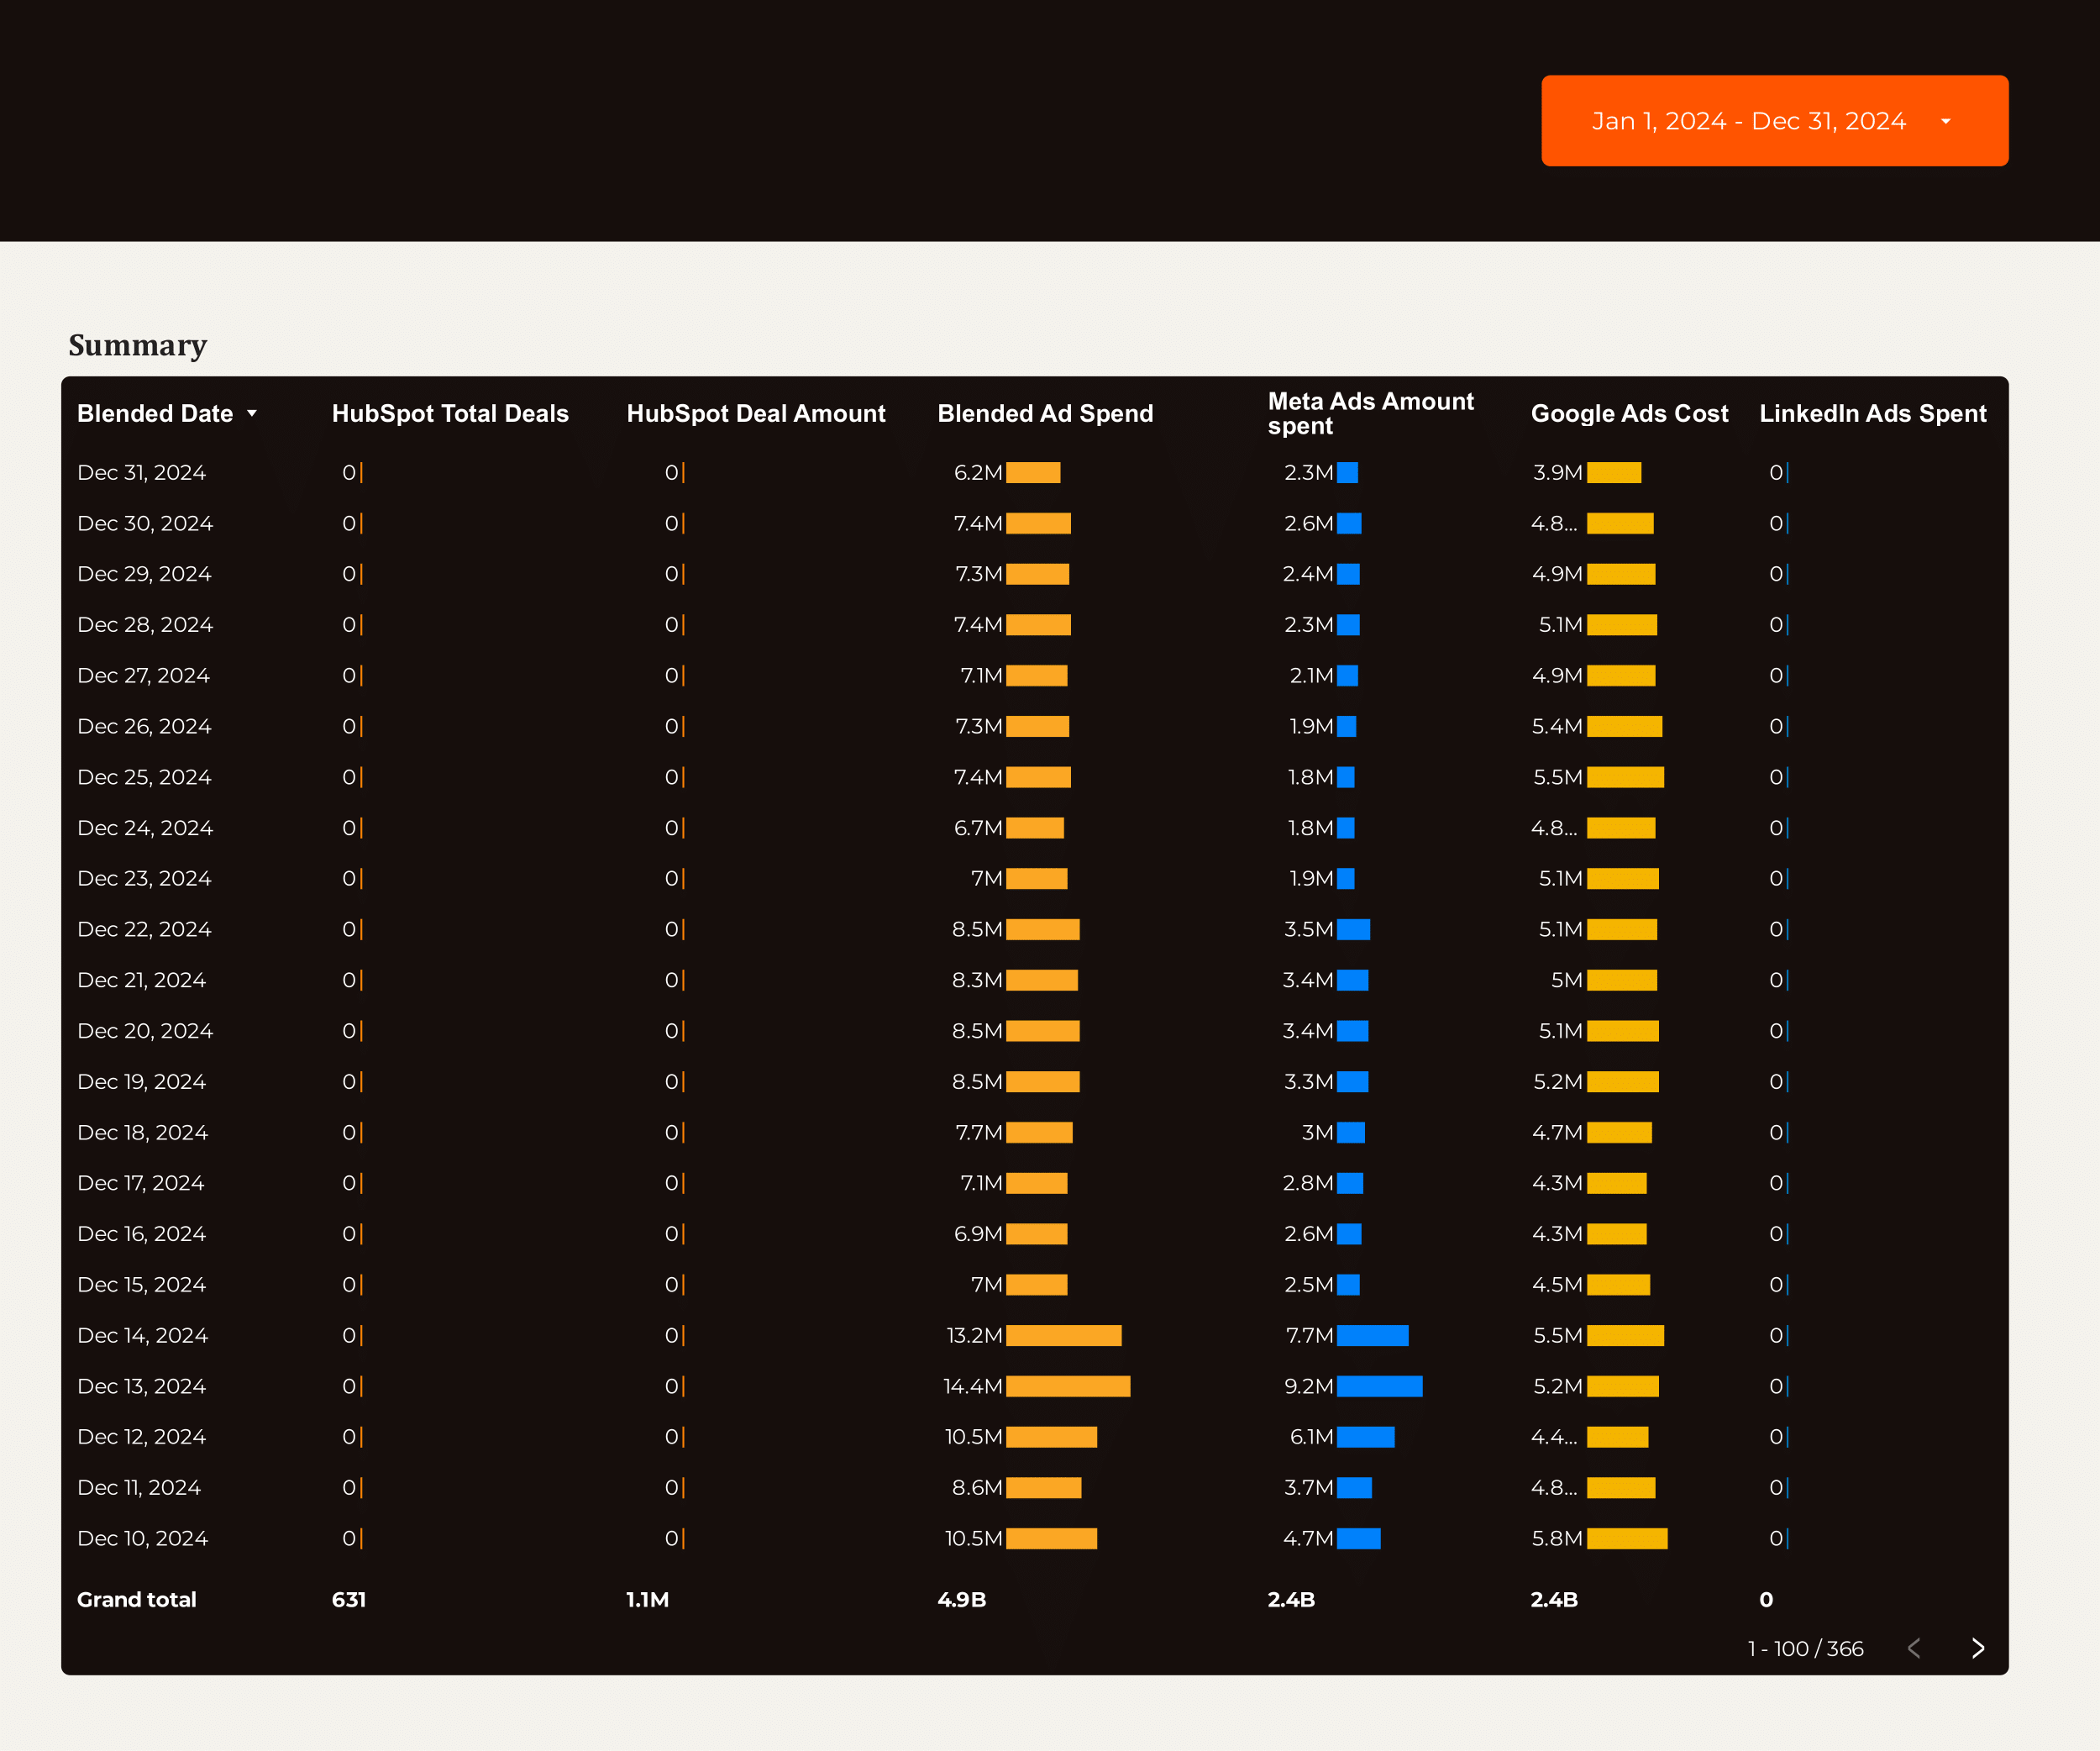
The B2B Dashboard template integrates with HubSpot, Facebook Ads, Google Ads, LinkedIn Ads, and Google Analytics 4 to provide a centralized view of your marketing and sales data.
Utilize this dashboard to track and analyze:
- CRM Data from HubSpot for lead management and sales performance.
- PPC Campaigns across Facebook, Google, and LinkedIn Ads to monitor ad spend and ROI.
- SEO Metrics to assess organic search performance and traffic sources.
- Website Analytics through Google Analytics 4 for user behavior insights and conversion tracking.
This template is designed for B2B marketers seeking to streamline data from multiple platforms into a single, actionable interface.