Twitter Ads dashboard: free report template for Google Data Studio
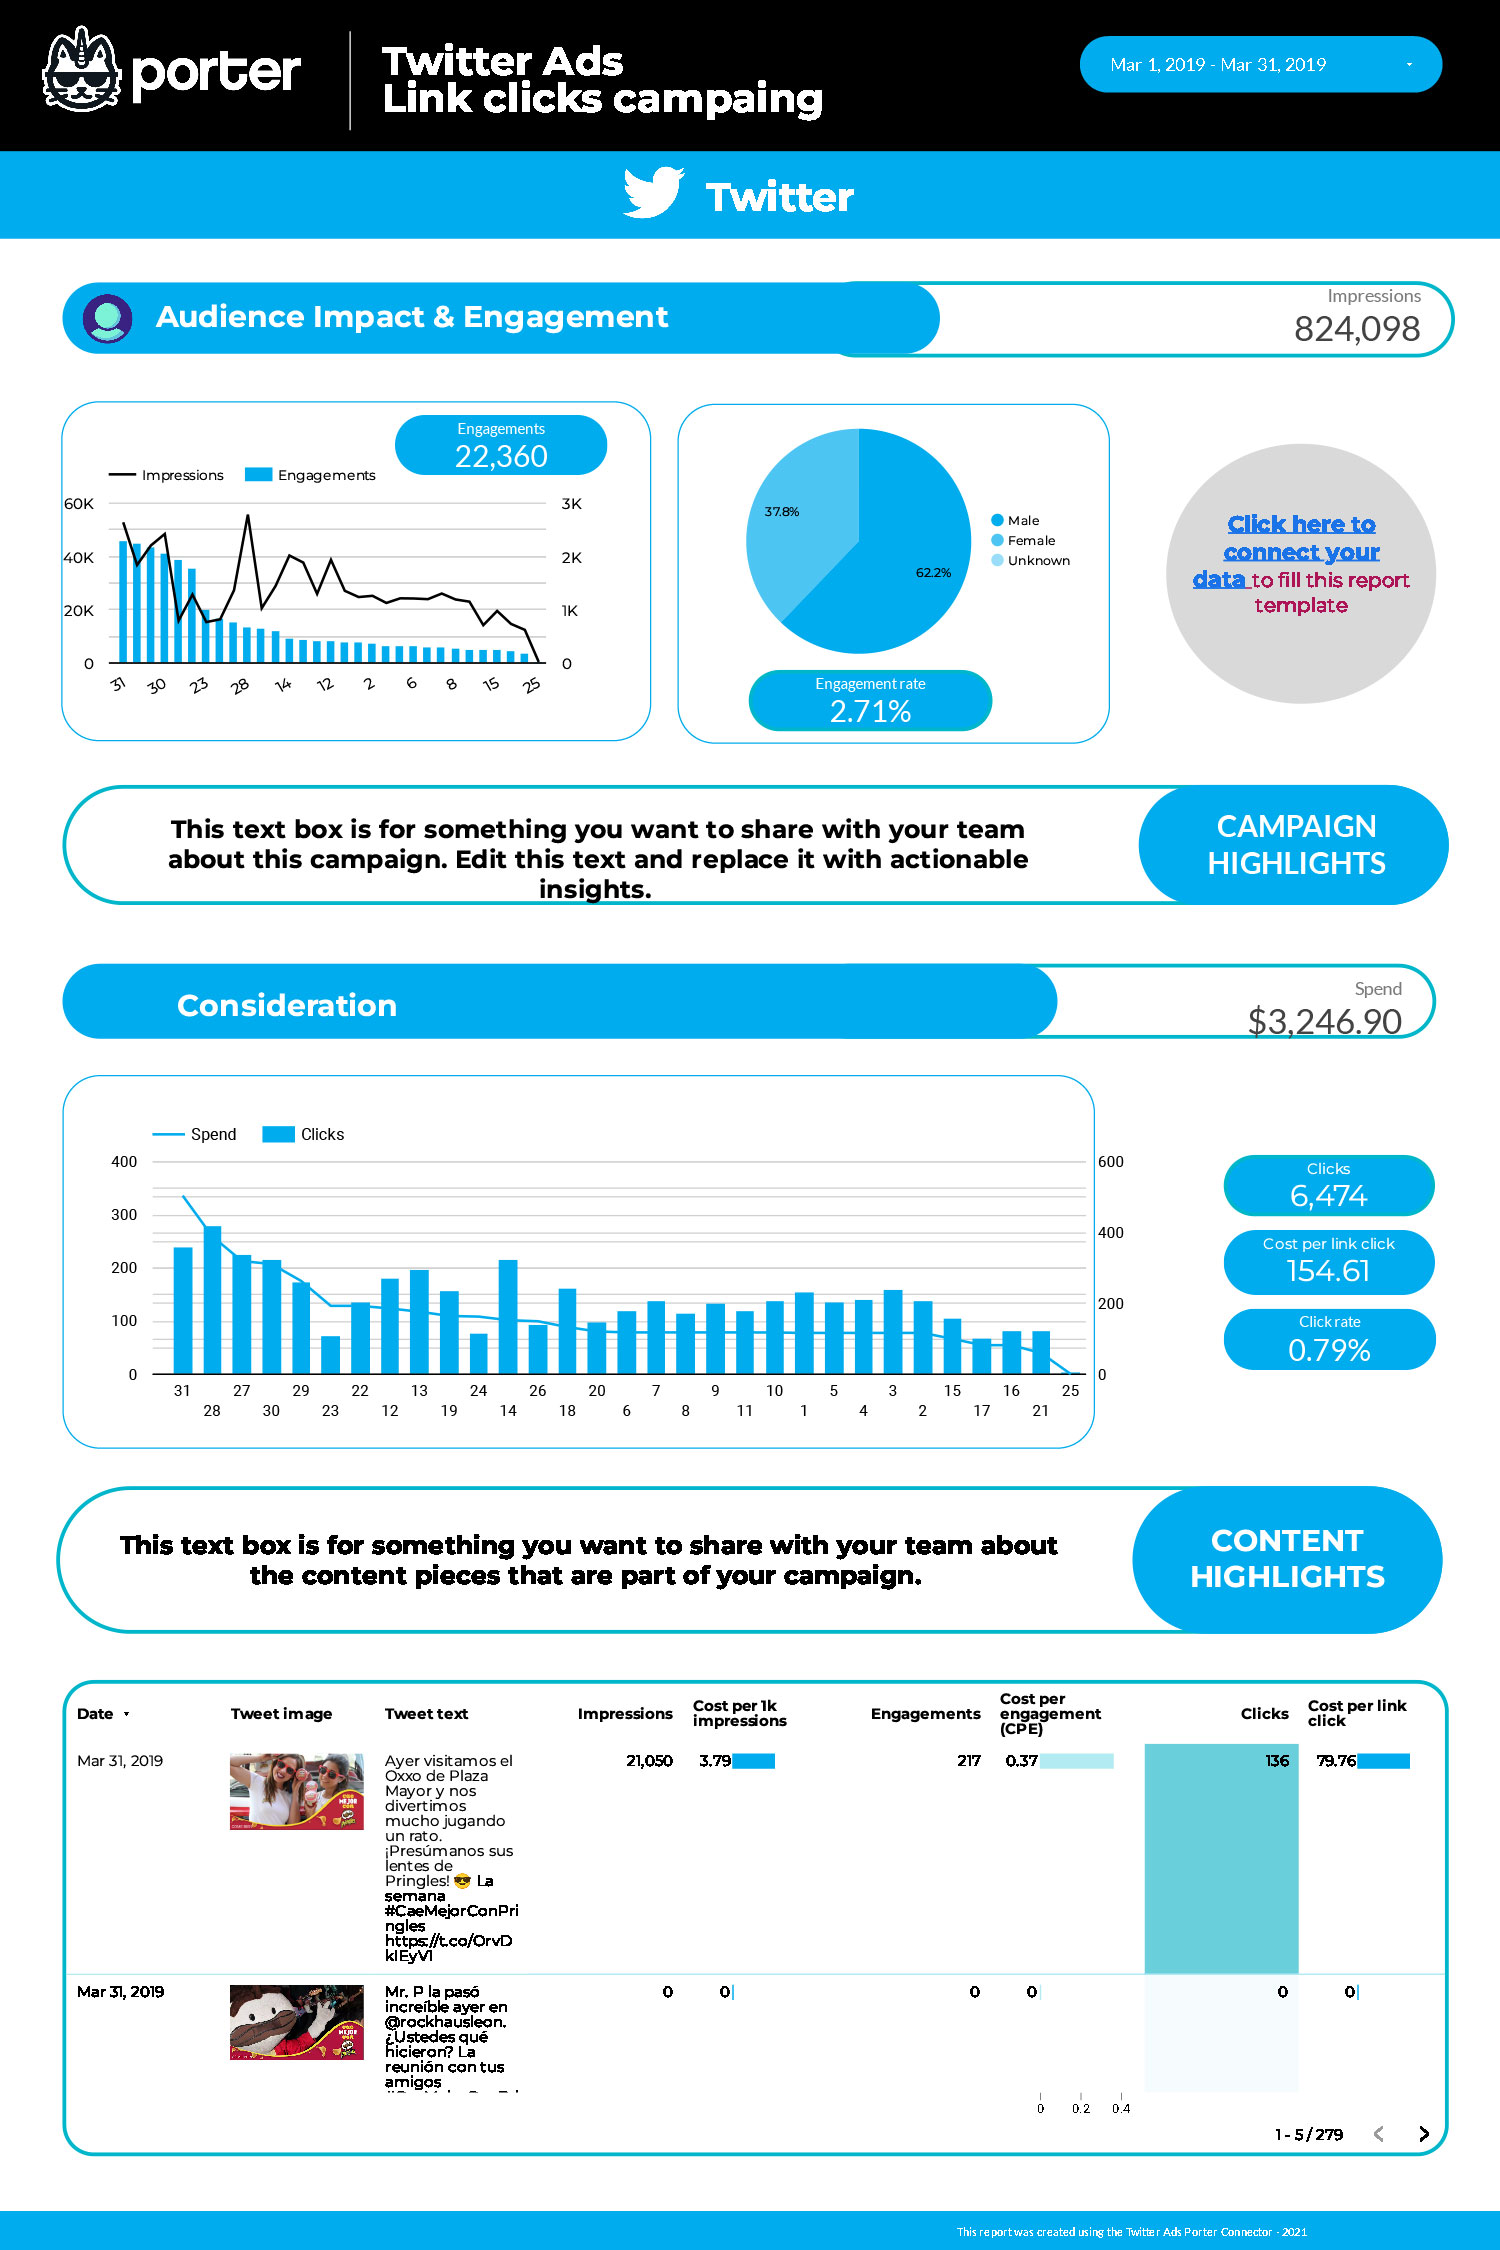
Calculate and report your advertising spend on Twitter. Understand the impact of your Twitter Ads.
Calculate and report your advertising spend on Twitter. Understand the impact of your Twitter Ads.
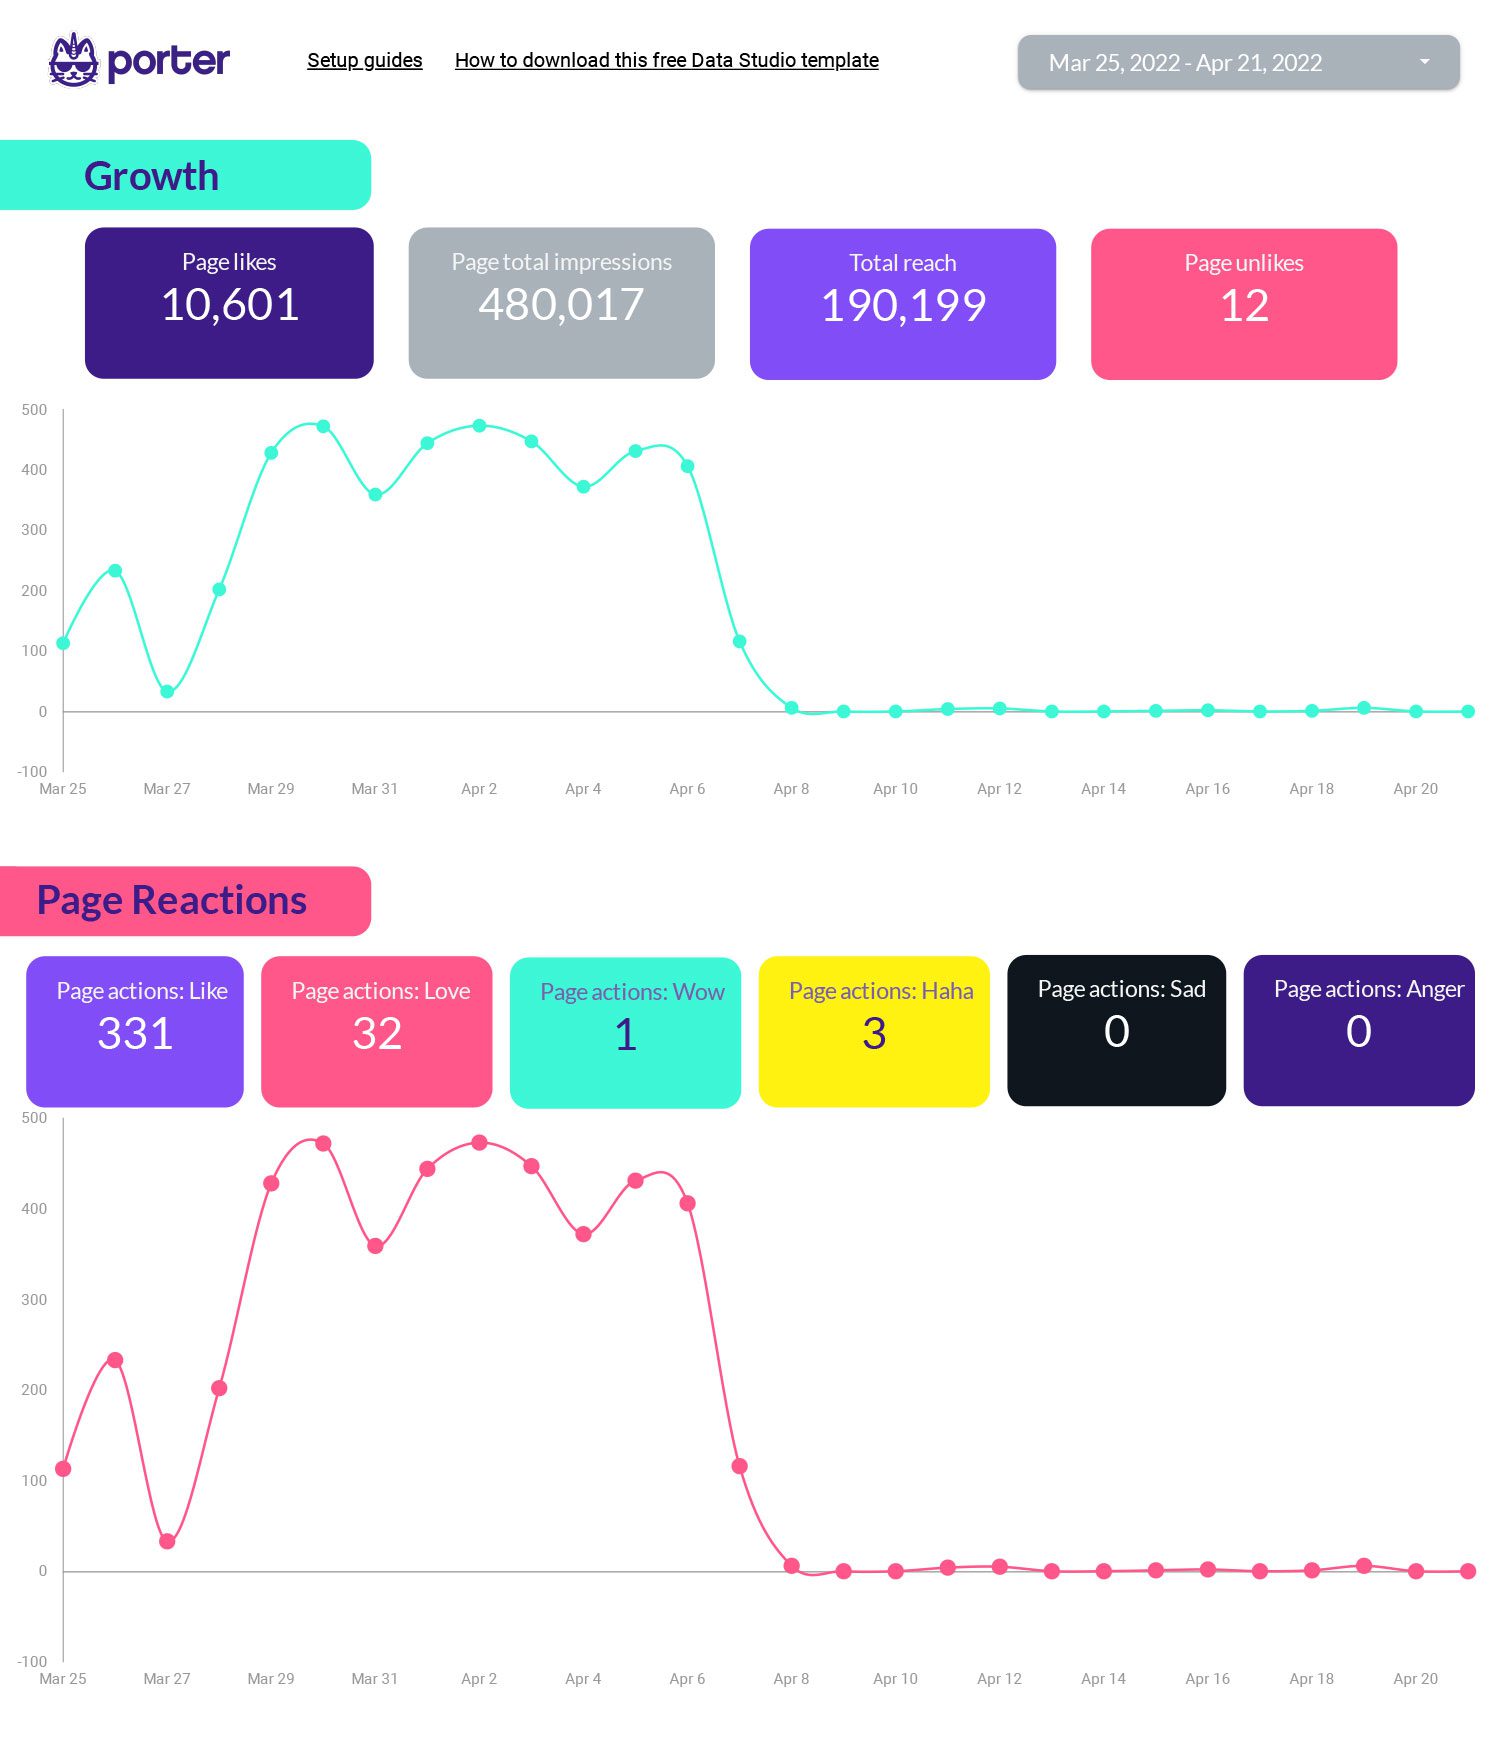
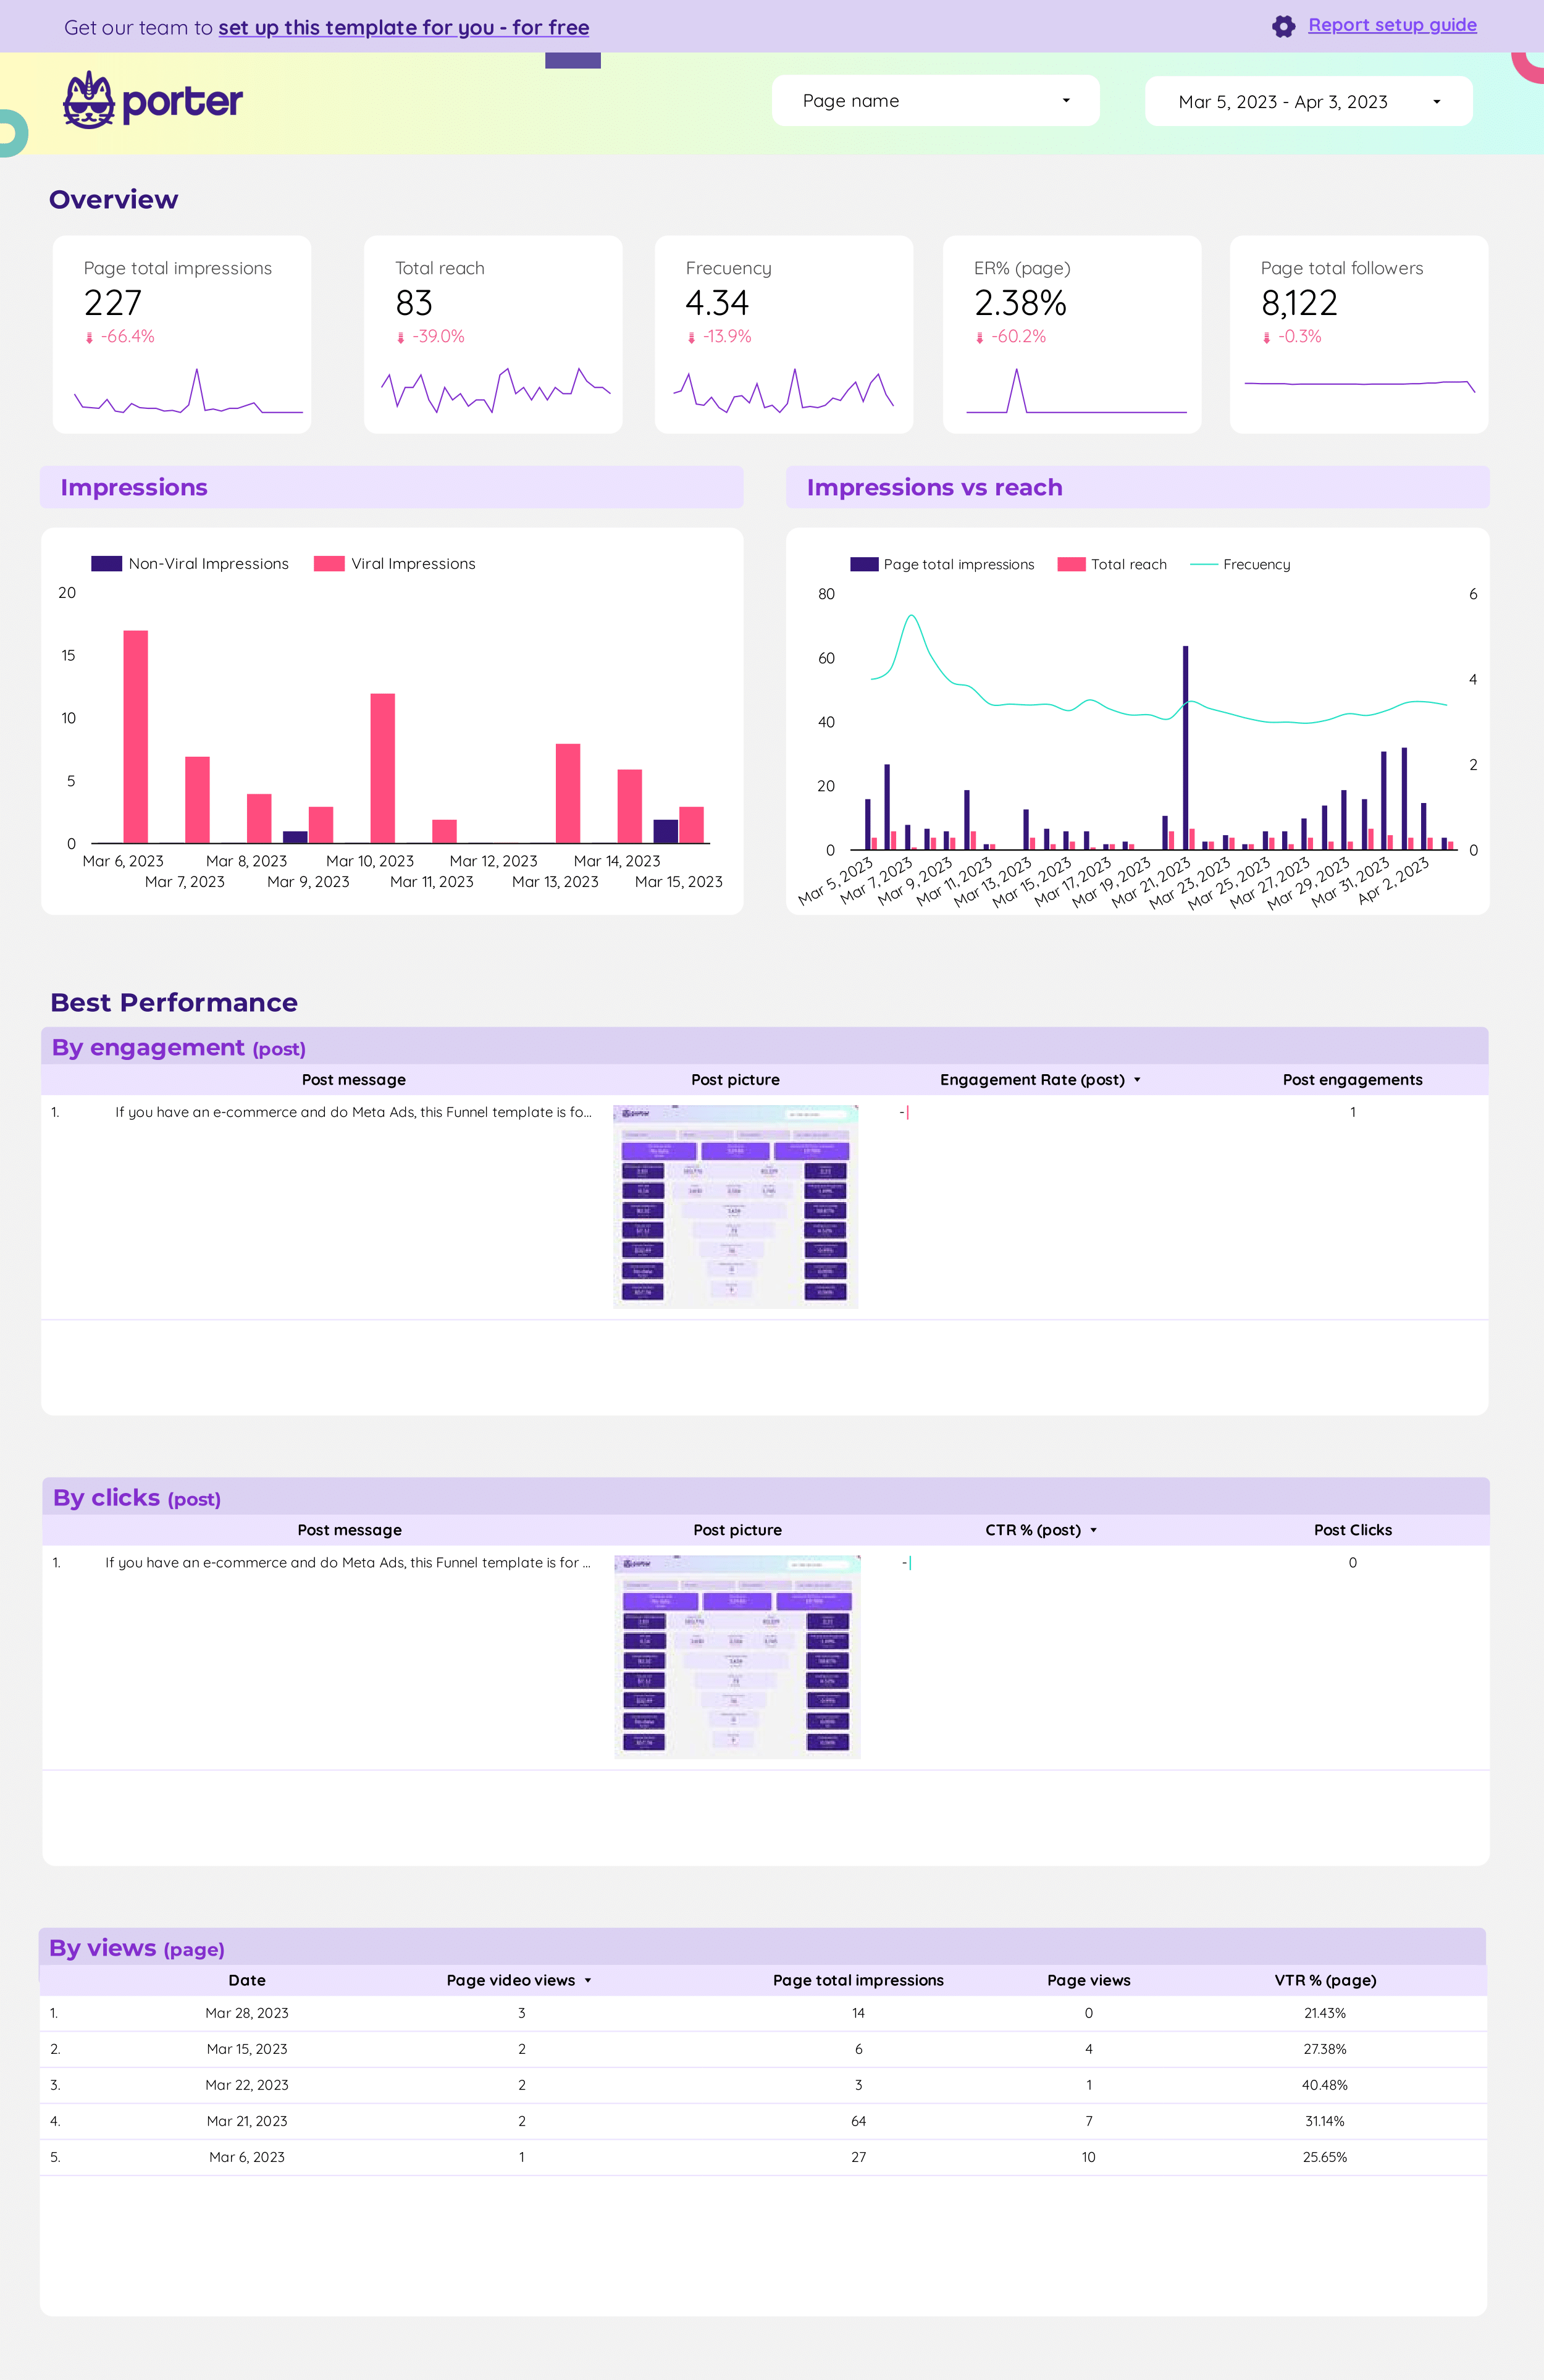
Track your organic efforts on Facebook Insights with this Google Data Studio Template. In just one page track: growth, page likes and reactions and page impressions.
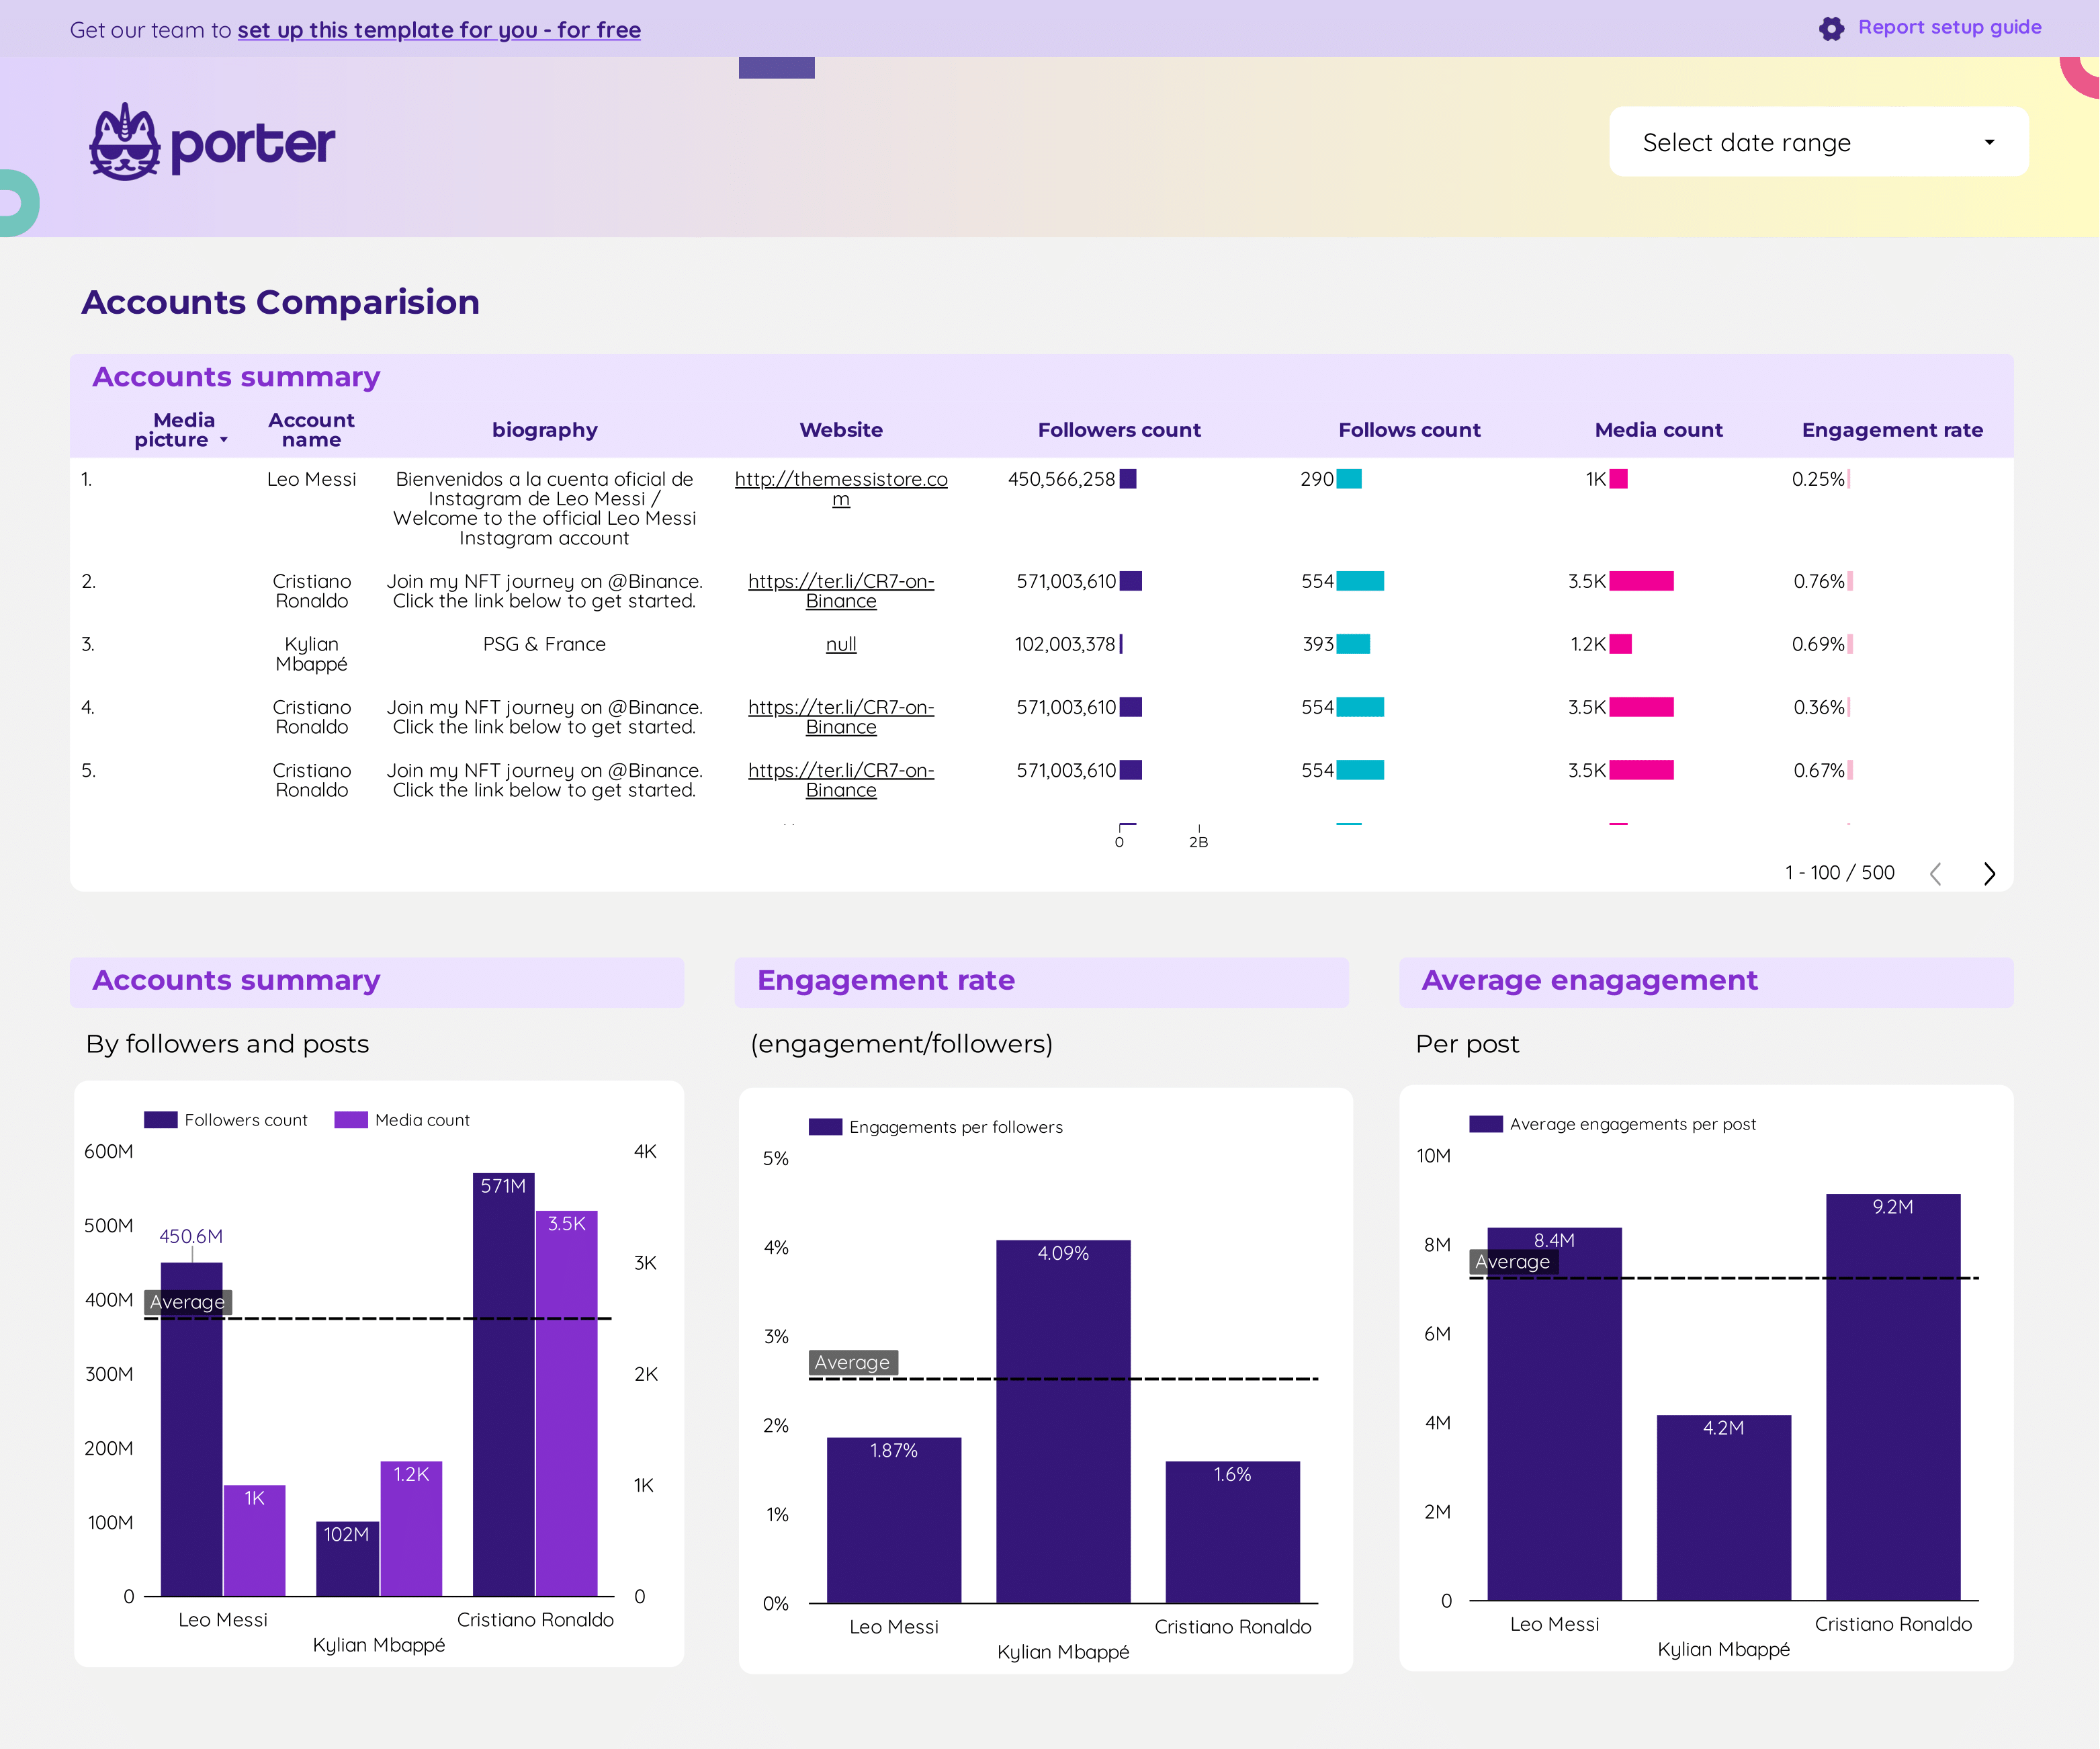
Visualize the Instagram Competitors data with the Instagram Public Data Porter Connector and enhance your strategy.
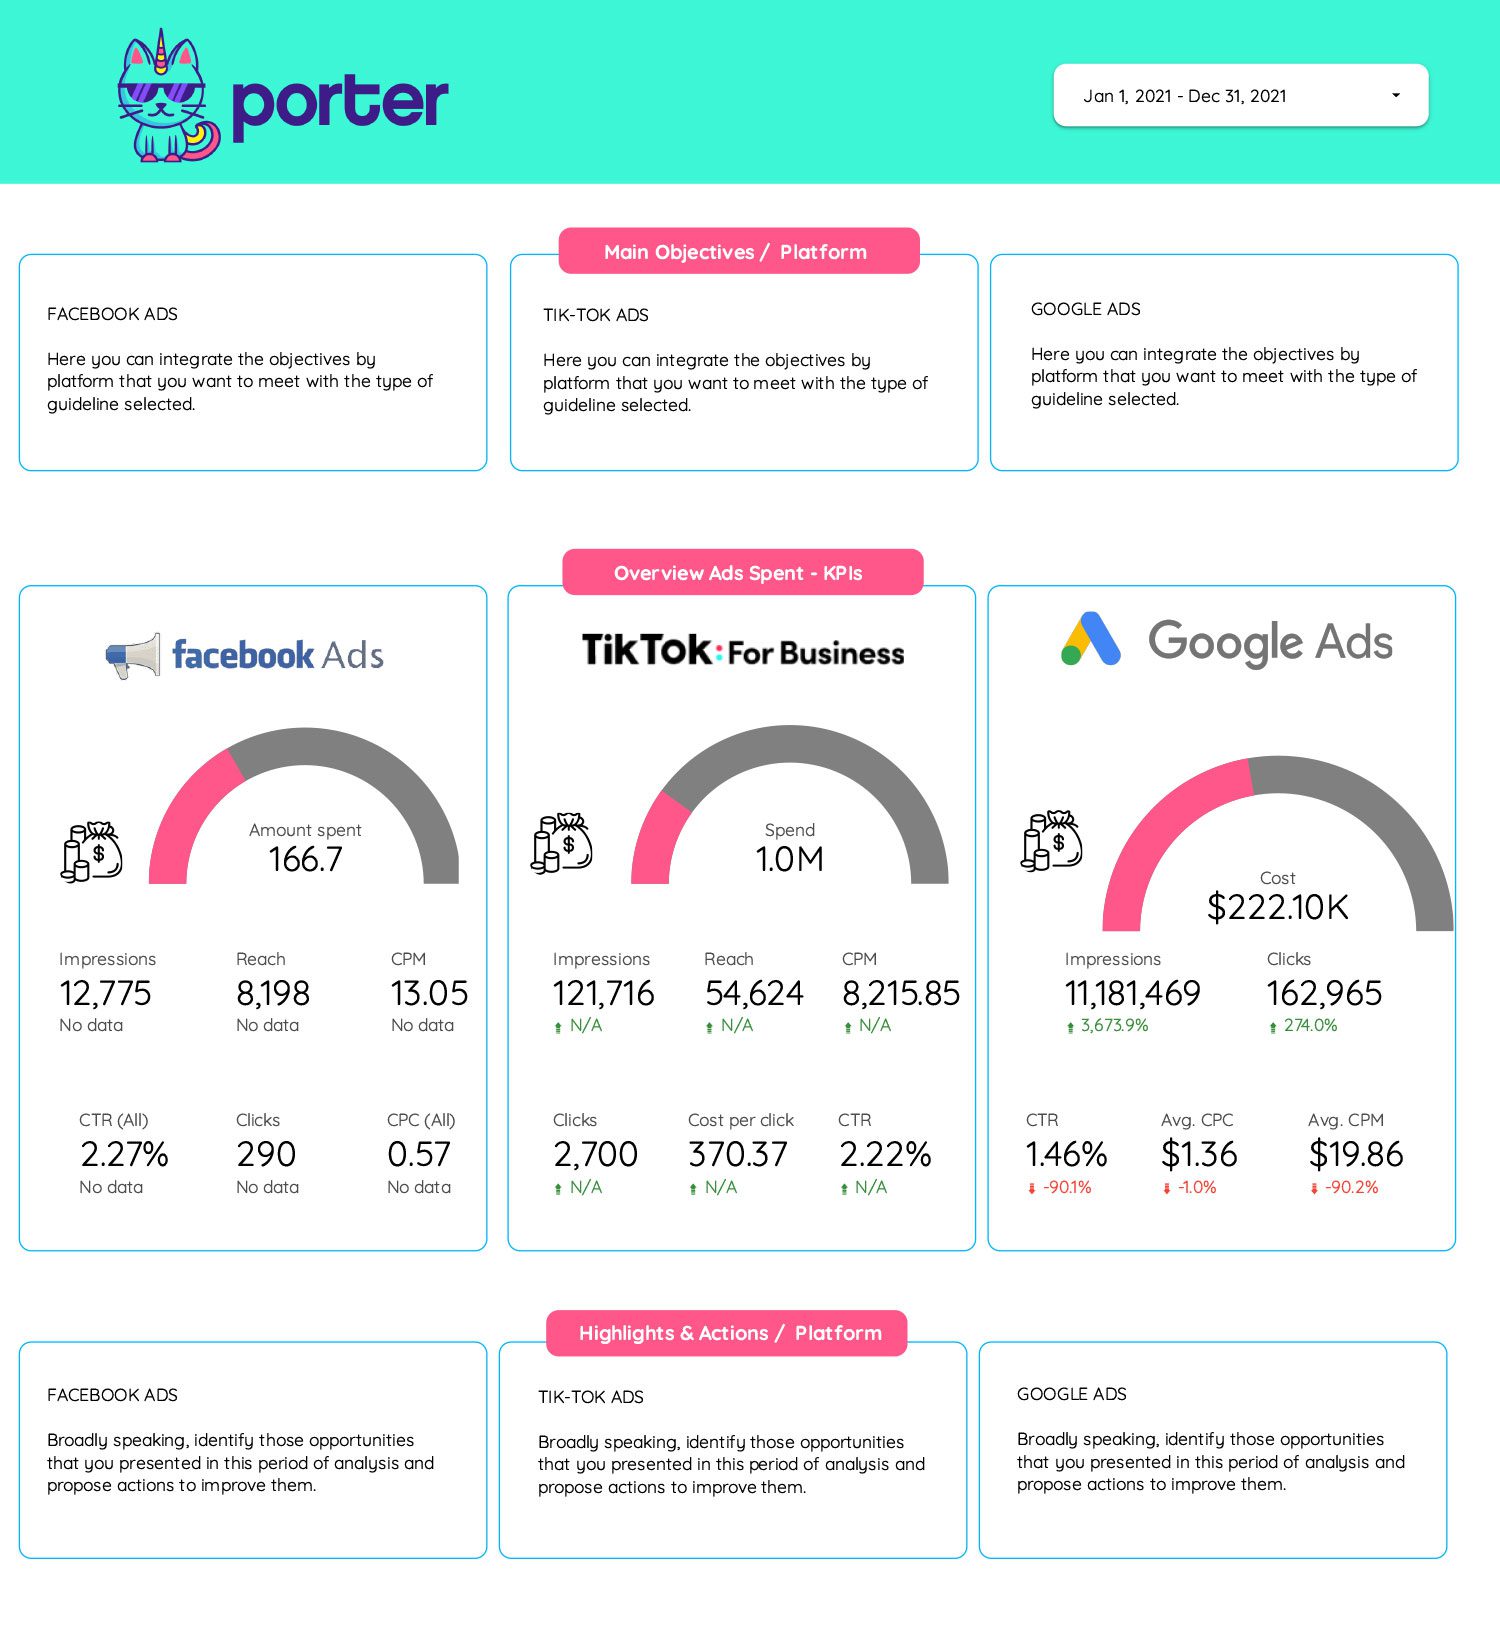
This integrated dashboard pulls your data from different paid media platforms such as Facebook Ads, Google Ads, Tiktok Ads, and Twitter ads. Track your website traffic performance and start distributing your budgets more efficiently.
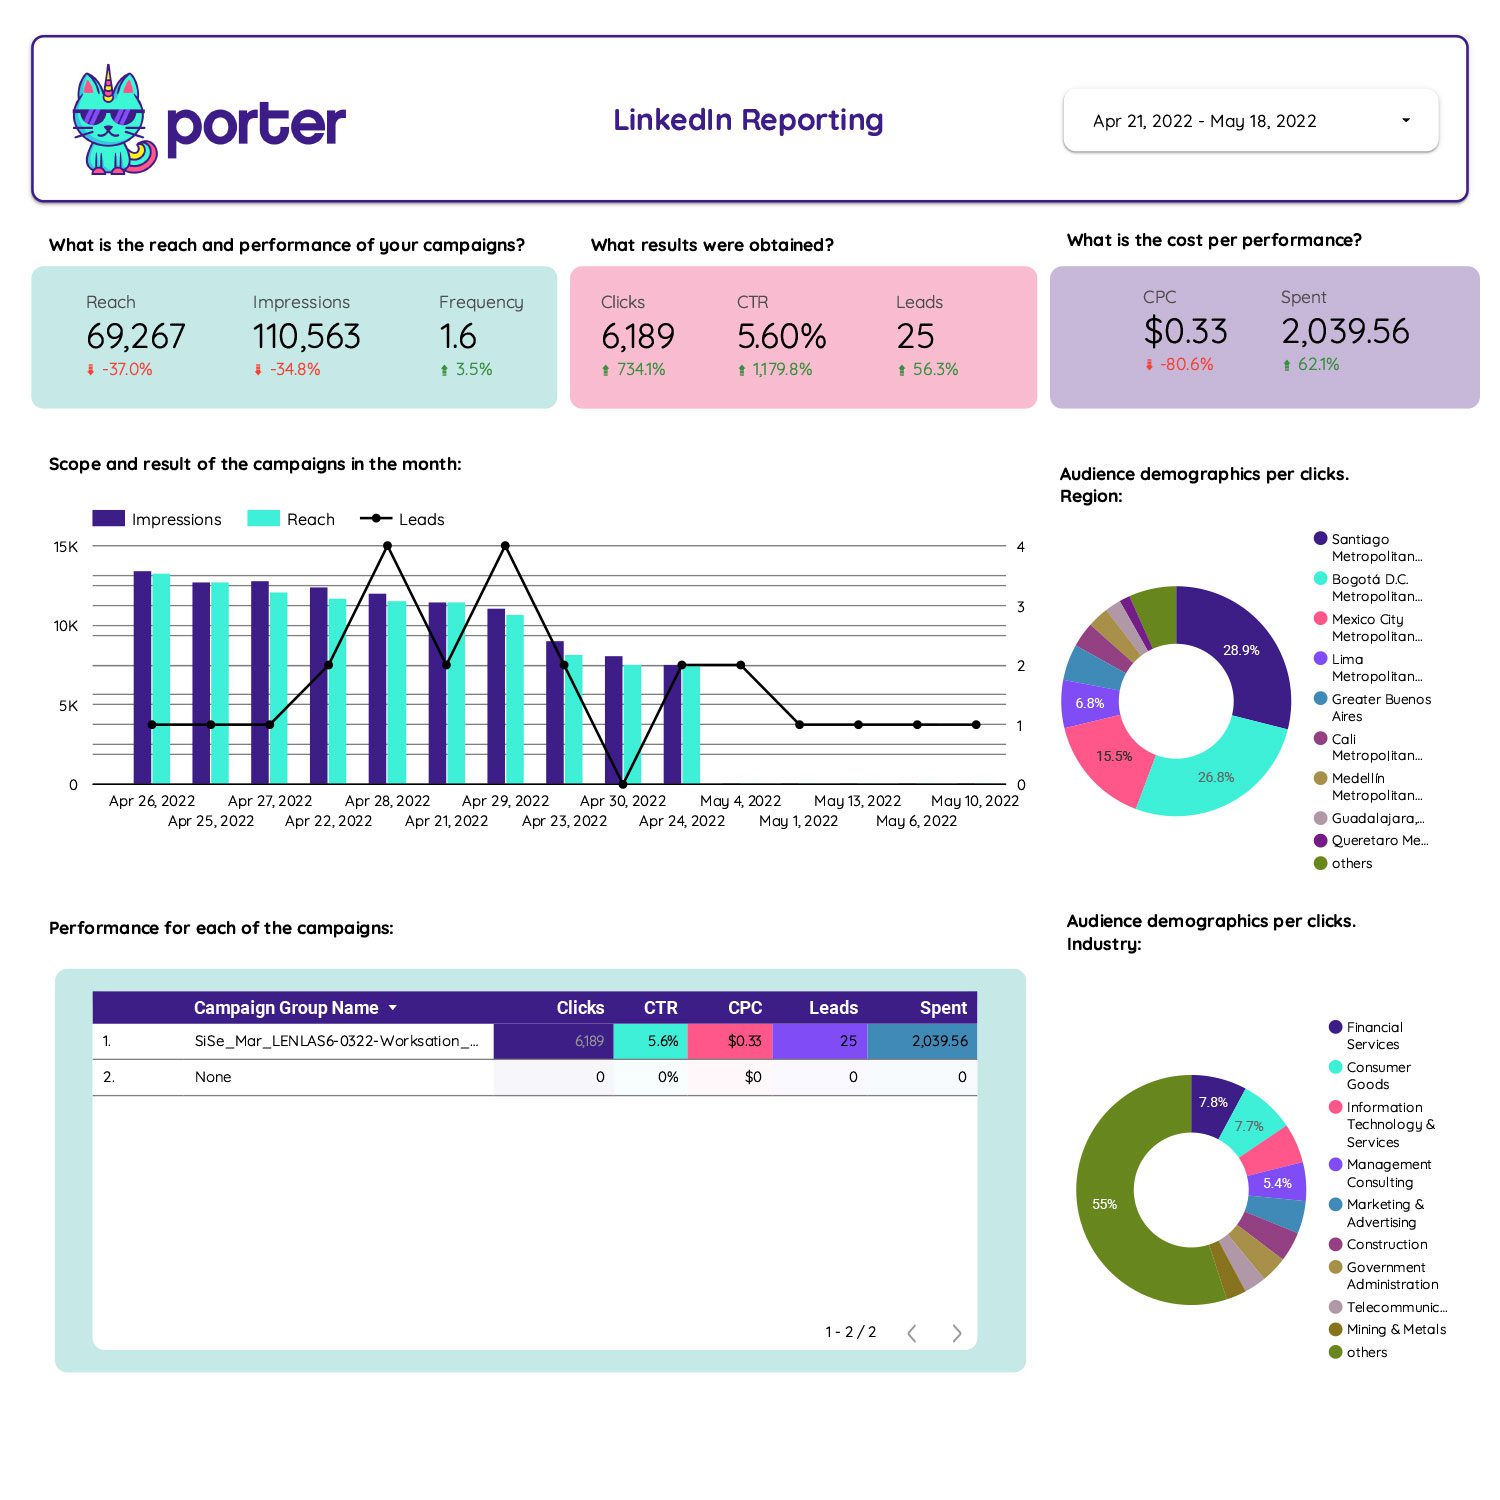
We created a free analytics report template to help you analyze and better understand your account. Simply connect your LinkedIn Pages and LinkedIn Ads account to Google Data Studio, and the template will do the rest!
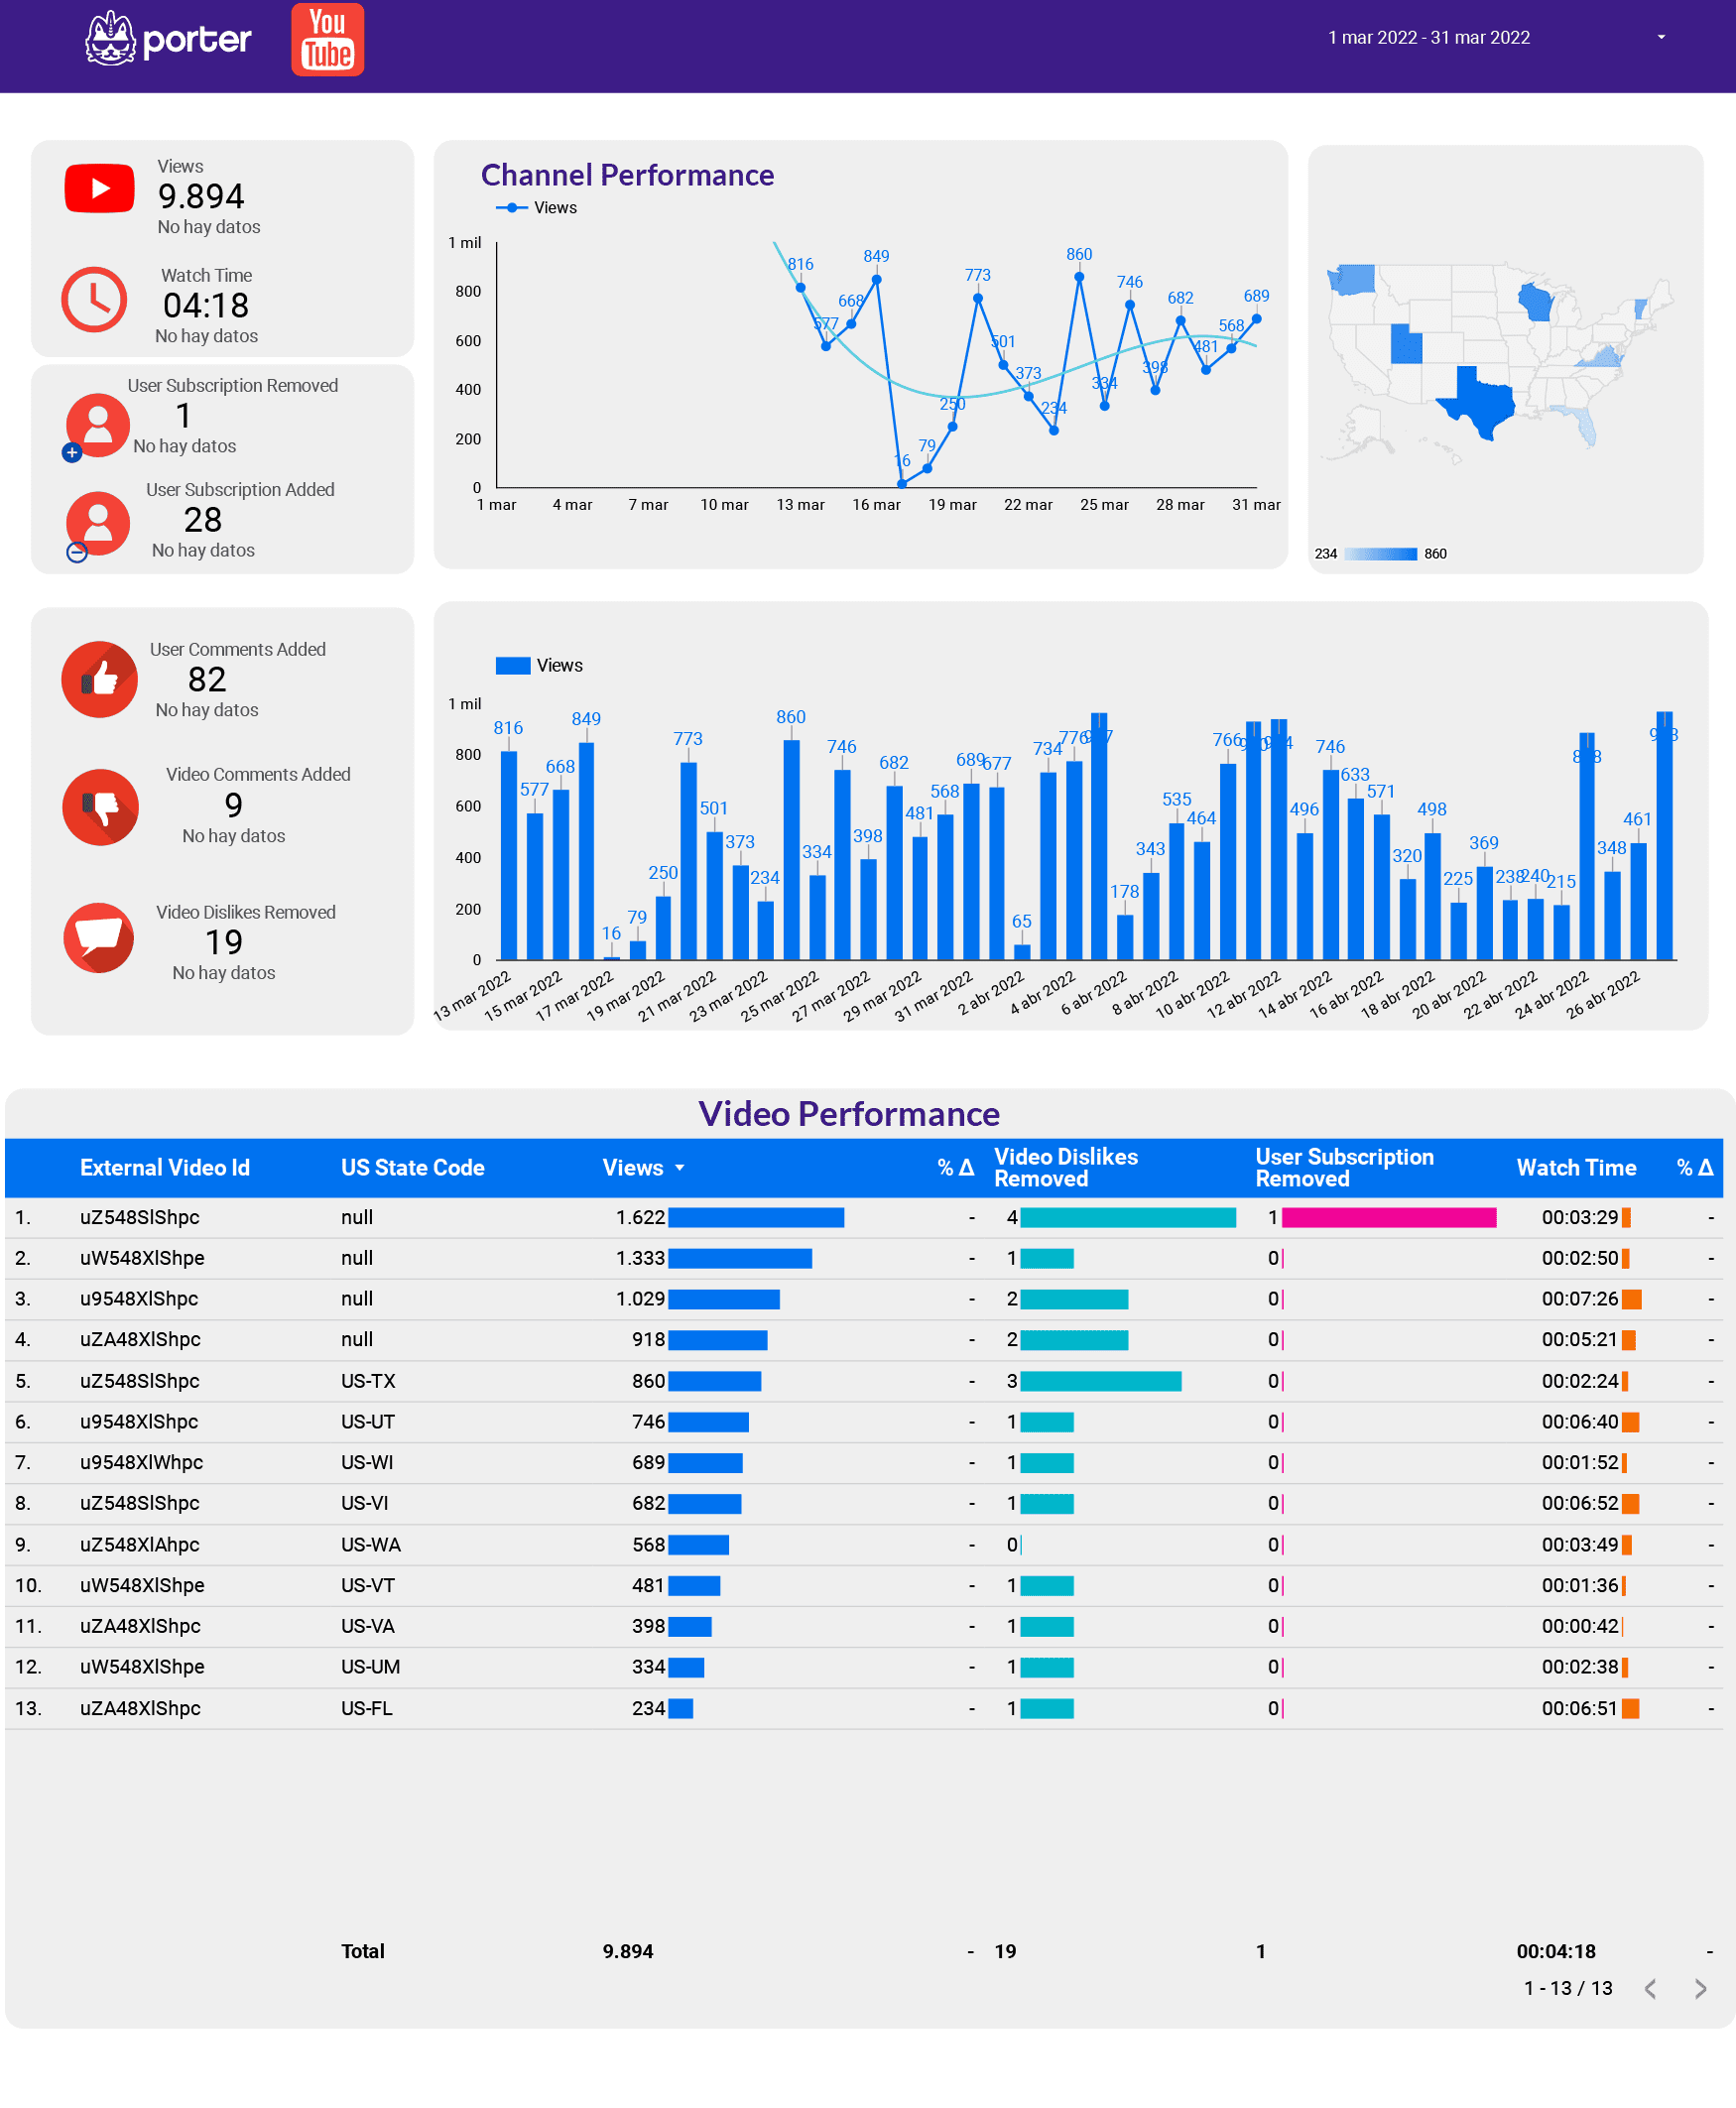
Visualize in a single page your Youtube channel analytics and video performance using Data Studio. Compare your videos, and understand your growth and trends in minutes.
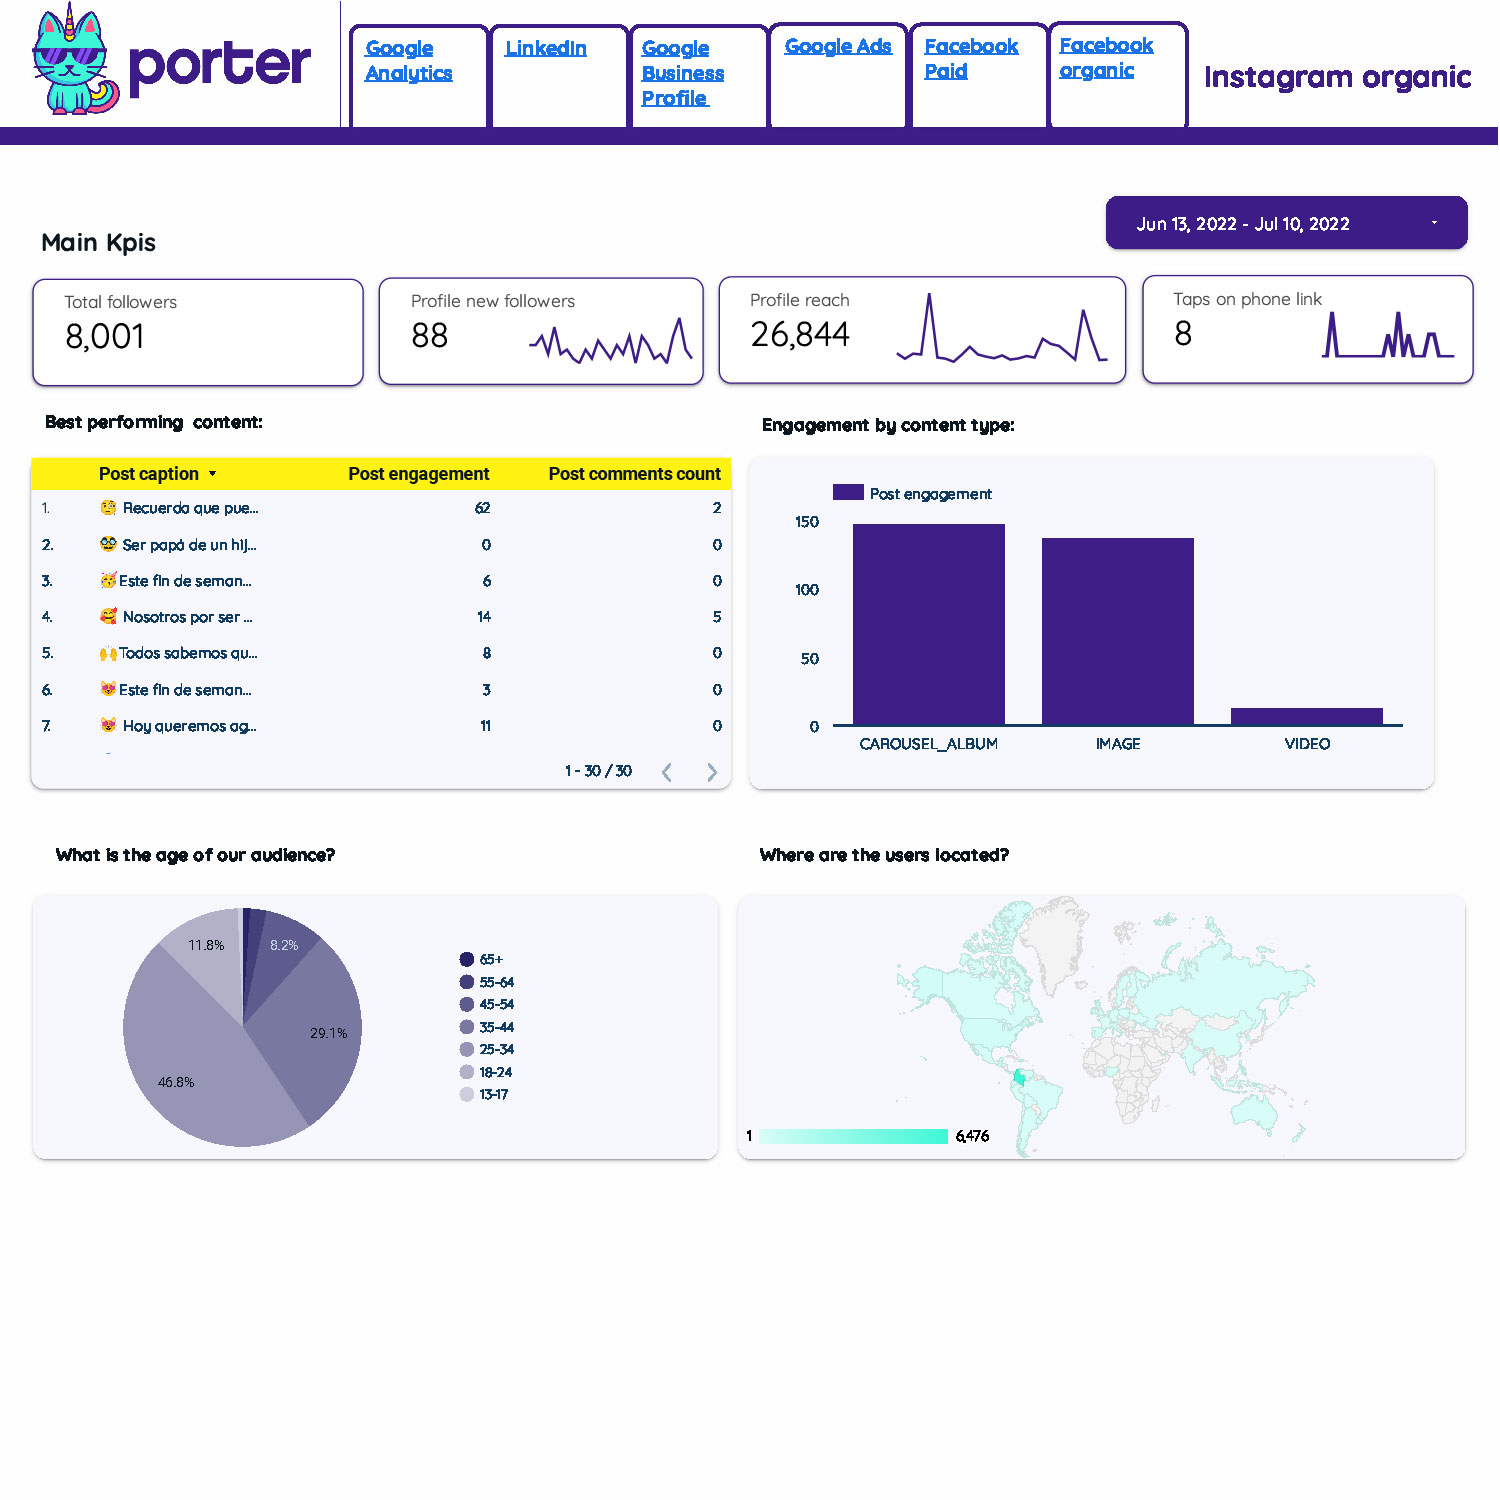
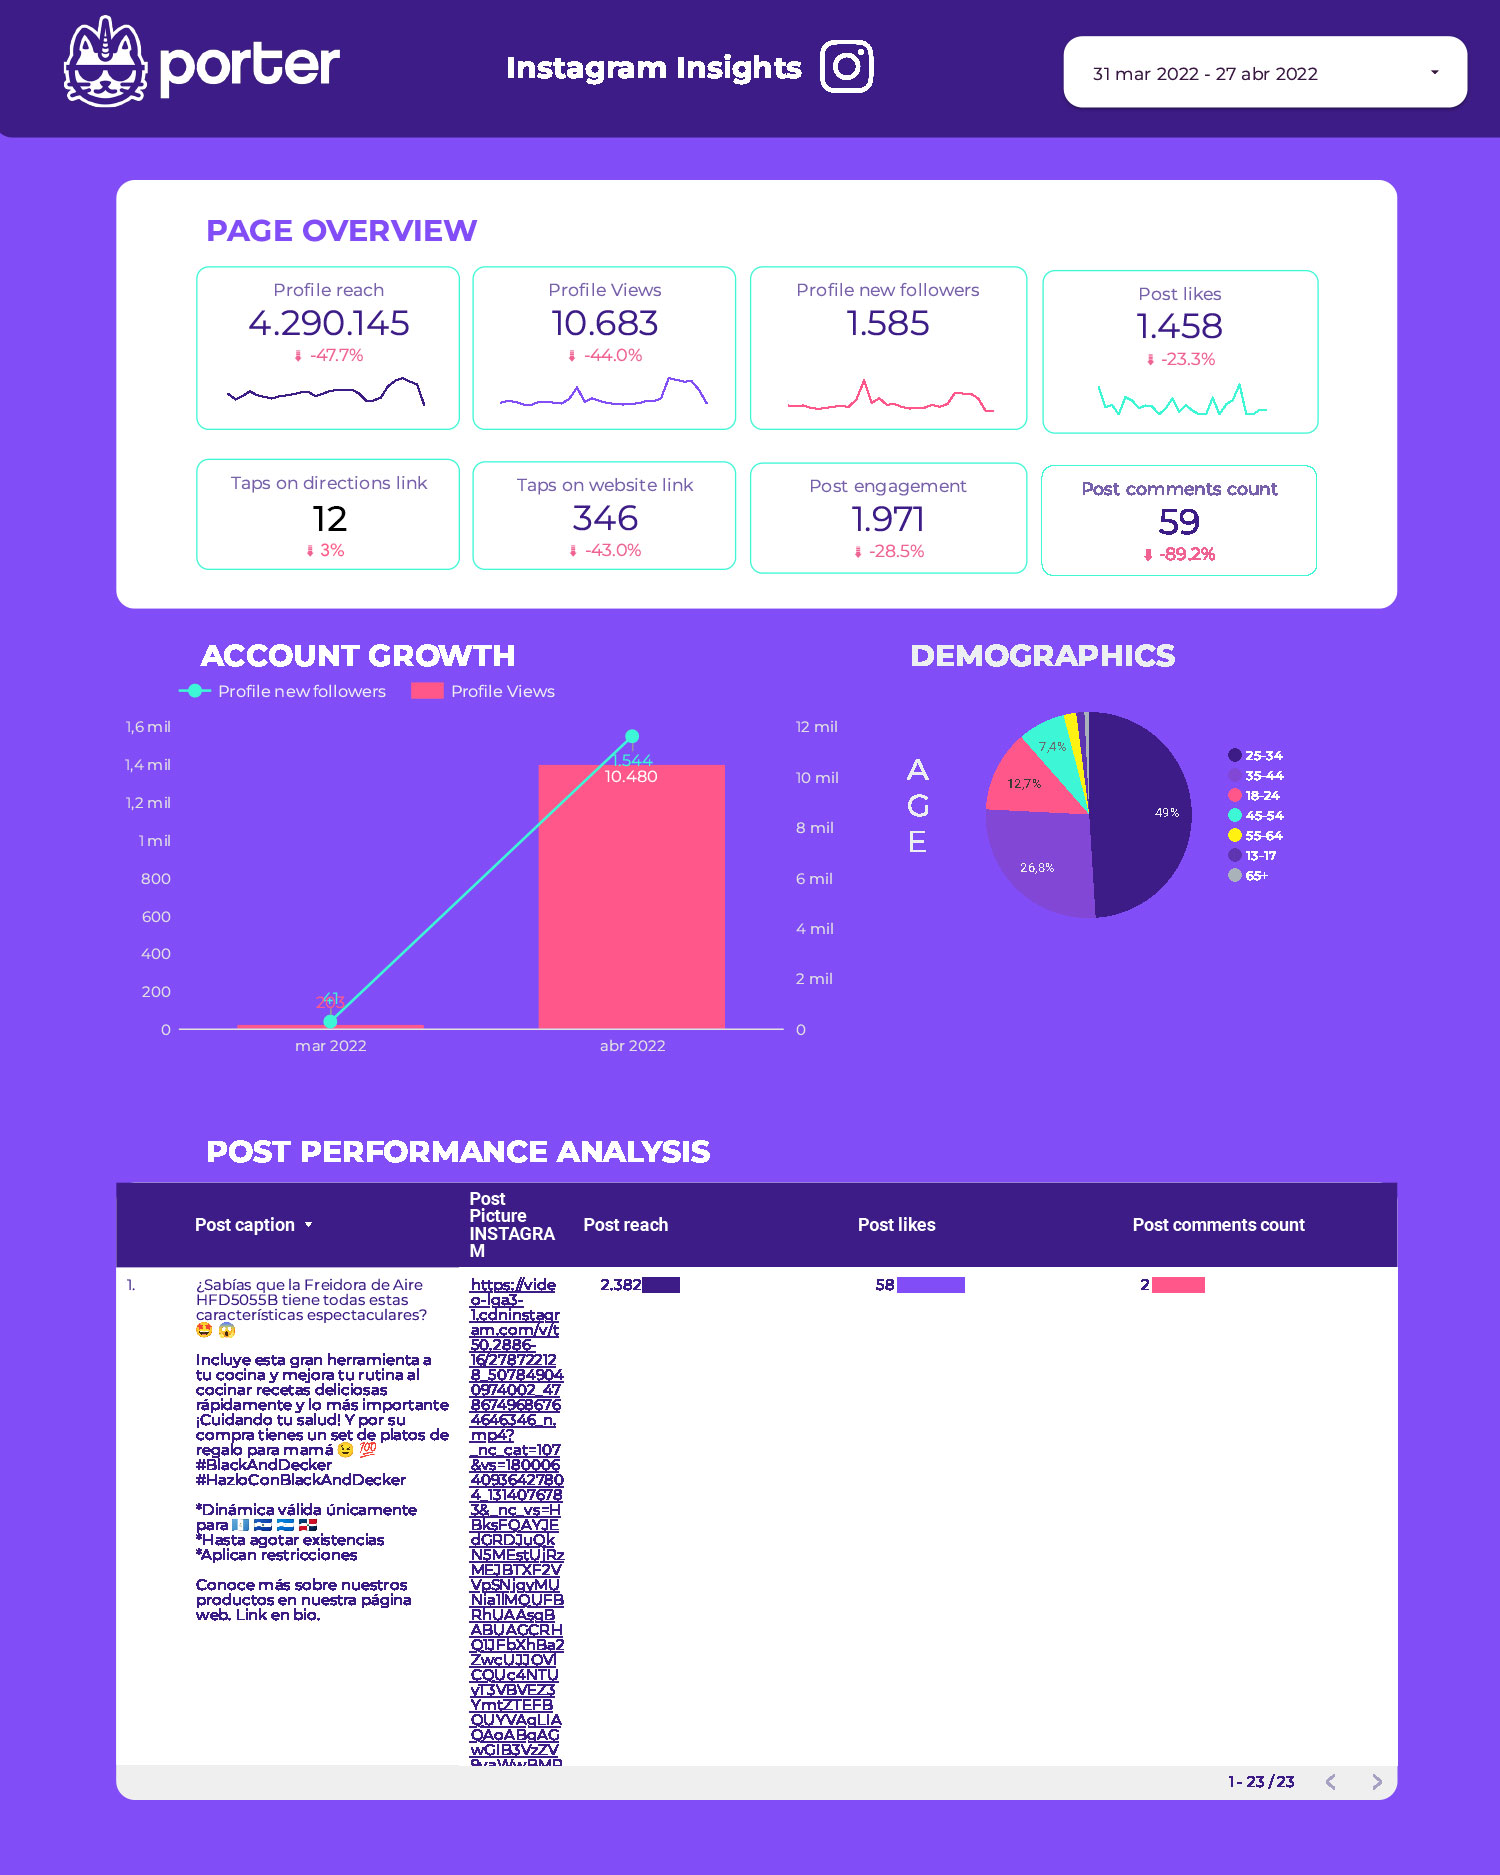
Do you want to get a deeper understanding of your Instagram organic results? Download this template and visualize your data at an account and post level.
Visualize your Facebook Insights and Instagram Insights performance. Understand what’s driving your page growth, your best posts and your audience.
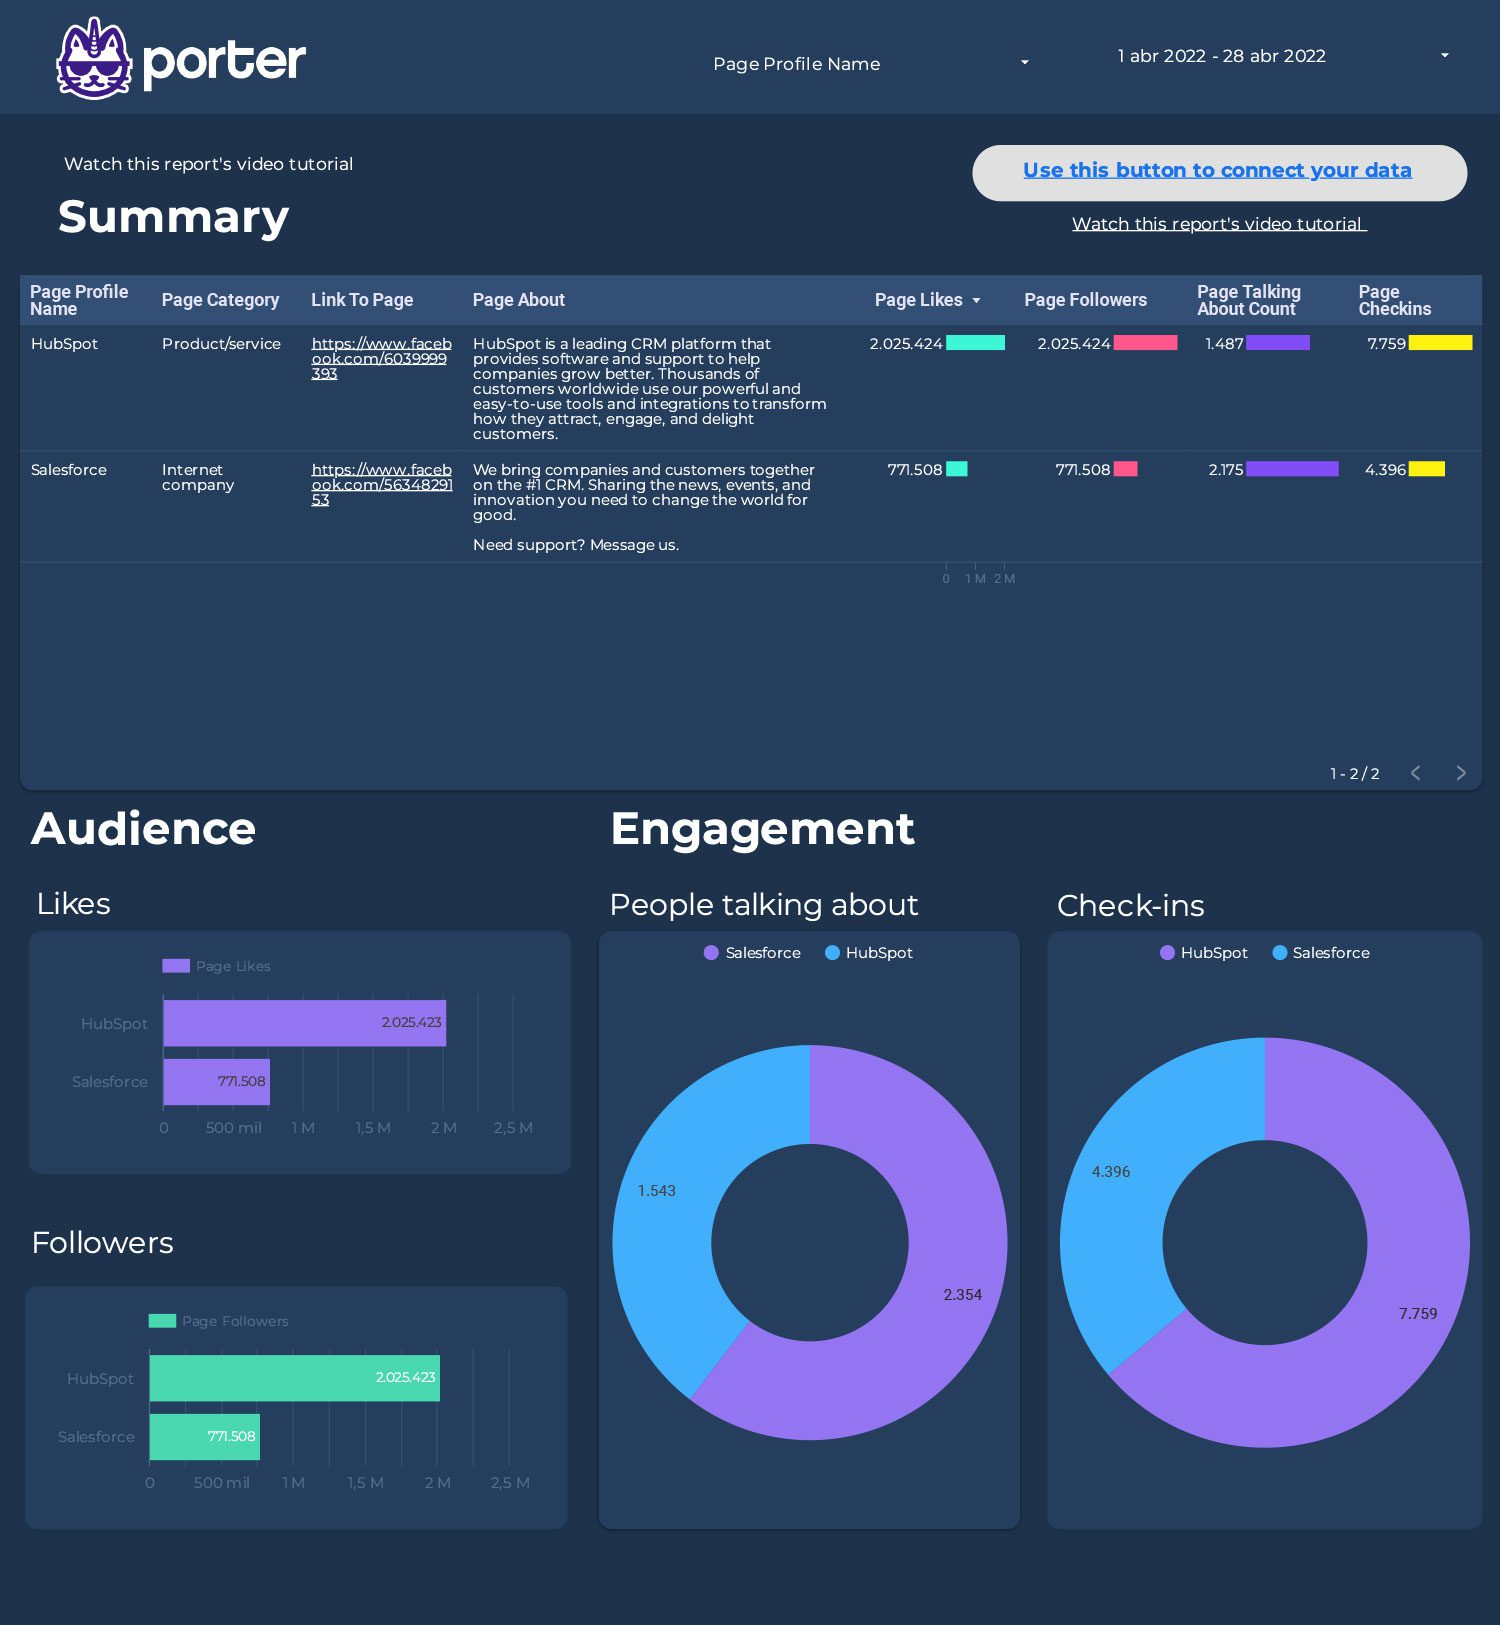
Download this visualization to track your competitors’ Facebook Pages. Pull and visualize data all for FREE with our Porter Facebook Competitors connector.
Automate your client and agency reporting.
Google Analytics, Google Ads, Facebook Ads, Google Search Console, Instagram, and Youtube—all in a single report. It’s free
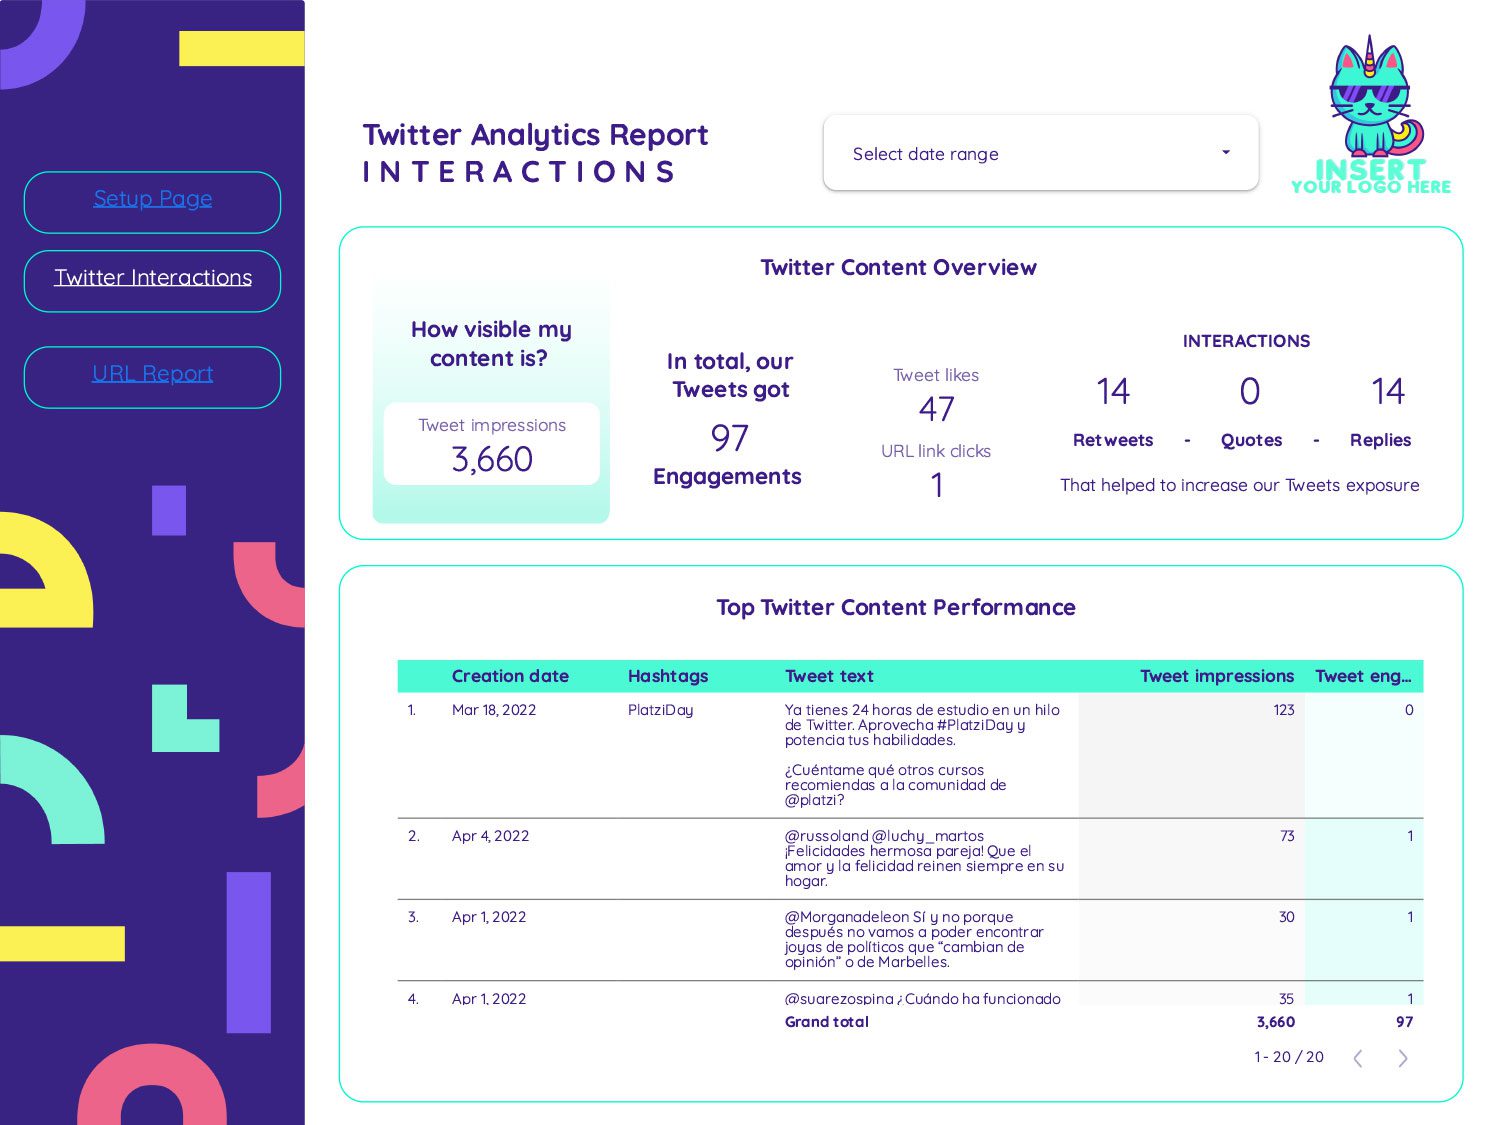
We created a free Twitter analytics report template to help you analyze and better understand your account. Simply connect your Twitter account to Google Data Studio, and the template will do the rest!
This is the most comprehensive Facebook Insights report template you can find across the internet. It is for free and provides you with a lot more data than most users expect.
Download this TikTok Ads report template for Google Data Studio Tottaly free.
Download this LinkedIn Pages Analytics report template template and get insights in your page statistics.
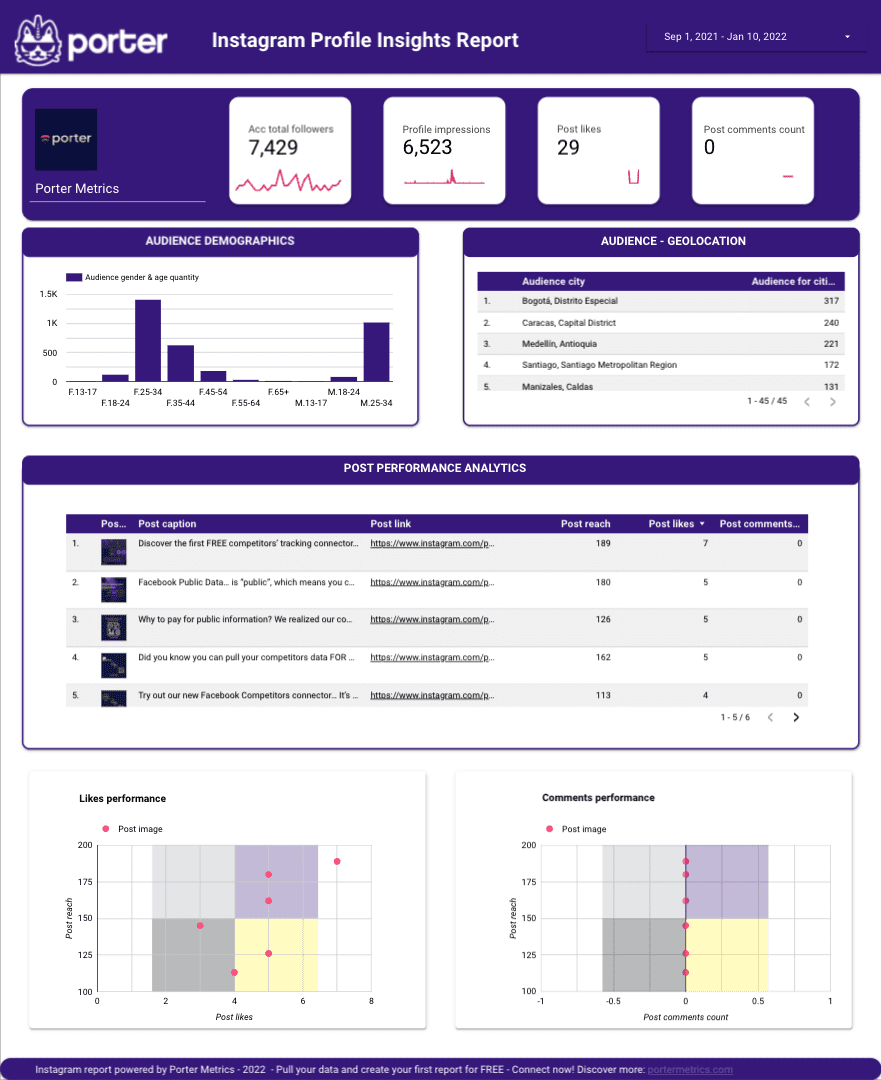
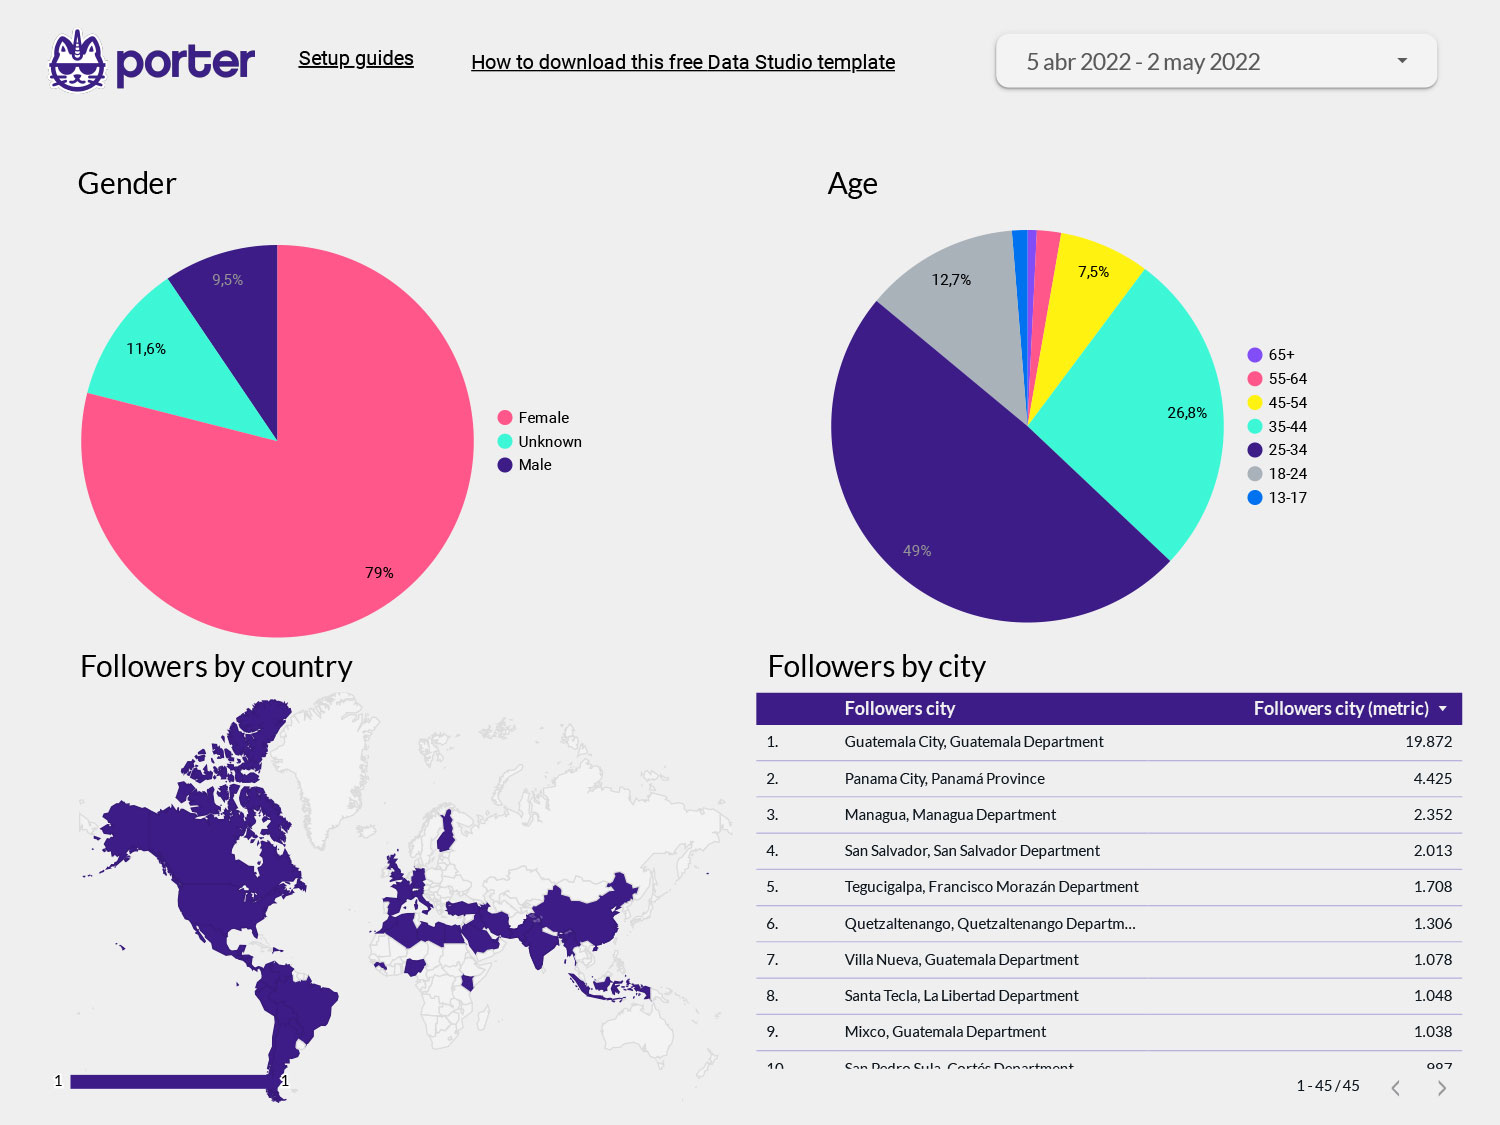
Download this free report template and pull your Instagram page insights. Deliver page impressions, followers, likes, profile trends, demographic, and post insights automatically with the power of Google Data Studio.
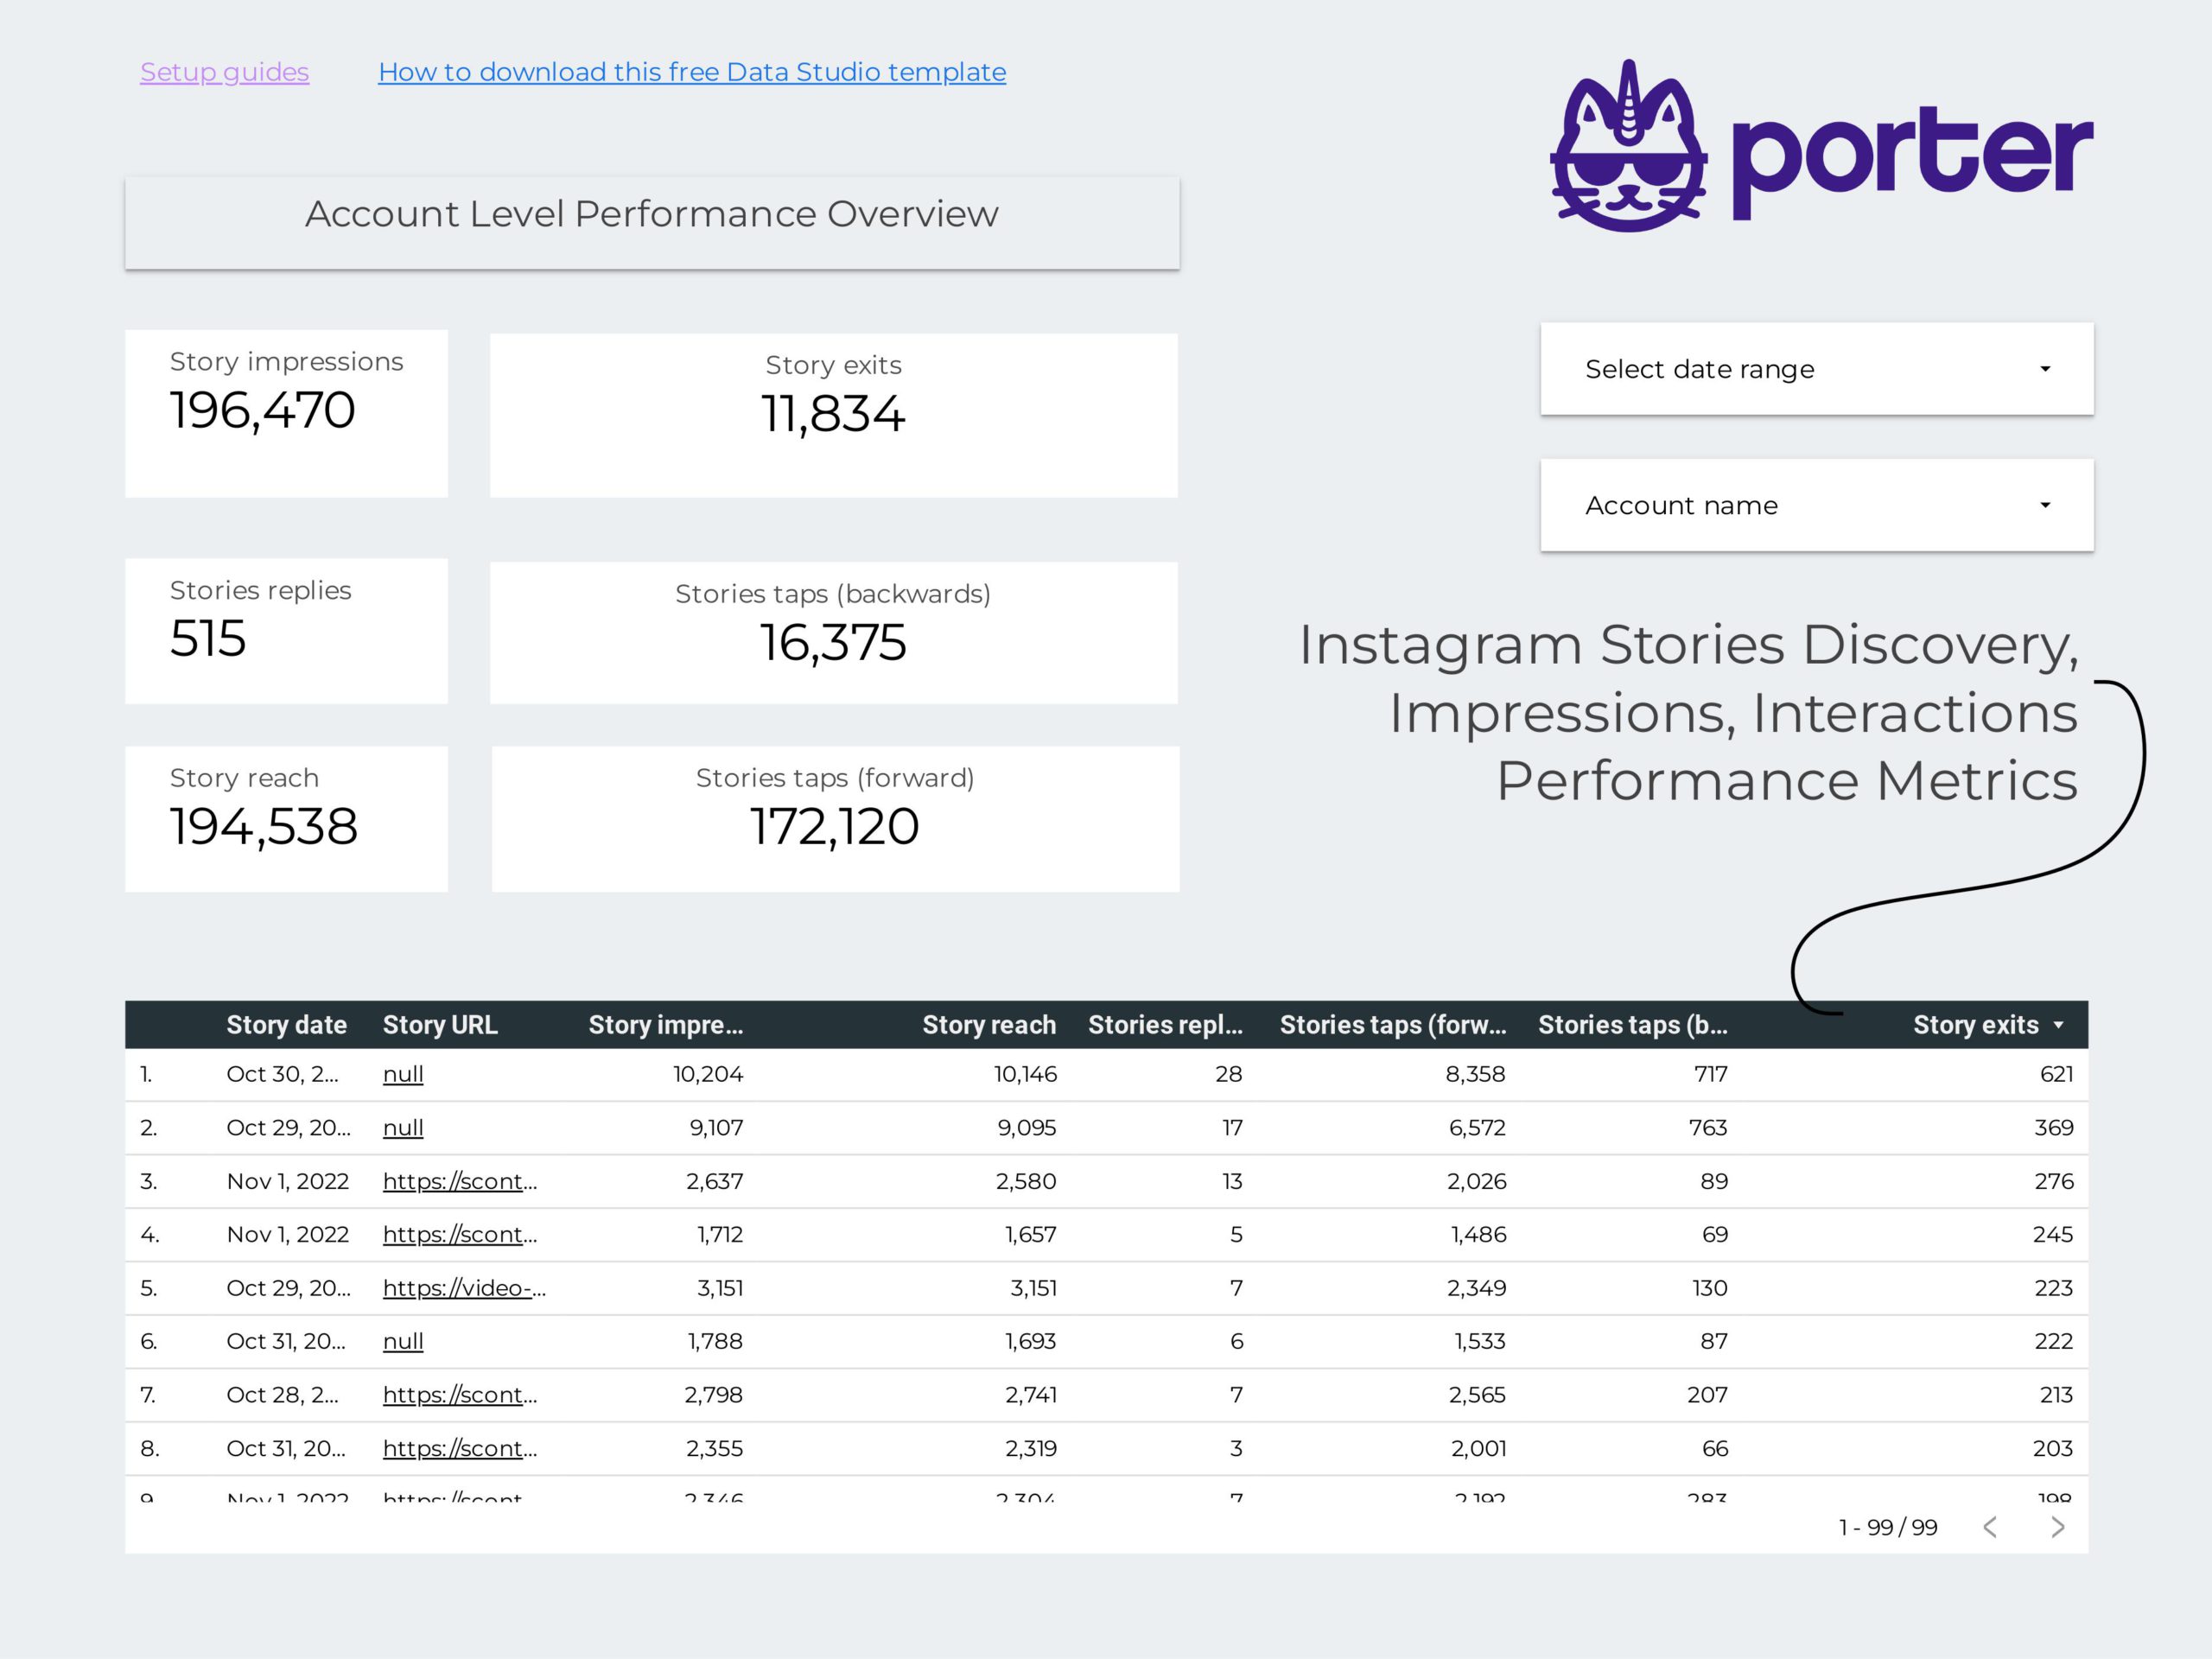
You can now visualise the performance of your Instagram Stories over time without having to take screenshots which was not possible due to API limitations.
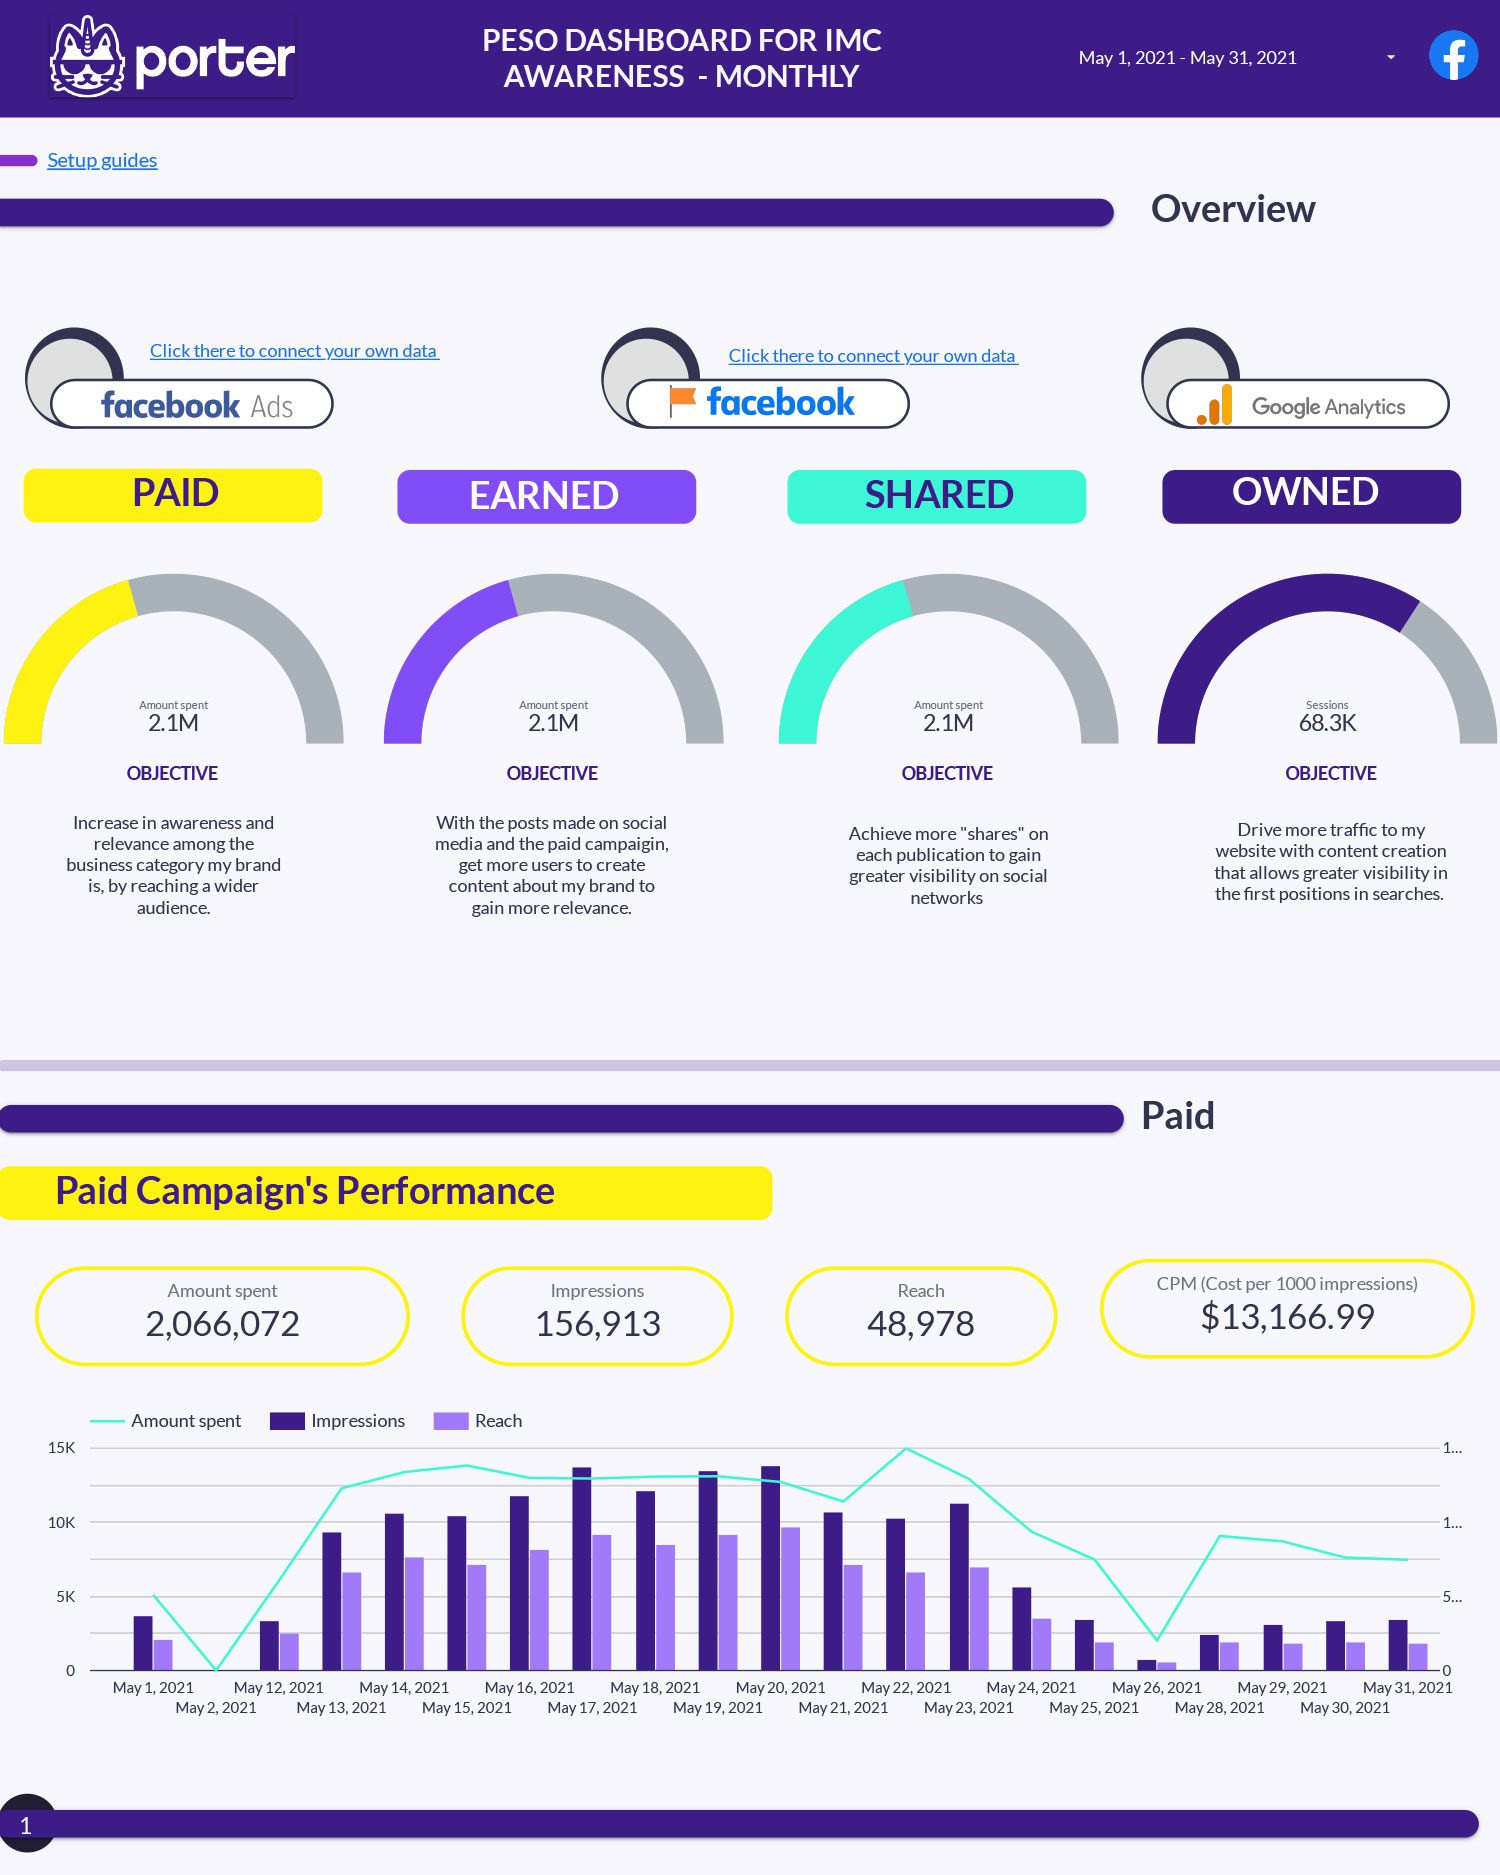
PESO is a media model strategy that stands for Paid, Earned, Shared, and Owned media. Download a free template to report your IMC (Integrated marketing communications) strategy.
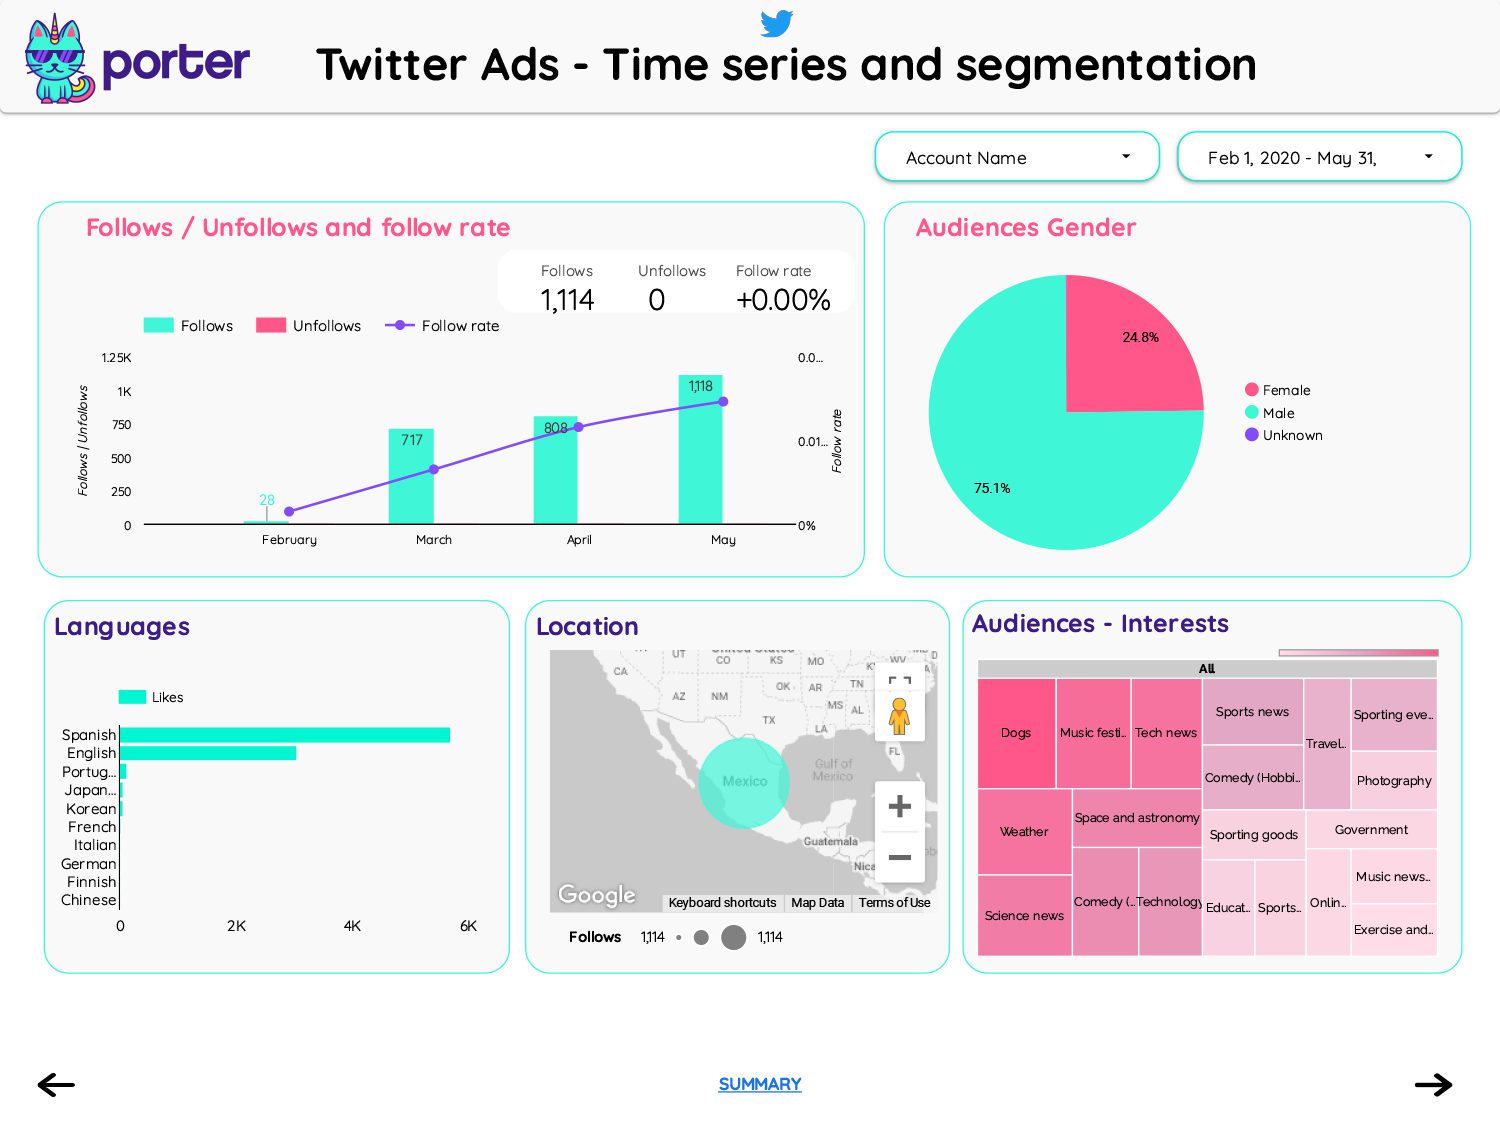
This pre-built template is all you need for free. Use it as a daily, weekly, and monthly Twitter Ads analytics reporting.
Use this Facebook Ads report template to display your key metrics in an interactive dashboard, monitor your Facebook Ads campaigns, track your performance, and share the results with your team or clients.
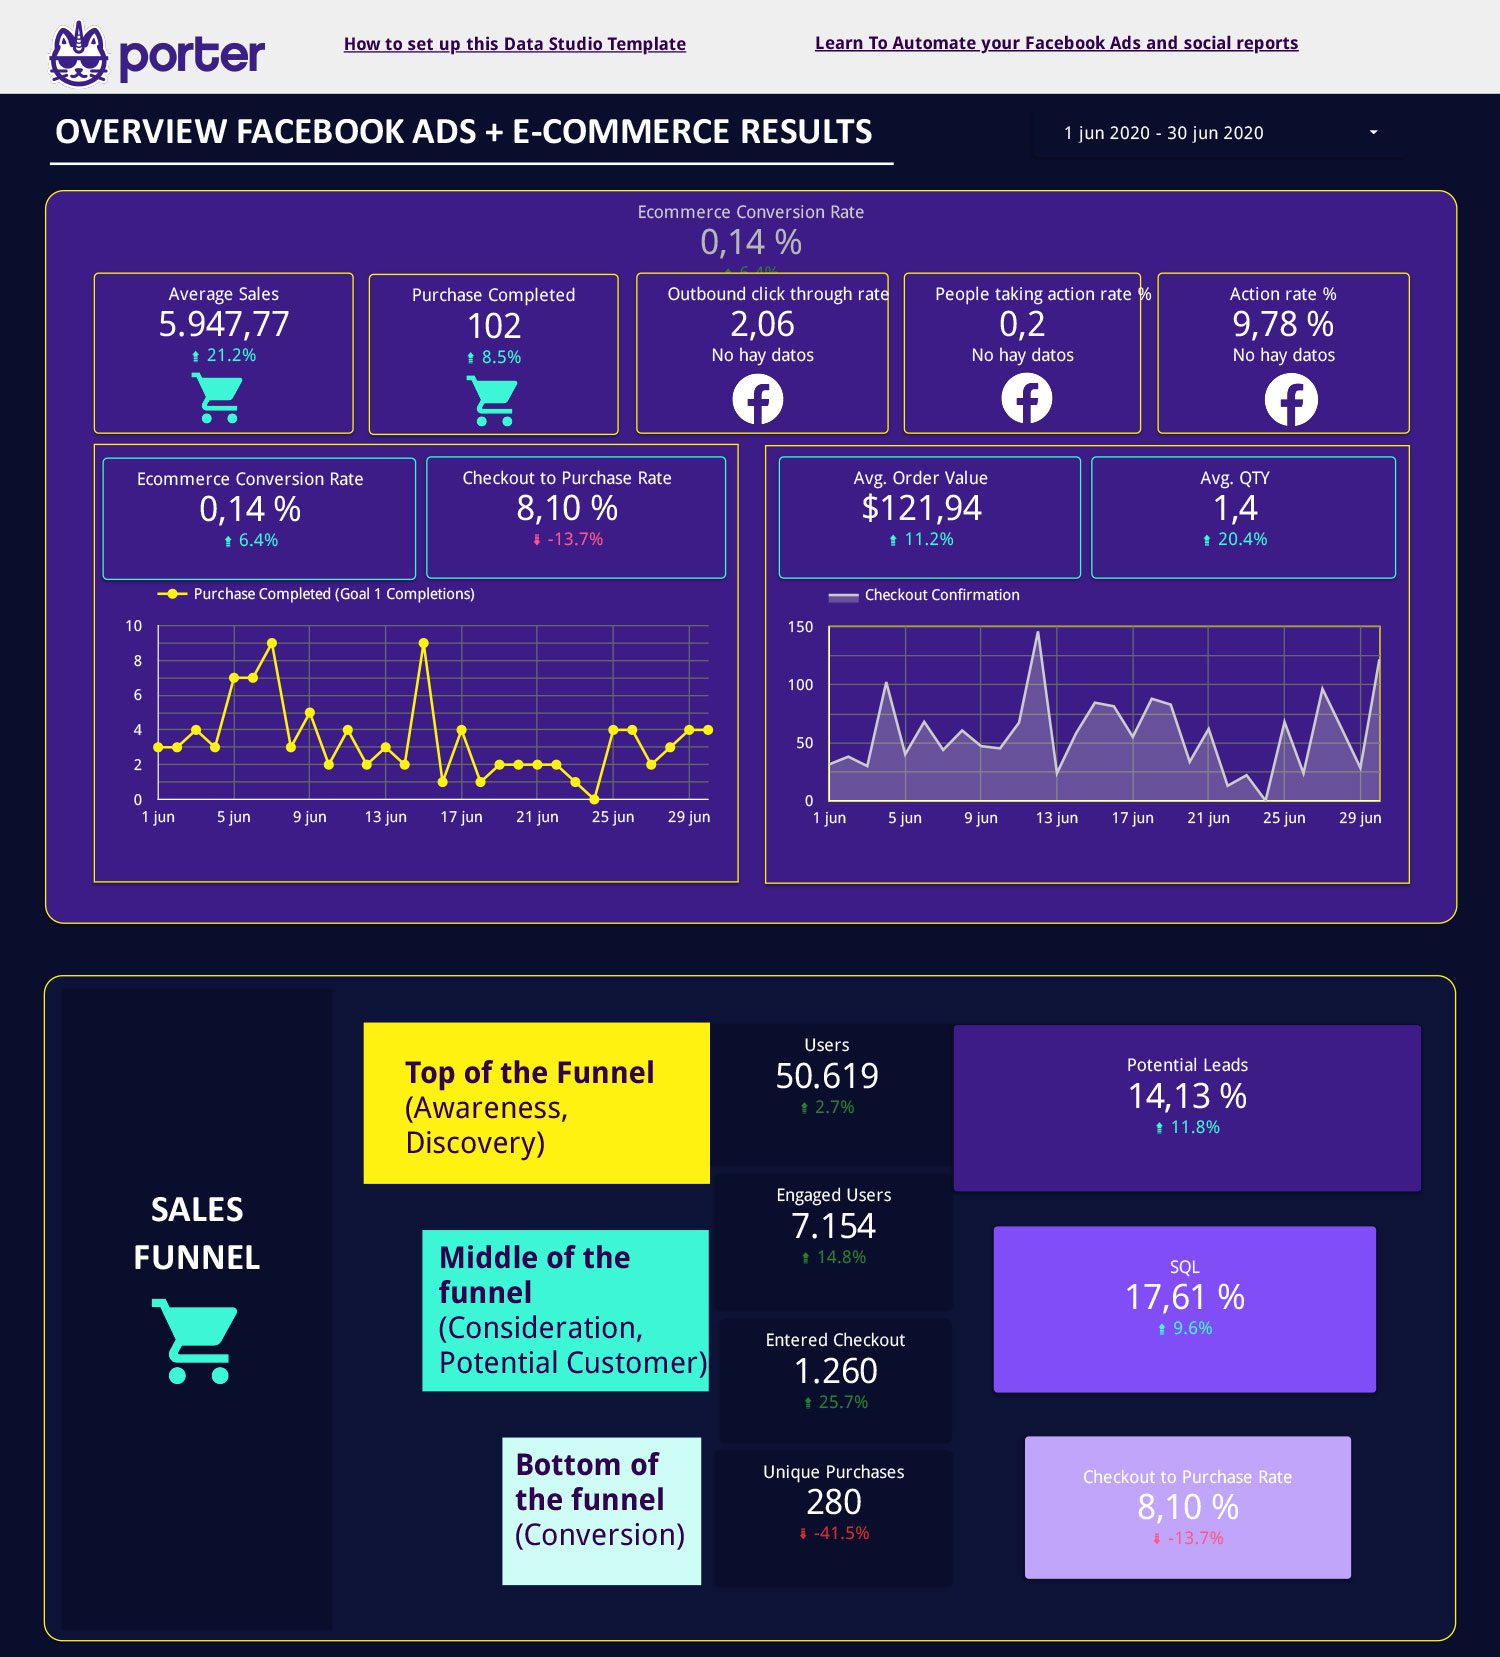
With this FREE template you have everything: your Google Analytics Data and your Facebook Ads performance. Now you can track your most important Business KPI’s in one place [Inspired in a real use case].
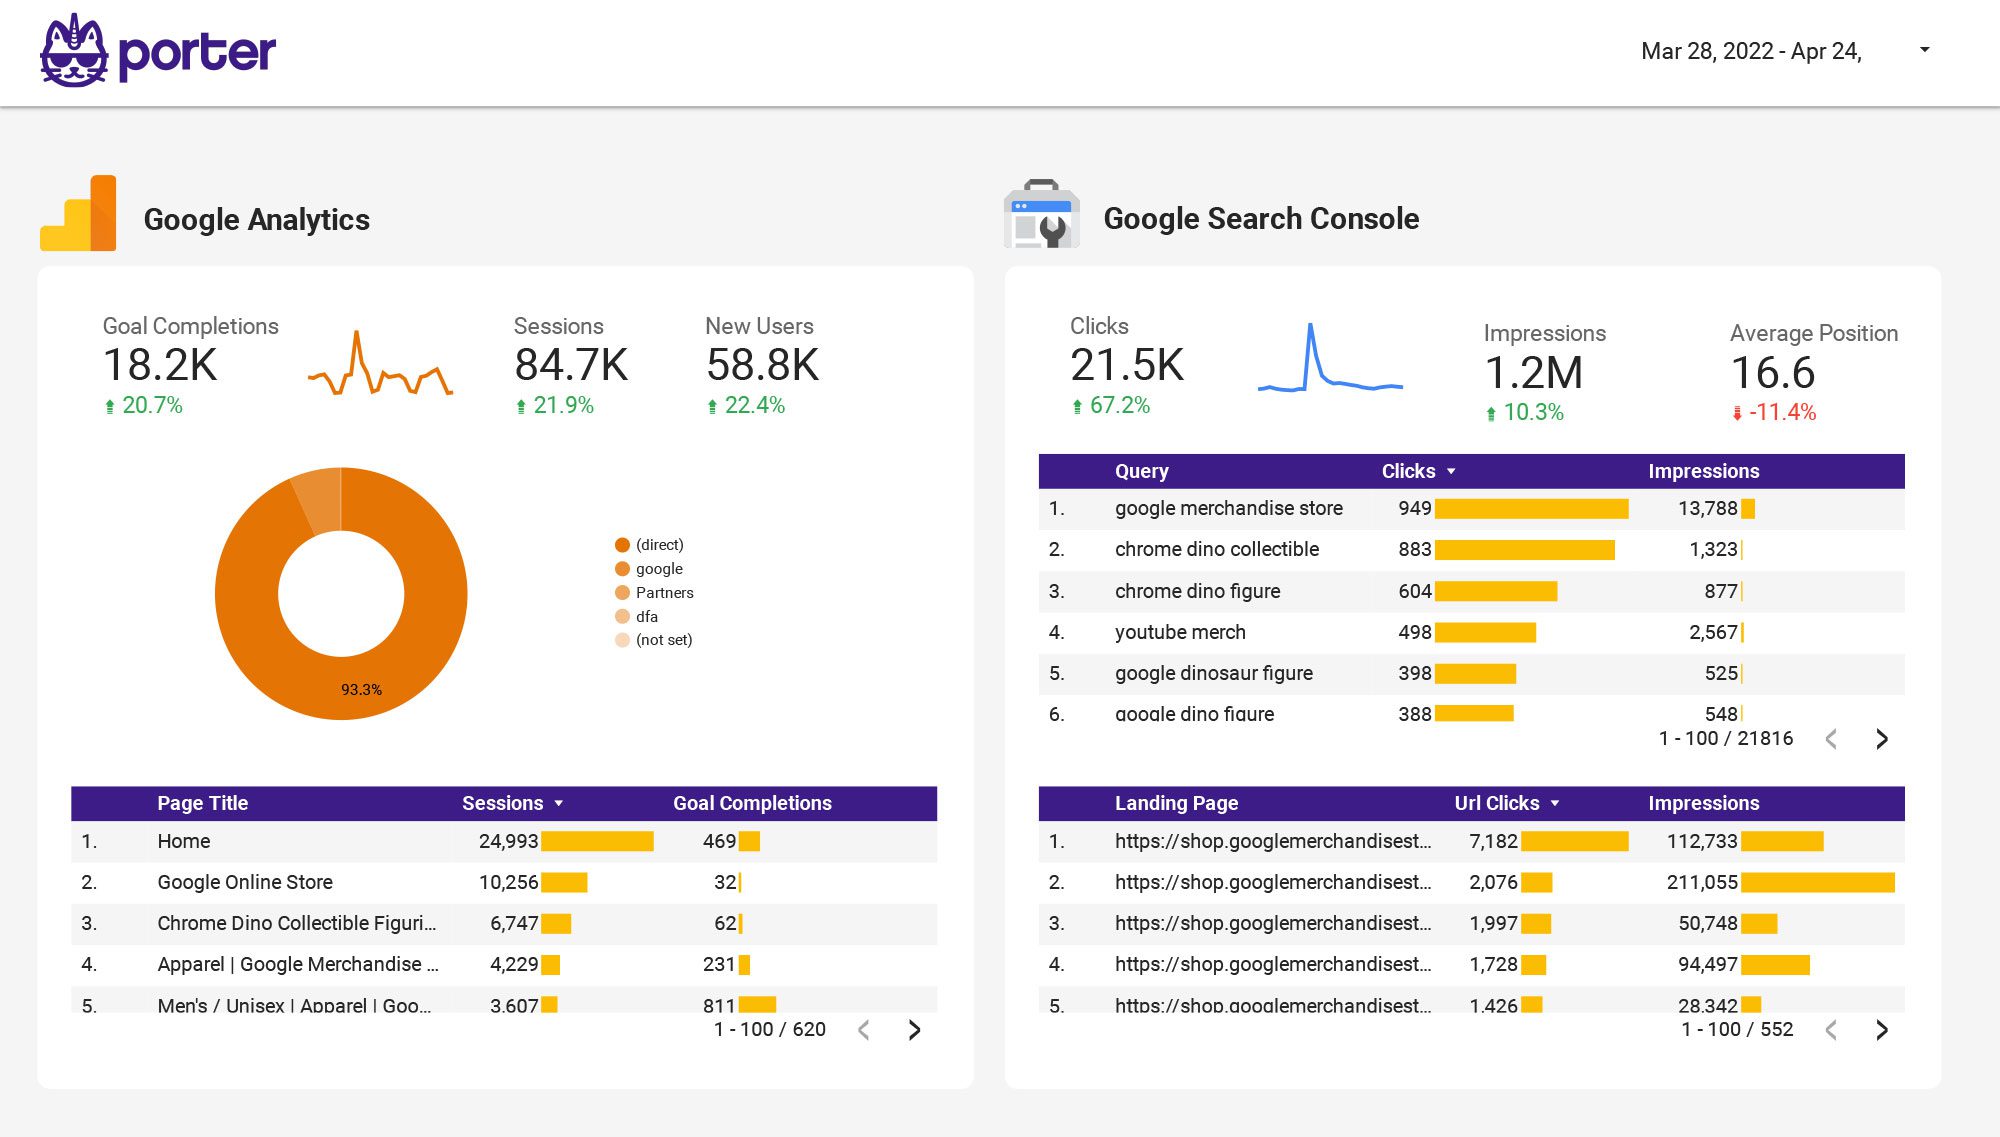
Visualize your core marketing KPIs from all channels in a single view: Google Analytics, Google Ads, Youtube, Google Search Console, Facebook pages, Instagram pages, and Facebook Ads.
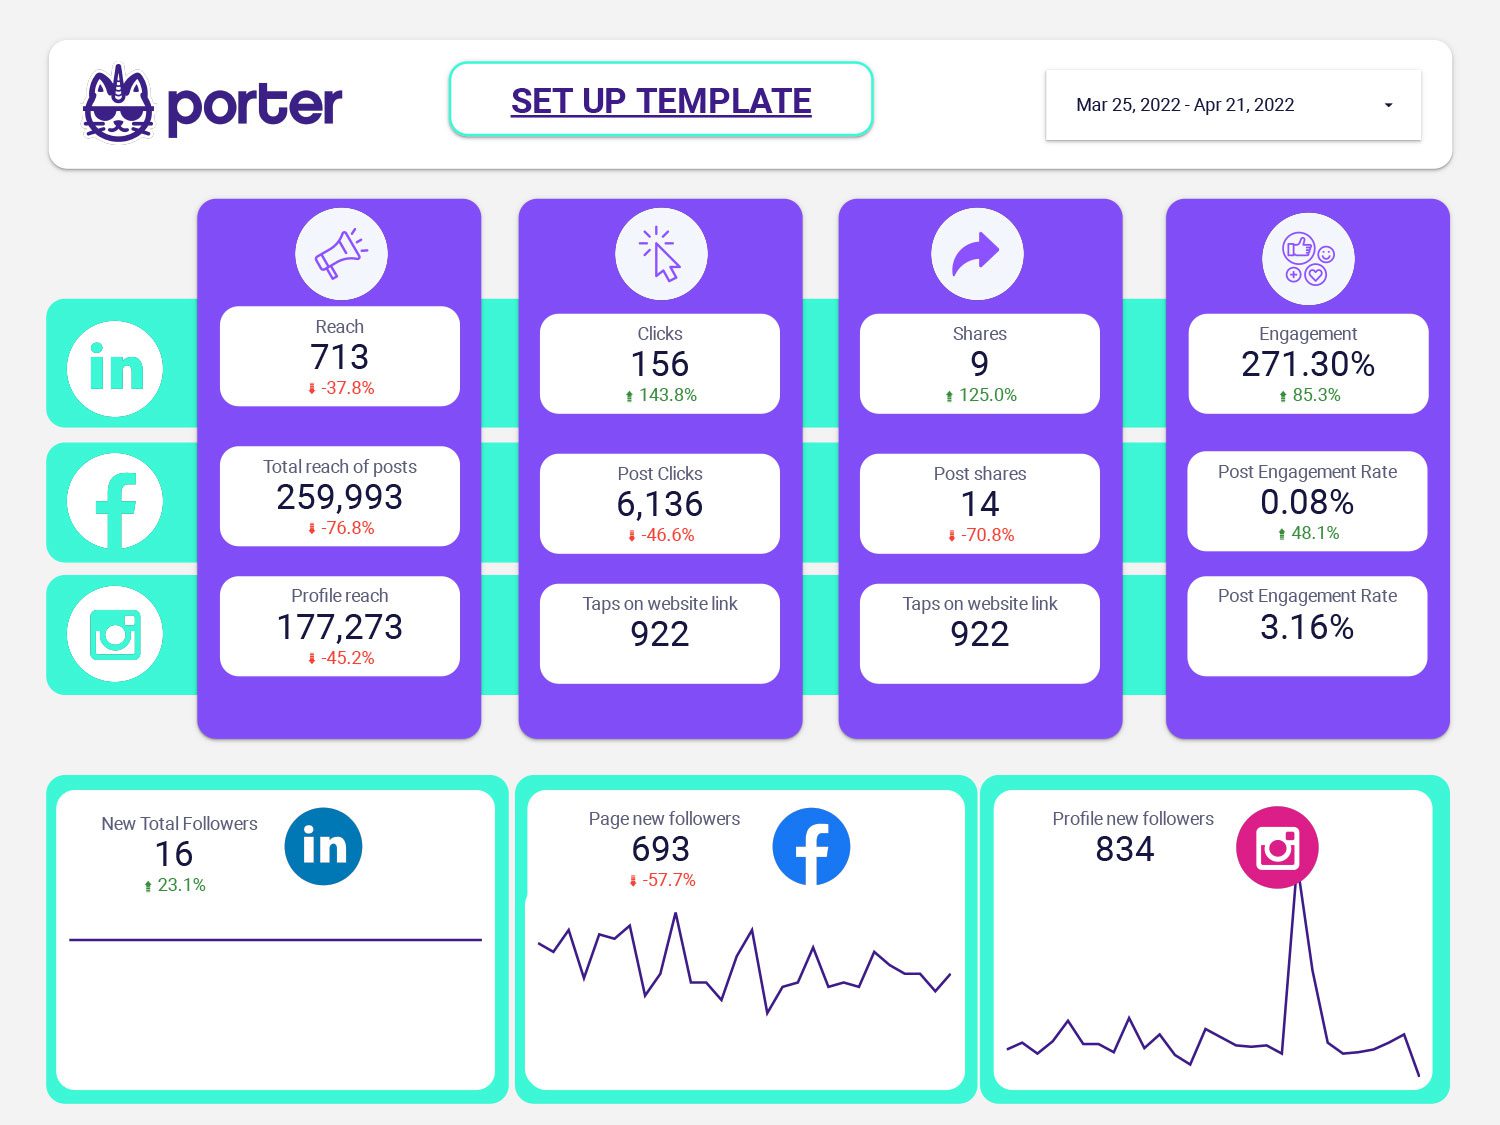
Track your social media results, growth over time, reach, conversions, engagement, and more.
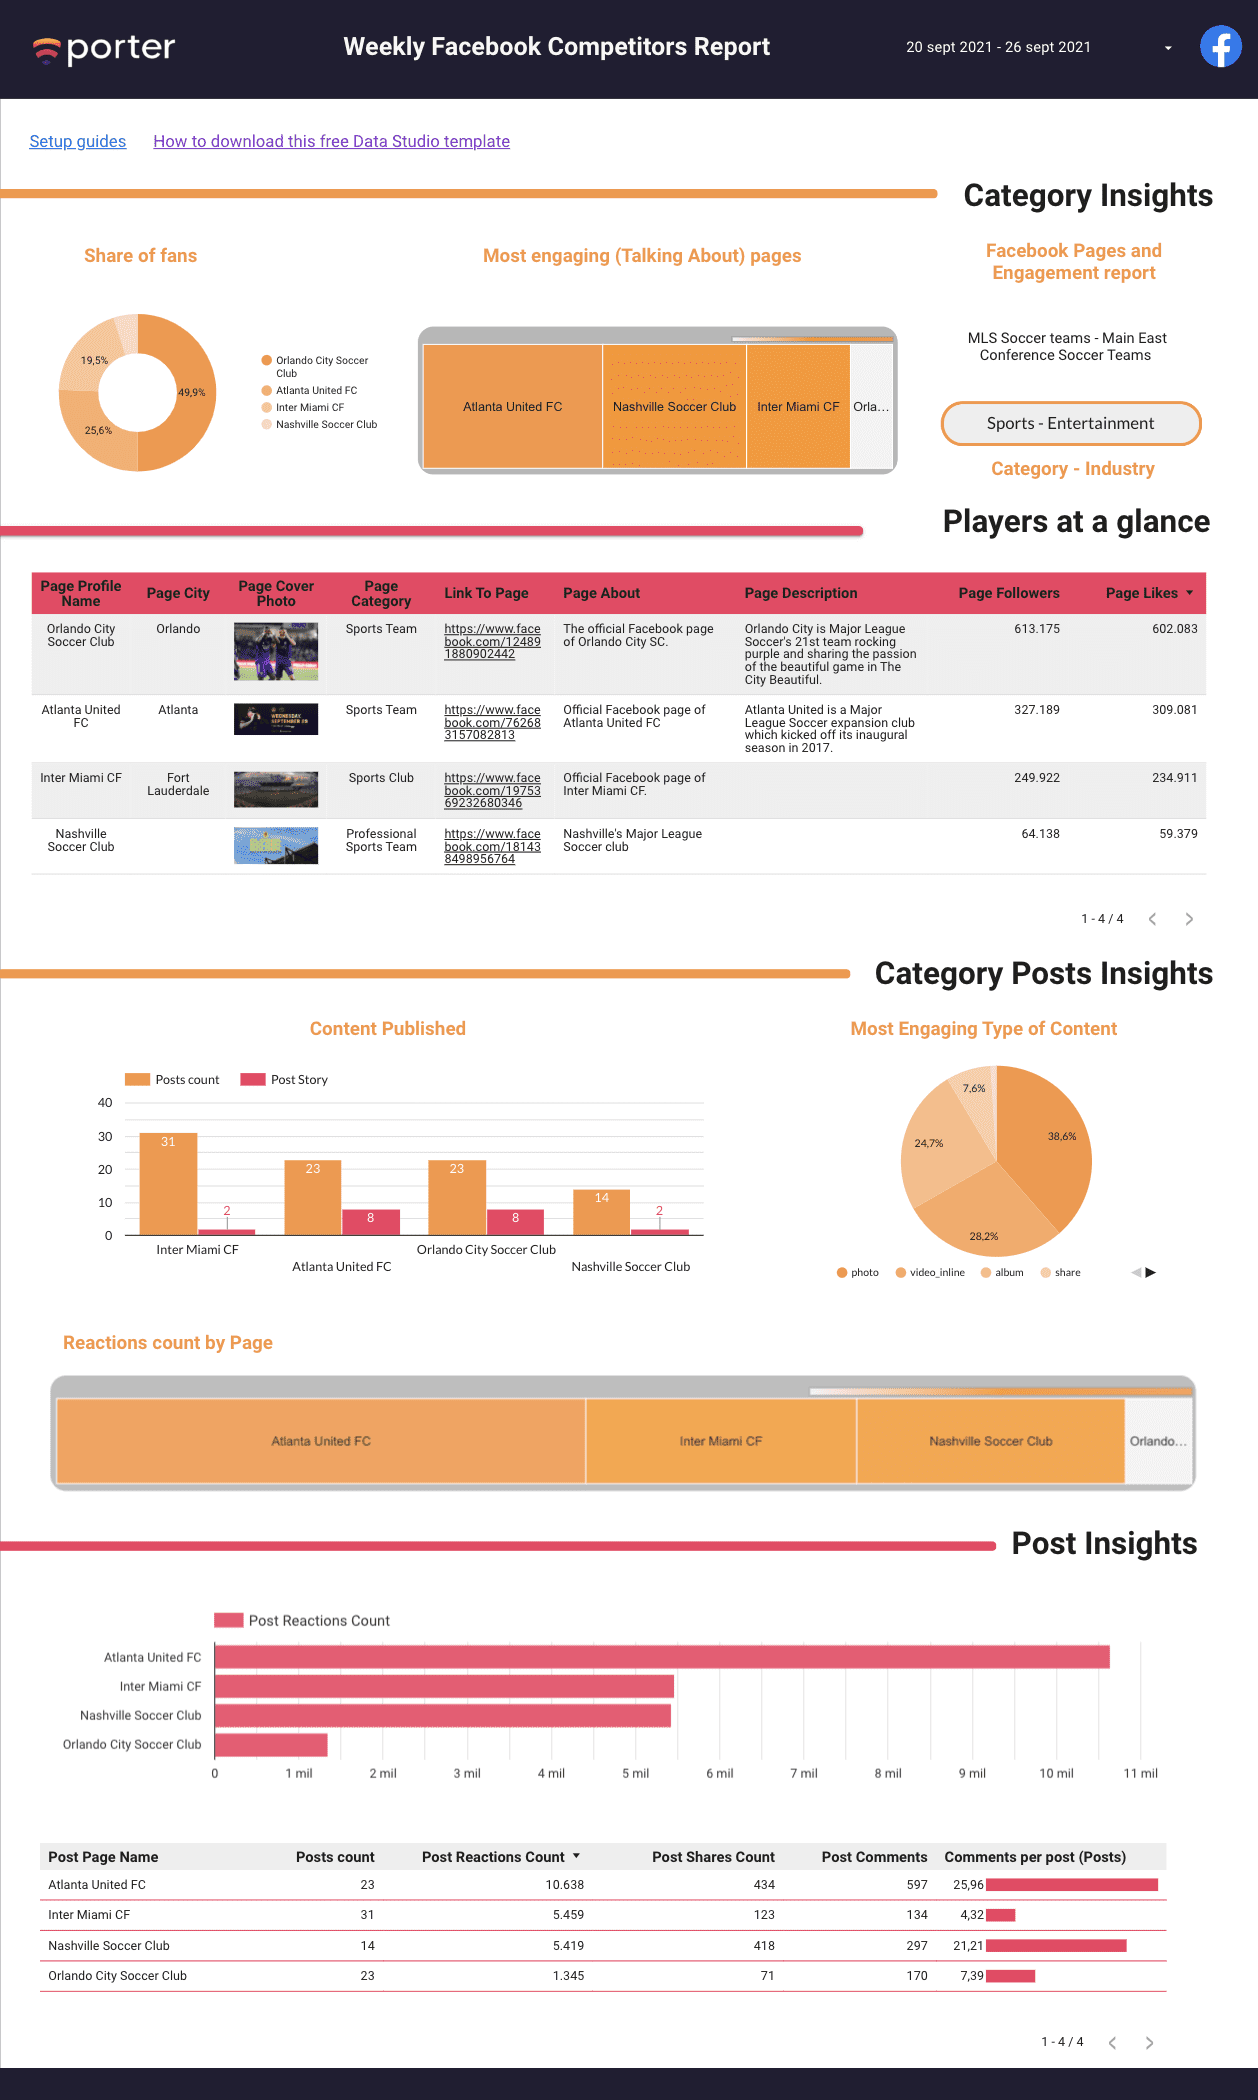
Visualize the Facebook Competitors data with the Facebook Public Data Porter connector and boost your strategy. Get the template – It’s free Facebook Competitor’s report
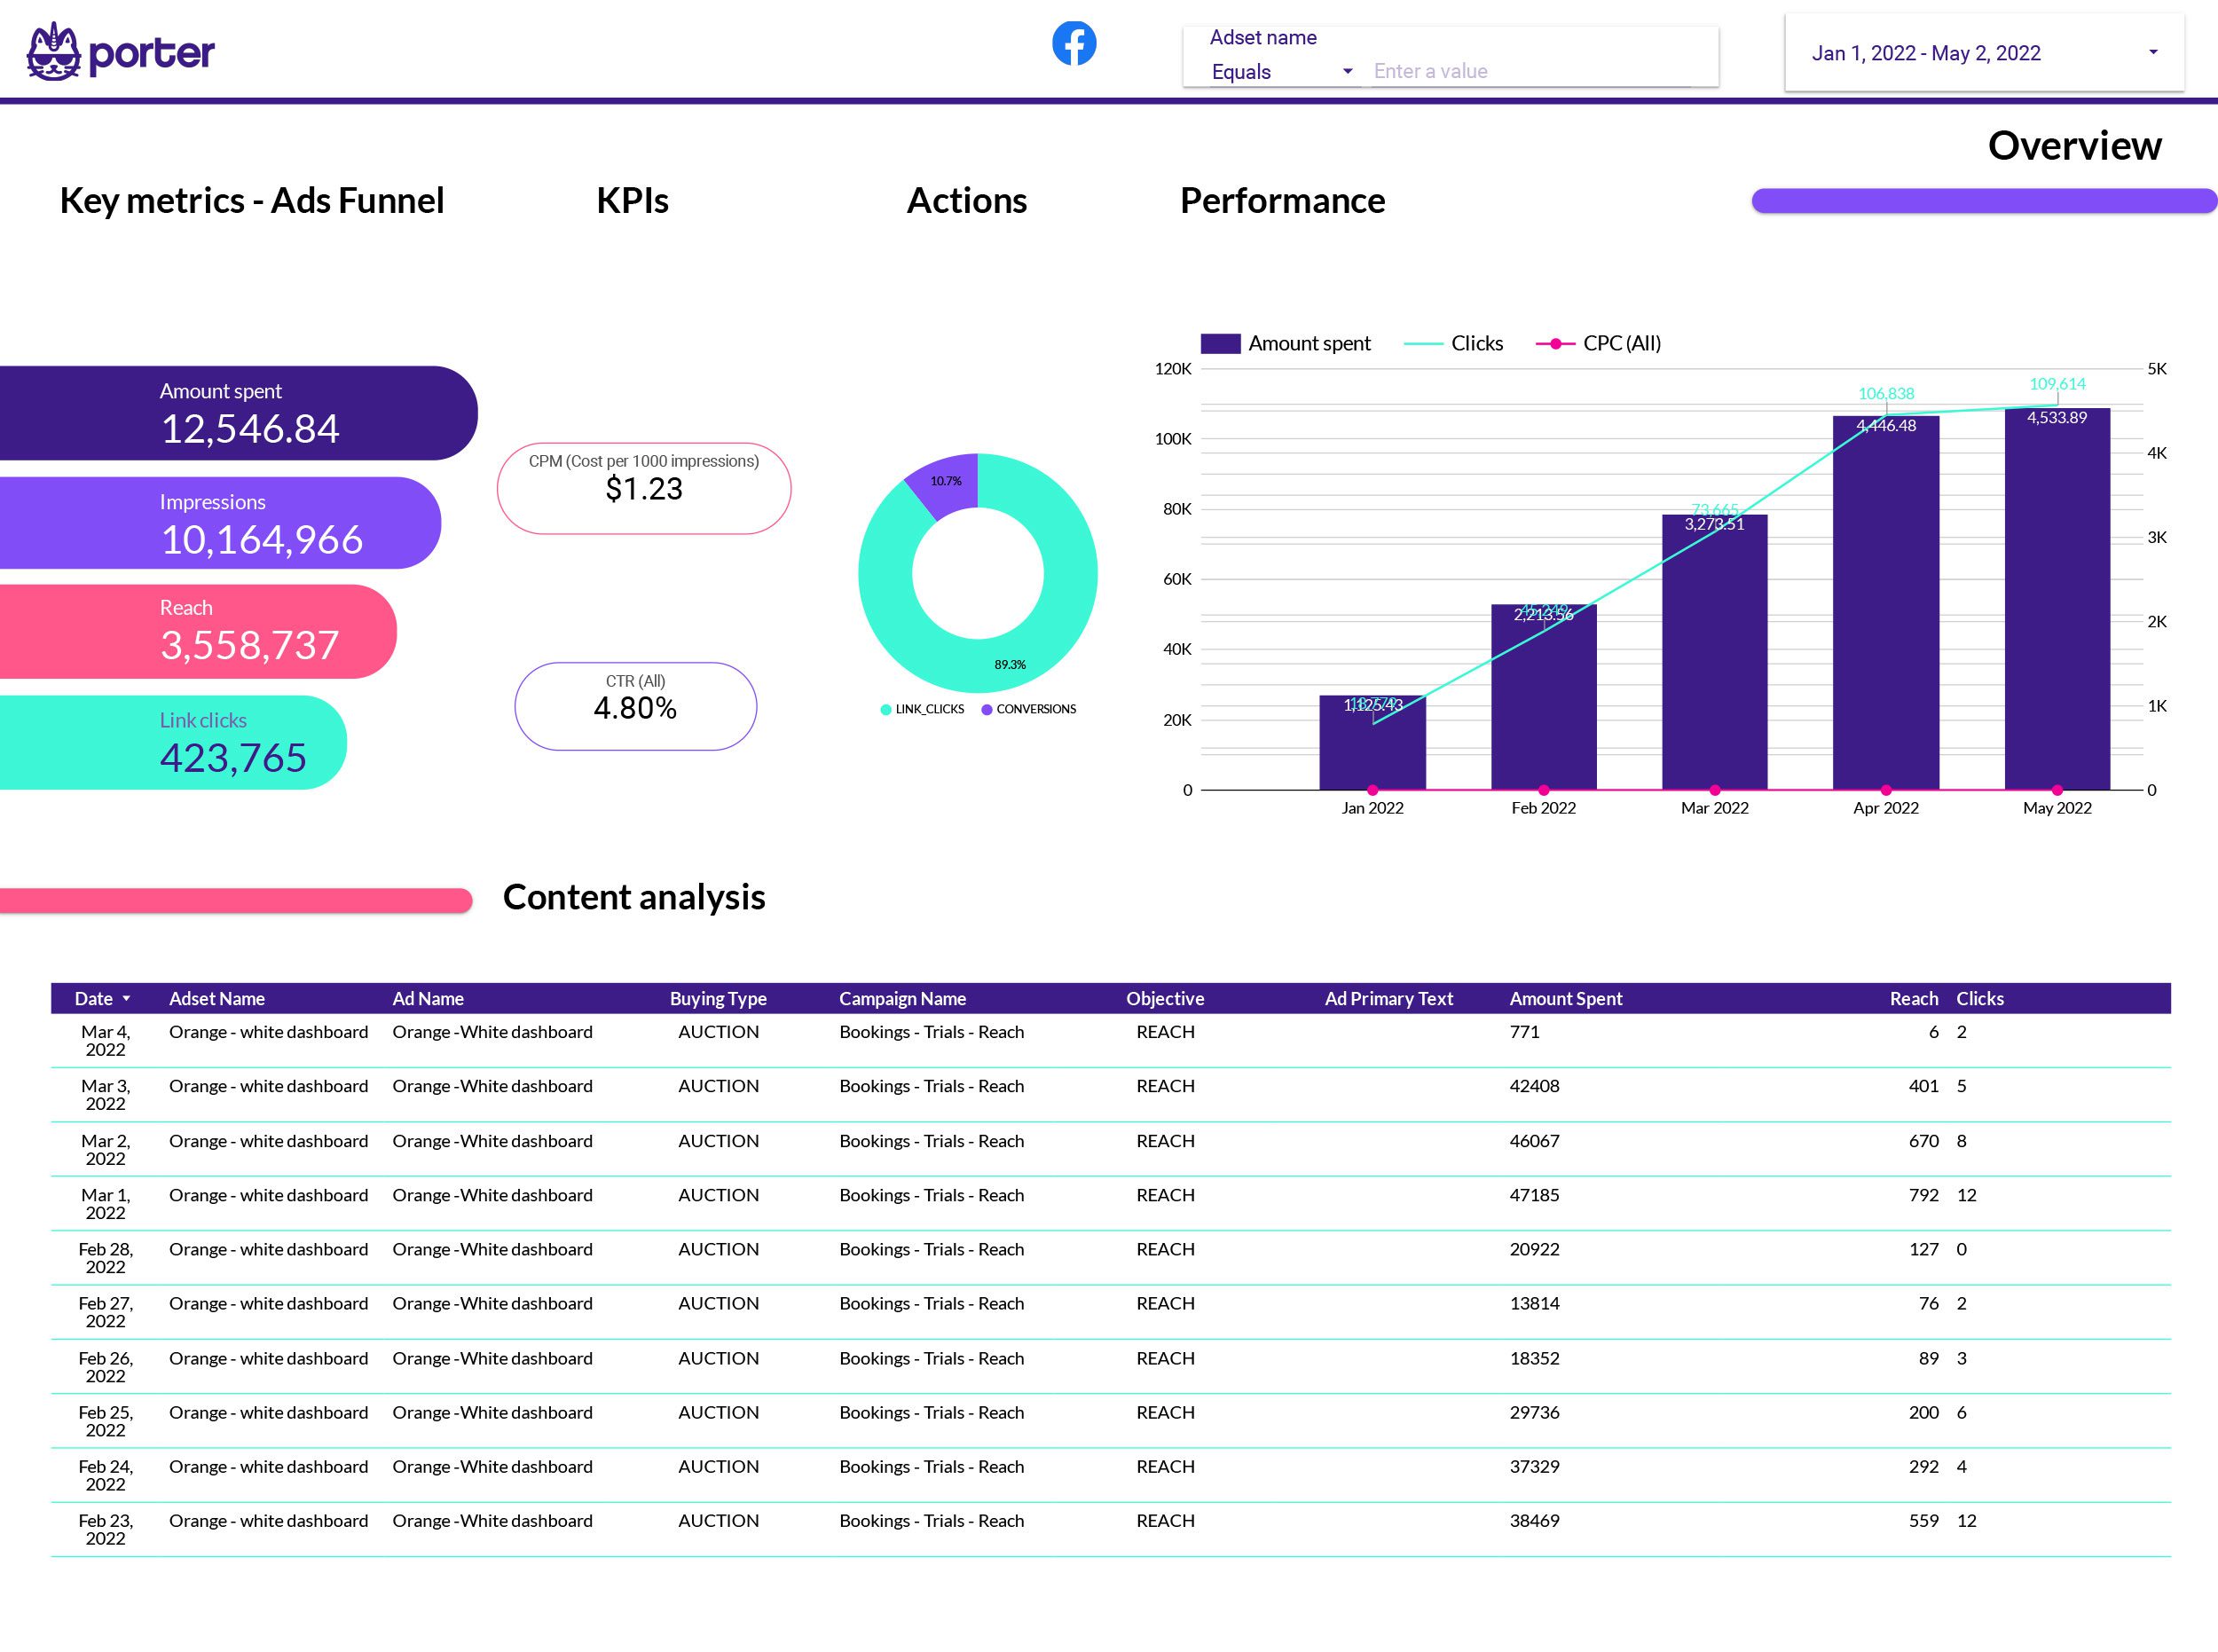
Facebook has various campaign objectives which allow you connect with the right audiences at different stages of the marketing funnel.
The PPC report will help marketers understand how Pay-Per-Click campaigns are performing. Download it for FREE.
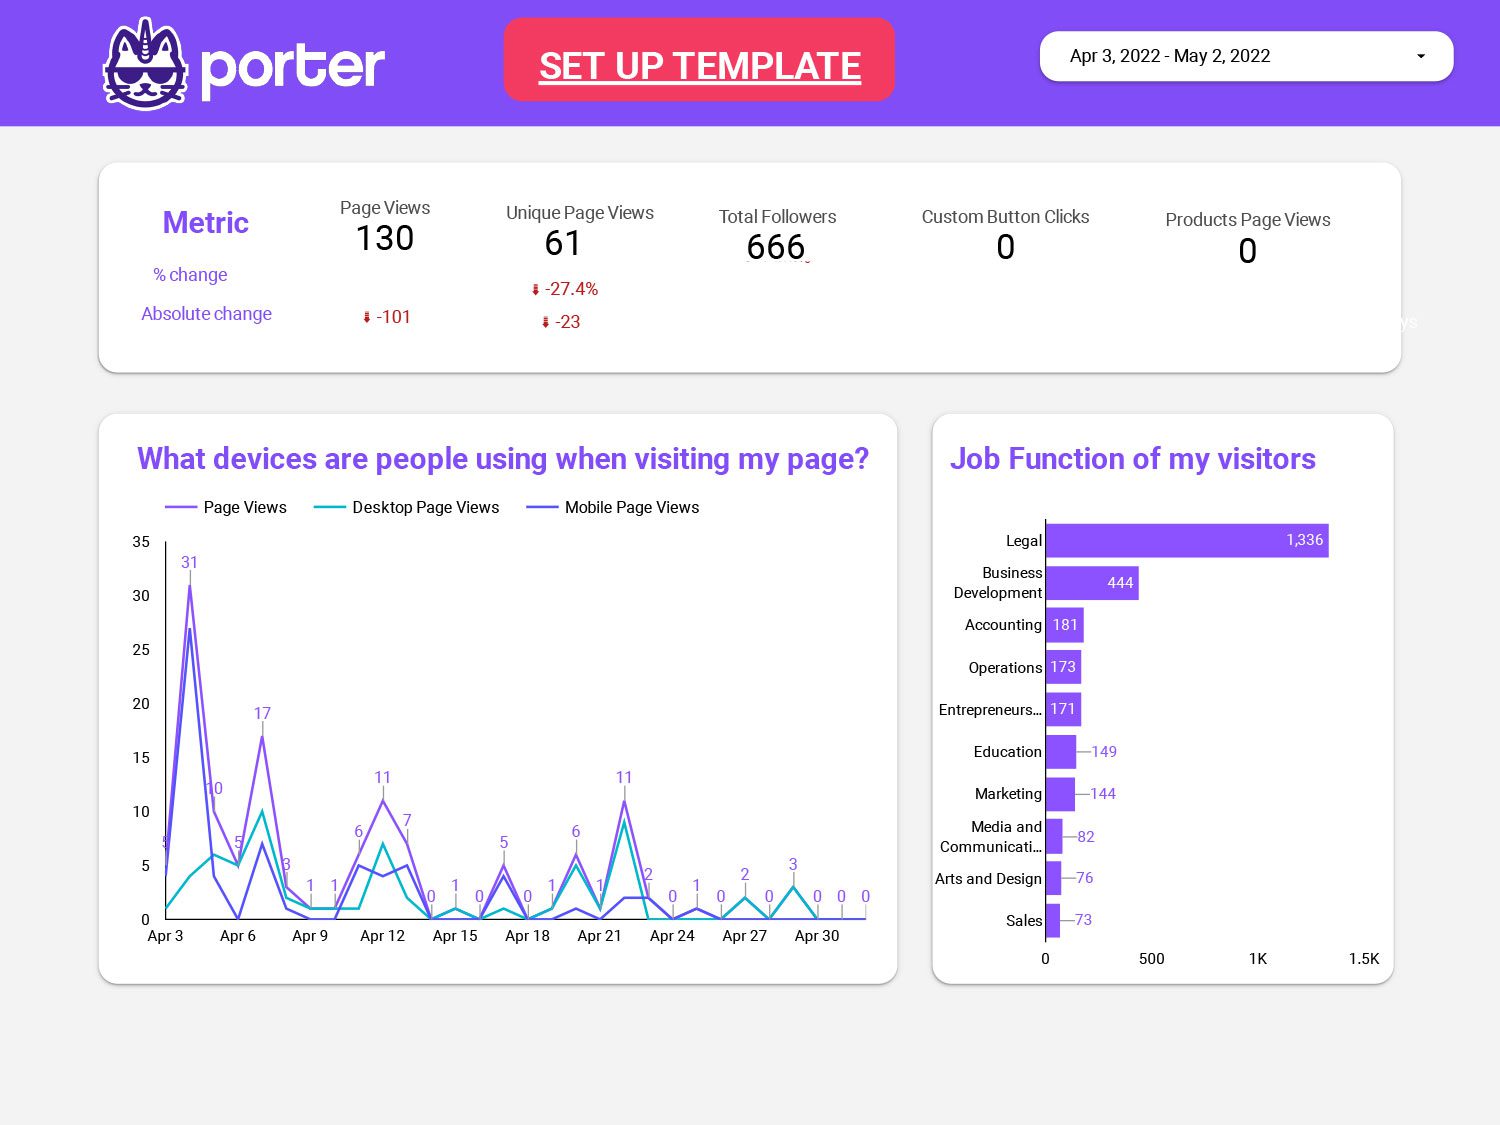
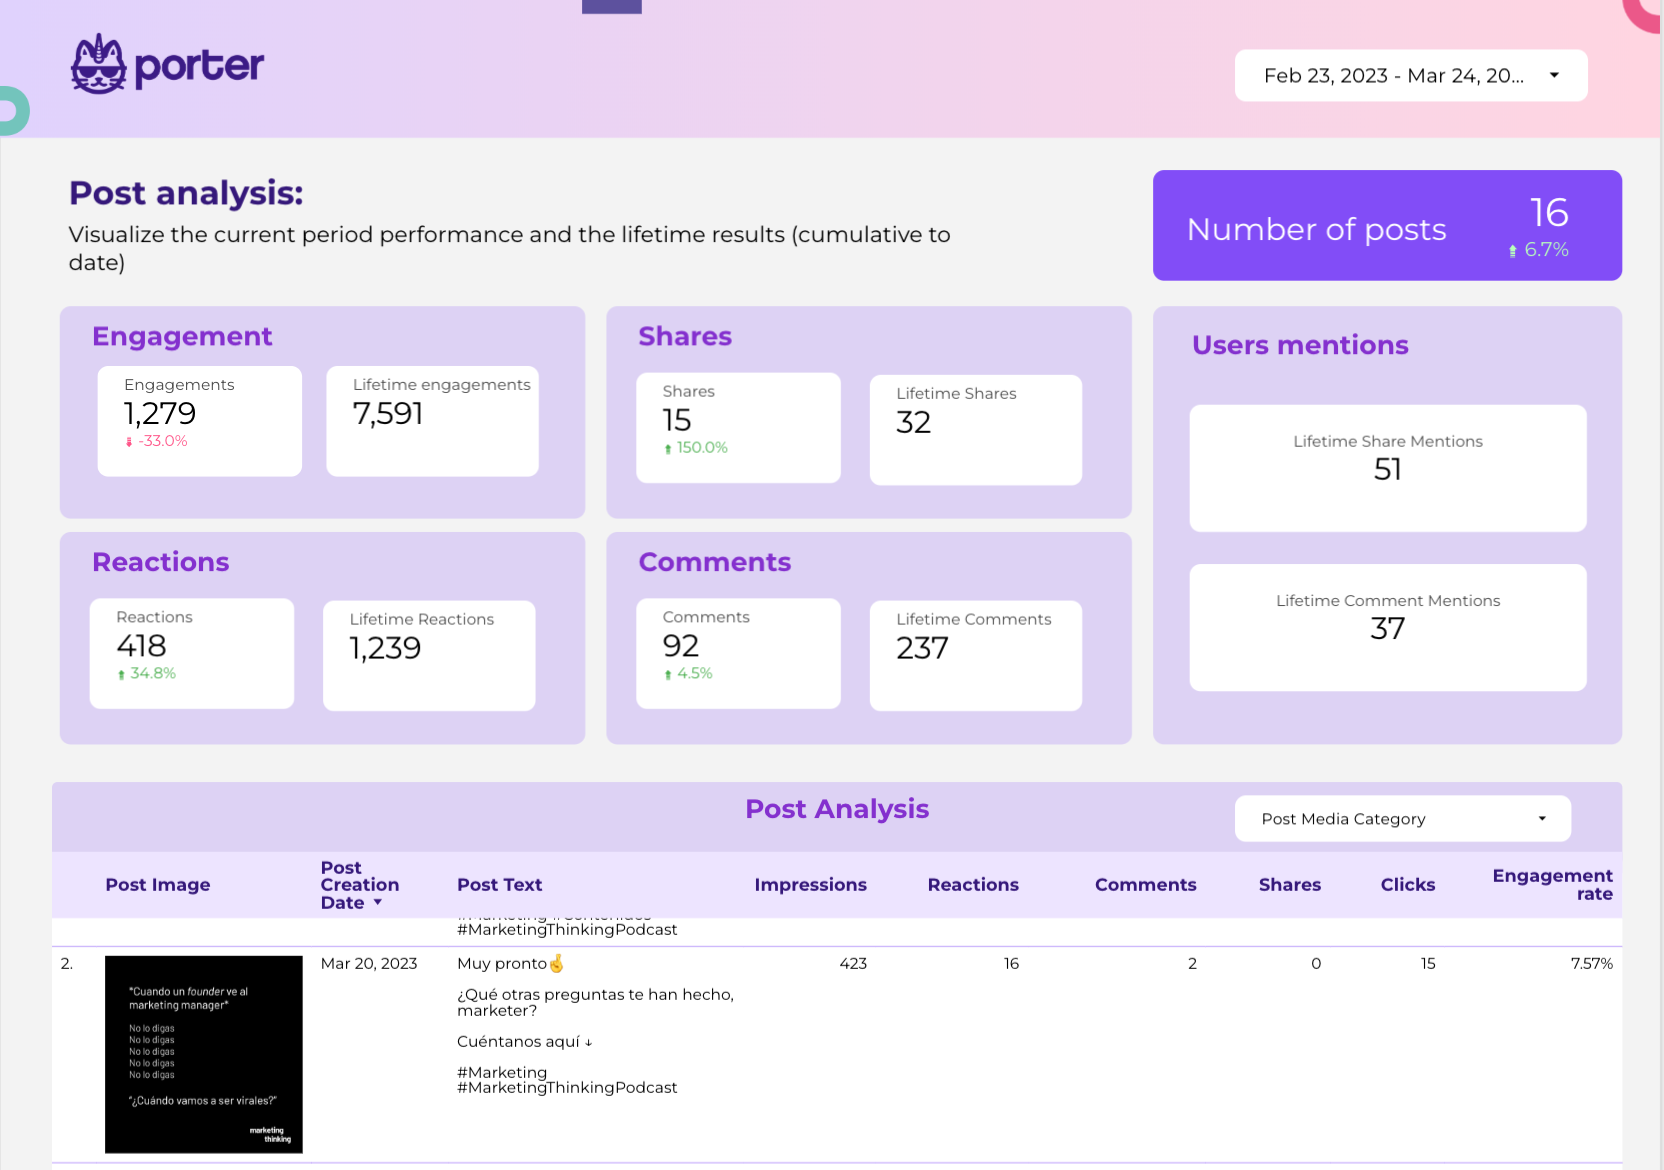
Track your LinkedIn organic page results, track your growth, measure your main KPIs and present them with interactive dashboards on Data Studio.
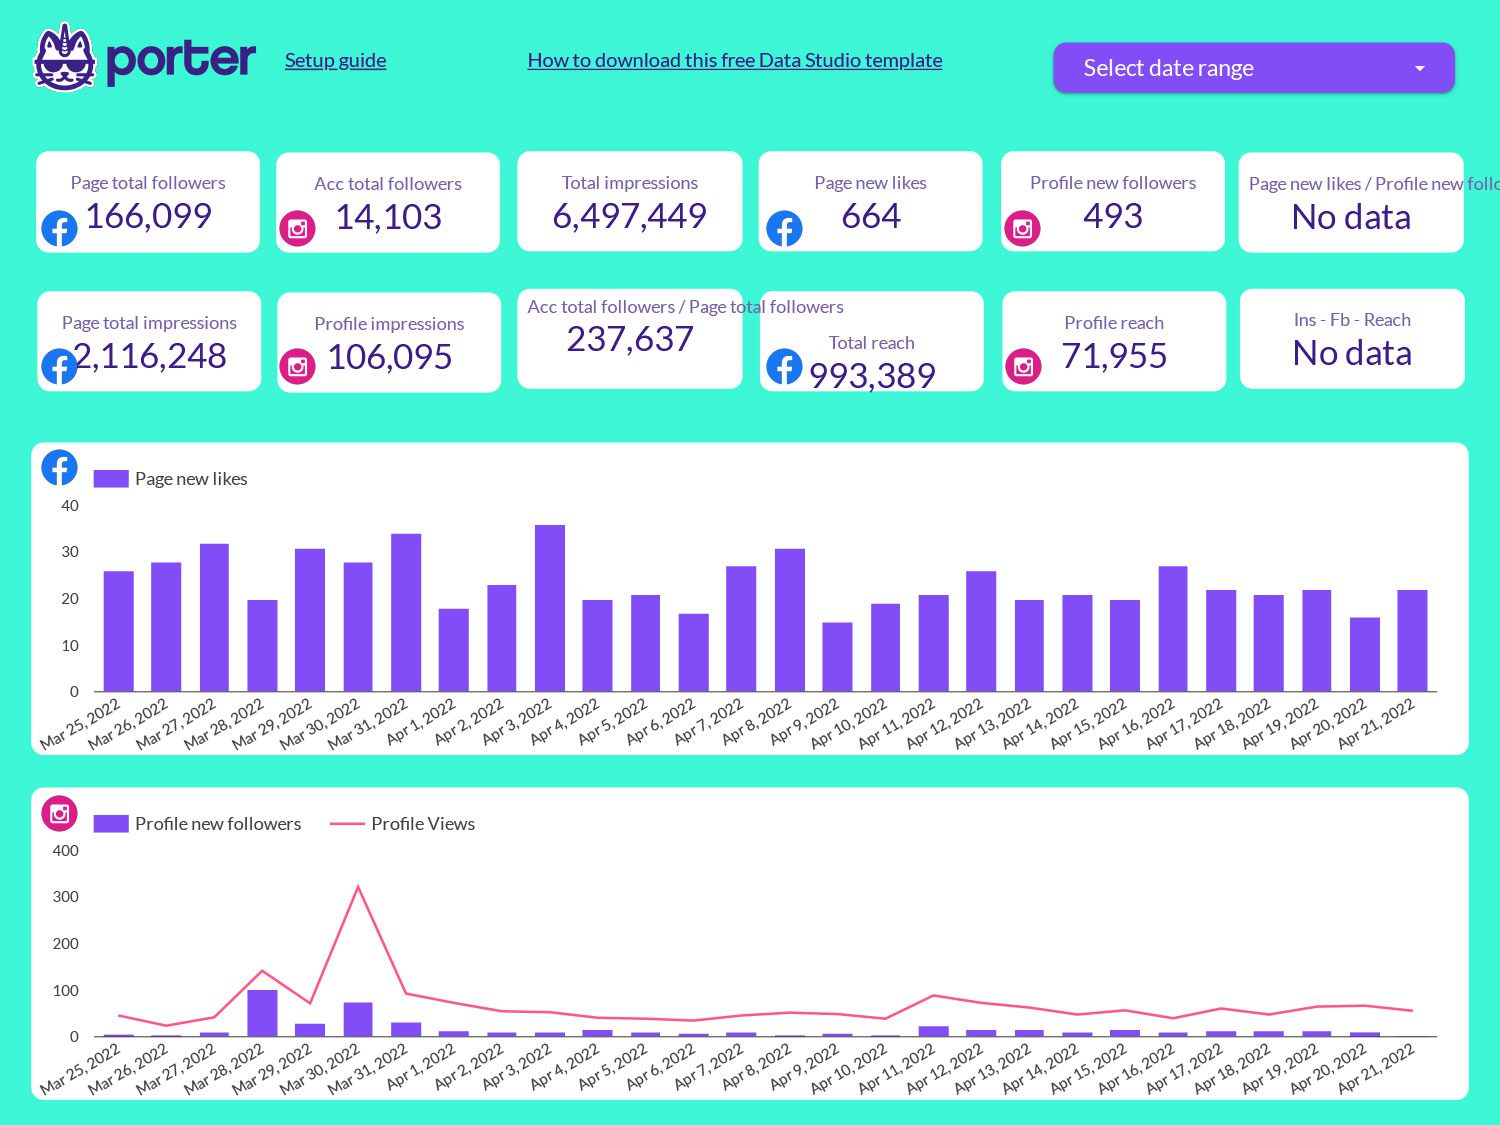
With this Google Data Studio report template, you can track your organic efforts across Facebook and Instagram in a single glance.
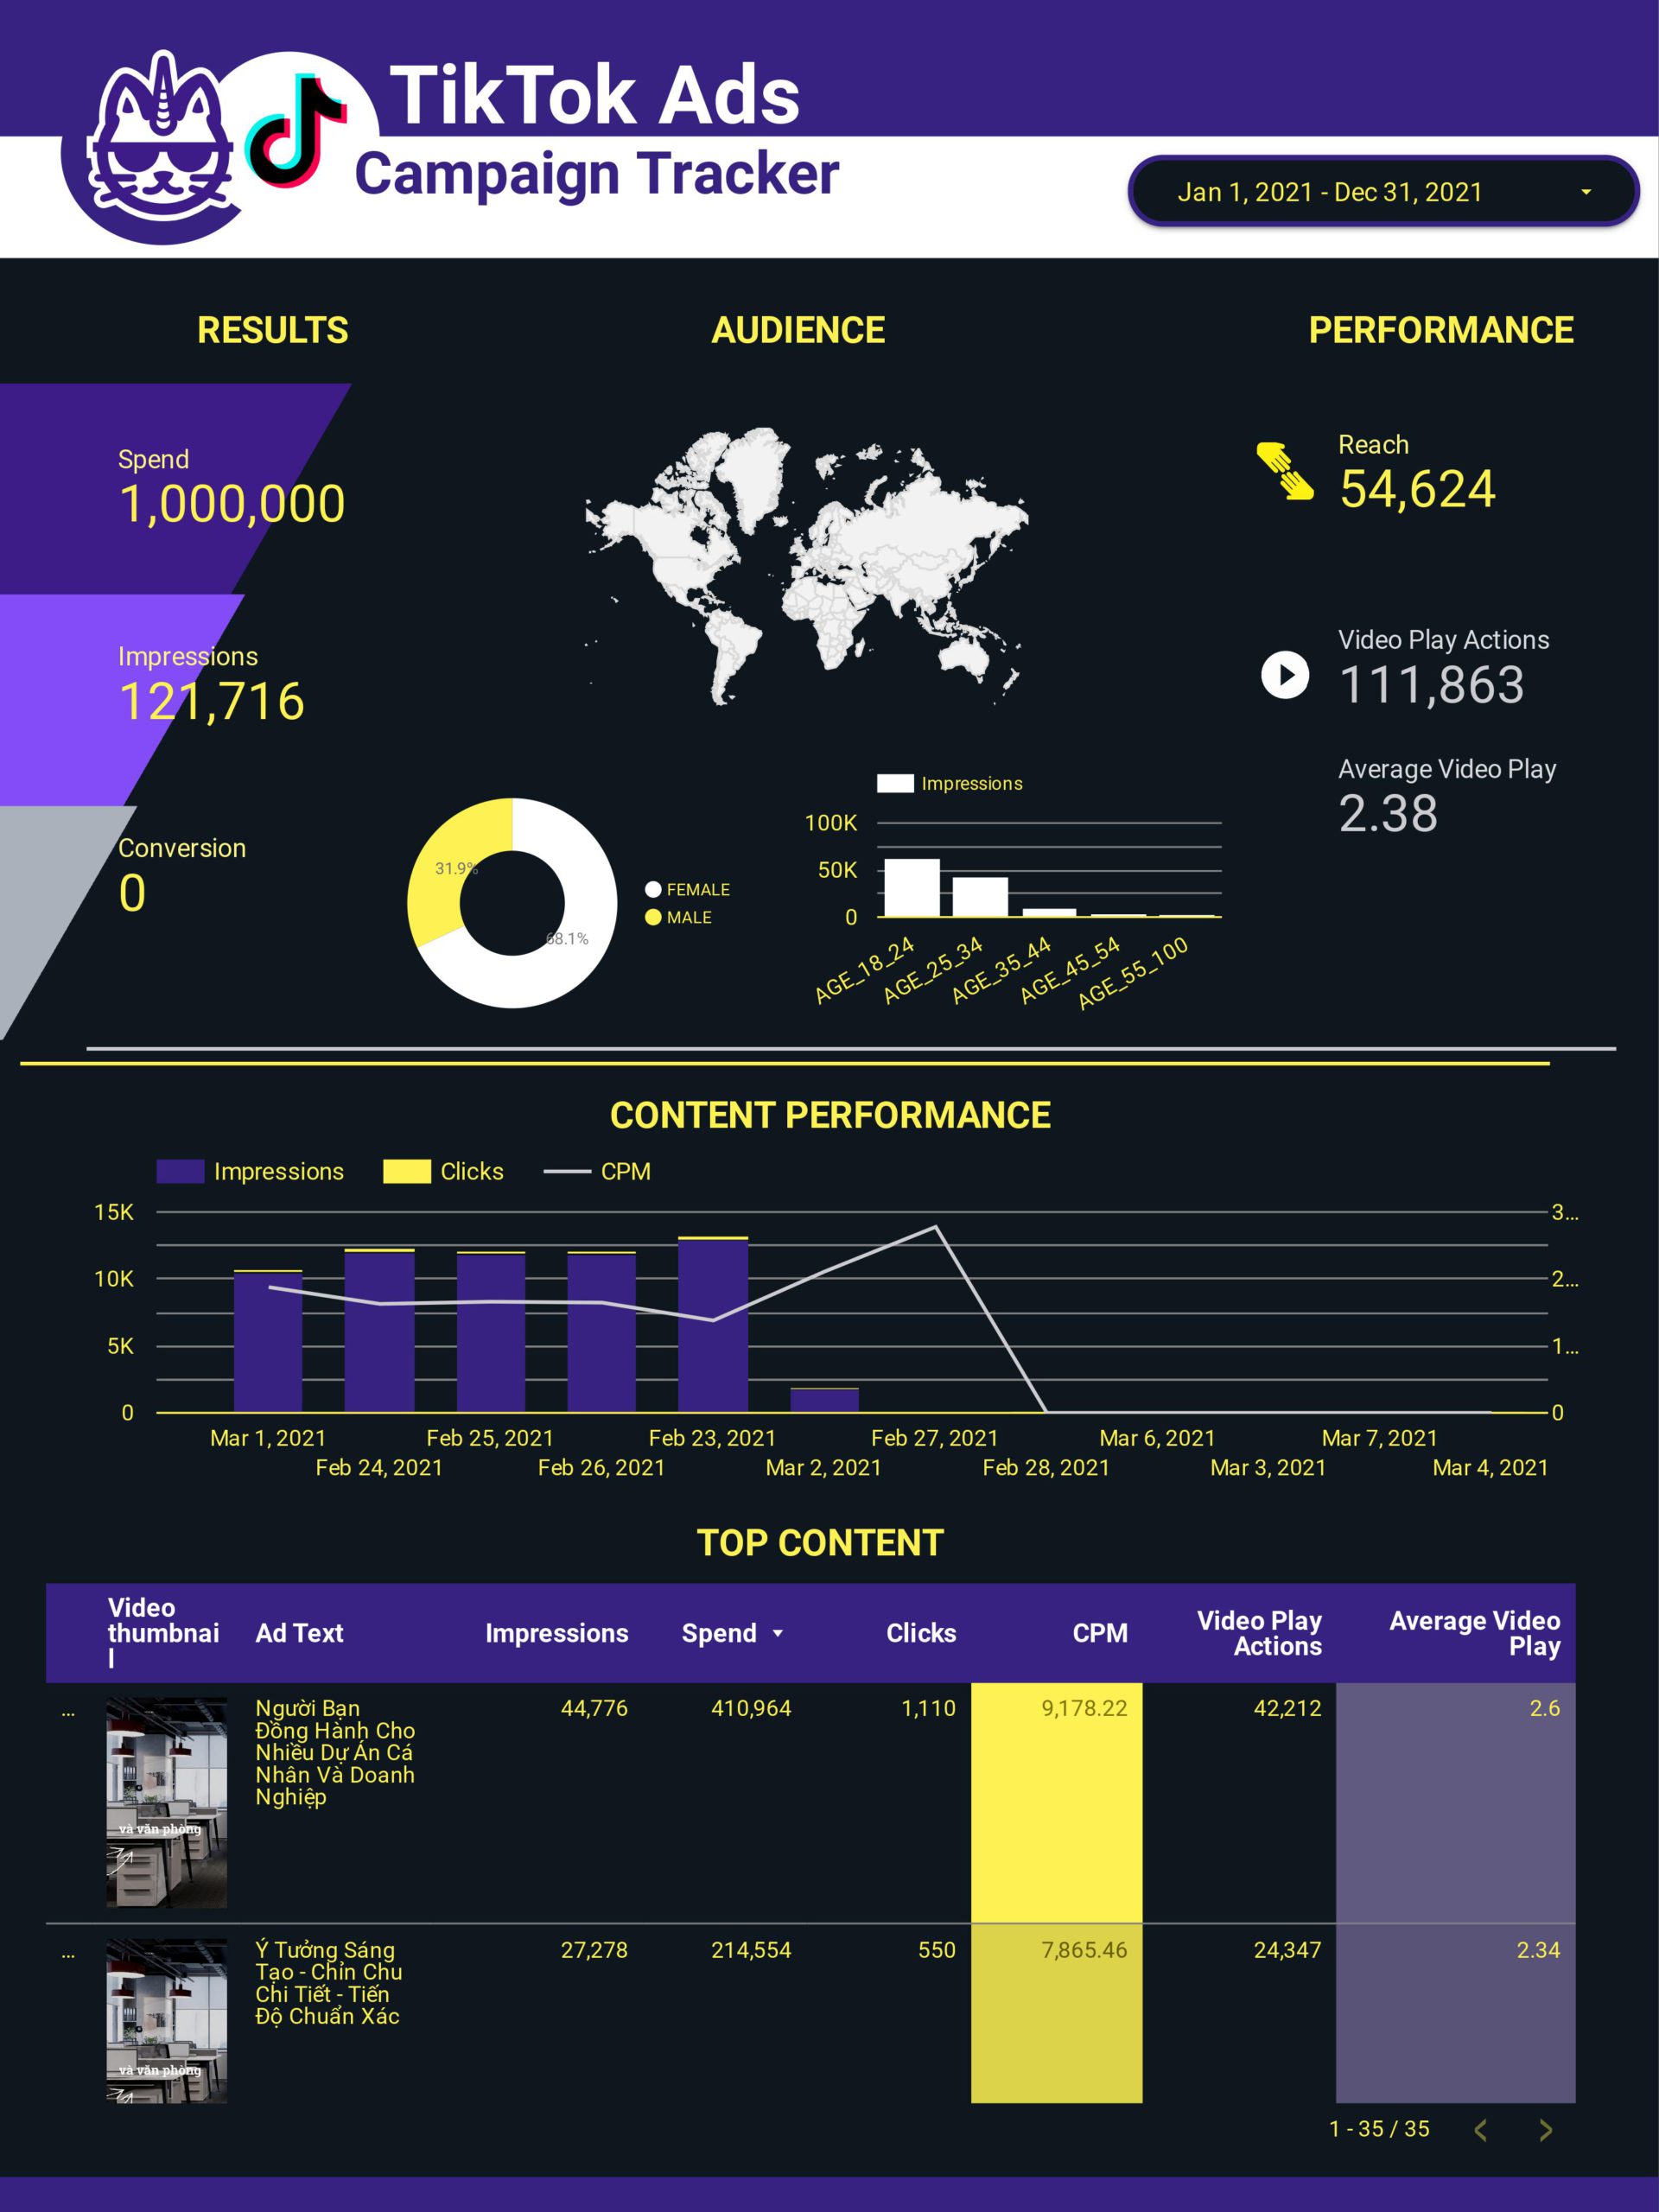
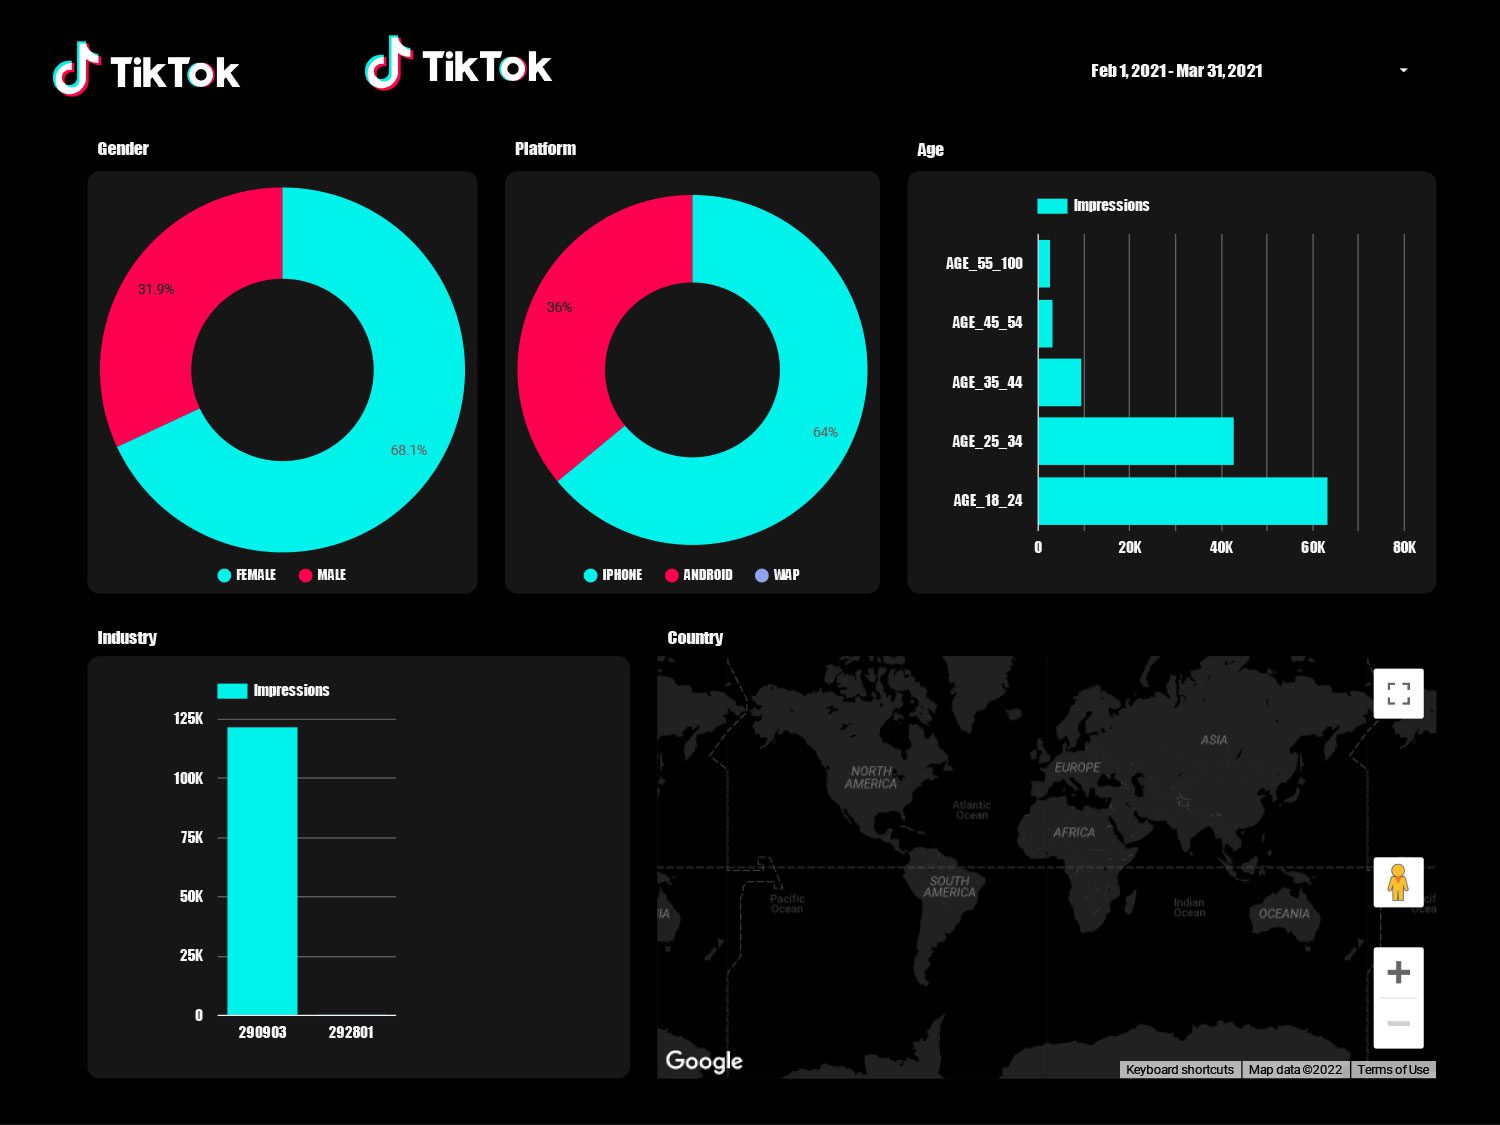
Visualize and customize your TikTok Ads performance data and get everything you need in one page (Mobile-friendly) Download it for FREE and start sharing the most relevant metrics with your teams.
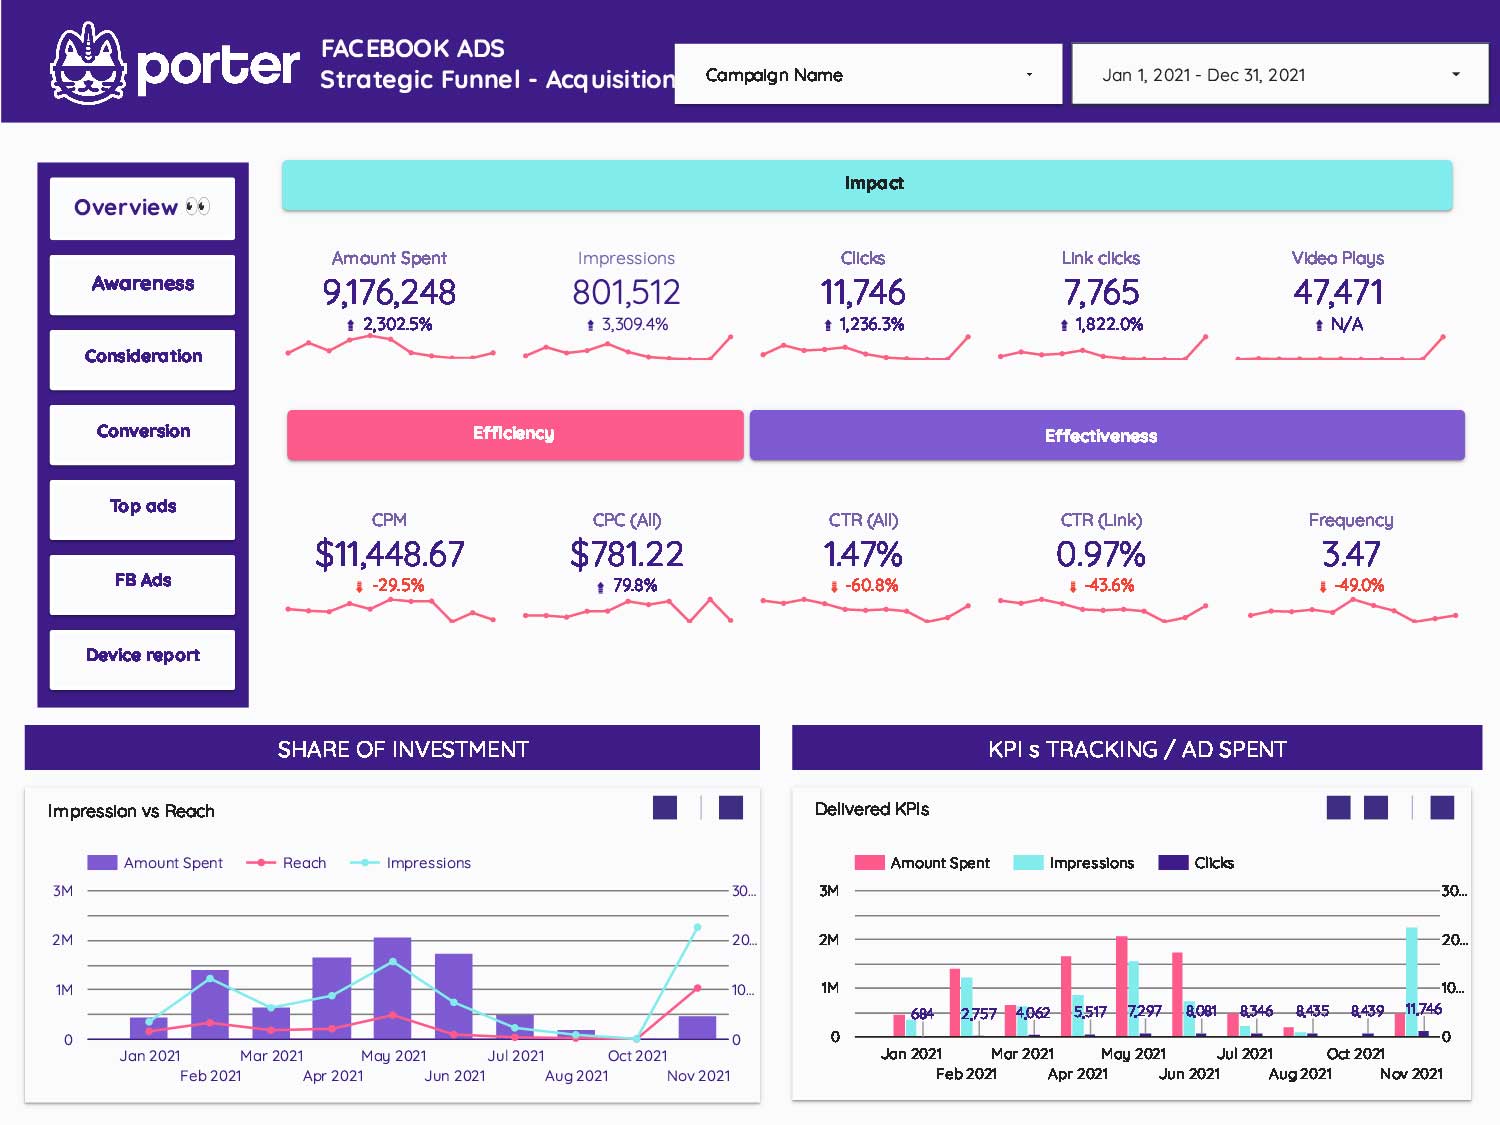
Review your Facebook Ad funnel considering the 3 stages: awareness, consideration, and conversion. (Upper – Mid – Lower Funnel).
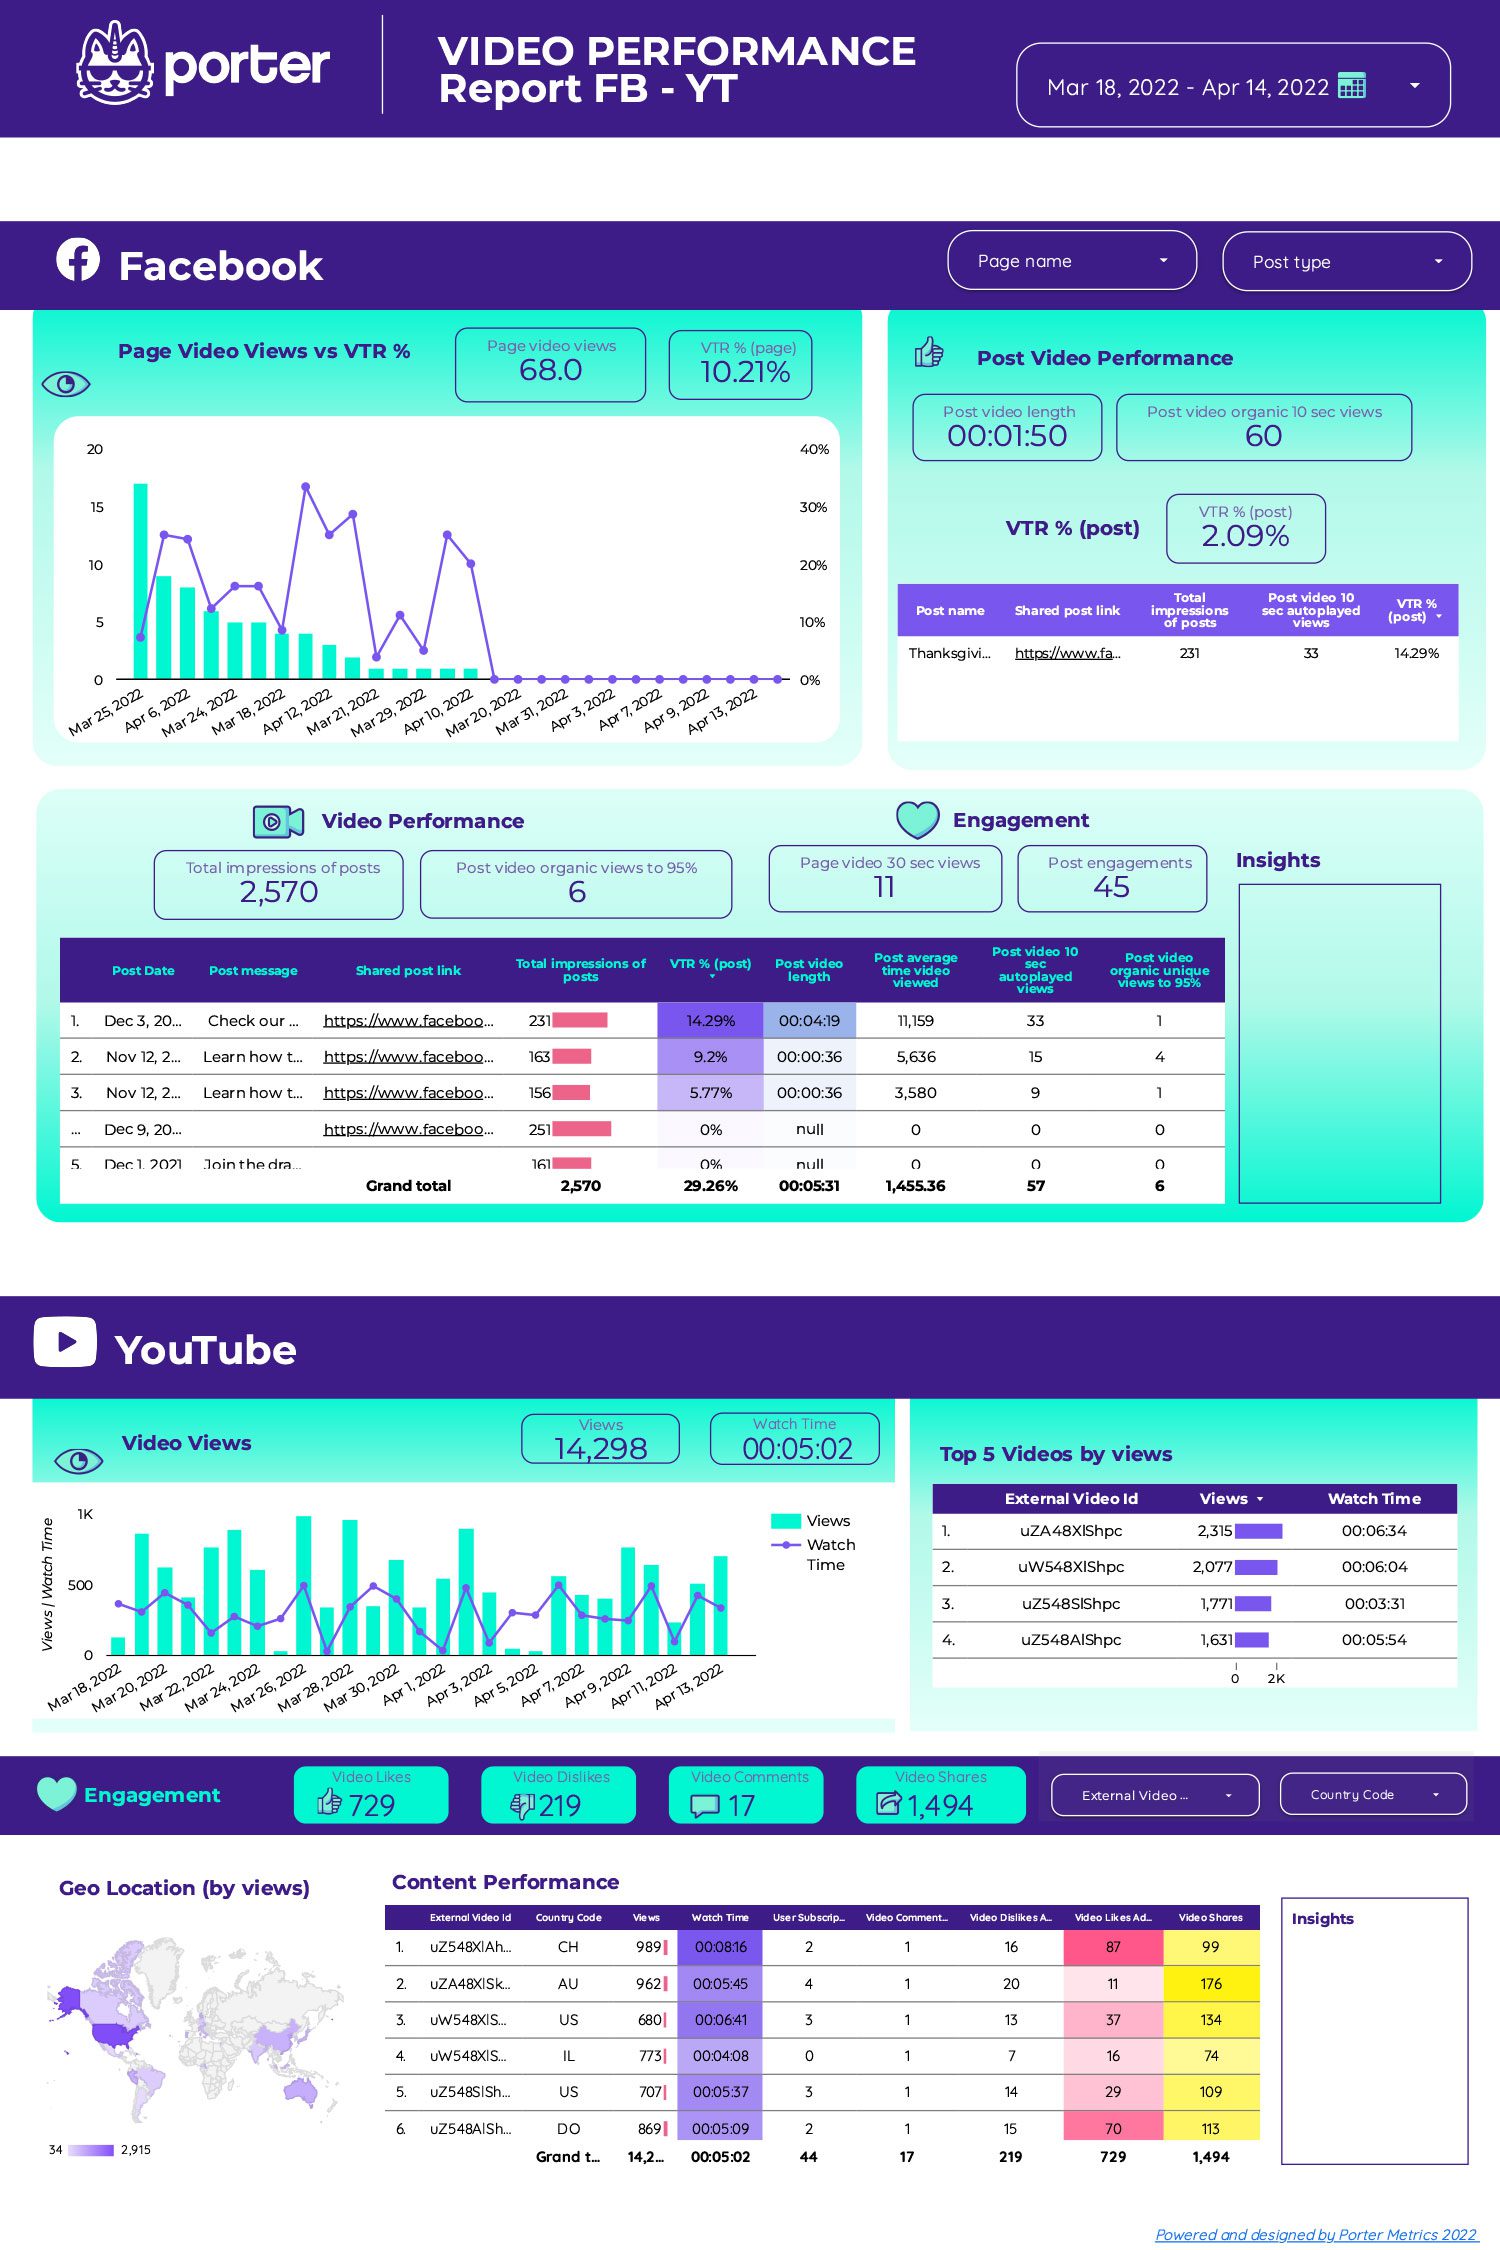
Our new report template connects Facebook Insights and YouTube to show you the impact and performance of your video content pieces. You’ll be able to see things like view-through rate, video completion rate, Facebook video engagement, and YouTube content engagement. So you can make data-driven decisions about your video marketing strategy.
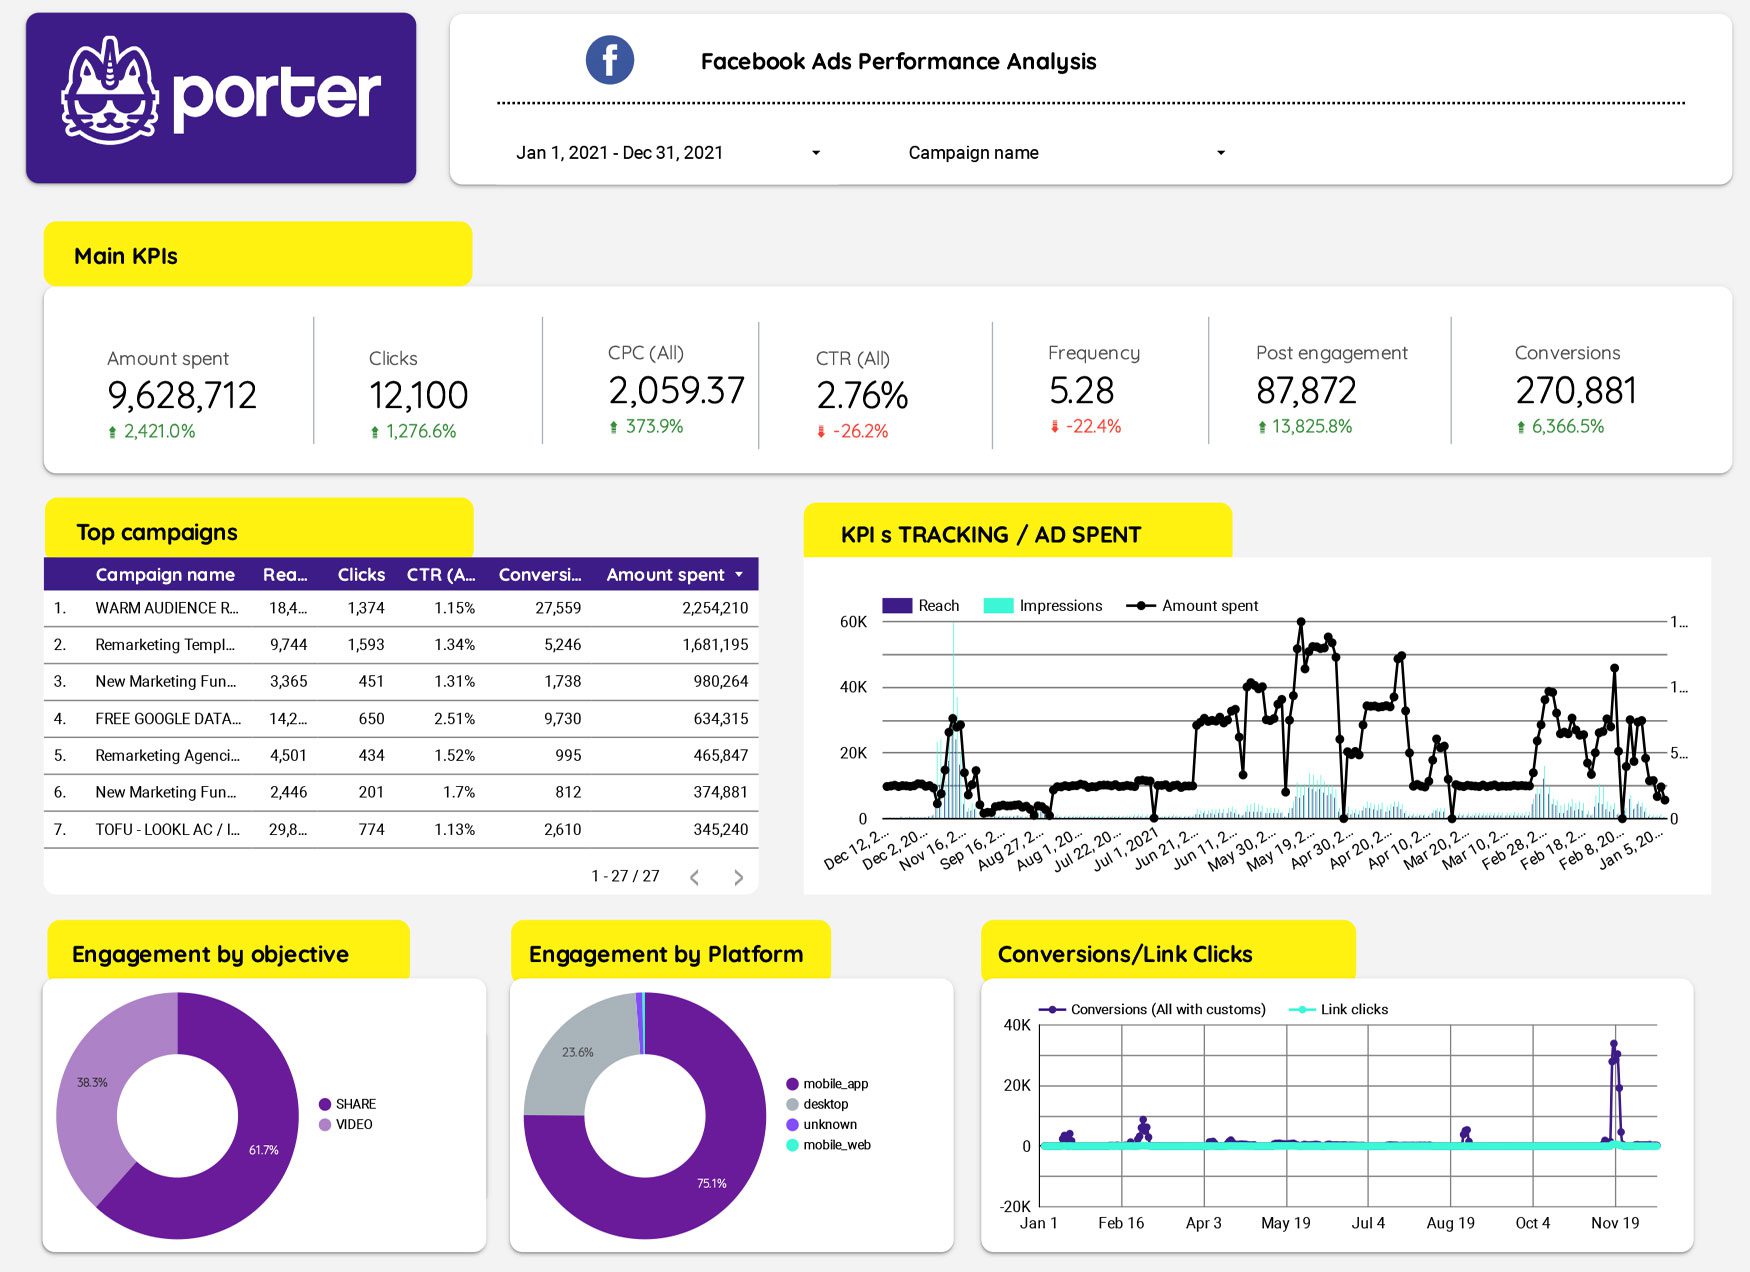
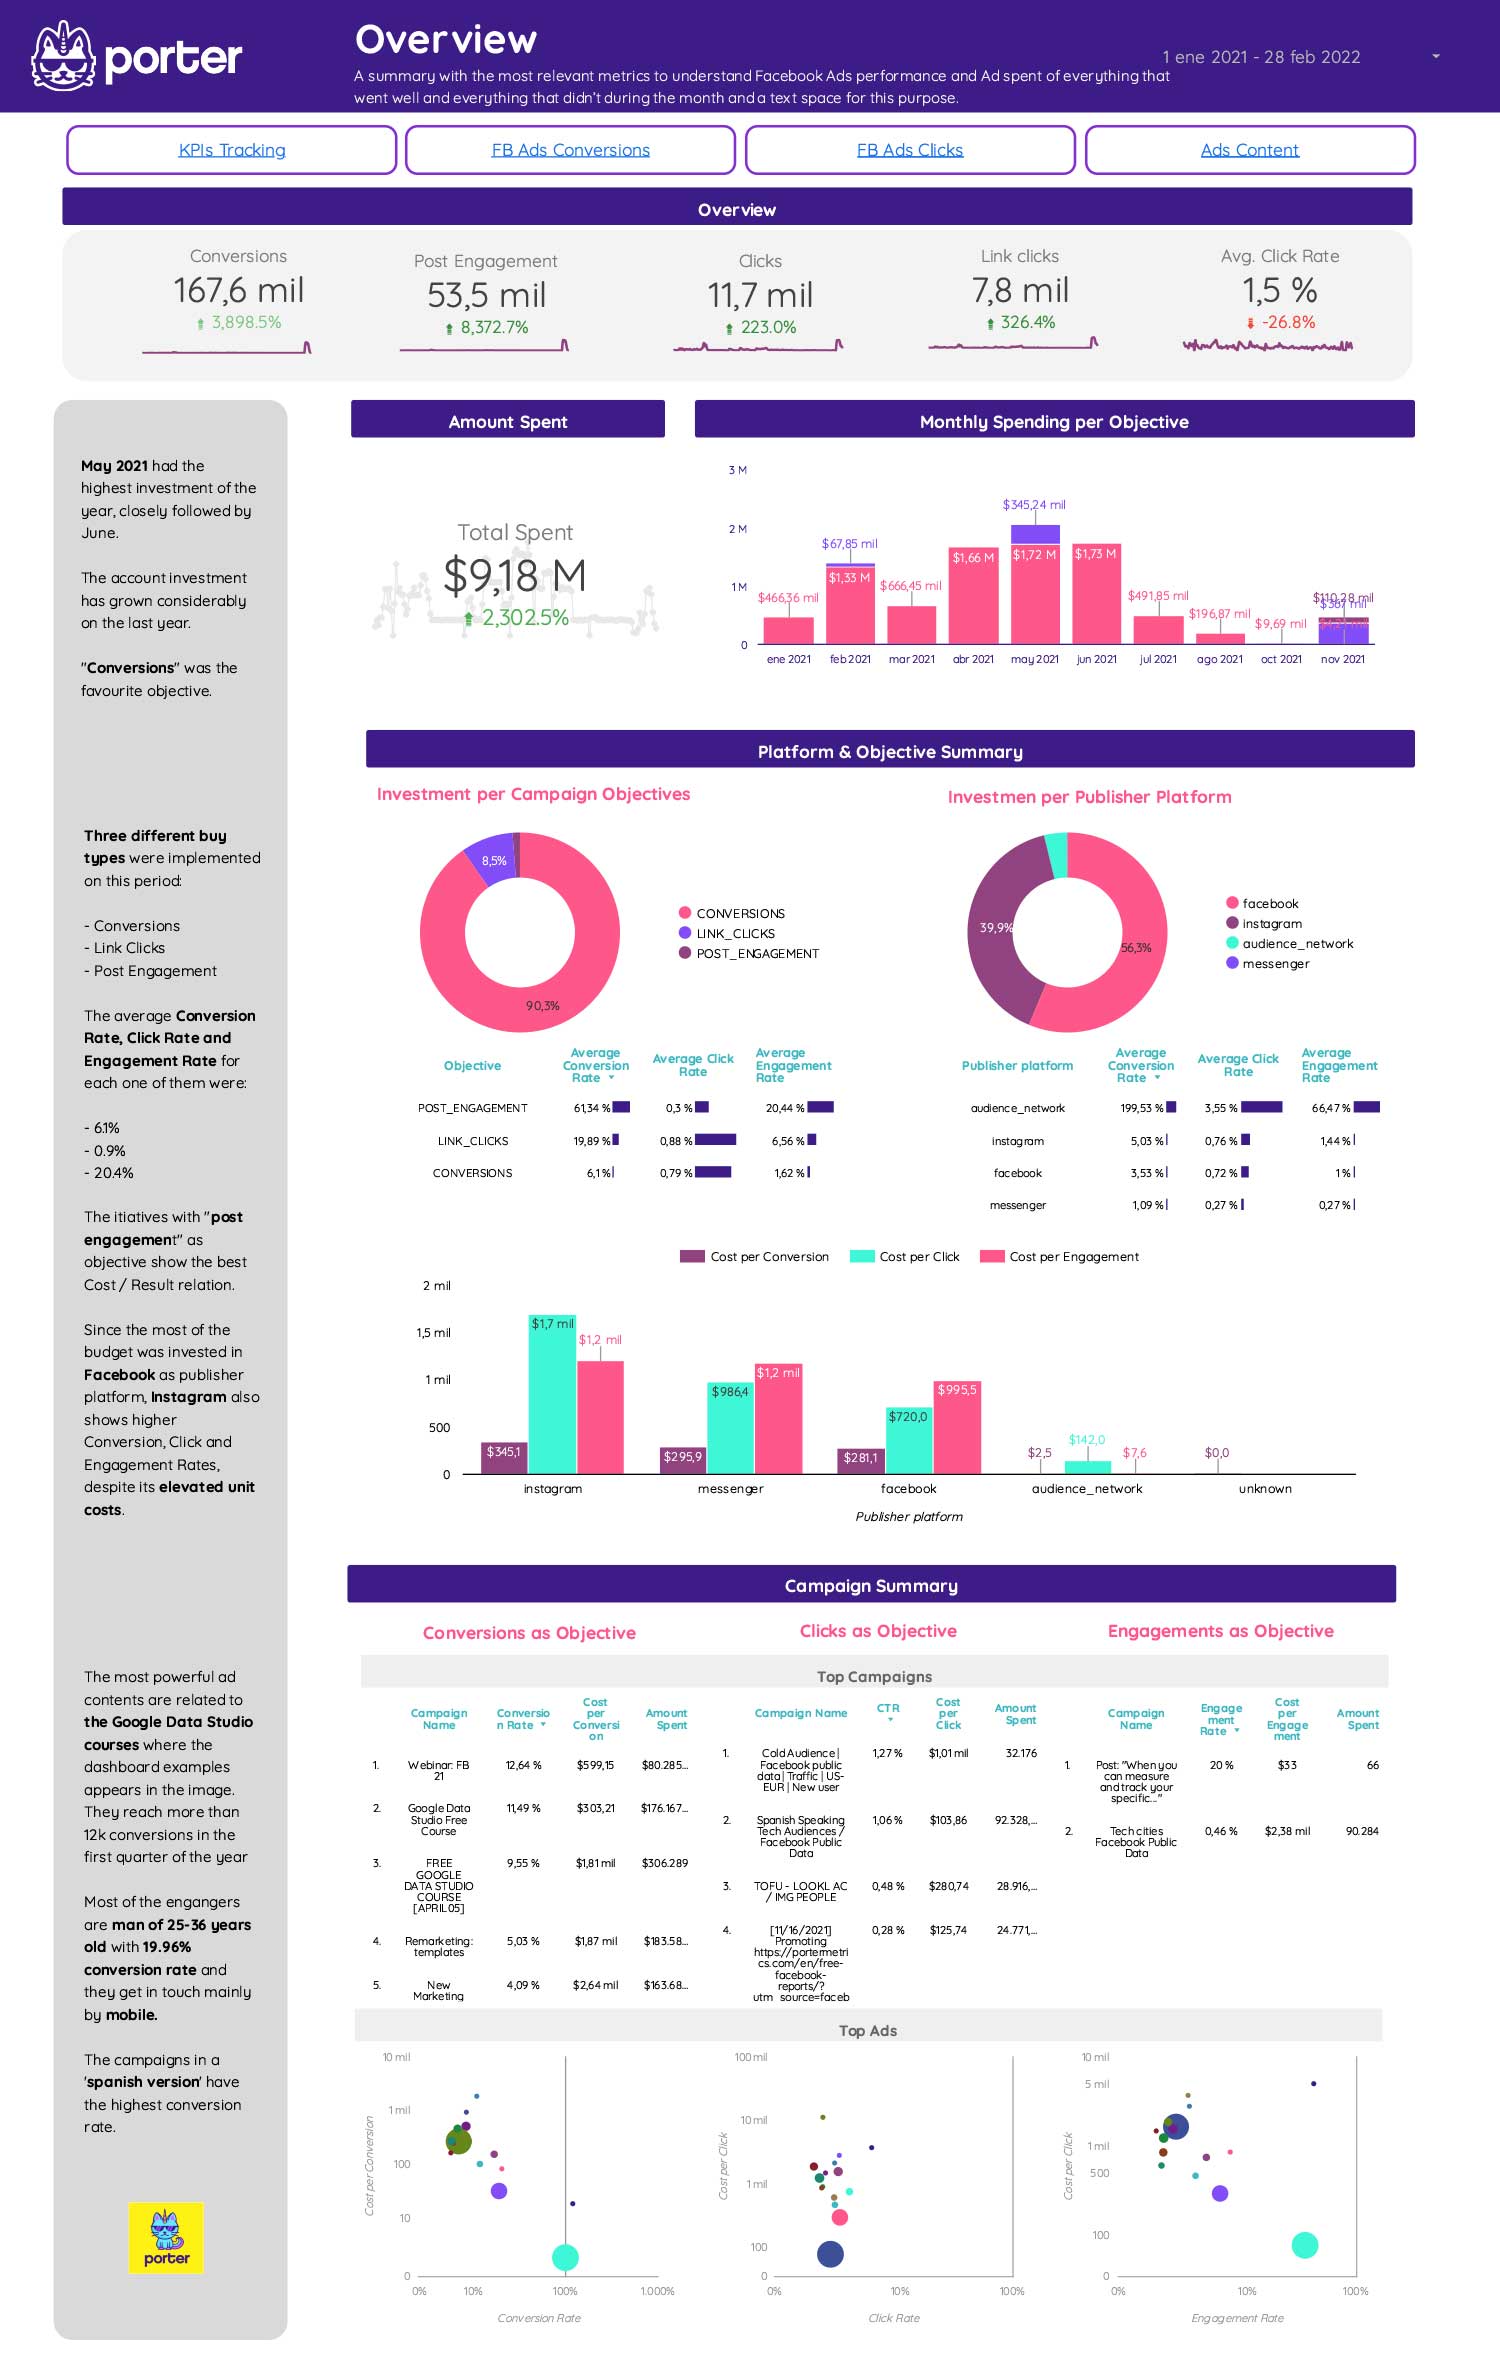
We created a free analytics report template to help you analyze and better understand your account. Simply connect your Facebook Ads account to Google Data Studio, and the template will do the rest!

With two simple steps generate automatically a full report of your Instagram profile. Read and understand the performance of your content and how your audience is growing. Track your stories and conversion metrics in a Google Data Studio dashboard.
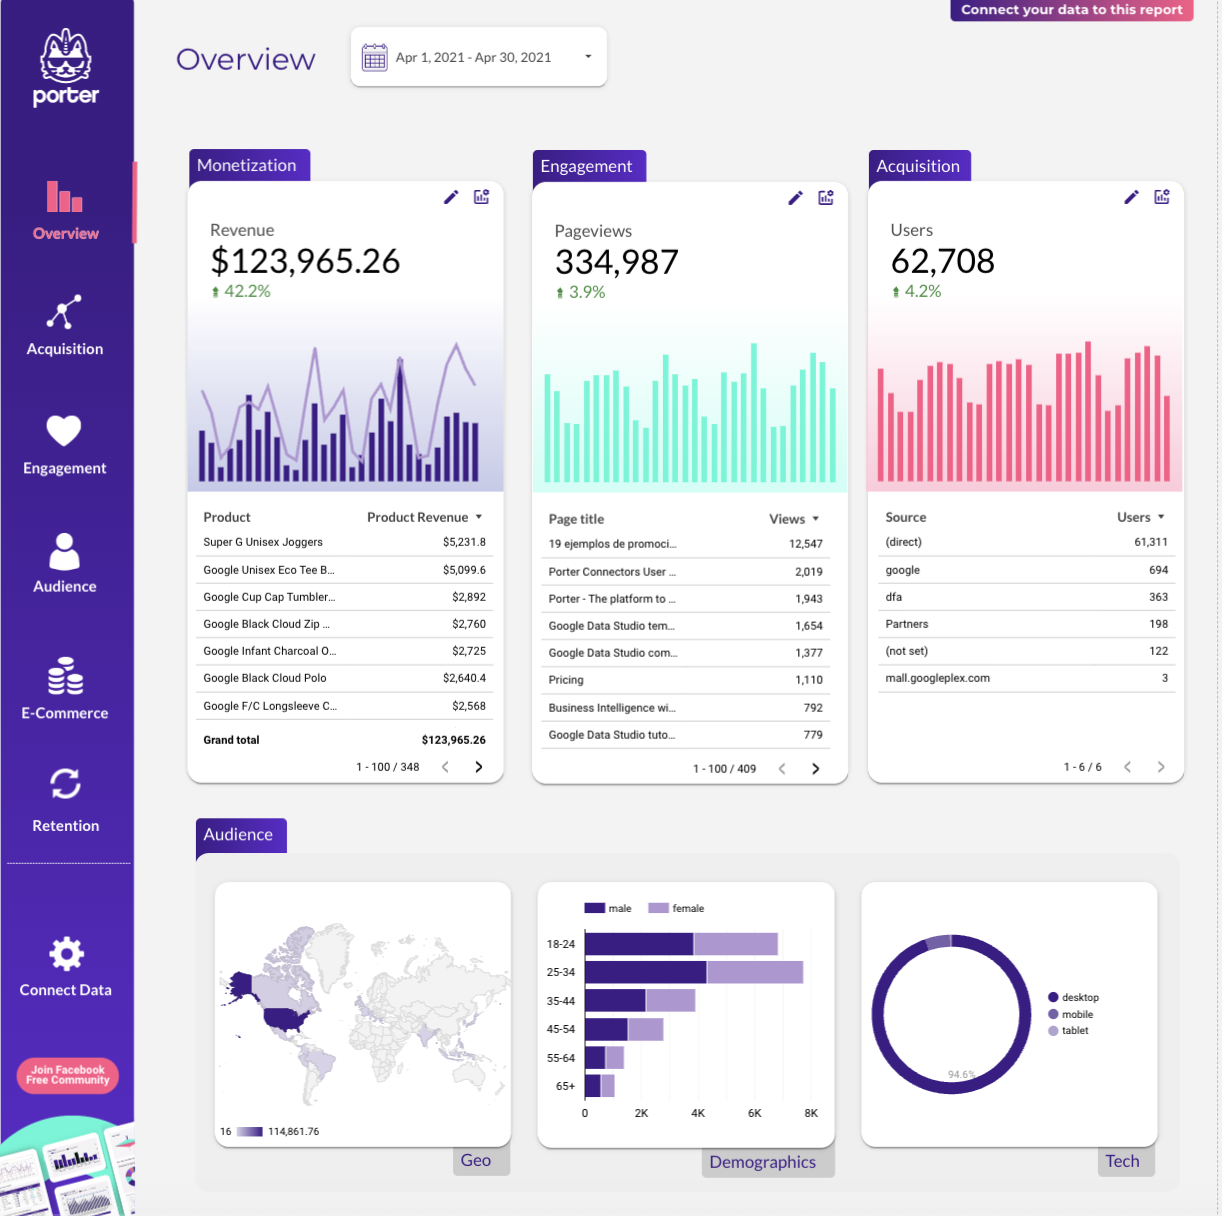
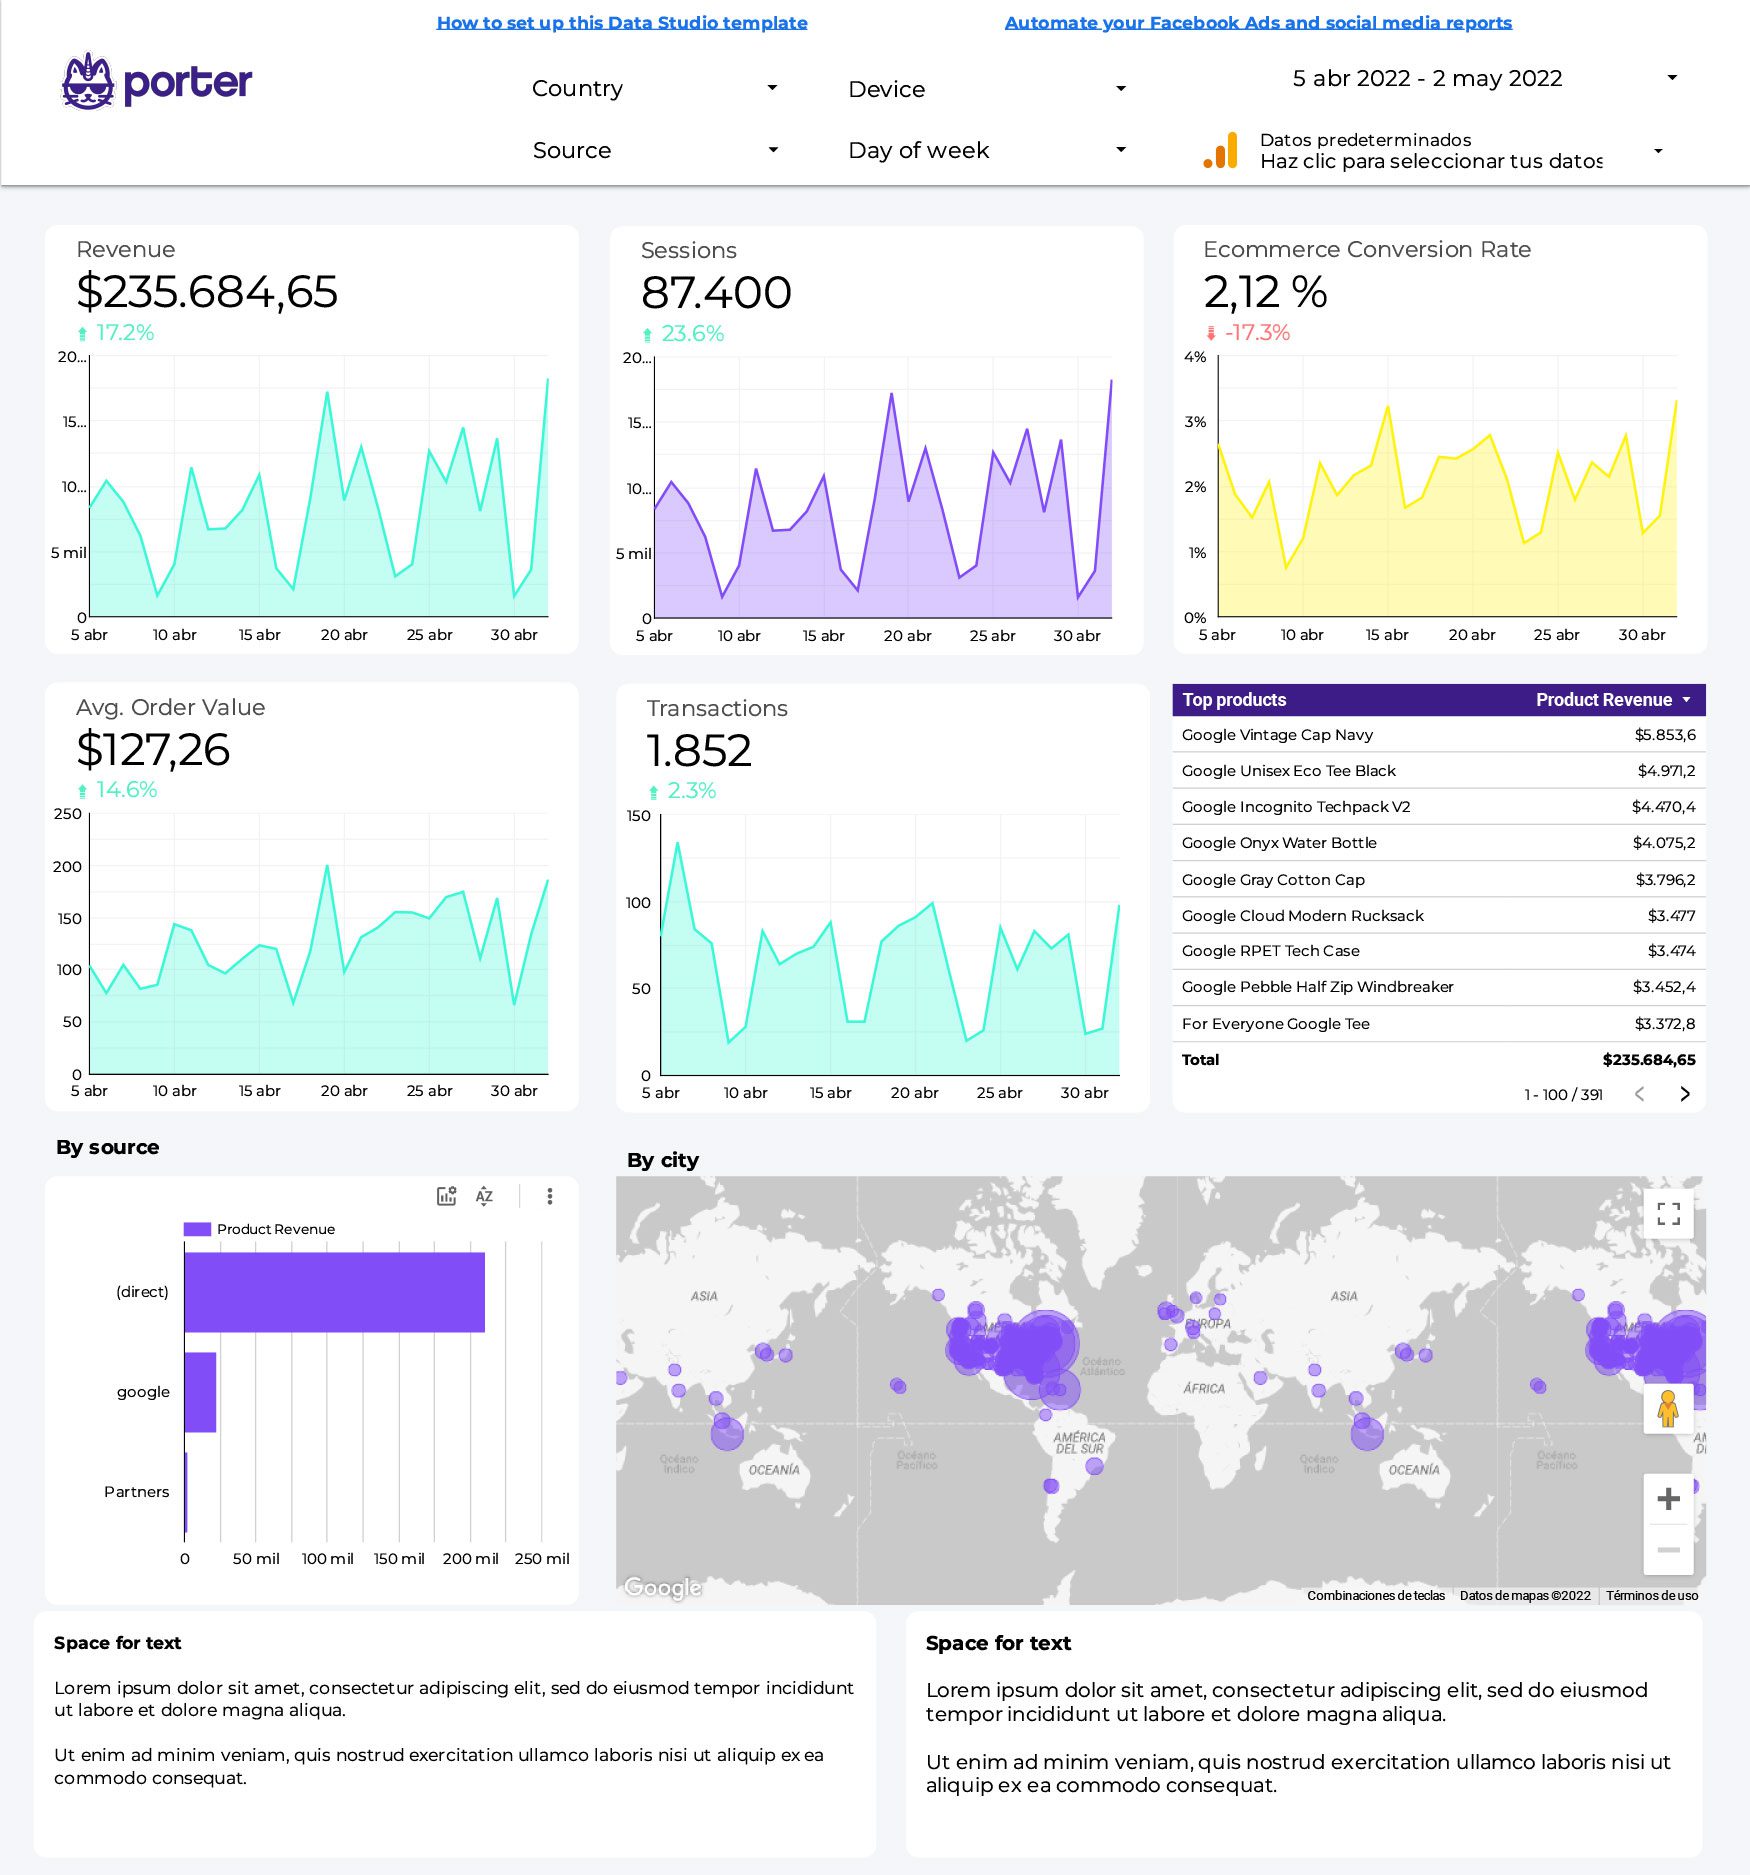
This is the ultimate digital marketing report in Google Looker Studio. Bring all of your marketing data into one place and make decisions faster.
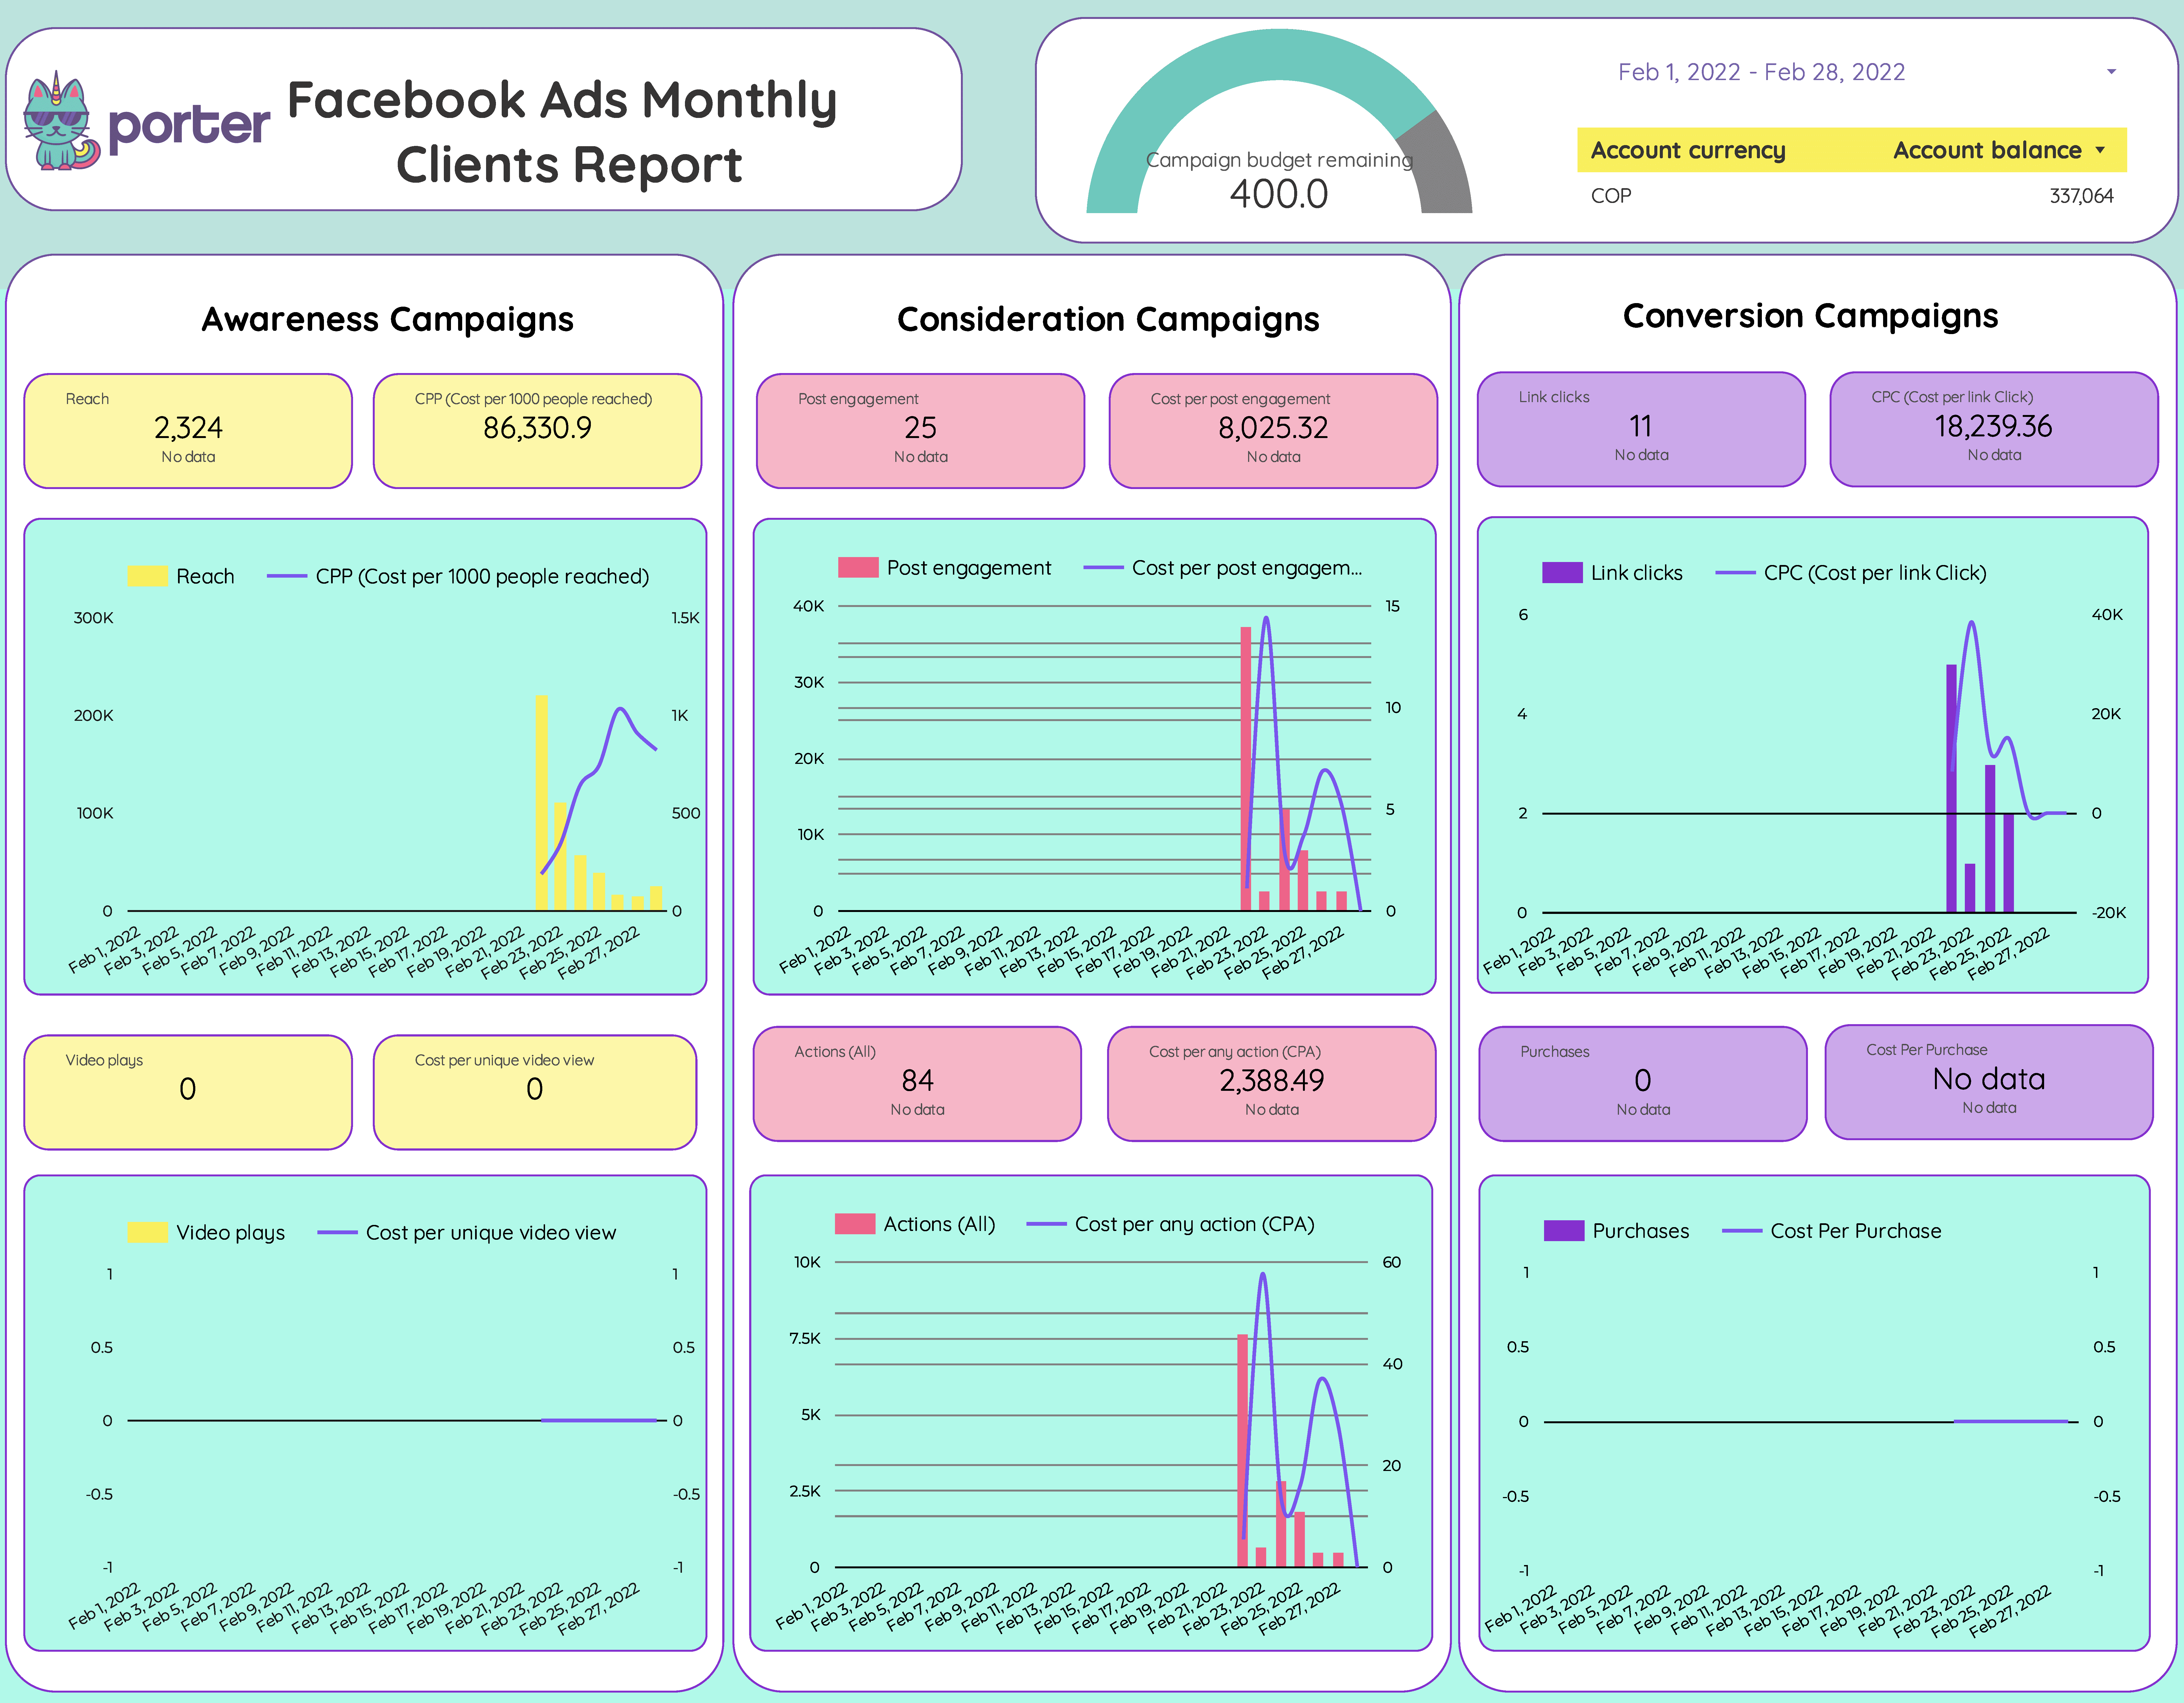
Track the most relevant Facebook Ads buying objectives and automate your monthly reporting.
To deliver a Monthly report to your clients never been so easy!
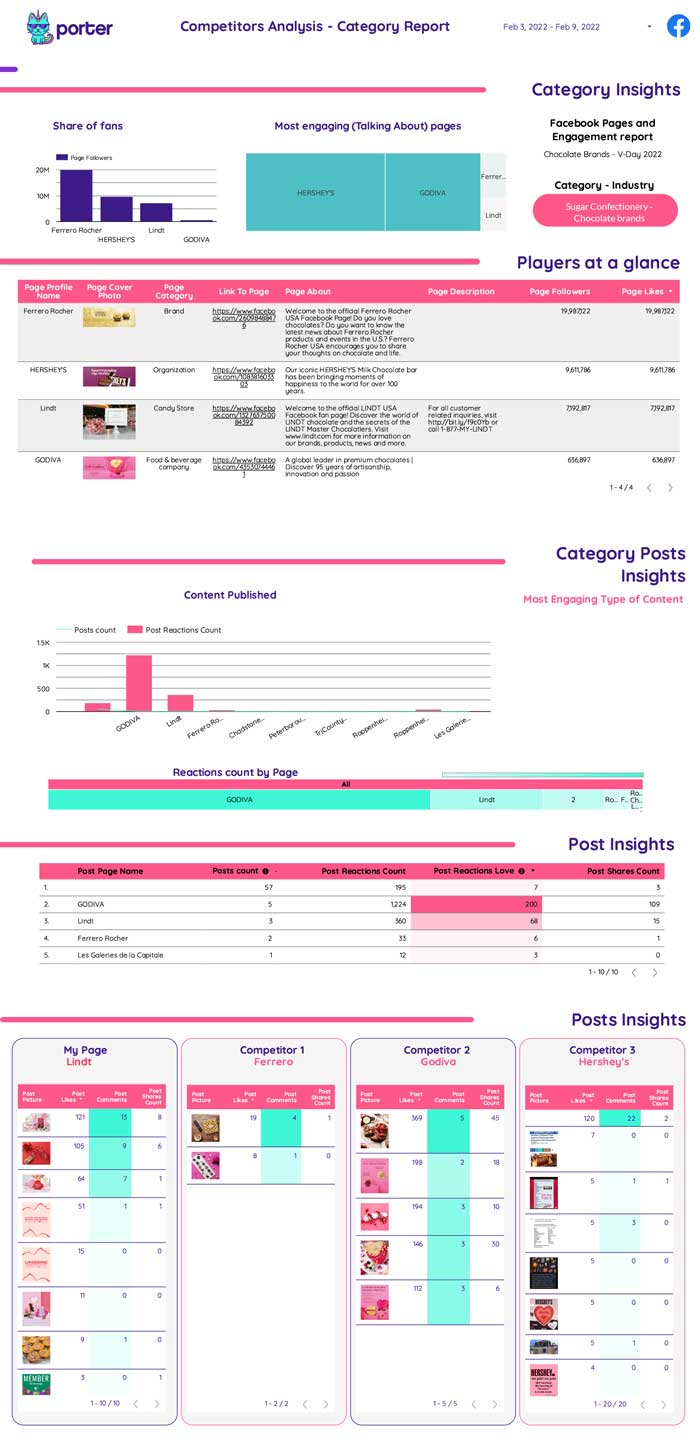
Add competitors’ pages to track information about their activity on Facebook. With this template, you can see which competitors are likely to be your biggest competition in terms of content at a glance.
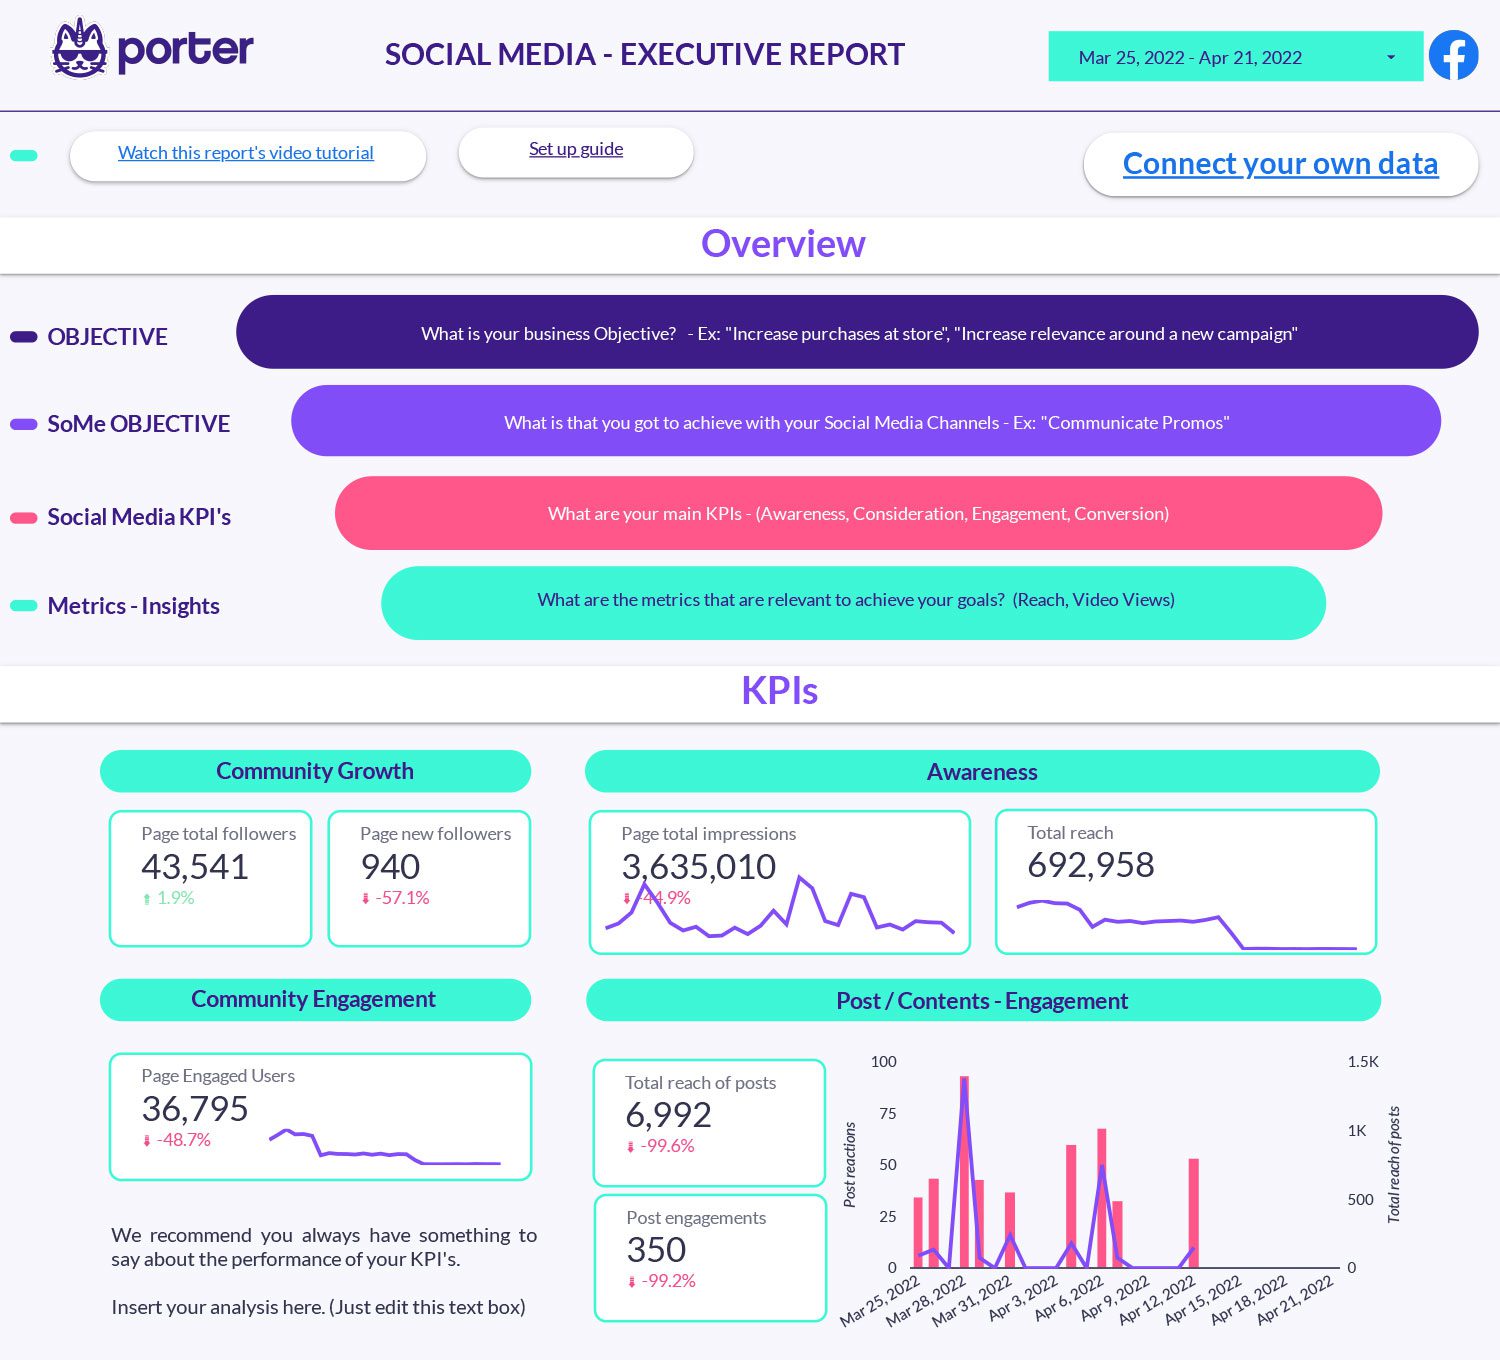
Are you measuring your Facebook Insights according to your business objectives? Track your Facebook Insights with the best visualization methodology. Keep your objectives in mind and get the best results.