


If you are looking for the best Facebook Insights report template to connect your data source and visualize your Facebook organic efforts in an interactive dashboard, this is the right place. We reviewed 16 resources we’ve found on the web.
This list was created to provide the most accurate information for marketers and analysts looking for the best visualization to display their Facebook Pages insights. We say the following are the best, based on an evaluation of 5 factors:
- Easy setup
- Analysis of data
- Actionability (How the information is displayed to provide insights to make actions around a content or marketing strategy on Facebook.
- Friendly navigation
- Use cases covered
And why 16? Only because it’s my favorite number!
Why do you need custom Facebook Insights report templates?
Facebook Insights, the native Facebook analytics platform, has many KPIs and metrics available, and that is ideal when you need to cross data to make actionable reports.
If you visit the native platform, you will see different metrics such as actions on the page, page views, page likes, post reach, story reach, and recommendations.
Unless you download the raw data, there’s no way to customize this overview to include metrics related to your business. But for most users, downloading a ginormous Excel file with thousands of fields can be a complex task to face.
However, you can review the whole picture on your Facebook pages and customize your report according to your need with a report template.
You will have a dashboard to show you specific data with charts that allow you to analyze and provide insights.
Use a report template to connect your data in just minutes and dedicate your efforts and time to high-value work instead of working on building a report from the beginning.
Five things to consider when choosing a report template
- You may be able to customize your charts and graphs
- The template should work in a platform you are already familiar with
- The report should have predefined custom metrics and KPIs according to your interests
- You should be able to create your metrics
- The report should be shareable (PDF, email, etc.)
The best Facebook Inisghits report templates to try in 2022
- Facebook Insights report template by Porter Metrics
- The perfect Facebook Insights report template by Dashthis
- Facebook Page Insights Report Template for Google Data Studio by Power My Analytics
- Comprehensive Facebook Insights Report Template by Report Garden
- Facebook Page Report (Page and Posts stats) – by Supermetrics
- All-in-one Facebook Google Data Studio Template by Porter Metrics
- Facebook Insights report template by Swydo
- Facebook Competitors Report for Google Data Studio (mobile-friendly) by Porter Metrics
- Facebook Insights Template by Coast Digital
- Facebook Page Insights Performance Template On Google Data Studio by Porter Metrics
- Facebook (Page Insights) Dashboard Template by Databox
- Social Media template on Data Studio: Facebook, Instagram, and LinkedIn by Porter Metrics
- Facebook Analytics Report Template by Whatagraph
- Facebook Insights to Google Data Studio Template by Jesper Astrom
- Social Media template: Facebook and Instagram Insights for Google Data Studio by Porter Metrics
- Social media (Facebook Insights) – Executive report by Porter Metrics
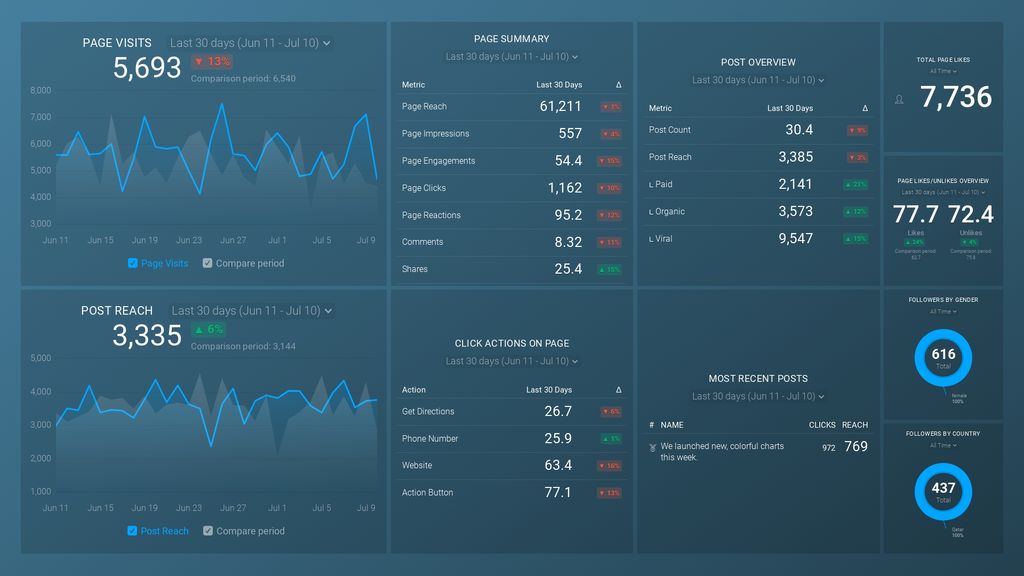
Facebook Insights report template by Porter Metrics

Facebook Insights report template by Porter Metrics is a popular and fully customizable template. It also has predefined custom metrics and KPIs.
The template offers different views such as posts, page likes, reach, engagement, etc. Porter Metrics’ Facebook Insights Report Template consists of 6 pages of detailed data:
- Page overview
- Page audience
- Content performance
- Page reactions
- Video performance
- Messenger insights
Provider: This report was created by Porter Metrics
Reporting tool: Google Data Studio
Graphics and charts included: This report contains more than 15 graphics and charts (you can customize all of them)
Price: You can use this template for free
Metrics included in the report:
- Page total impressions
- Total reach
- Frequency
- ER%
- Page total followers
- Page new likes
- Page unlikes
- Page total followers
- Page new followers
- Page new unfollows
- Page reactions
- Page video 30-sec views
- Page video views
- Page video organic views,
- VTR%
- Messaging connections
- And more!
Get this report template for free!
The perfect Facebook Insights report template by DashThis
Report Overview:
This report enables you to track your Facebook page performance and understand how your Facebook audience interacts with your content. You can also use the Facebook Insights report template from DashThis to build custom Facebook reports with your clients’ key performance indicators.
Provider: This report was created by DashThis
Reporting tool: The template works on DashThis
Graphics and charts included: This report contains about 13 graphics and charts.
Price: You can use the report for free for 15 days. Then, you can choose a plan that starts at $39
Metrics included in the report:
- Cumulative total page reach
- Daily total page reach
- Weekly total page reach
- 28 days total page reach
- Fans
- New fans
- Page unlikes
- Page stories
- Pageviews
- Post count
- Post engaged
- Post impressions
- Post organic impressions
- Post paid impressions
- Post organic reach
- Post likes
- Post comments
- Post shares
- Post clicks
- Post organic video views
- Post video views
- Post unique video views
- Post total 30sec video views
- Post-auto-played 30-sec video views
- Post organic 30-sec video views
- Reactions
- Check-ins
- And more!
See this Facebook insights report template live.
Facebook Page Insights Report Template for Google Data Studio by Power My Analytics

Report Overview:
You can easily use this template to track your Facebook Page Insights metrics. Customize it to your preferences, or cut and paste t Insights metrics you want from this template directly into your other reports.
This report template consists of 17 pages of detailed data:
- Overview
- Followers
- Likes
- Reach
- Reactions
- Page Views – Total
- Page Views – Unique
- Actions on Page
- Posts
- When Your Fans Are Online
- Videos
- Stories
- People
- People cont
- Messages
Provider: This report was created by Power My Analytics
Reporting tool: You can use this template on Google Data Studio
Graphics and charts included: This report contains more than 30 graphics and charts.
Price: You can use the report for free for 14 days. Then, you can choose a plan that starts at $9.95
Metrics included in the report:
Includes overview metrics, followers, product sales, inventory, returns, reimbursements, fees, and more.
You can run this report template if you start your trial with Power My Analytics, or if you are a paying user of this connector. Read more about this report template!
Comprehensive Facebook Insights Report Template by Report Garden

Report Overview:
This Facebook insights template by Report Garden will give you a comprehensive view of your Facebook page performance. The report includes fan growth, reach, engagement, and more data.
This report template consists of 6 pages of detailed data:
- Facebook Posts Overview
- Page Views Performance
- Page Post Impressions
- Demographic Performance
- Gender Performance
- Posts Performance
Provider: This report was created by ReportGarden
Reporting tool: The report works on ReportGarden
Graphics and charts included: Once your account is linked, the information is available.
Price: You can use the report for free for 14 days. Then, you can choose a plan between US 89 to $649.
Metrics included in the report:
- Likes
- Page Impressions
- Post Impressions
- Engaged Users
- Page Views
- Page Impressions
- Organic Impressions
- Paid Impressions
- Likes
- Comments
- Shares
- Engagement rates
- Impressions
Facebook Page Report (Page and Posts stats) by Supermetrics
Facebook Page Report overview:
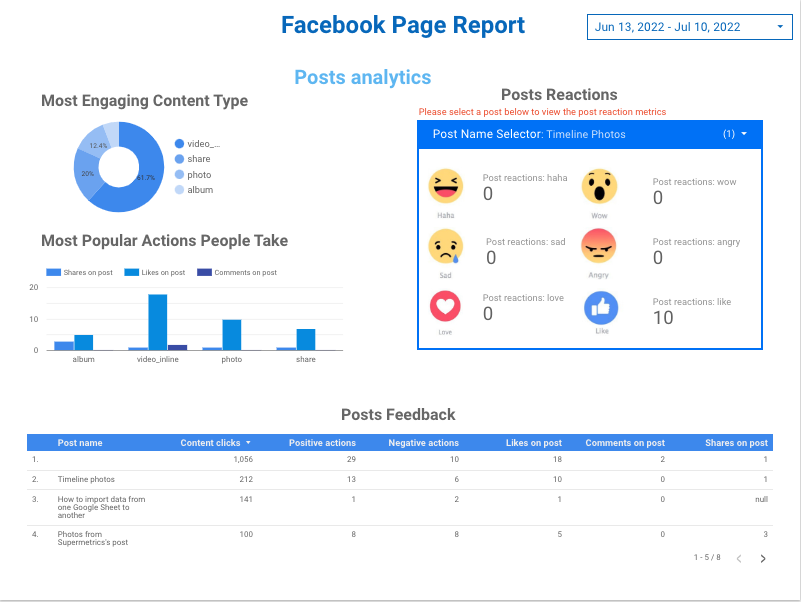
This Facebook insights template by Supermetrics gives you an overview of your Facebook page and posts. The report includes data such as page likes, reach, engagement, and more.
This report template consists of 3 pages of detailed data:
- Funnel overview
- Page analytics
- Posts analytics
Provider: This report was created by Supermetrics
Reporting tool: The report will work on Google Data Studio
Graphics and charts included: This report template includes about 17 graphs and charts
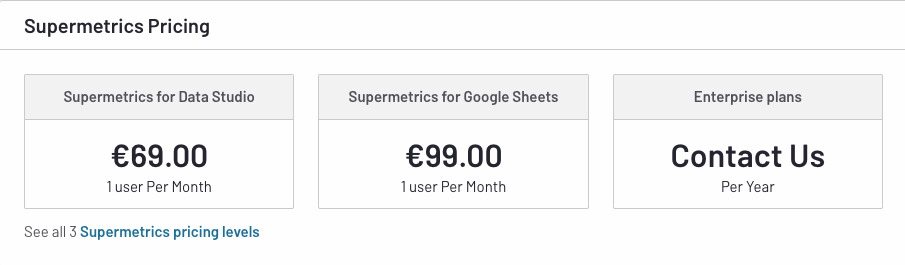
Price: You can use the report for free for 14 days. Then, you can choose a plan between US 89 to $579.
Metrics included in the report:
- Total impressions
- Content clicks
- Likes
- CTR
- Likes per click
- Reach
- Total impressions
- Content clicks
- Likes
- CTR
- Likes per click
- Reach
- Negative actions
- Positive actions
- Shares on post
- Comments on post
- Post reactions.
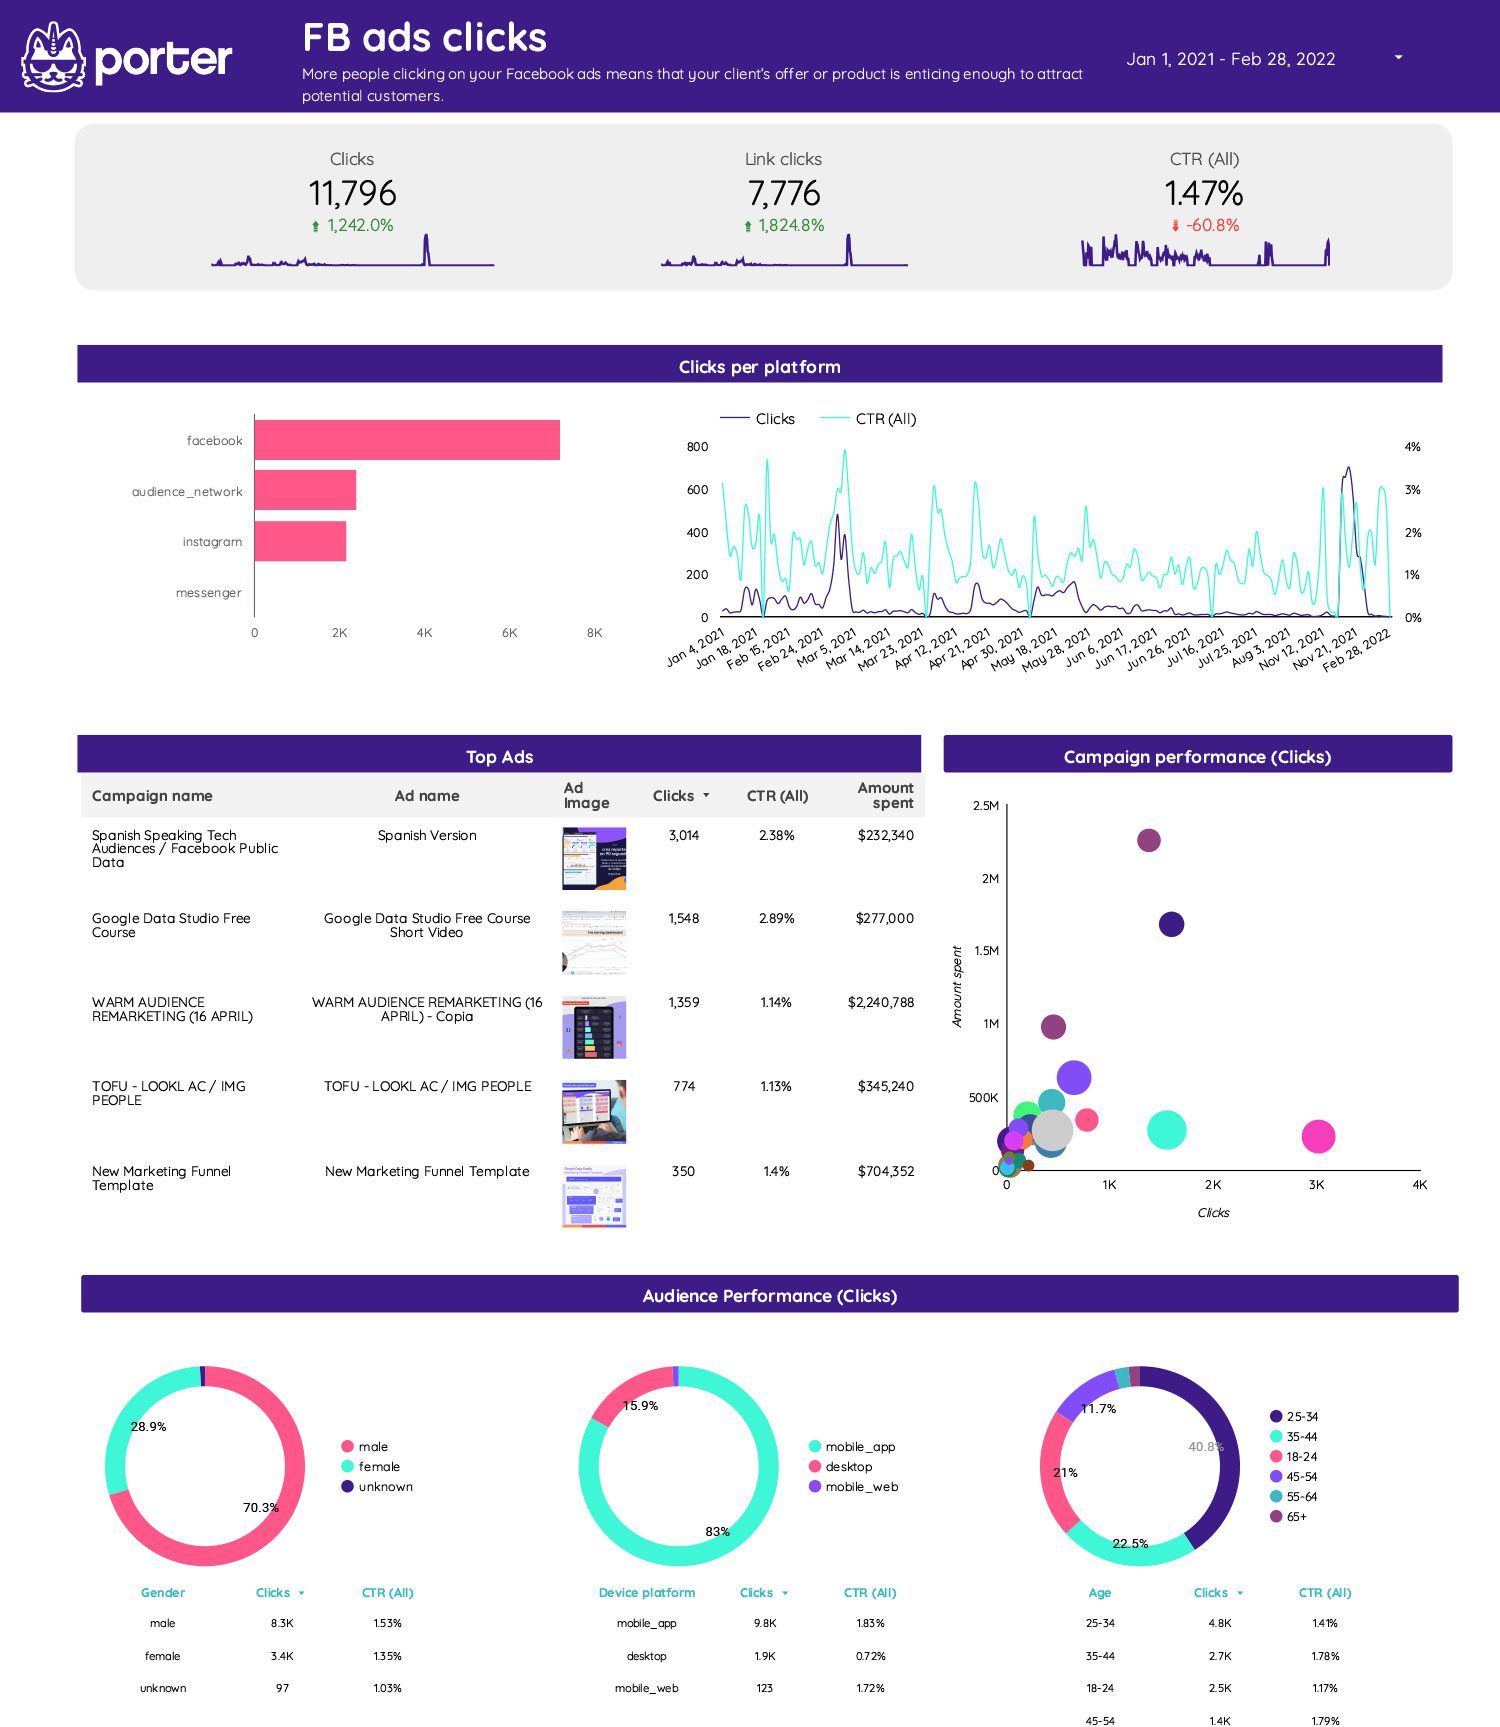
All-in-one Facebook Google Data Studio Template by Porter Metrics

This is a complete report template where you can visualize all your Facebook and Instagram, Organic and Paid efforts at a glance. Make a copy to track your Facebook Ads, Facebook Insights, and Instagram Insights results in just one place.
- Track your engagement and your organic strategy. Go from general results to a specific analysis of your best posts and performance.
- Track your organic and paid growth
- Track your Facebook Ads Conversions, Costs, and best ads
This report consists of a complete page with three blocks of data:
- Facebook Insights data.
- Instagram Data.
- Facebook Ads data.
Provider: This report template was created by Porter Metrics
Reporting tool: The template works on Google Data Studio
Graphics and charts included: The report contains about 28 graphics and charts. (You can customize all of them)
Price: This report template free
Metrics included in the report:
Facebook Insights data:
- New followers
- Total reach
- Messages
- Total reactions
- Viral reach
- Total comments
Instagram Insights data:
- New followers
- Profile views
- Profile reach
- Total likes
- Posts engagements
- Total comments
- Total post saves
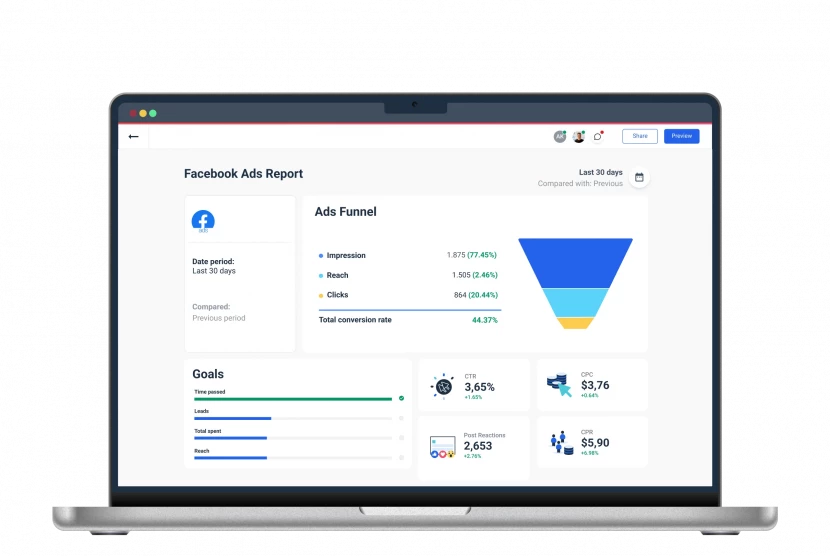
Facebook Ads data:
- Impressions
- Reach
- Amount spent
- Click
- Landing page views
- Messages
- CTR
- CPC
- Conversion
Use this report template for free!
Facebook Insights report template by Swydo

Swydo’s pre-made templates help you save time by shortening the report production process so you may focus on analyzing data and offering your clients the insights they require. If you are a Swydo user, you have probably used this one.
You can use this Facebook Insights report template to track the performance of your Facebook page and posts. The template includes data such as page likes, reach, engagement, and more.
Provider: The Facebook insights report template was created by Swydo
Reporting tool: The Facebook insights report template works only with Swydo
Graphics and charts included: You need to drag and drop your graphics and charts once you are on the platform.
Price: You can use the report for free for 14 days. Then, you can choose a plan starting at $39
Metrics included in the report:
- Consumptions
- Engaged users
- Fans online
- Impressions
- Lifetime likes per age and gender
- Lifetime page likes
- Negative feedback
- New page likes
- Page likes by source
- Pageviews
- Positive feedback by type
- Post reach
- Posts impressions
- Reach
- Removed fans
- Storytellers
- And more!
Facebook Competitors Report for Google Data Studio (mobile-friendly) by Porter Metrics
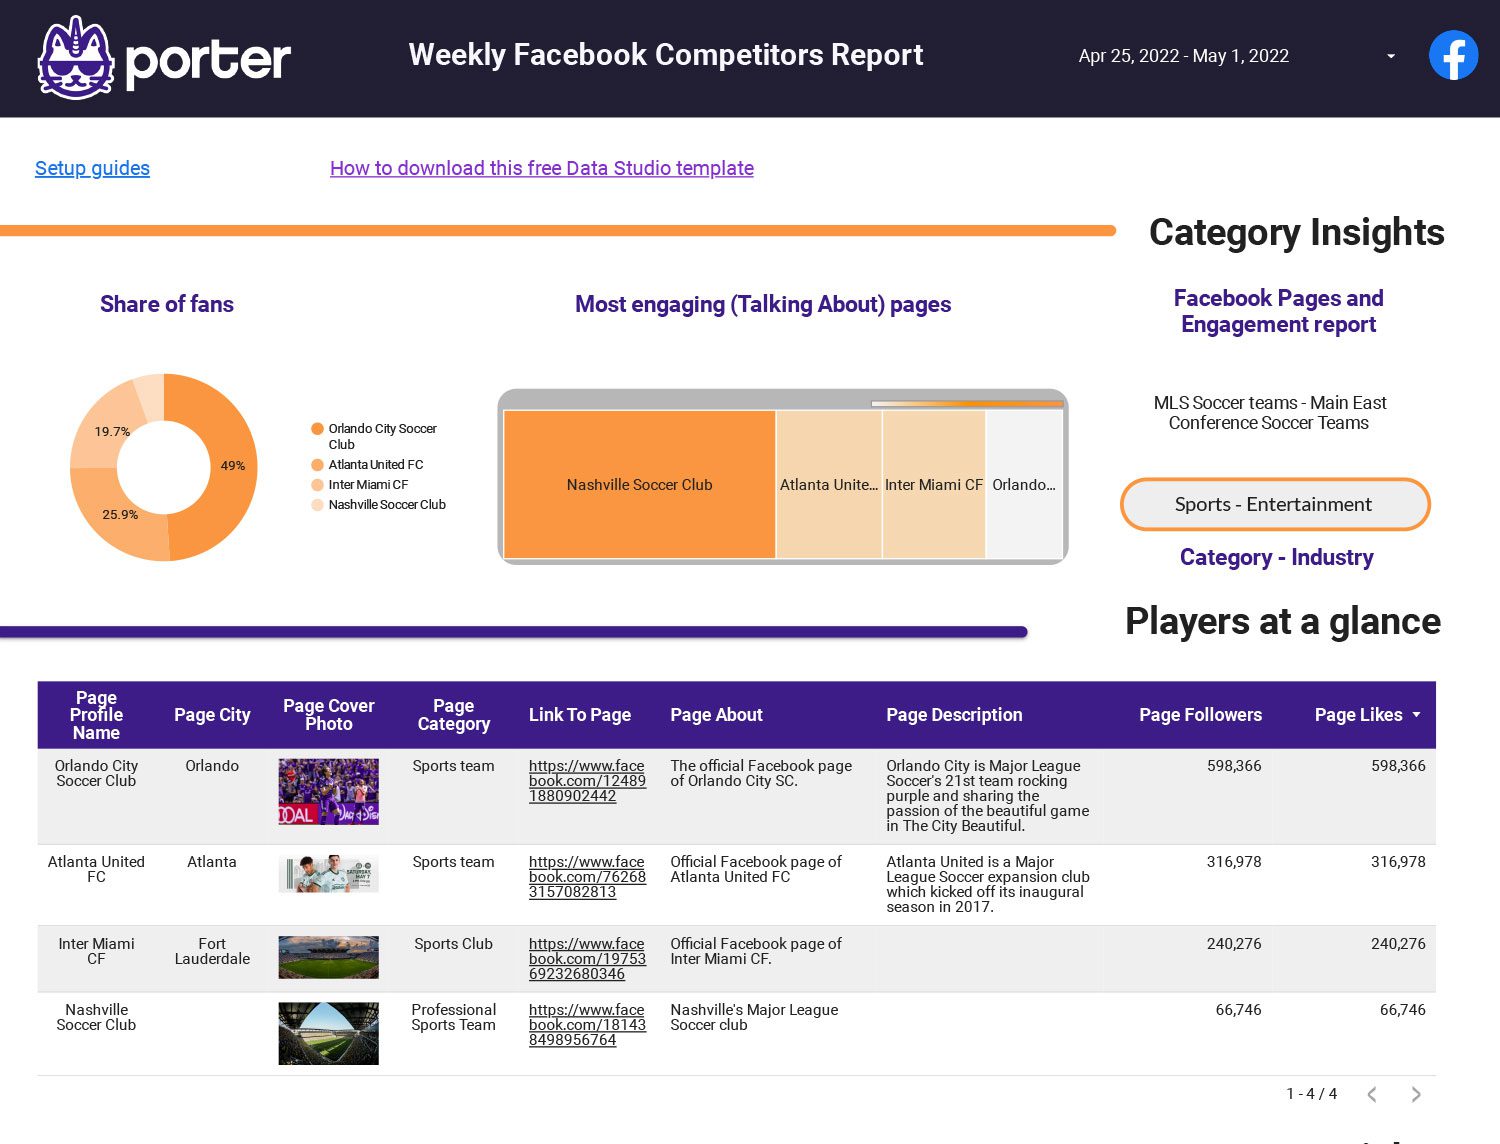
Facebook Competitors report overview:
This Facebook Competitors Report for Google Data Studio is a great template if you want to track and compare your Facebook performance against your top competitors. The report includes tables and graphs of Facebook page likes, posts, engagement, reach, and more!
This report was designed to fit in a mobile device screen. But in case you want the same report with more charts to visualize and track your competitors’ data for free, use this shortcut to the Porter Metrics Facebook Competitors Analyzer.
Provider: This report was created by Porter Metrics
Reporting tool: Google Data Studio
Graphics and charts included: This report contains about ten graphics and charts (you can customize all of them)
Price: You can use this template for free and the Facebook Public Data connector too. Try them now!
Metrics included in the report:
- Page Followers, Fans, Category, and People Talking About
- Post Engagements: compare the post your competitors have made in a table in a time range. We recommend tracking data weekly to improve your content strategy on Facebook.
- Pull and report Facebook Pages data by only typing the account name you want to report.
Use this report template for free!
Facebook Insights Template by Coast Digital
The insights template by Coast Digital is a great way to analyze your Facebook page activity. This template contains two pages.
The first page gives you information on key stats, such as the age and gender of your audience and how your posts perform. The second page provides more detailed information about your posts’ metrics.
Provider: This report was created by Coast Digital
Reporting tool: Google Data Studio
Graphics and charts included: This report includes about 20 graphics and charts.
Price: you can access the report for free but requires a third-party connector such as Supermetrics or Porter Metrics.
Metrics included in the report:
- Page new likes, unlikes, and net likes.
- Page followers,
- Impressions,
- Reach,
- Likes,
- Shares,
- Comments,
- Reactions
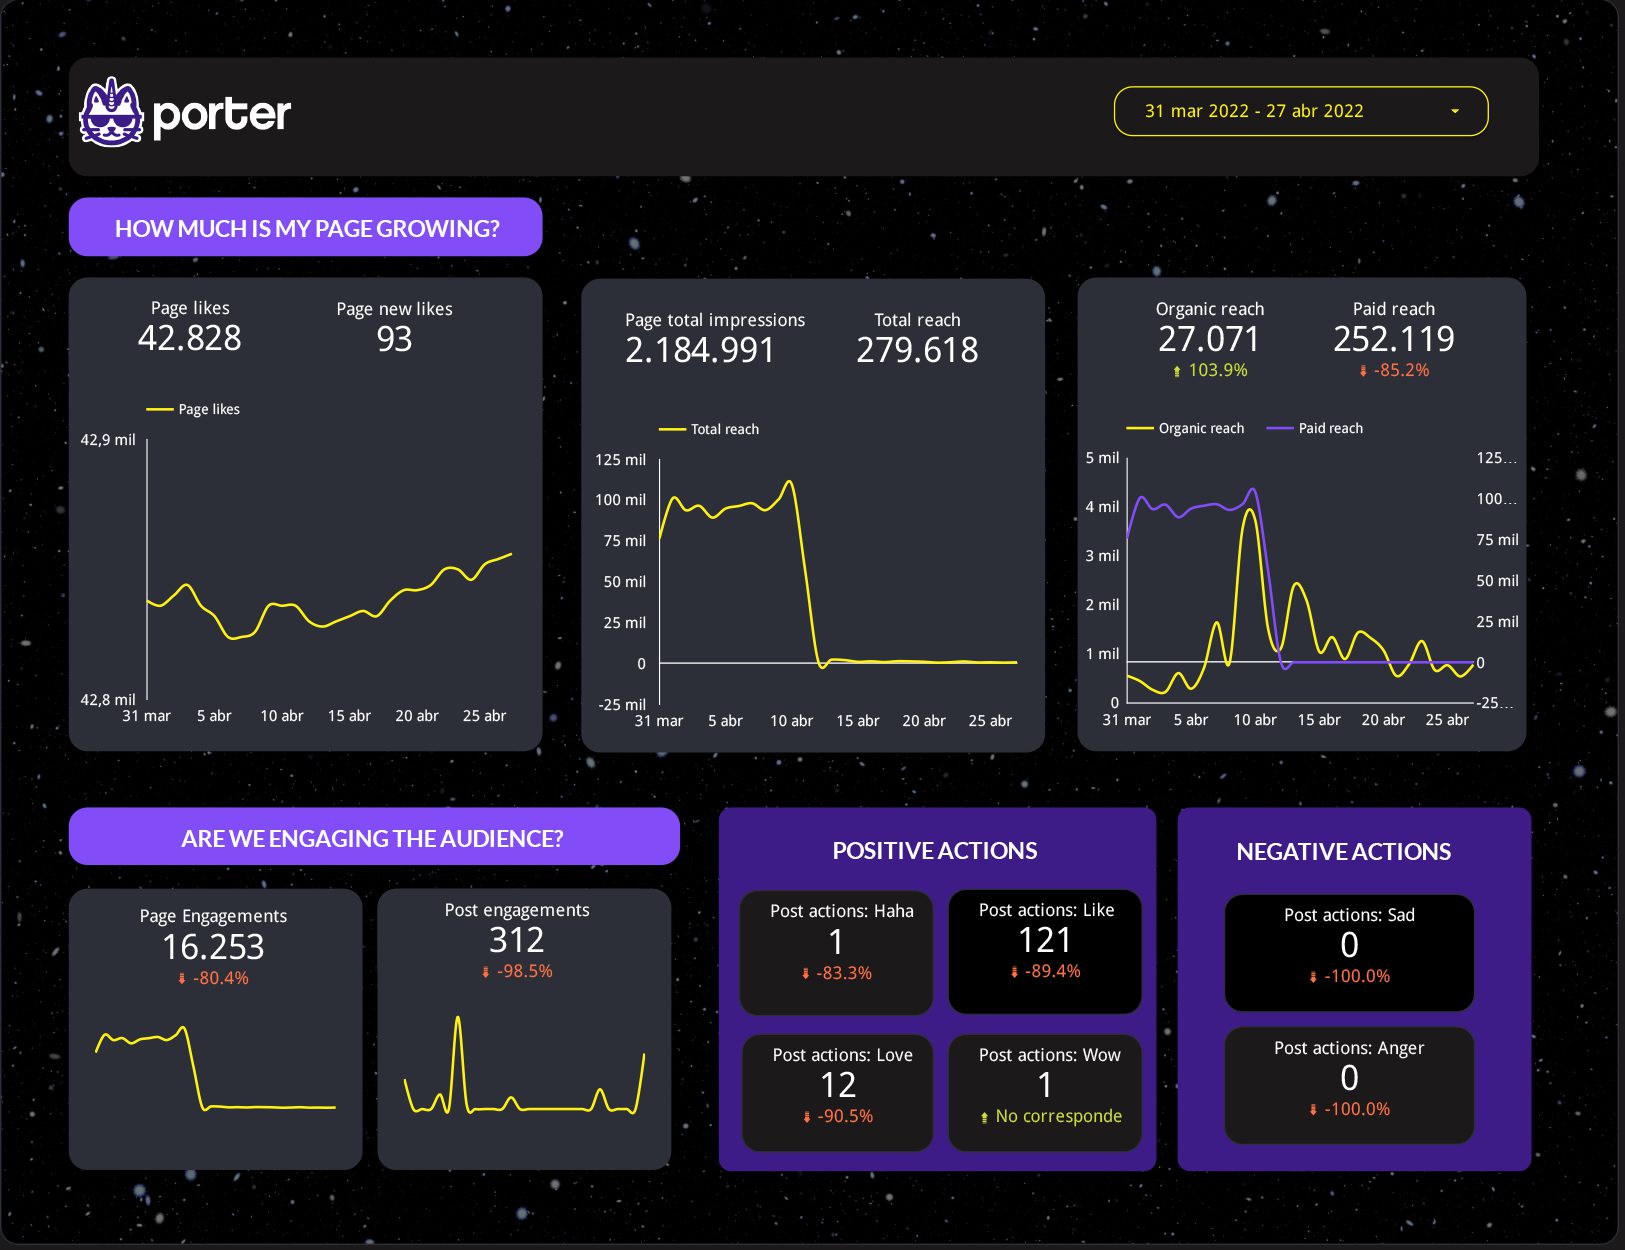
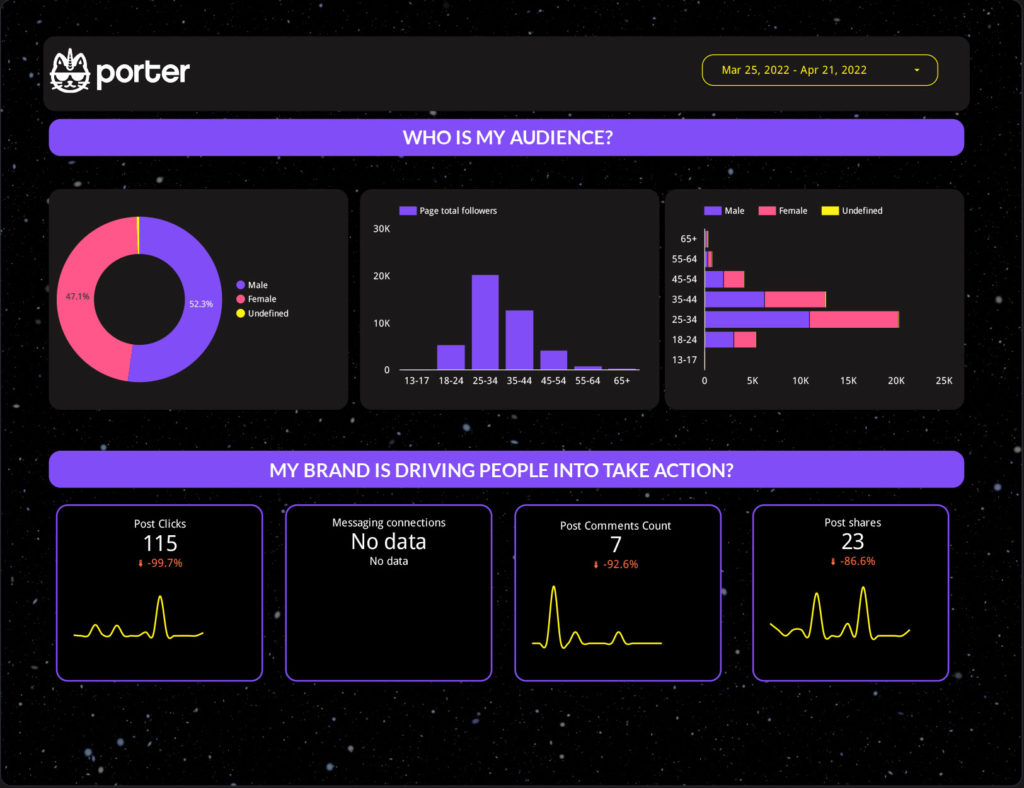
Facebook Page Insights Performance Template On Google Data Studio by Porter Metrics

This Facebook Page Insights Performance Template is perfect for tracking your Facebook page performance daily, weekly, or monthly.
Use this template to answer your most significant growth, audience, and post engagement questions.
This report template consists of 3 pages:
- Page growth & Engagement
- Demographics & Actions
- Post Analysis
Provider: This report was created by Porter Metrics
Reporting tool: Google Data Studio
Graphics and charts included: This report contains about 24 graphics and charts (you can customize all of them)
Price: You can use this template for free

Metrics included in the report:
- Page total likes
- Page new likes
- Page total impressions
- Page total reach
- Organic reach
- Paid reach
- Page engagements
- Post engagements
- Post reactions
- Page total followers
- Post clicks
- Messaging connections
- Post comments count
- Post shares
Use this report template for free!
Facebook (Page Insights) Dashboard Template by Databox
The Facebook (Page Insights) Dashboard Template by Databox is a great way to quickly visualize your Facebook page performance.
You may use this Template to discover important information about your Facebook page.
Keep track of significant indicators such as page views, click actions on the page, total page likes, follower stats and demographics, and more!
- Provider: The Facebook insights report template was created by Databox
- Reporting tool: The Facebook insights report template works with Databox
- Graphics and charts included: You need to drag and drop your graphics and charts once you are on the platform.
- Price: You can create a free-forever account with 3 Data Source Connections, or you can choose a plan that starts at $72
Metrics included in the report:
- Page engagement
- Page likes
- Total page likes
- Page shares
- Pages check-ins
- Pages impressions-paid
- Post published
- Page impressions
- Post impressions
- Page view
- Page Impressions-organic
- Page comments
- Page clicks
- Post reach
- Net likes
- 3-second video views
- Post impressions-viral
- Post impressions-organic
- Post impressions-paid
- New page likes
- Post impressions by post
- Post reach by post
- Post clicks by post
- Post engaged users by post
- Post engaged fans by post
- Post likes by post
- Post reach-organic
- Page reactions
- Actions on-page
- And more!
Social Media template on Data Studio: Facebook, Instagram, and LinkedIn by Porter Metrics

Track your social media results, growth over time, reach, conversions, engagement, and more.
- Get a better understanding of your social media growth.
- Are you engaging with your audience? Track your overall engagement rate and break it down by post.
- Are you growing your audience? track the number of new followers and your growth over time
- Understand your posts performance and what’s resonating with your audience.
This report template consists of 4 pages:
- Social media overview
- Instagram posts
- Facebook posts
- LinkedIn Posts
- Provider: This report was created by Porter Metrics
- Reporting tool: Google Data Studio
- Graphics and charts included: This report contains about 18 graphics and charts (you can customize all of them)
- Price: You can use this template for free
Metrics included in the report:
This report includes different metrics according to each platform. You can find metrics such as:
- Reach
- Custom button clicks
- Shares
- Post engagement
- Post reach
- Post clicks
- Post shares
- Taps on website link
Use this report template for free!
Facebook Analytics Report Template by Whatagraph
Report Overview:
This is a simple Facebook analytics report template that includes all of the information you’ll need. Whatagraph created this template to provide data on metrics such as page views, clicks, engagement, post reactions, demographic information, and post-performance.
- Provider: This report was created by Whatagraph
- Reporting tool: The template works on Whatagraph
- Graphics and charts included: This report template includes 10 different graphics and charts.
- Price: You have a 7-days free trial to use this report template, and then you can choose a plan for $119 (1 user) and $549(10 users).
Metrics included in the report:
- Reach broken down by type
- Pageviews
- Page clicks
- Post-performance
- Post clicks
- Post impressions
- Post likes
Facebook Insights to Google Data Studio Template by Jesper Astrom

Report overview:
The Facebook Insights to Google Data Studio template by Jesper Astrom imports Facebook insights data into a Google Data Studio report. You need to download your data into a spreadsheet and then import it to Data studio to use this template.
Here is a tutorial to show how to use the template
- Provider: This report was created by Jesper Astrom
- Reporting tool: The template works on Google Data Studio
- Price: You can use the template for $3.
Note: You can also use this report template with a third-party connector such as Porter Metrics
Metrics included in the report:
- Likes
- Unlikes
- Post reach
- Engagement
- Content-type
Social Media template: Facebook and Instagram Insights for Google Data Studio by Porter Metrics

Visualize your Facebook Insights and Instagram Insights performance. Understand what drives your page growth, best posts, and audience.
- Track your Facebook Insights, and Instagram Insights results in one template.
- Track your social media growth
- Get a deeper understanding of your best posts and improve your audience engagement.
- Understand your audience: age and gender.
- Track your Facebook Ads Conversions, Costs, and best ads.
Provider: This report was created by Porter Metrics
Reporting tool: Google Data Studio
Graphics and charts included: This report contains about 32 graphics and charts (you can customize all of them)
Price: You can use this template for free
Metrics included in the report:
You can use this report template to find data related to Facebook and Instagram insights, such as:
- New followers
- Total reach
- Messages
- Total reactions
- Viral reach
- Total comments
- Profile views
- Profile reach
- Total likes
- Posts engagements
- Total comments
- Total post saves
Try this report template for free!
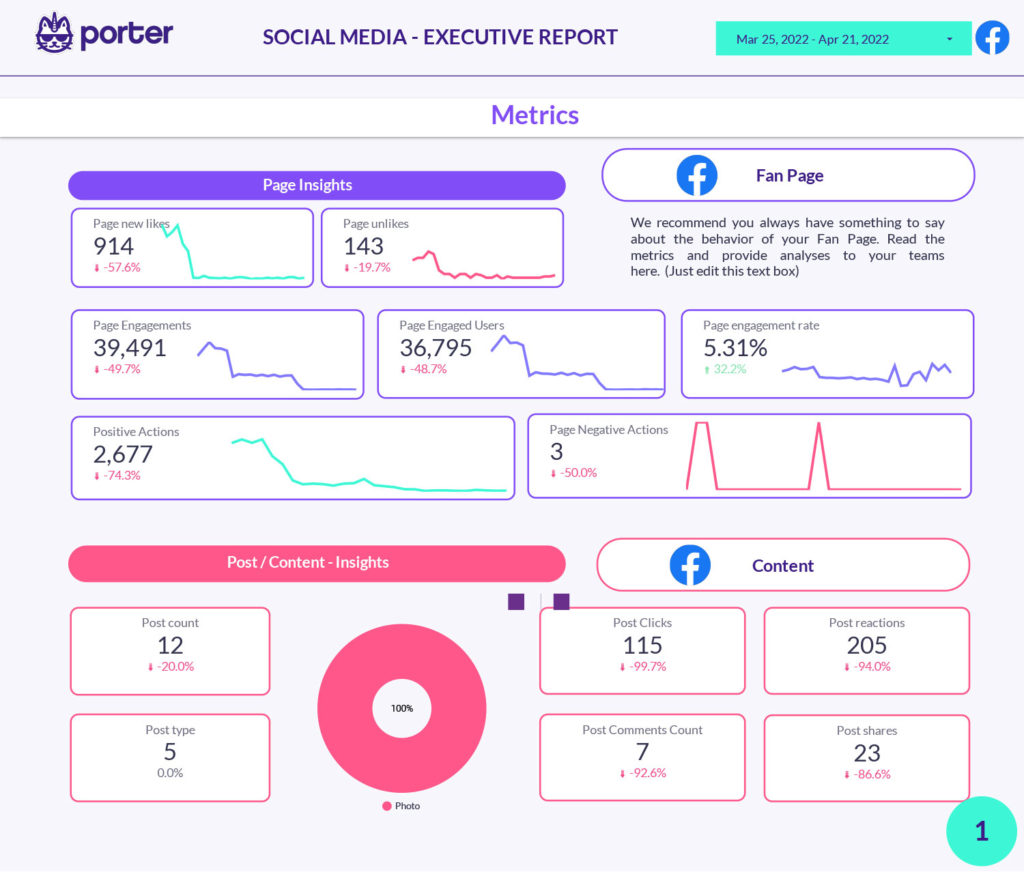
Social media (Facebook Insights) – Executive report Porter Metrics
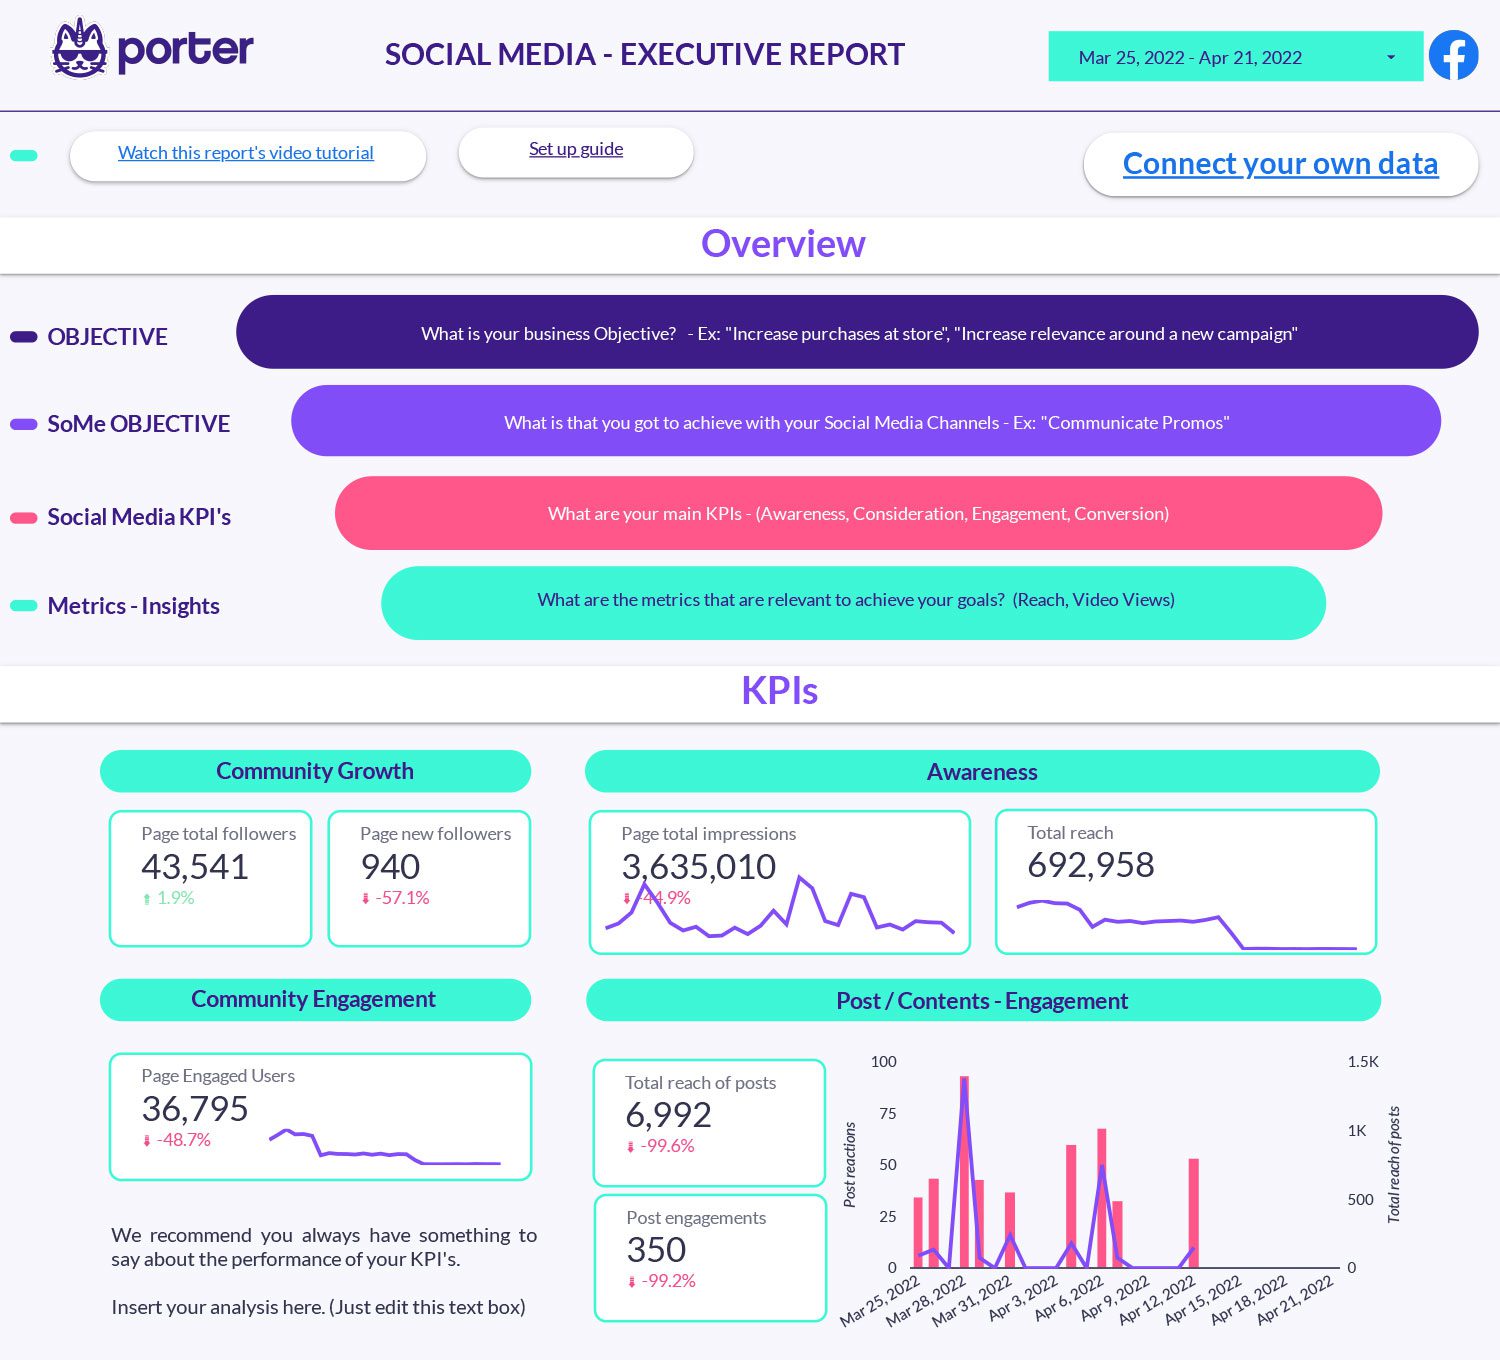
Visualize your Facebook Insights in an insightful and organized way. Understand what drives your page growth, best posts, and audience. Track organic KPIs of your Facebook Page while keeping in mind your objectives.
- Track your Facebook Page metrics organized by KPIs
- Track your Facebook Page growth
- Get a deeper understanding of your best posts and improve your audience engagement based on your communication and marketing goals.
- Understand your audience: age and gender.
- Track your Facebook Ads Conversions, Costs, and best ads.
Provider: This report was created by Porter Metrics
Reporting tool: Google Data Studio
Graphics and charts included: This report contains 20 graphics and charts (you can customize all of them)
Price: You can use this template for free
Metrics included in the report:
You can use this report template to find data related to Facebook and Instagram insights, such as:
- New followers
- Total reach
- Total reactions
- Total comments
- Page reach
- Page Impressions
- Posts engagements
- Content quality analysis by objective
Try this report template for free!
If you need more information about what a good report template should have, check this video out!
Finally, you need to consider that some of these reports will be high to set up, and you will need some help. You can contact the provider for more information.
If you want to use a report template from Porter Metrics, the setup is for free, you only need to schedule a call, and we will be more than happy to create your Google Data Studio reports for free.

