What is a competitor analysis report?
A competitor analysis report is a document that consolidates data from multiple sources (e.g., market research reports, social media analytics, web traffic data) to track and display key performance indicators (KPIs) (e.g., market share, competitor pricing, product features), enabling teams to monitor competitor performance and create presentations for stakeholders.
Competitor analysis reports are typically created using flexible tools like Google Looker Studio, Power BI, Google Sheets, or platform-specific solutions to enable high customization and integration of multiple data sources.
What to include in a competitor analysis report?
An actionable competitor analysis report balances context and specificity based on the audience (executives, managers, and analysts) and their use cases.
Executive competitor analysis reports
Executive reports for CMOs, CEOs, and stakeholders show the competitive landscape's impact. Reviewed weekly, monthly, or quarterly, they include:
- Market share analysis: by product category, using market data and trends.
- Pricing strategy analysis: competitor pricing models and changes over time.
- Product feature comparison: strengths and weaknesses of competitor offerings.
- Add text for additional context to translate metrics for non-technical audiences. Present in slide decks and simplified Looker Studio reports.
Competitor analysis manager reports
Manager reports have cross-competitor views with drill-downs to see performance by product, region, and market segment. They help align strategies, define tactics, and include:
- Cross-competitor reporting: overall market position, product, or region reporting across competitors.
- Trend tracking: compare current market trends vs objectives.
- SWOT analysis for prioritization and spotting opportunities
- Competitive landscape mapping for market positioning.
- Topic, keyword, content, audience research
Operational Competitor Analysis Reports
Operational reports for analysts and market researchers have granular, customizable KPIs to solve technical issues. Monitored hourly, daily, or weekly, they cover:
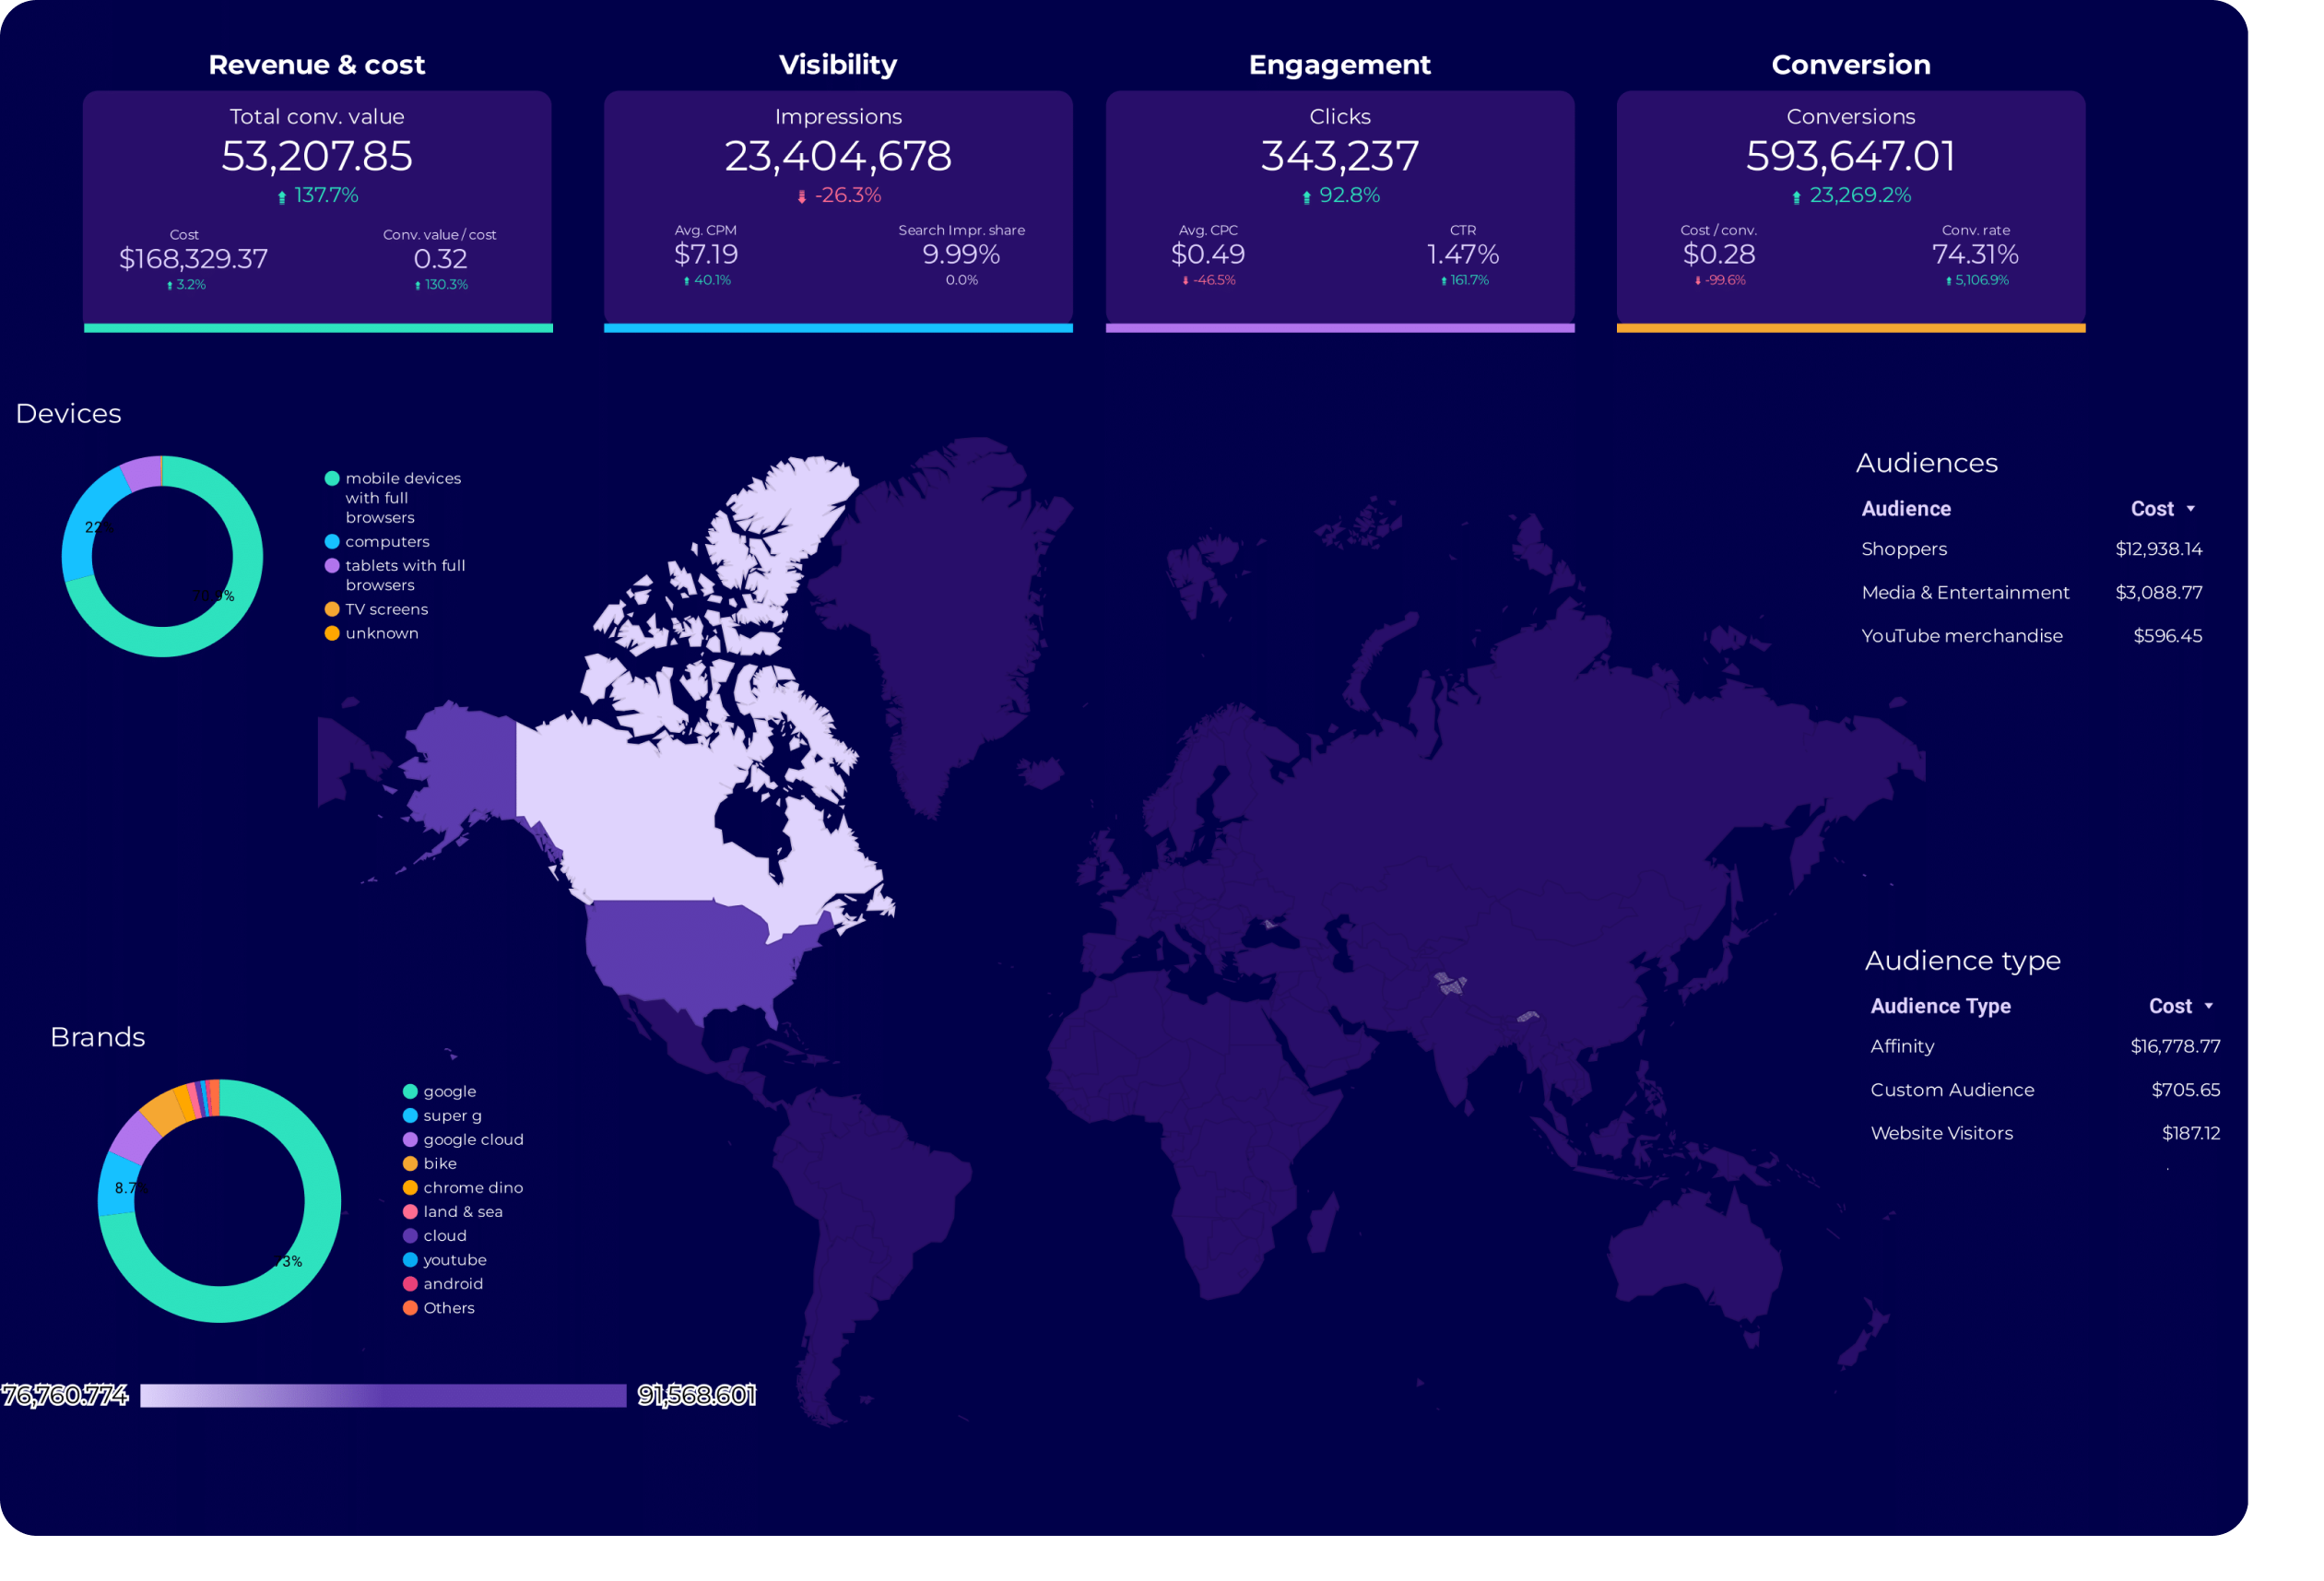
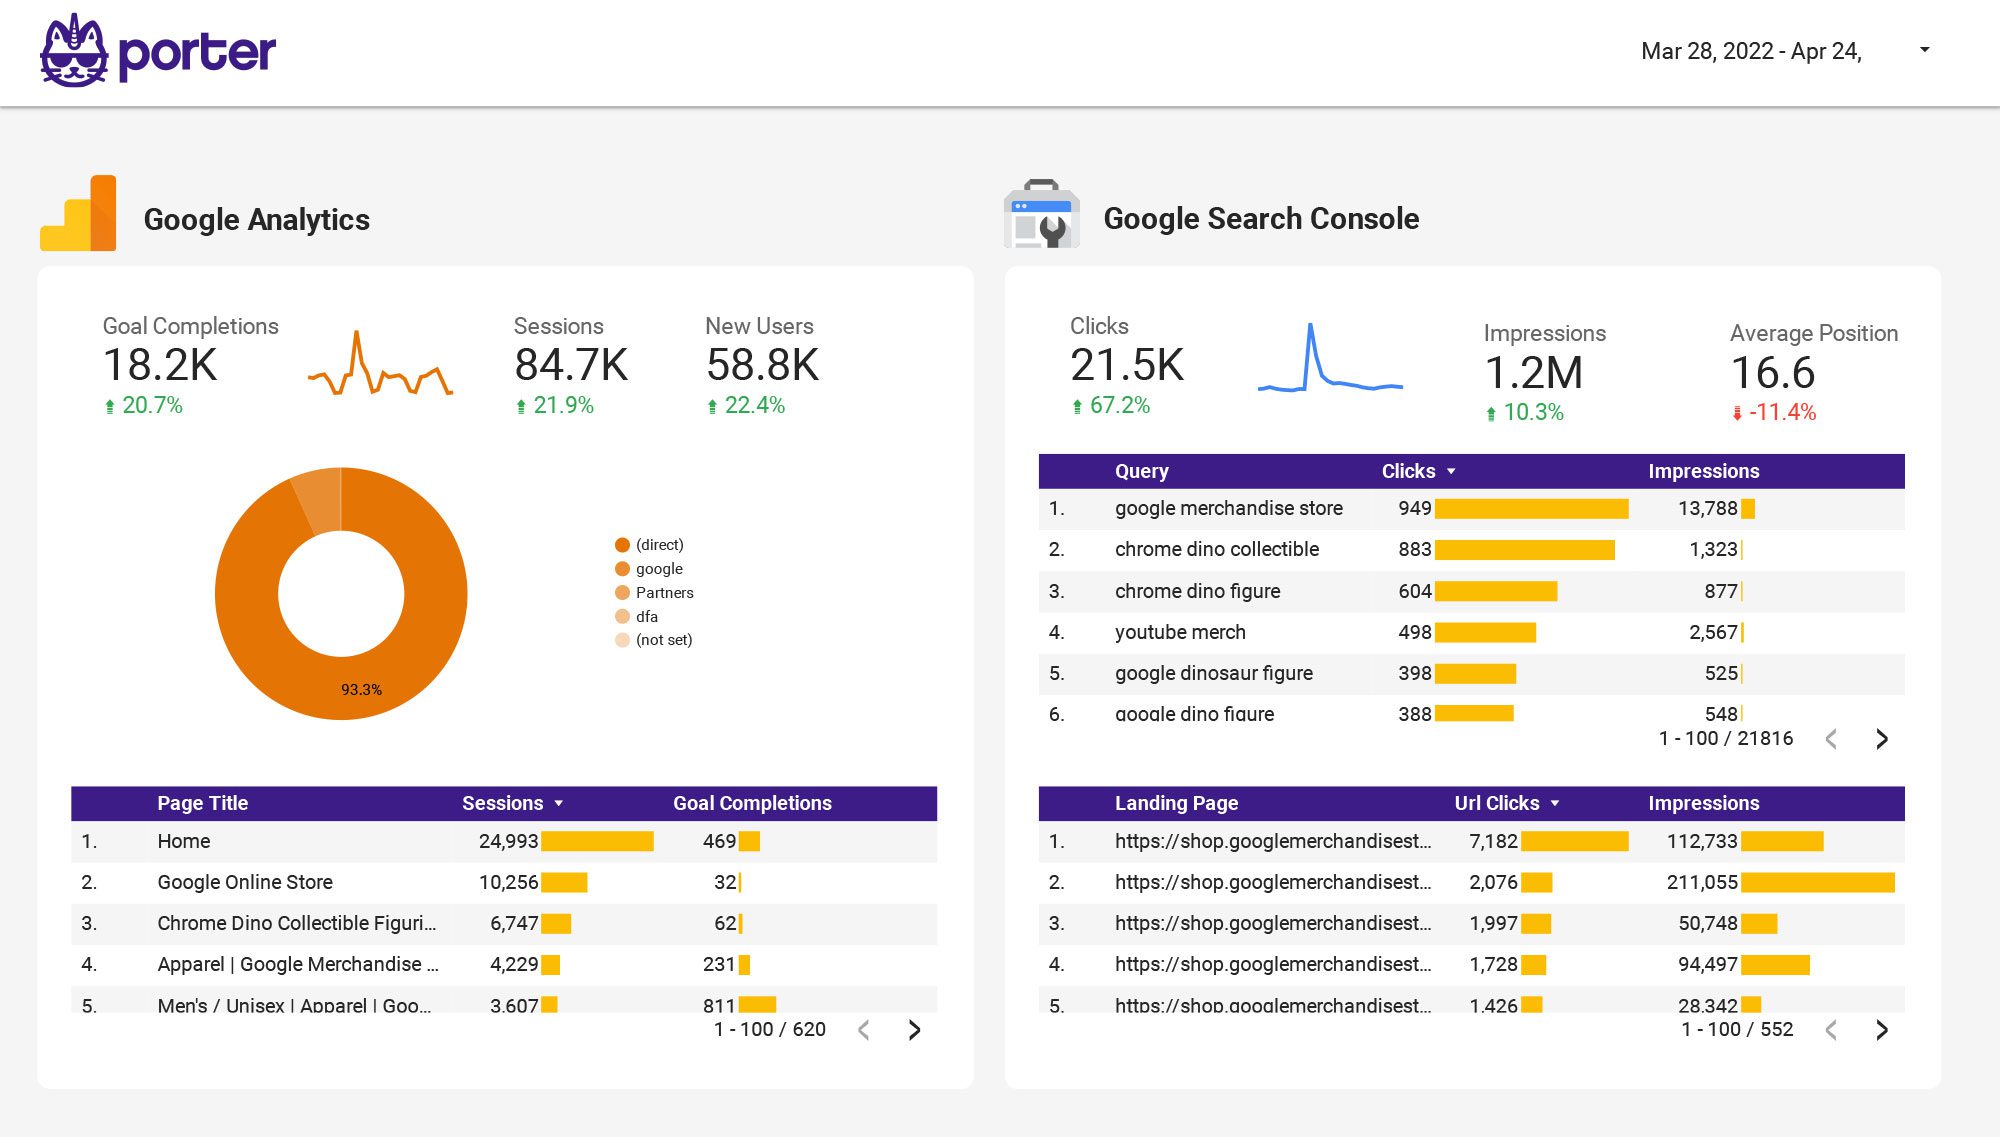
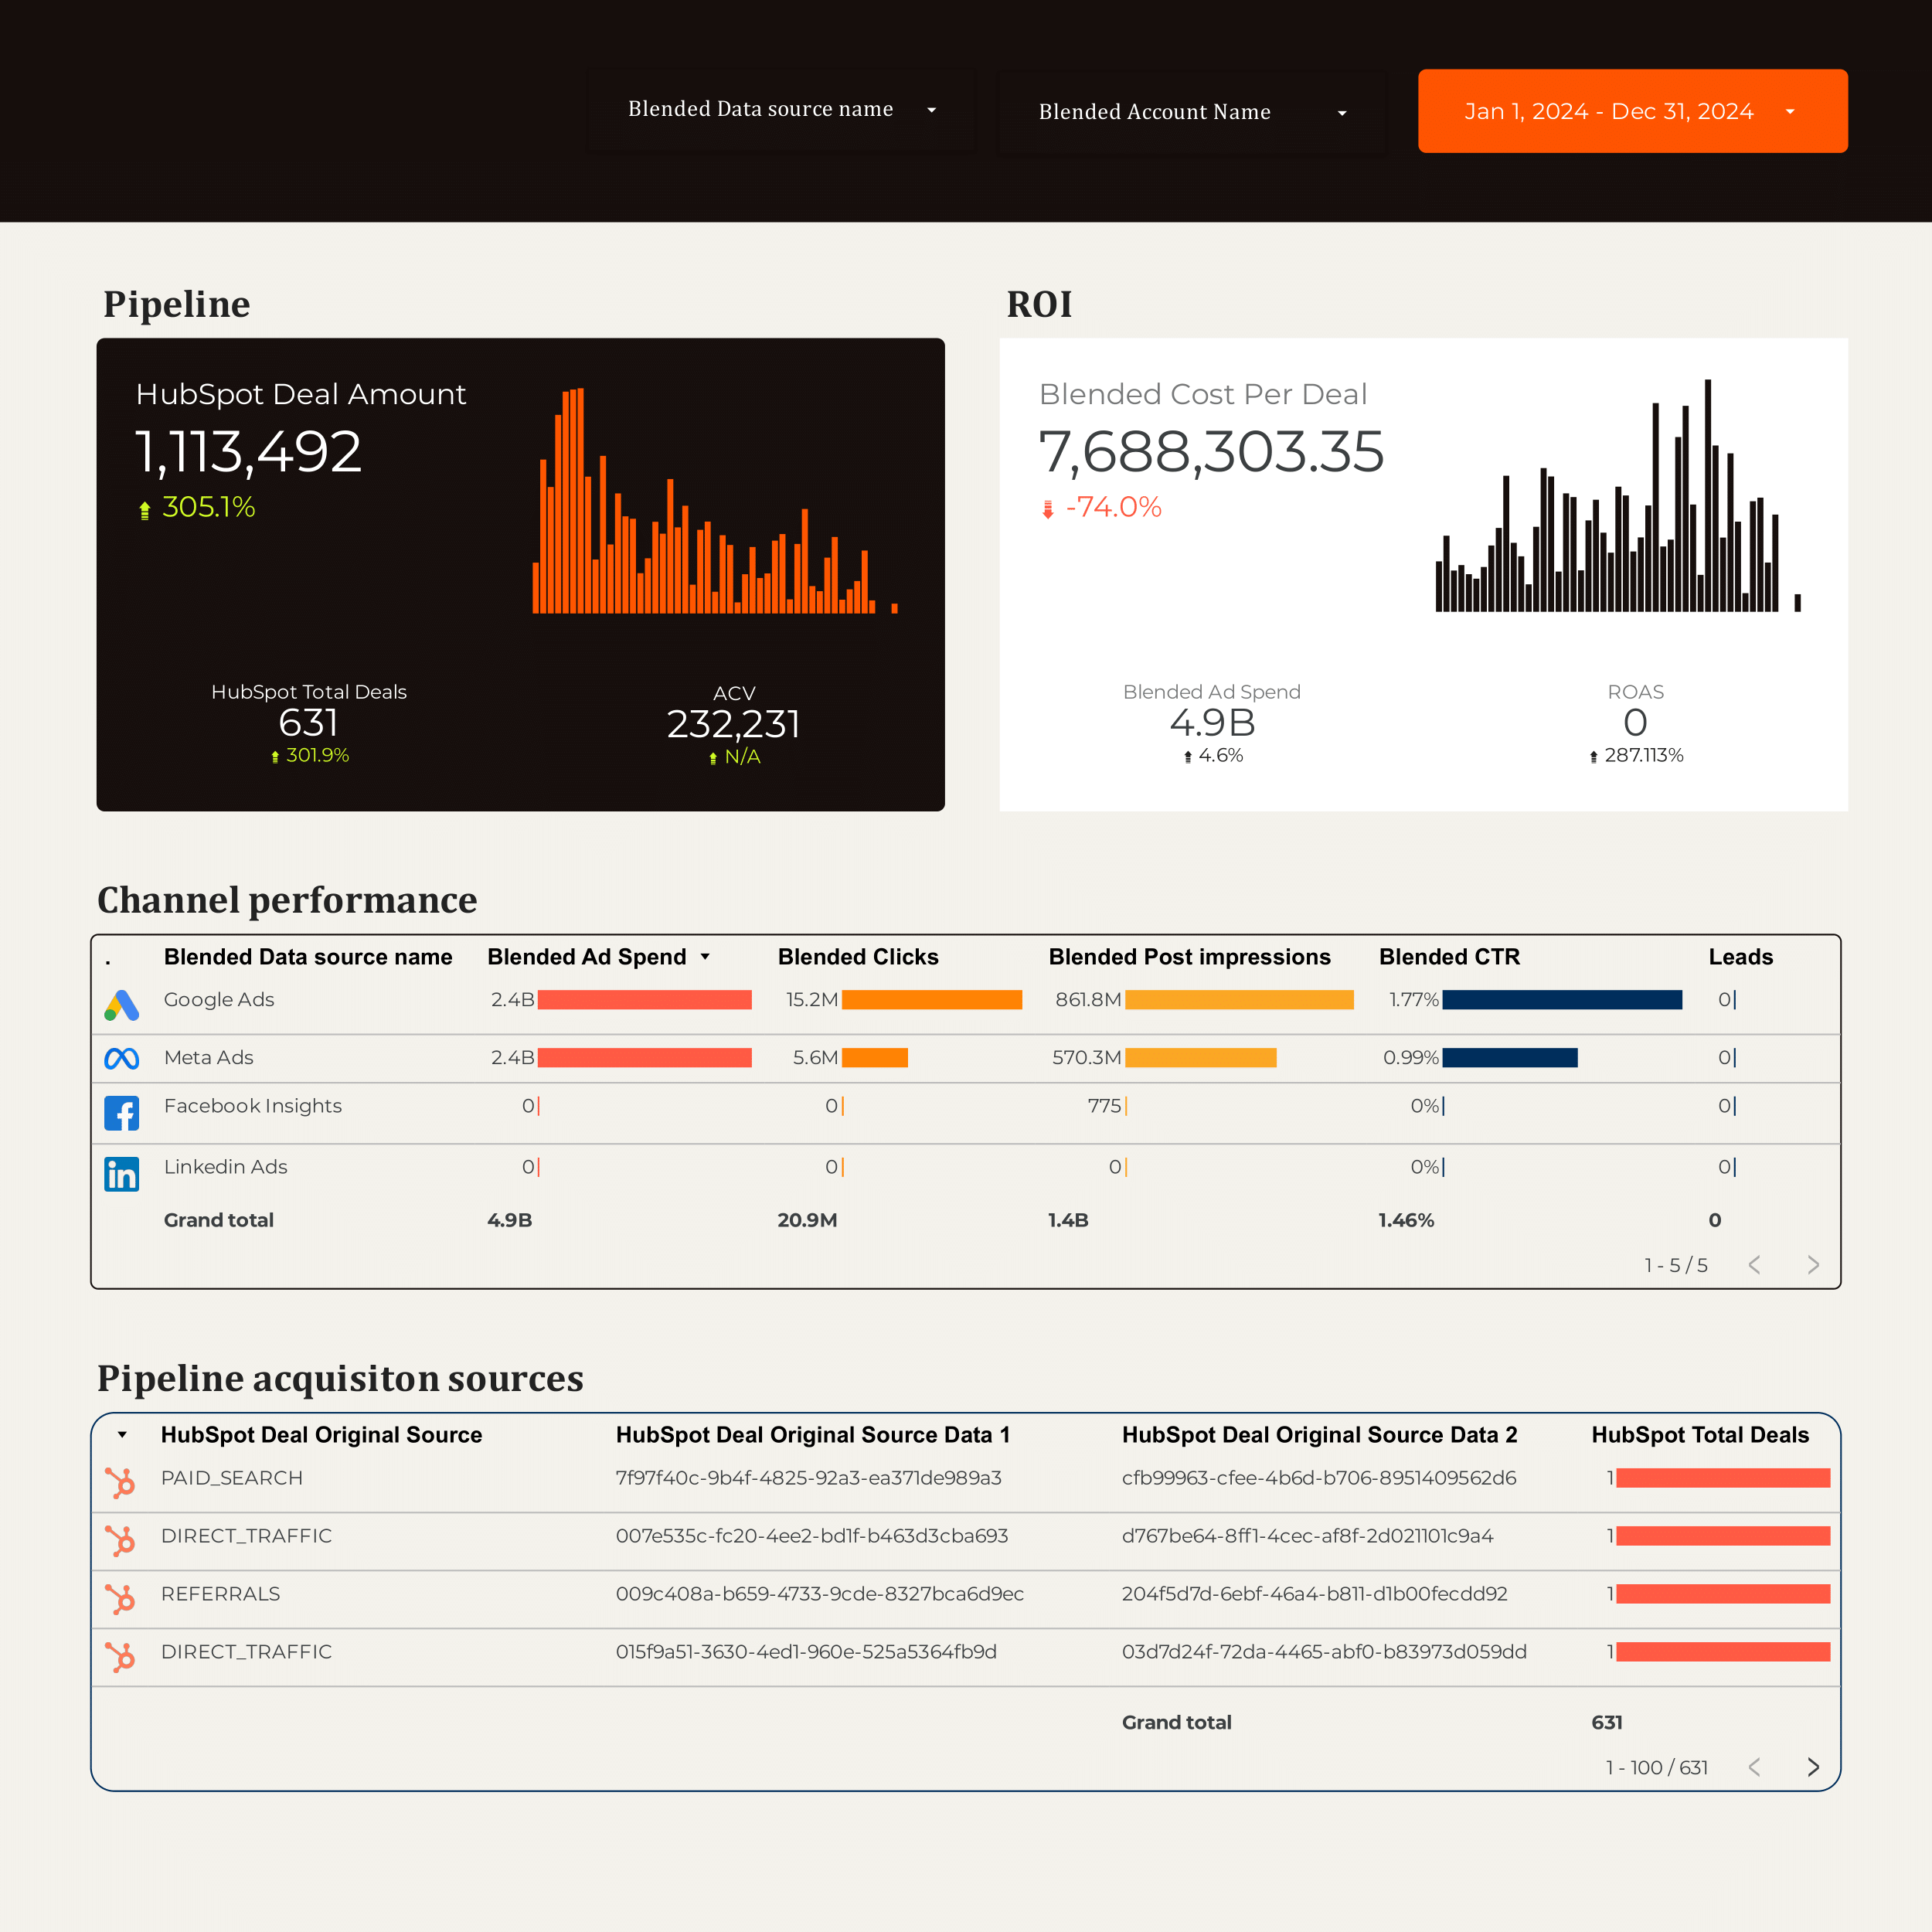
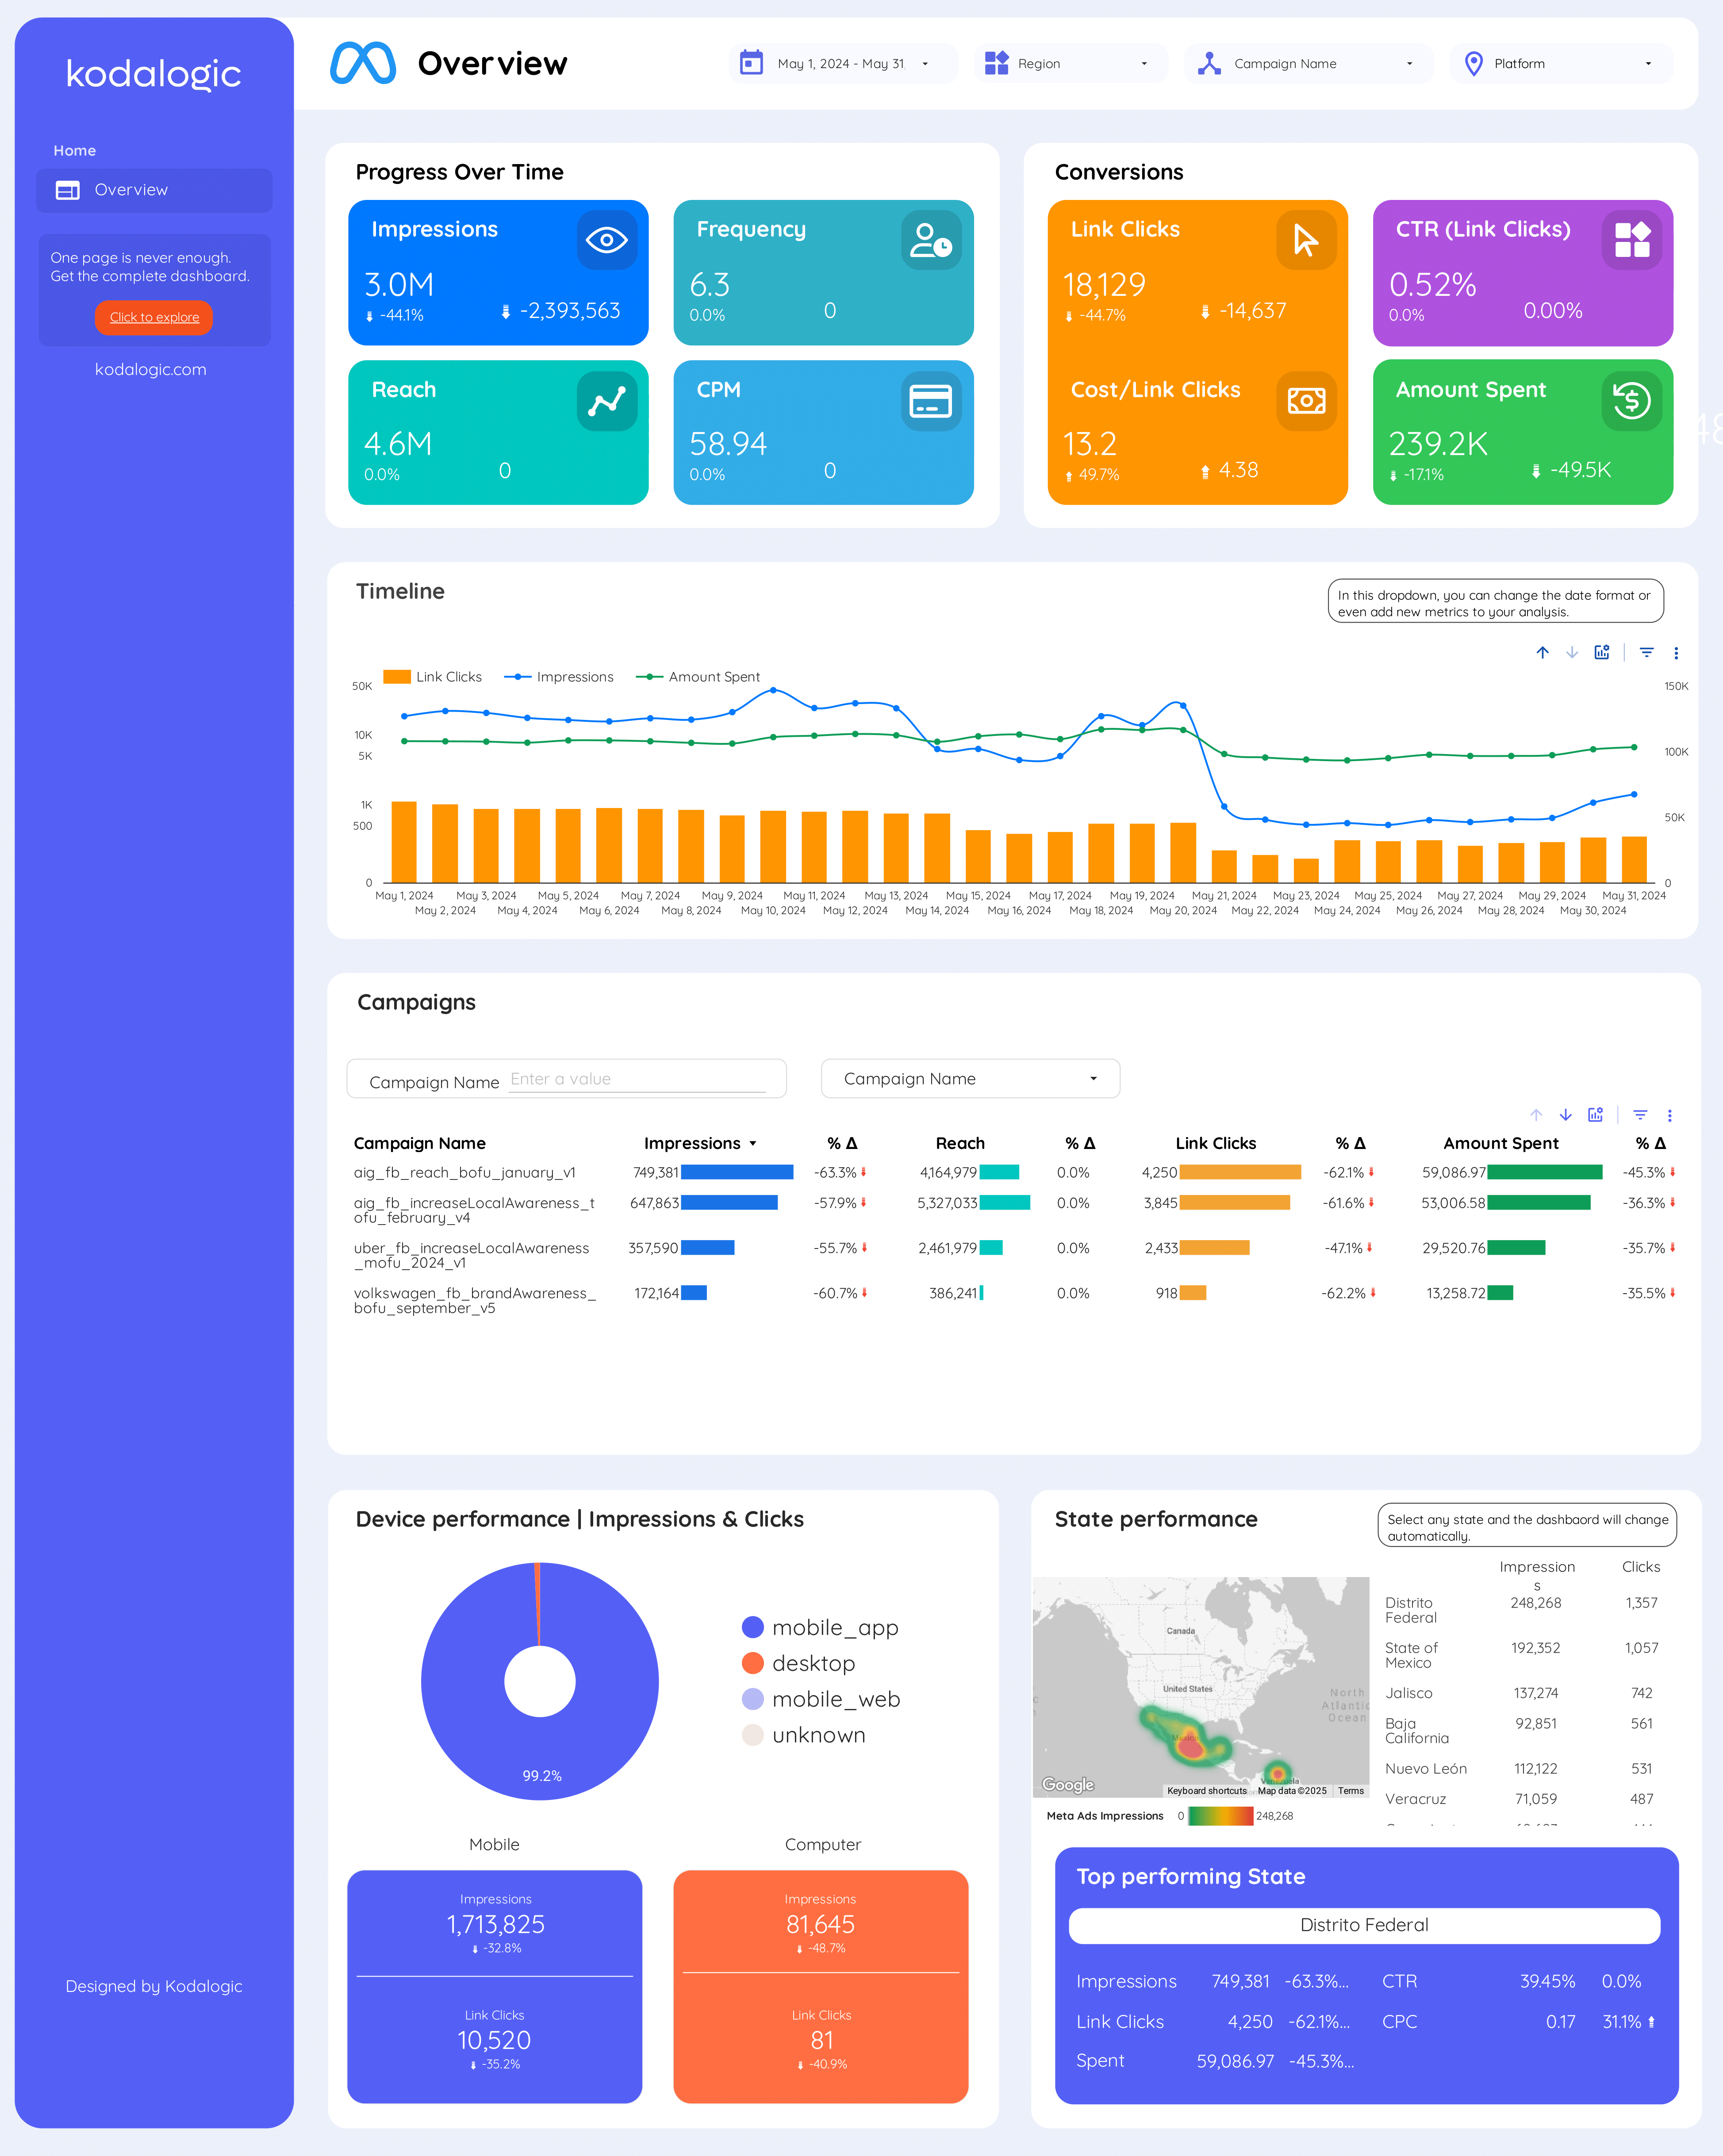
- Web traffic: competitor site visits, engagement, bounce rates.
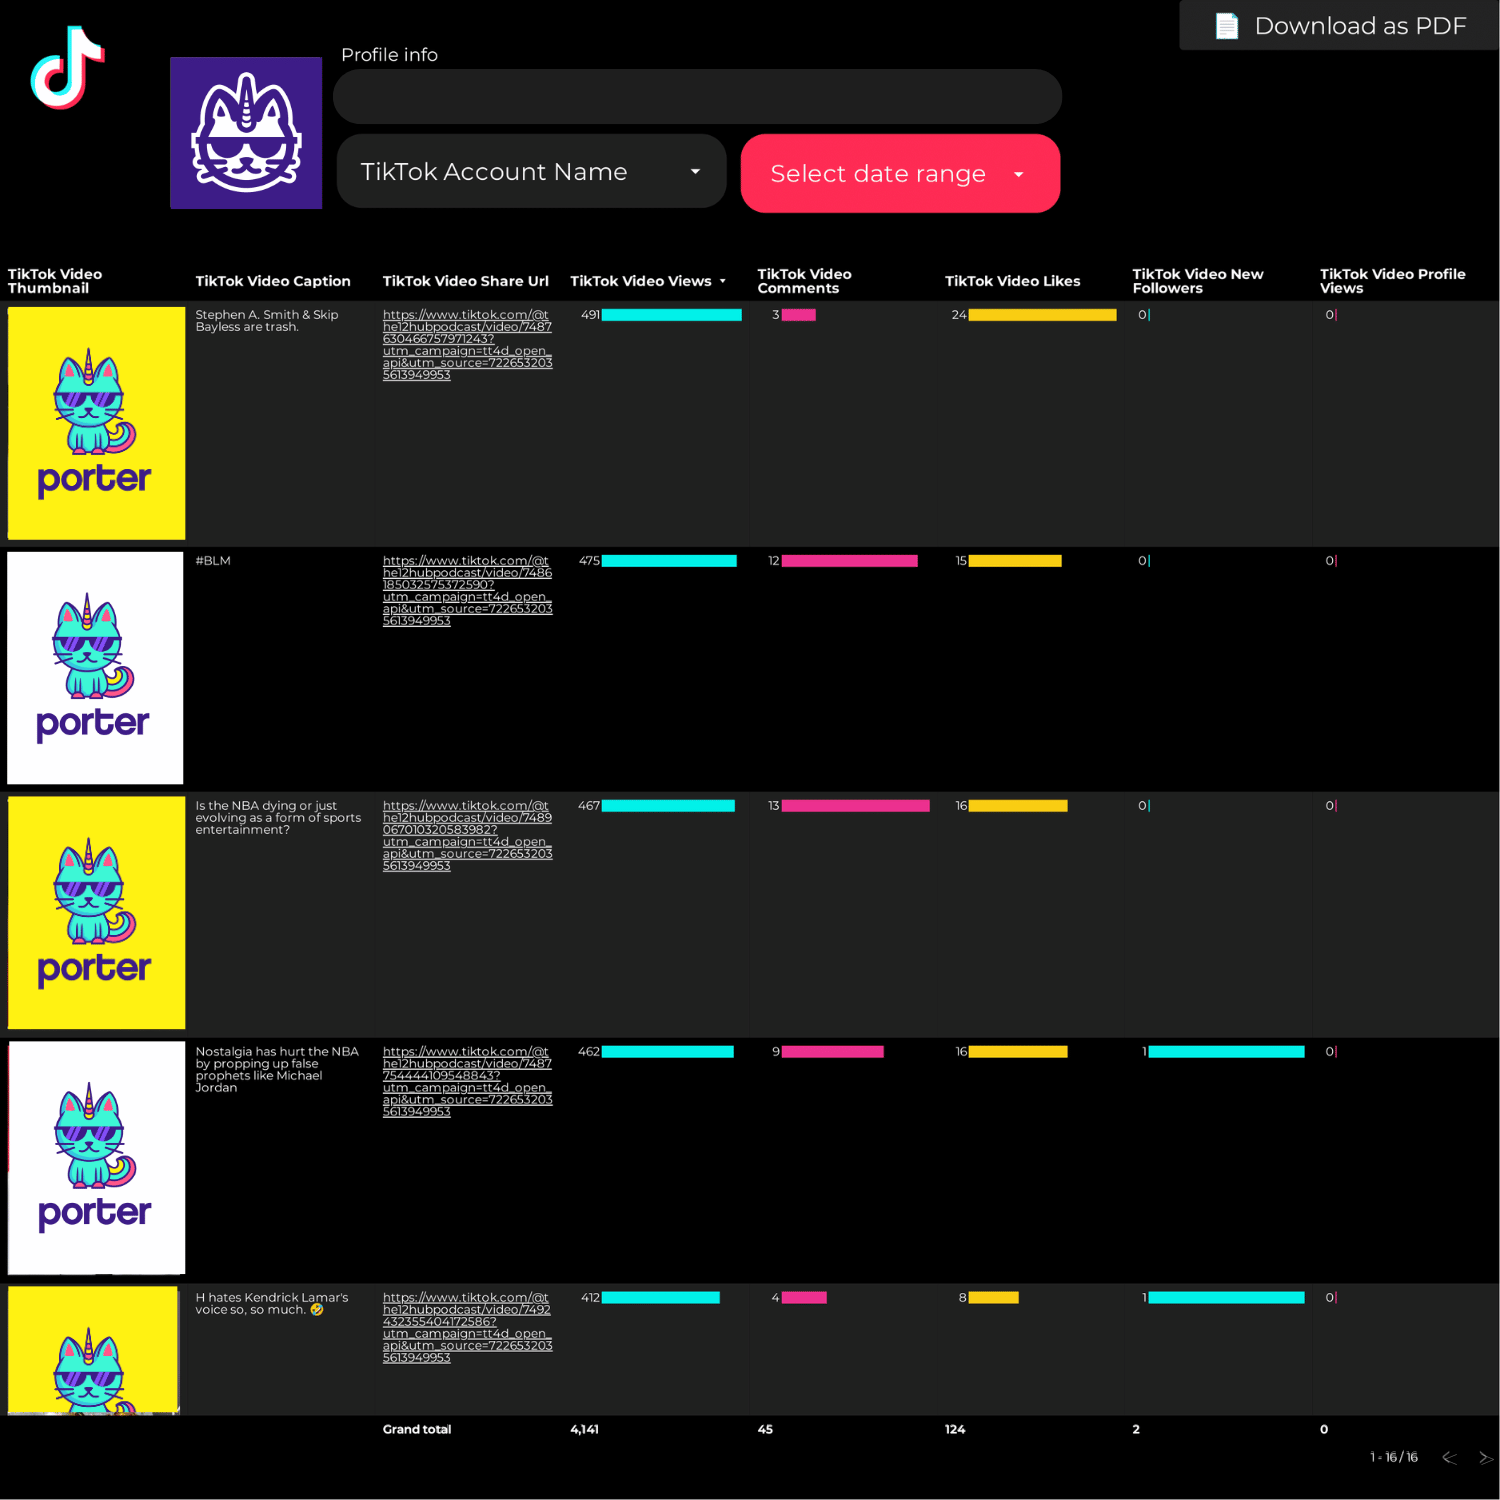
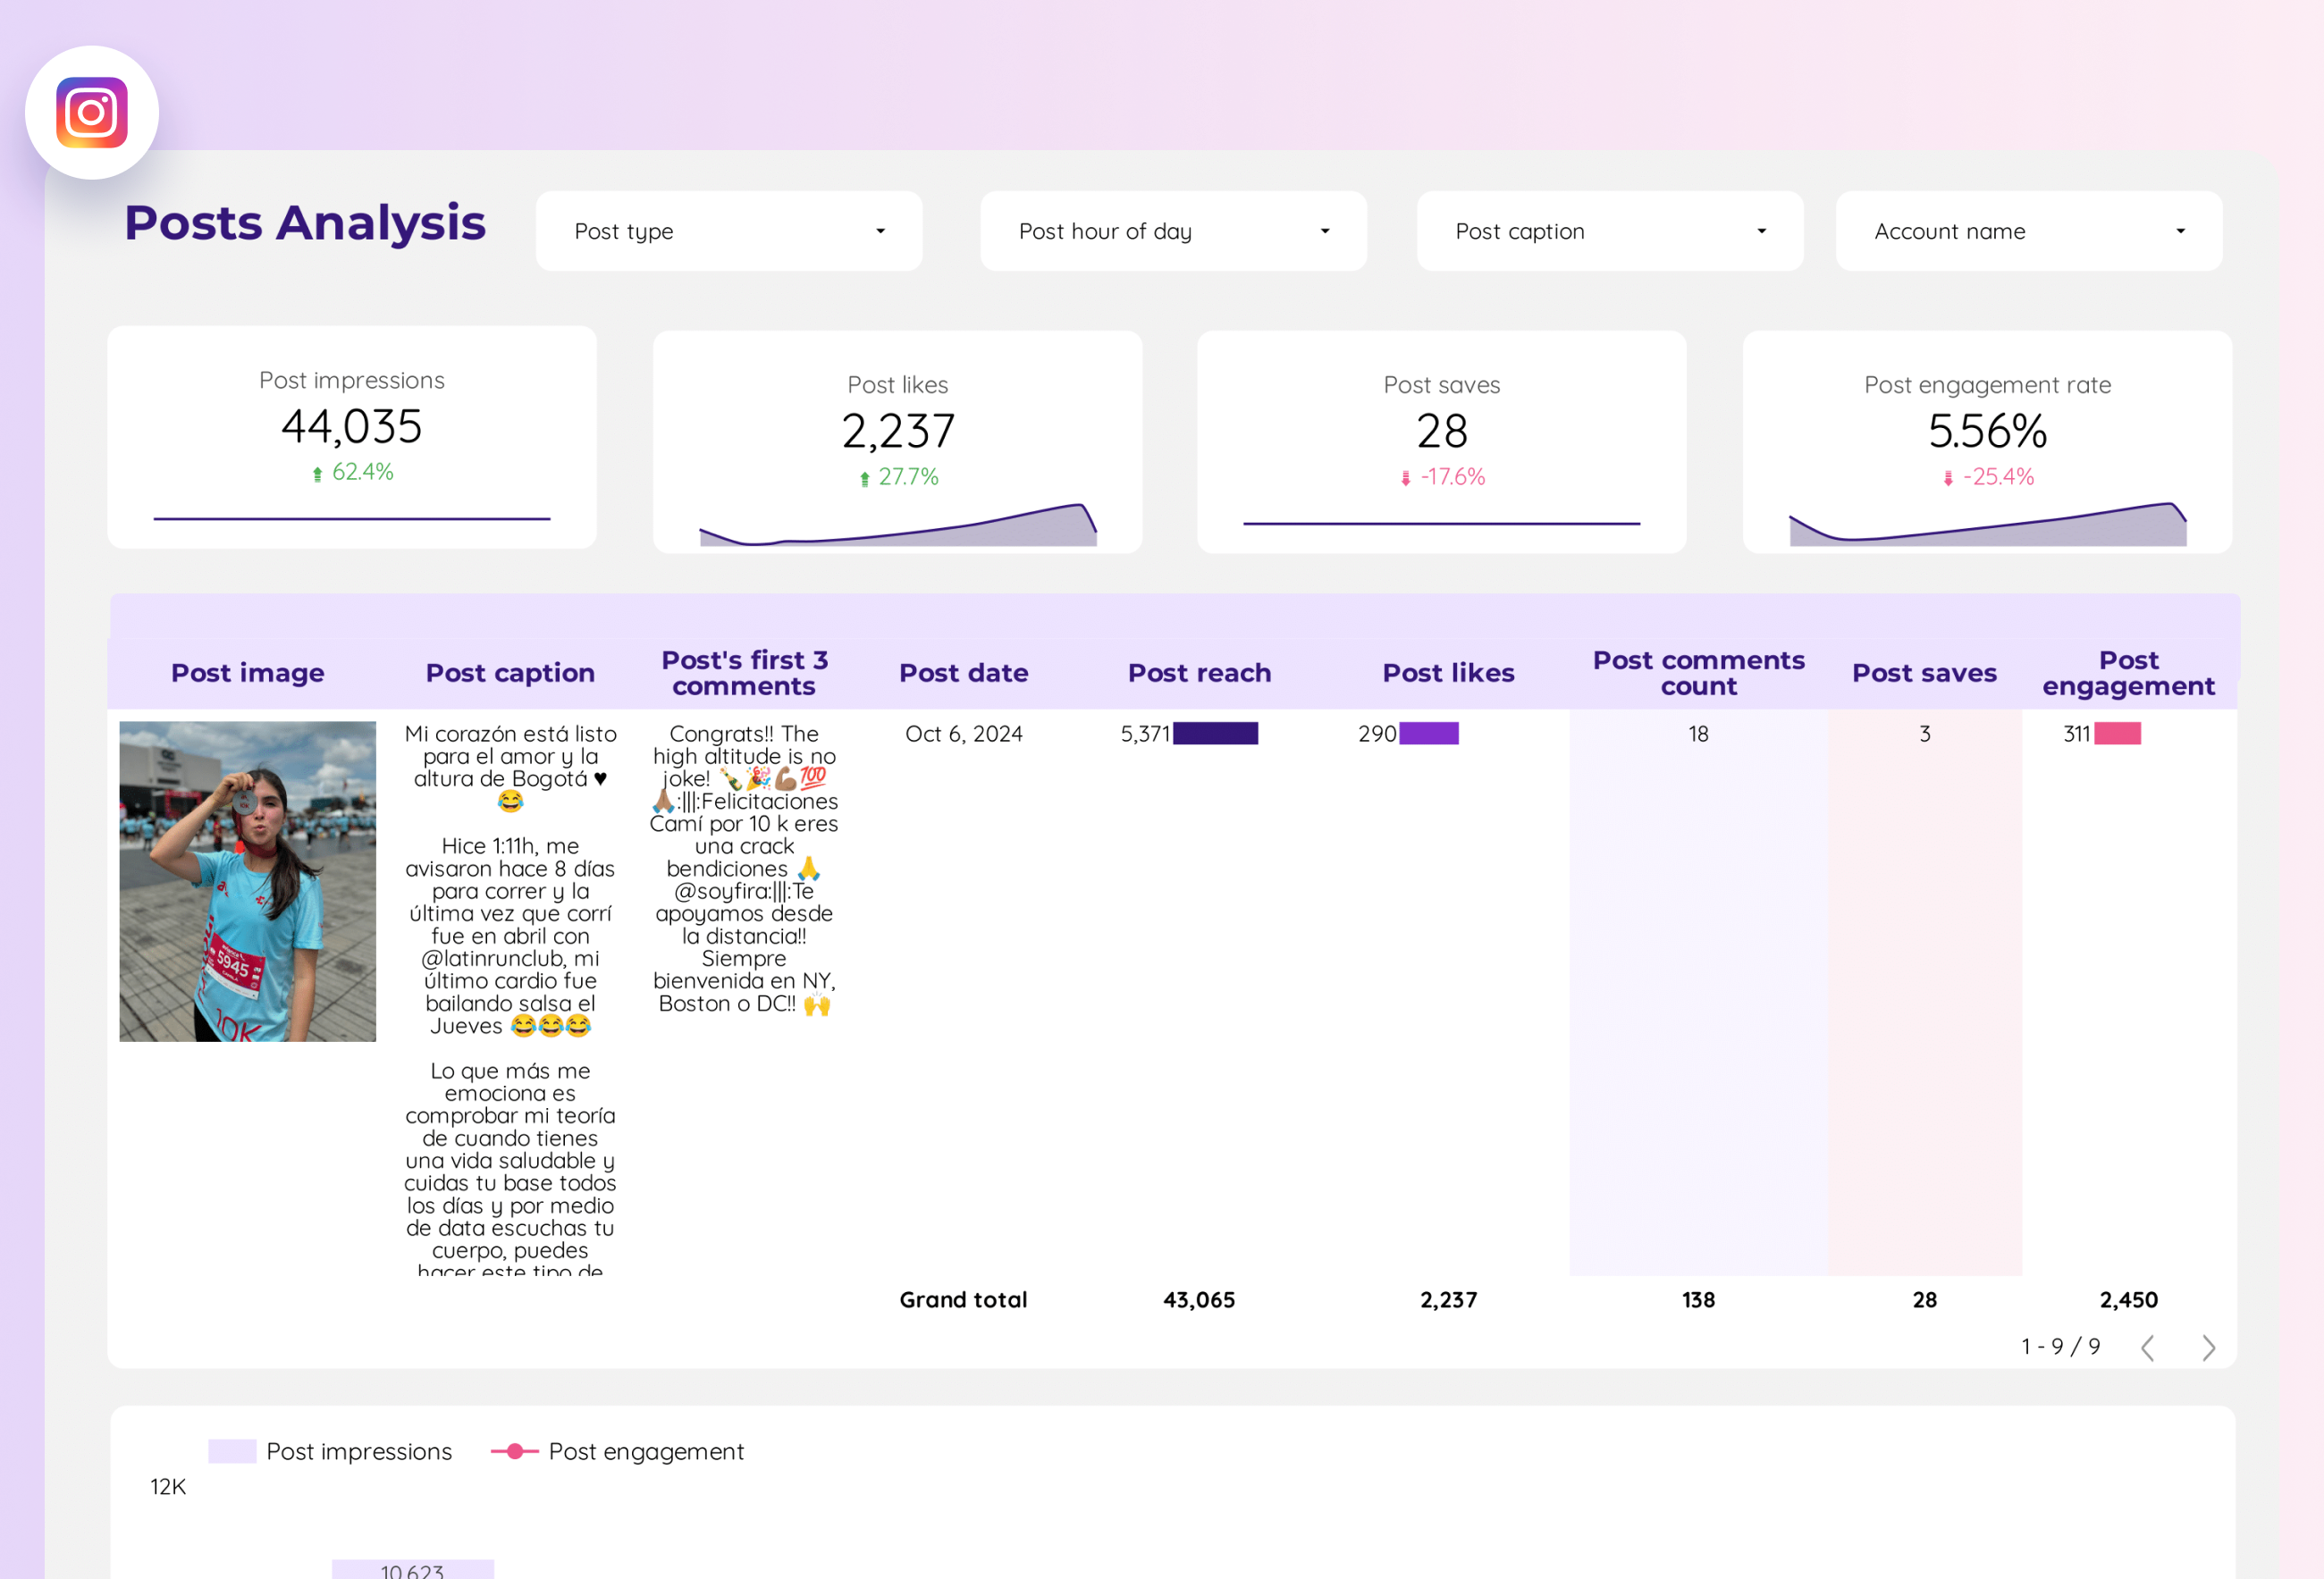
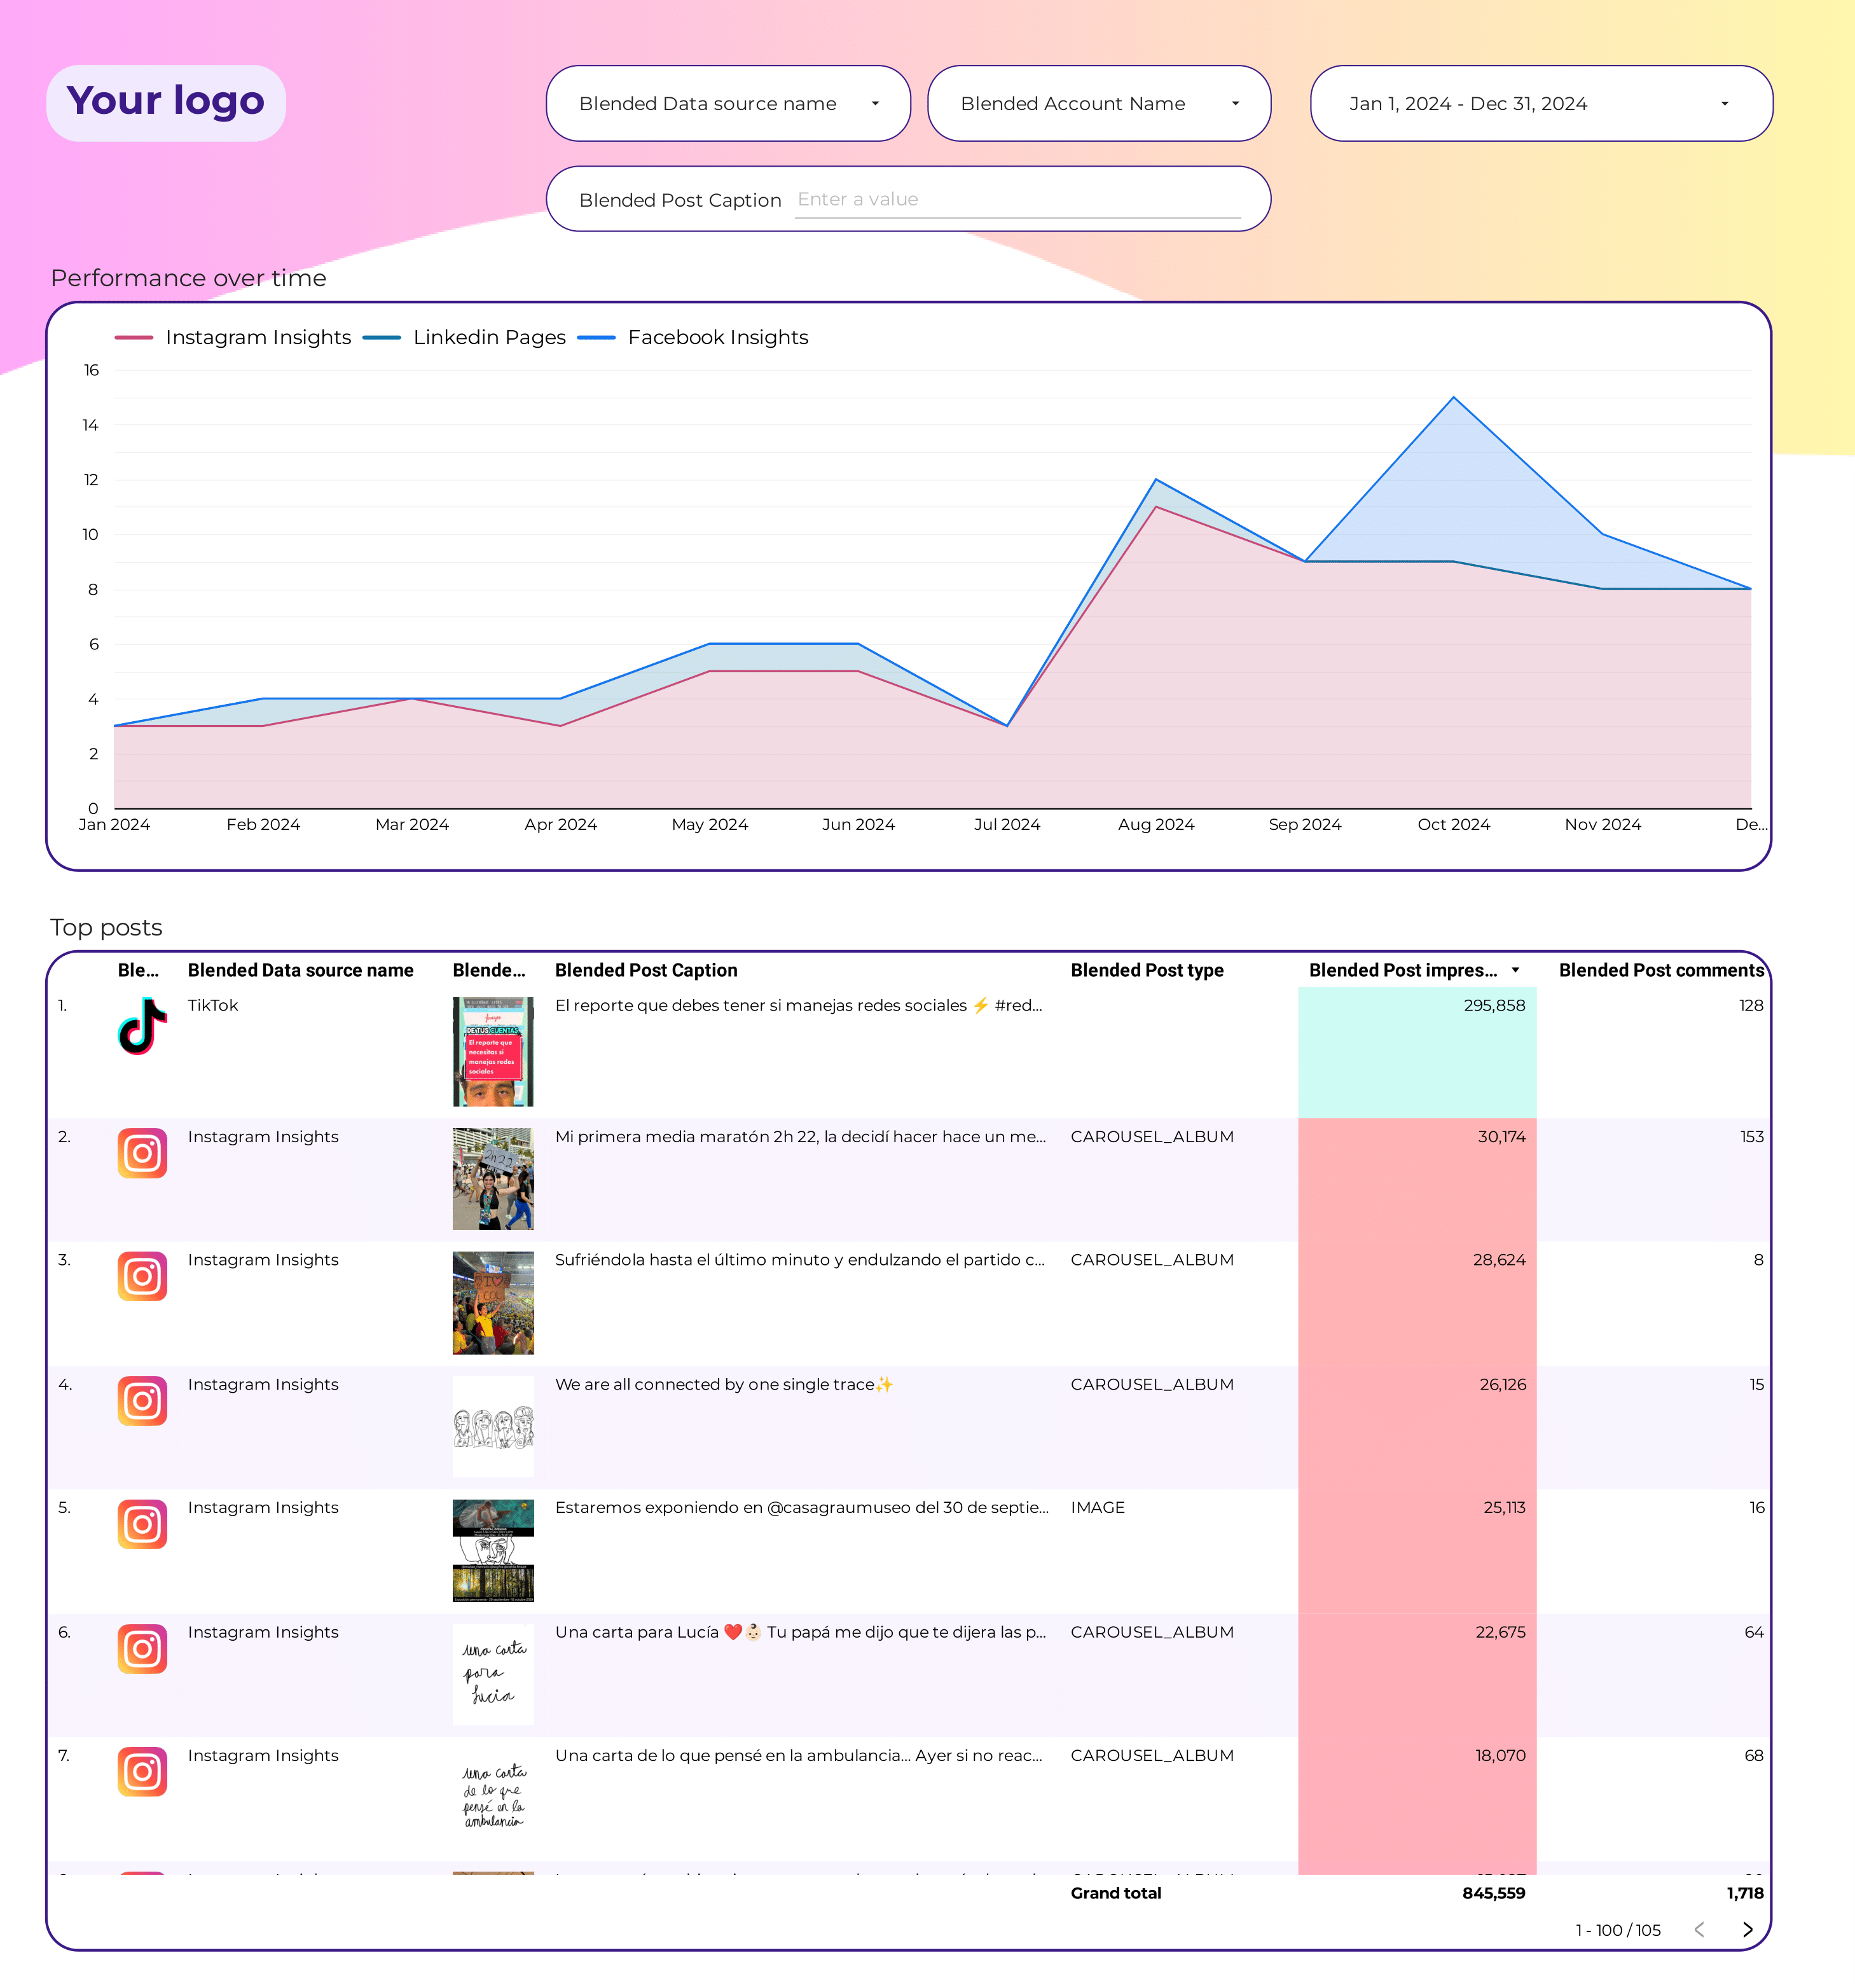
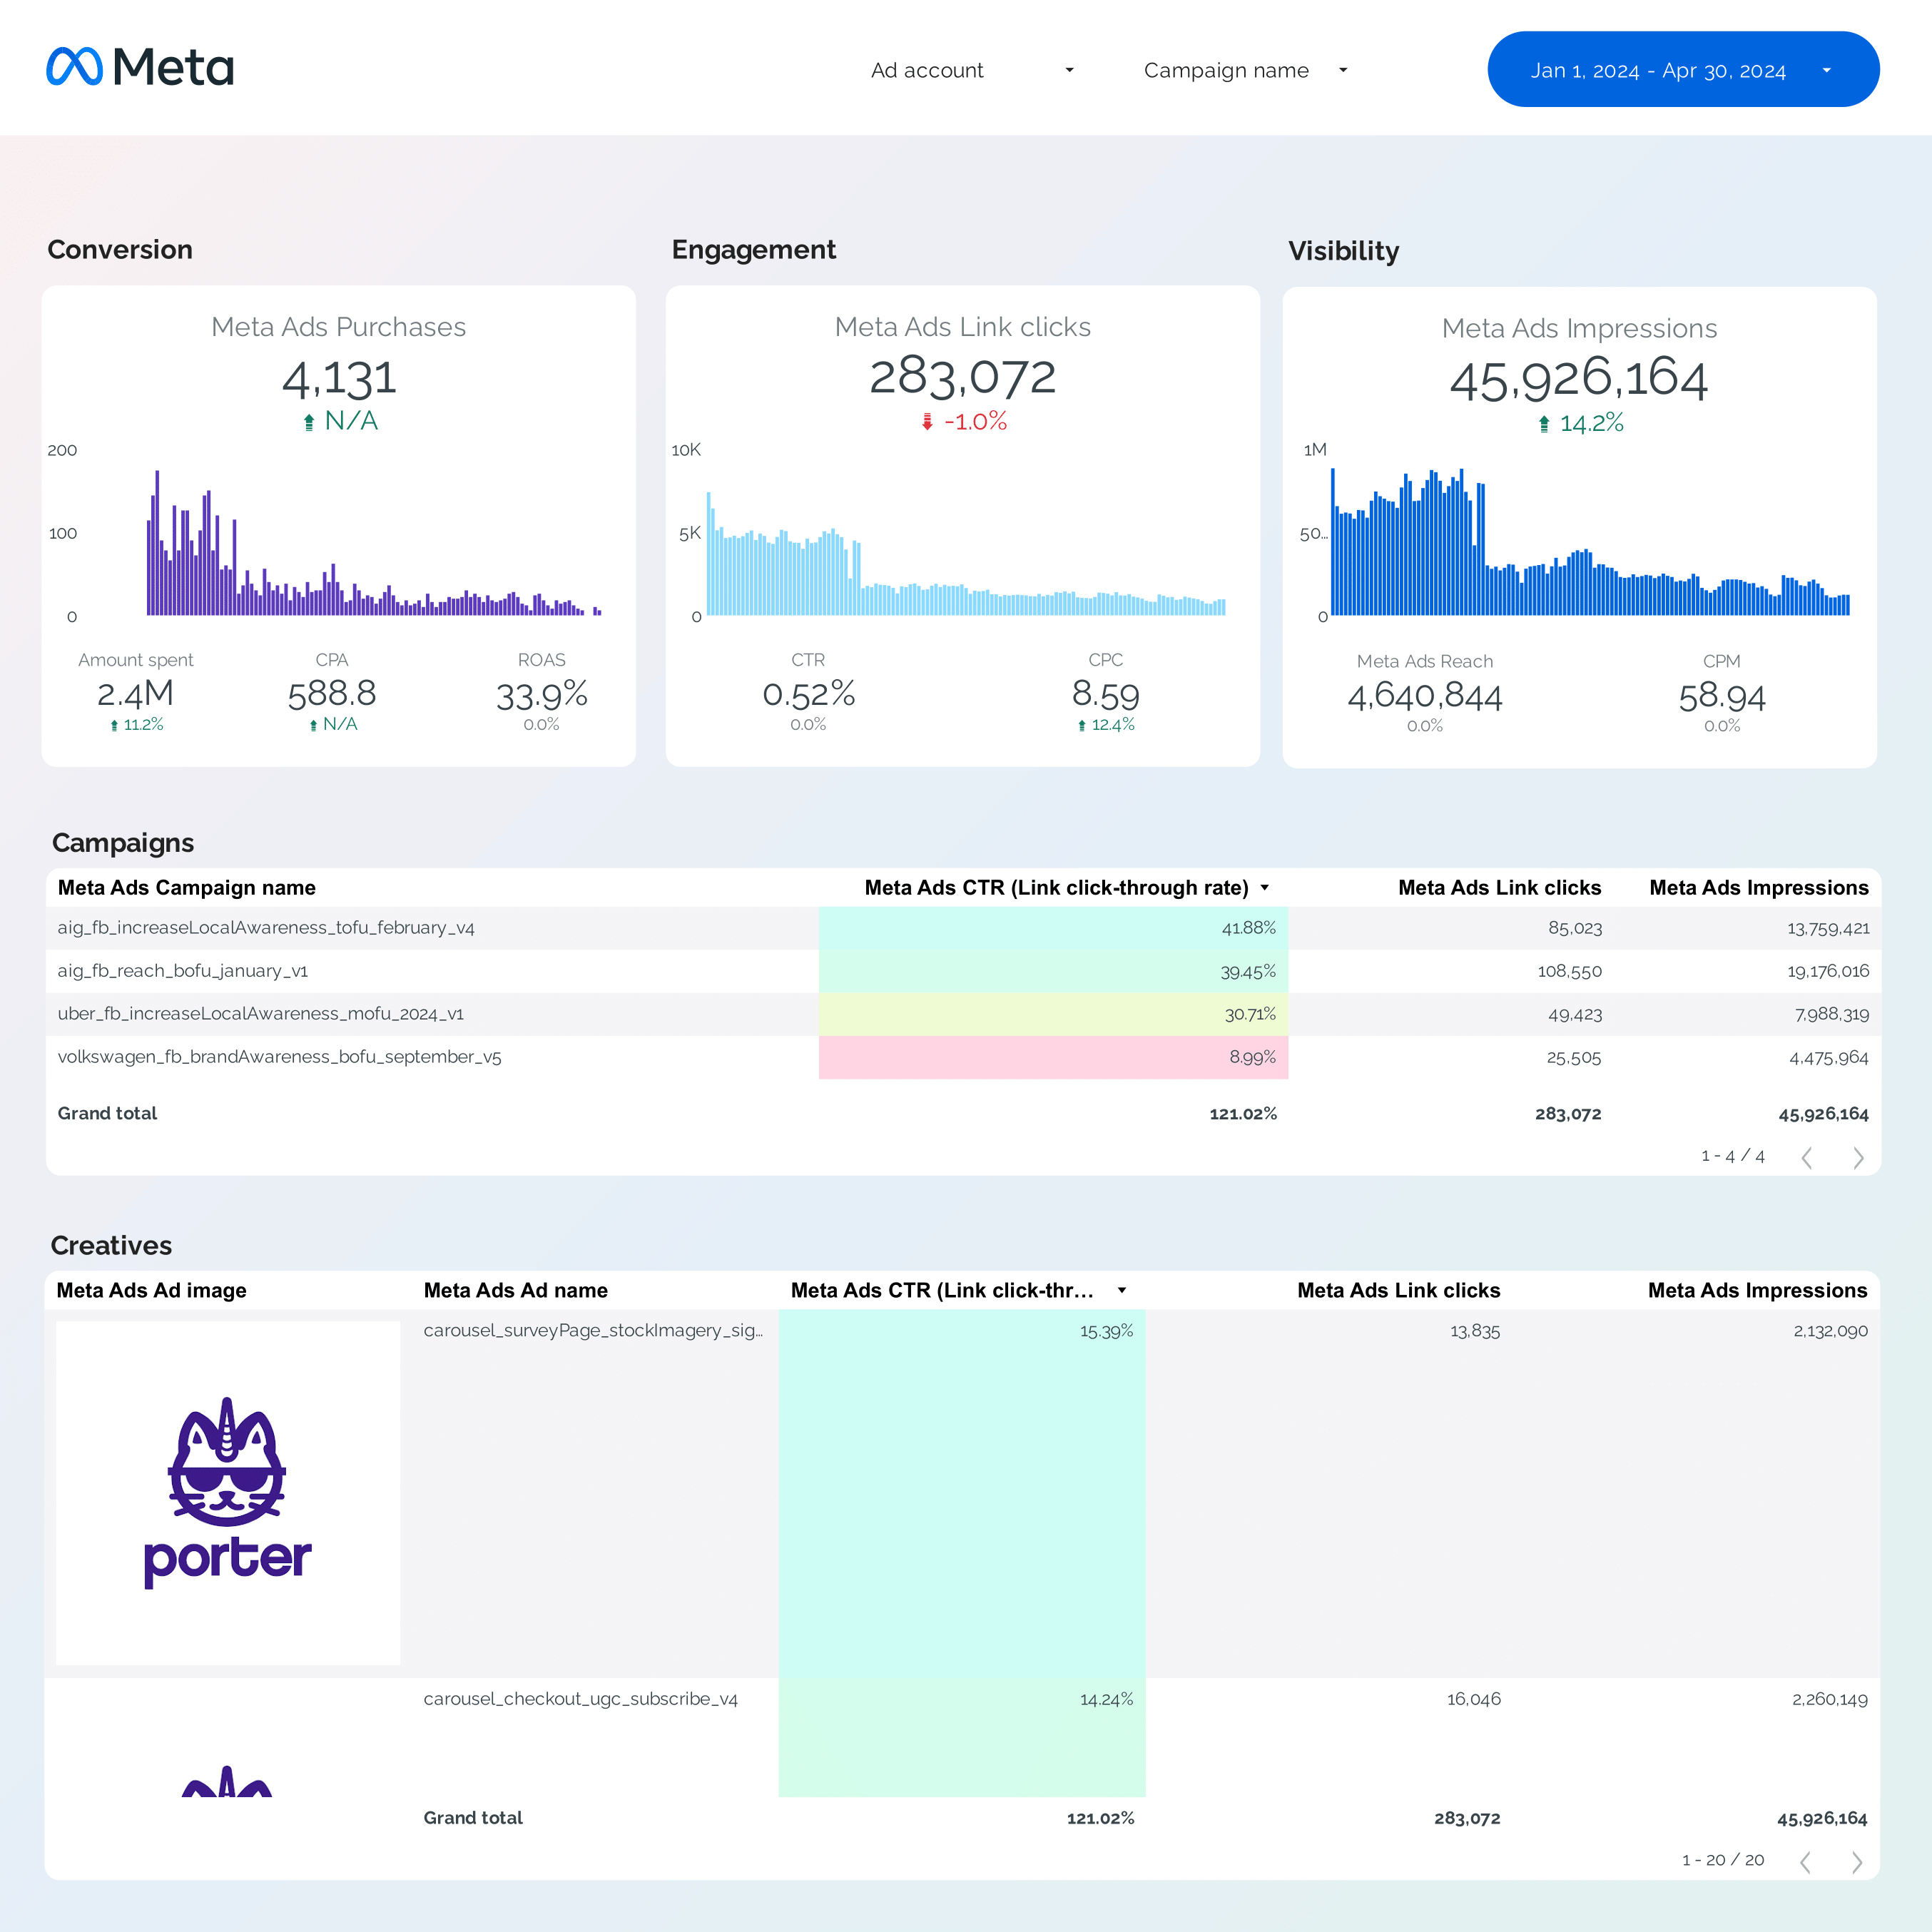
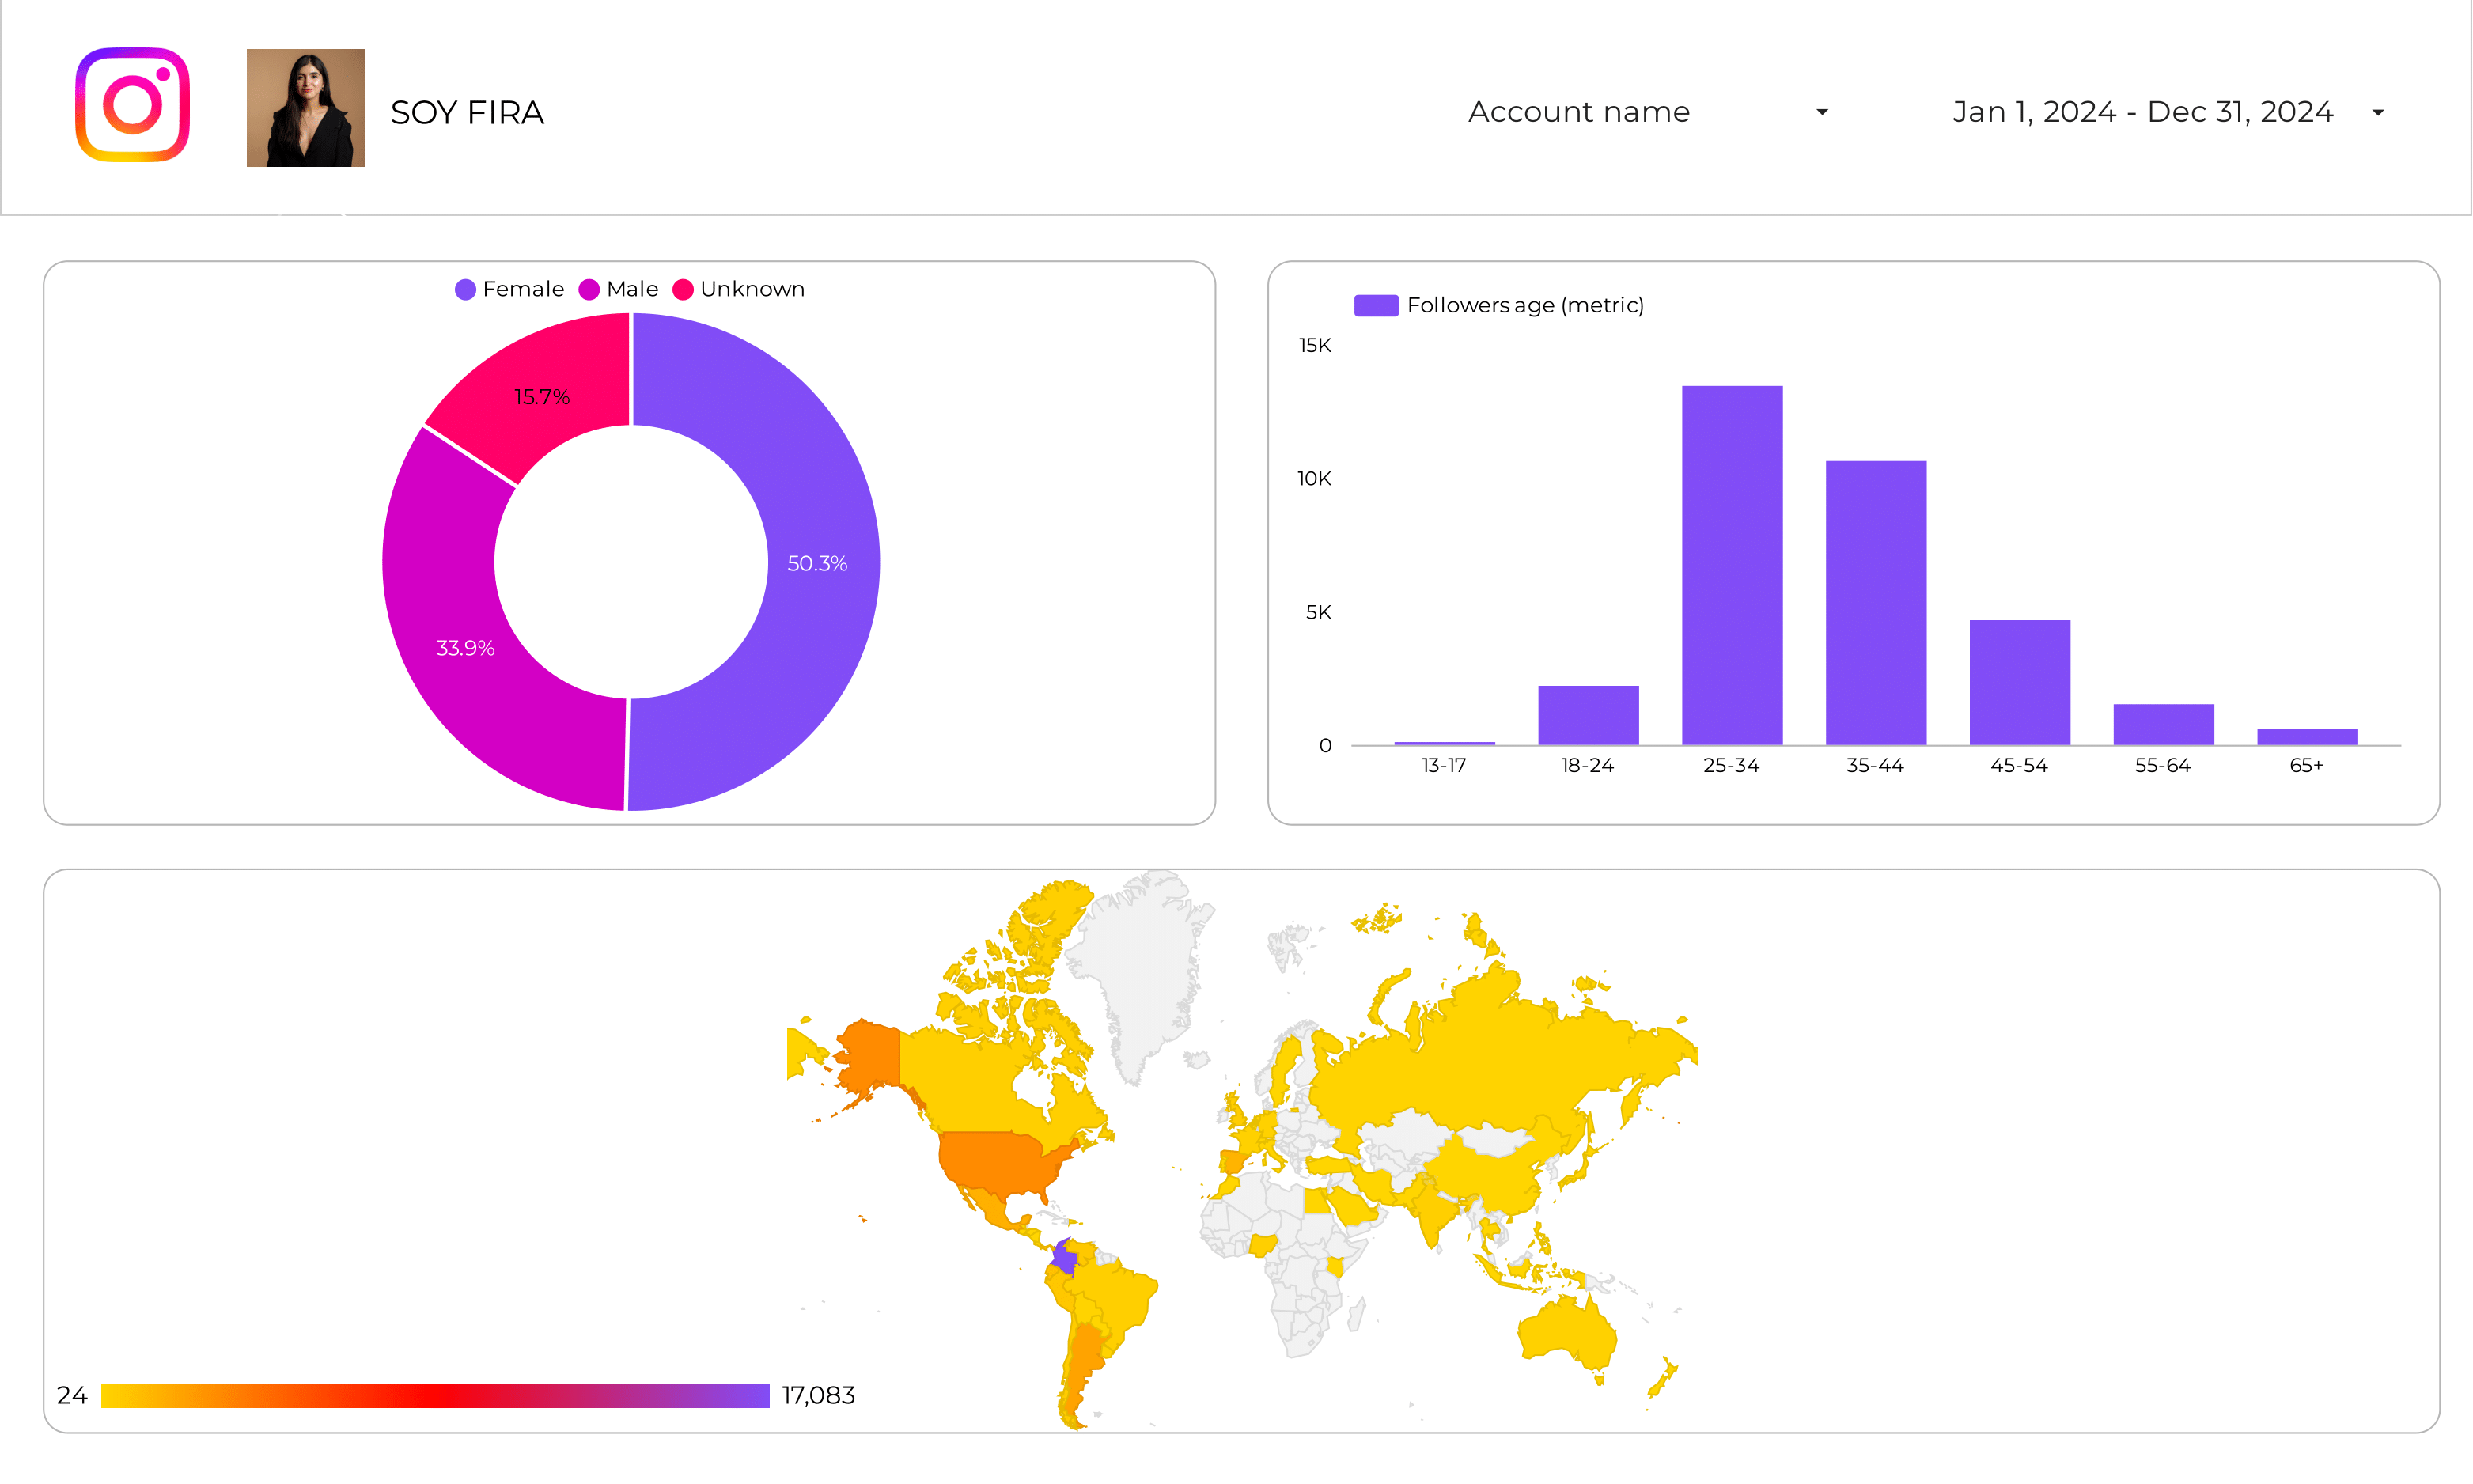
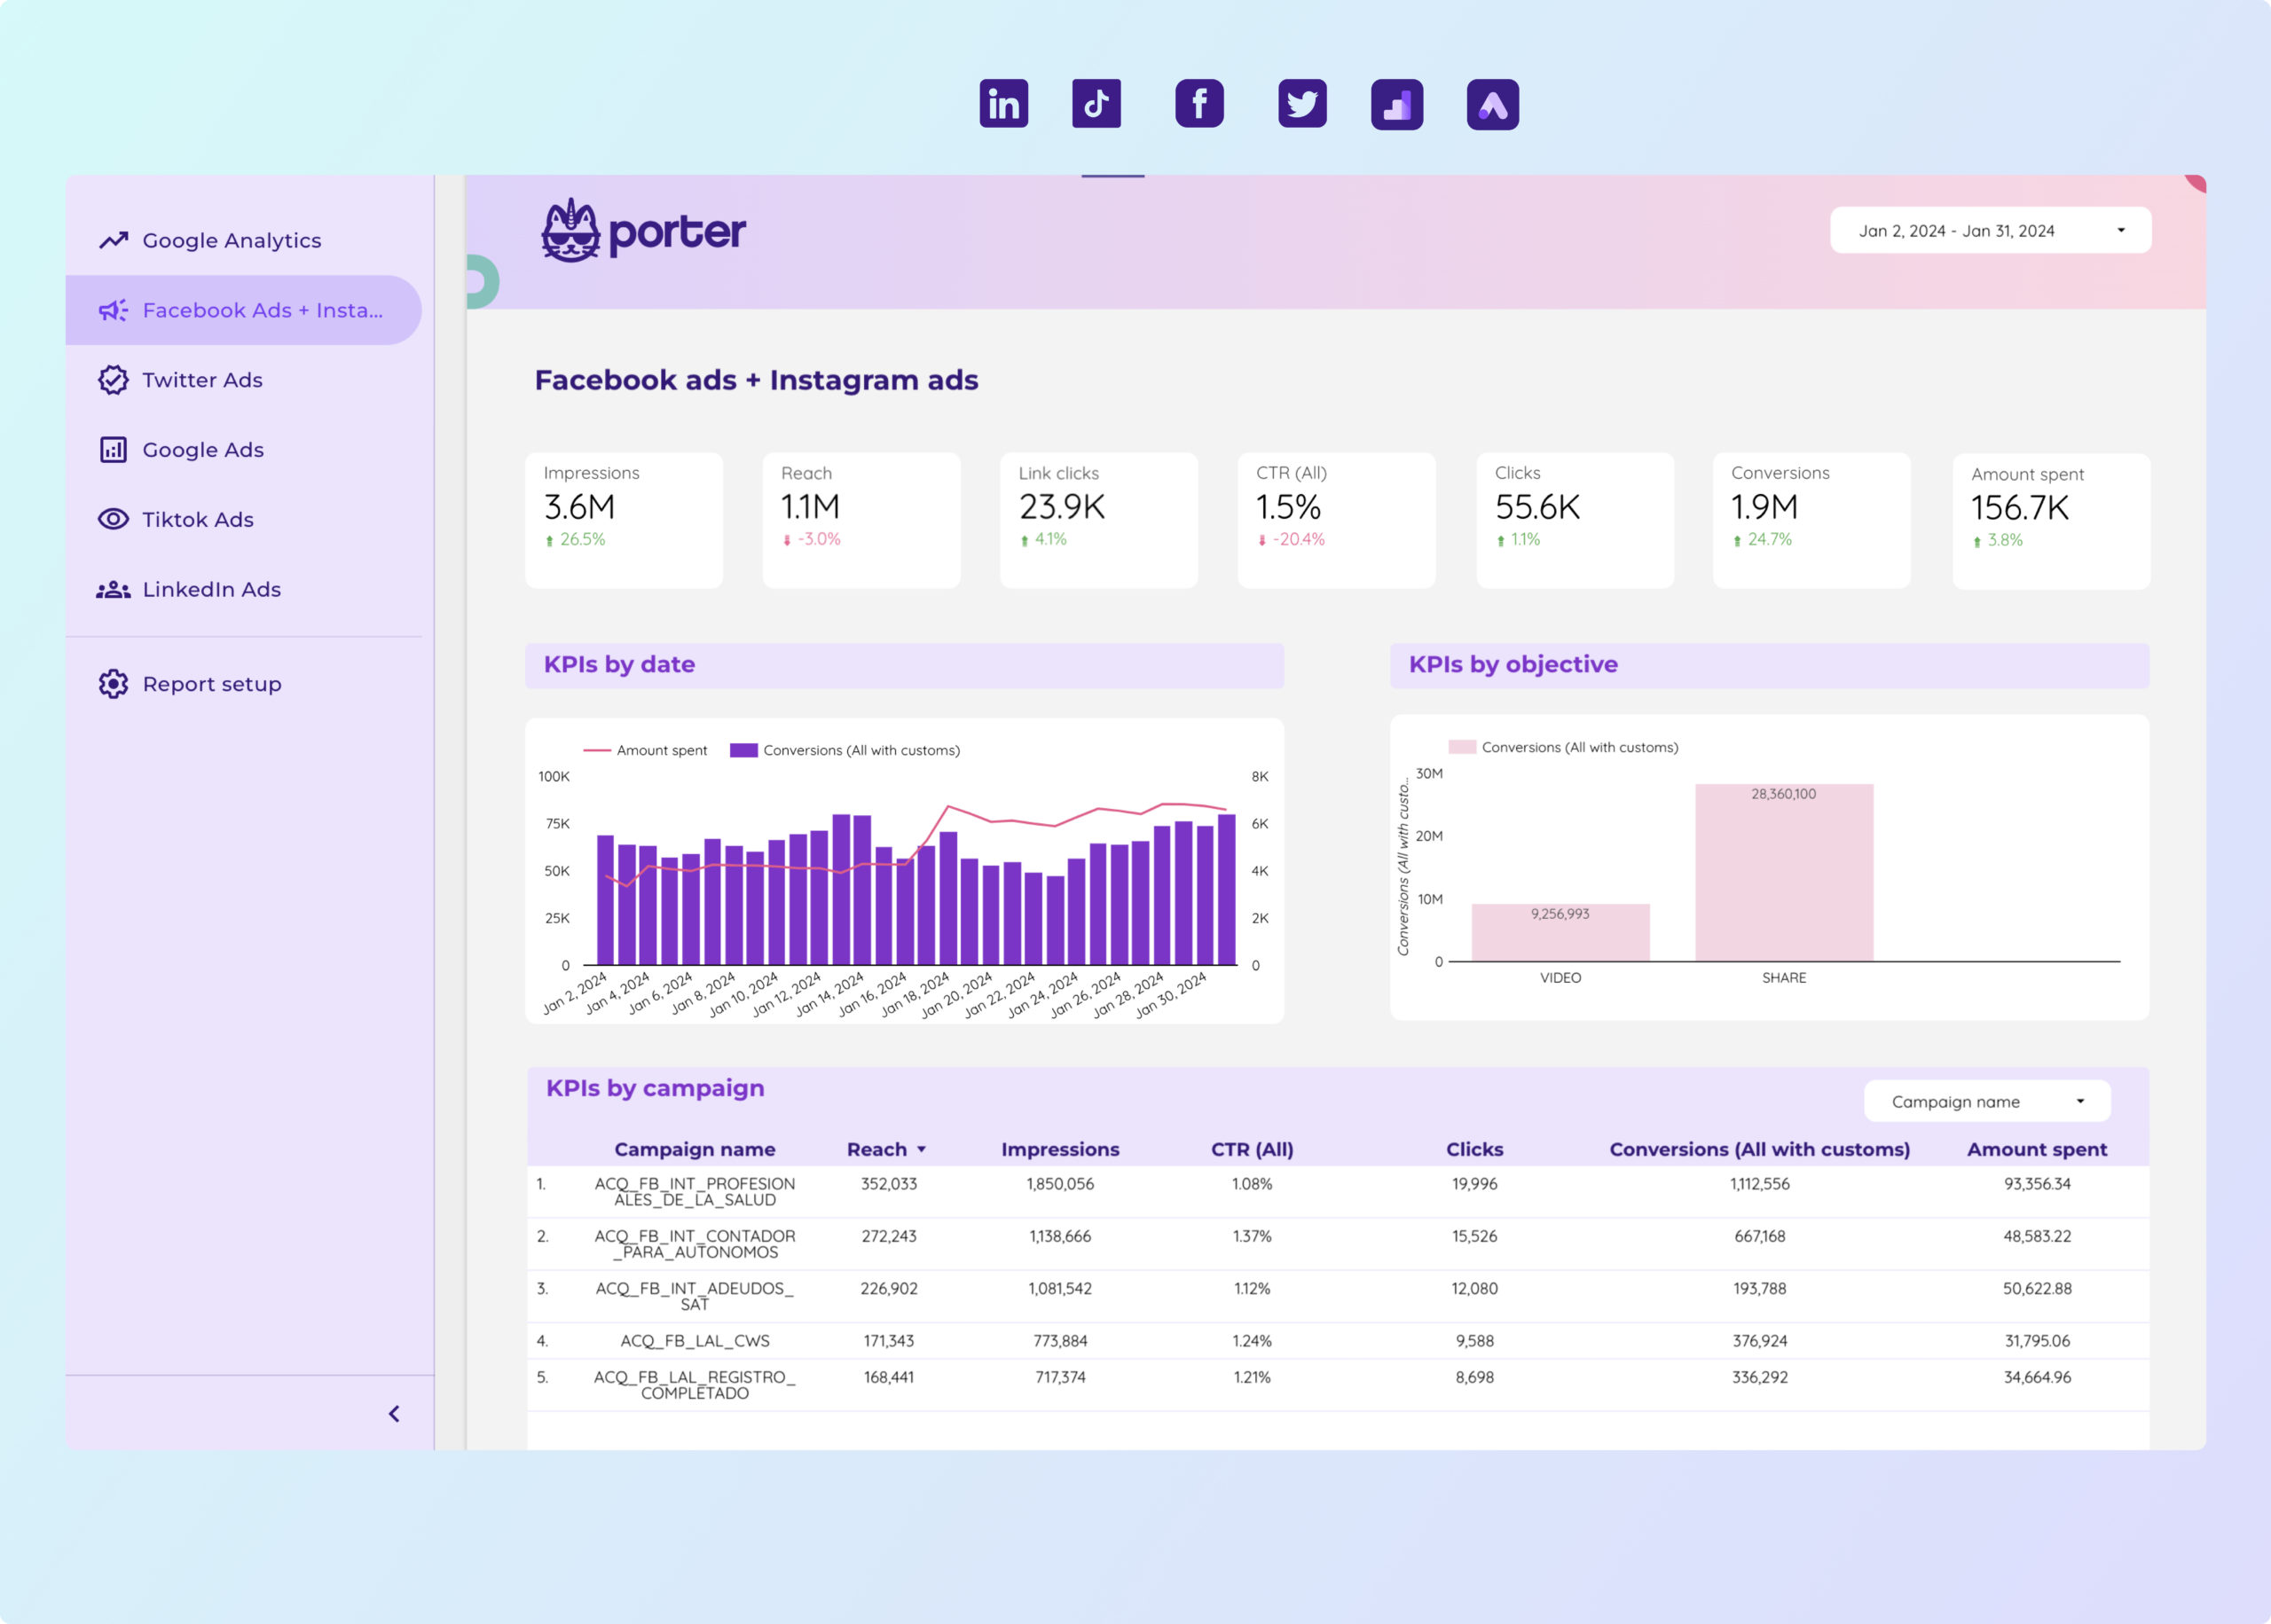
- Social media: competitor post metrics, follower growth, engaging topics/hashtags.
- Product reviews: sentiment analysis, ratings, feedback trends.
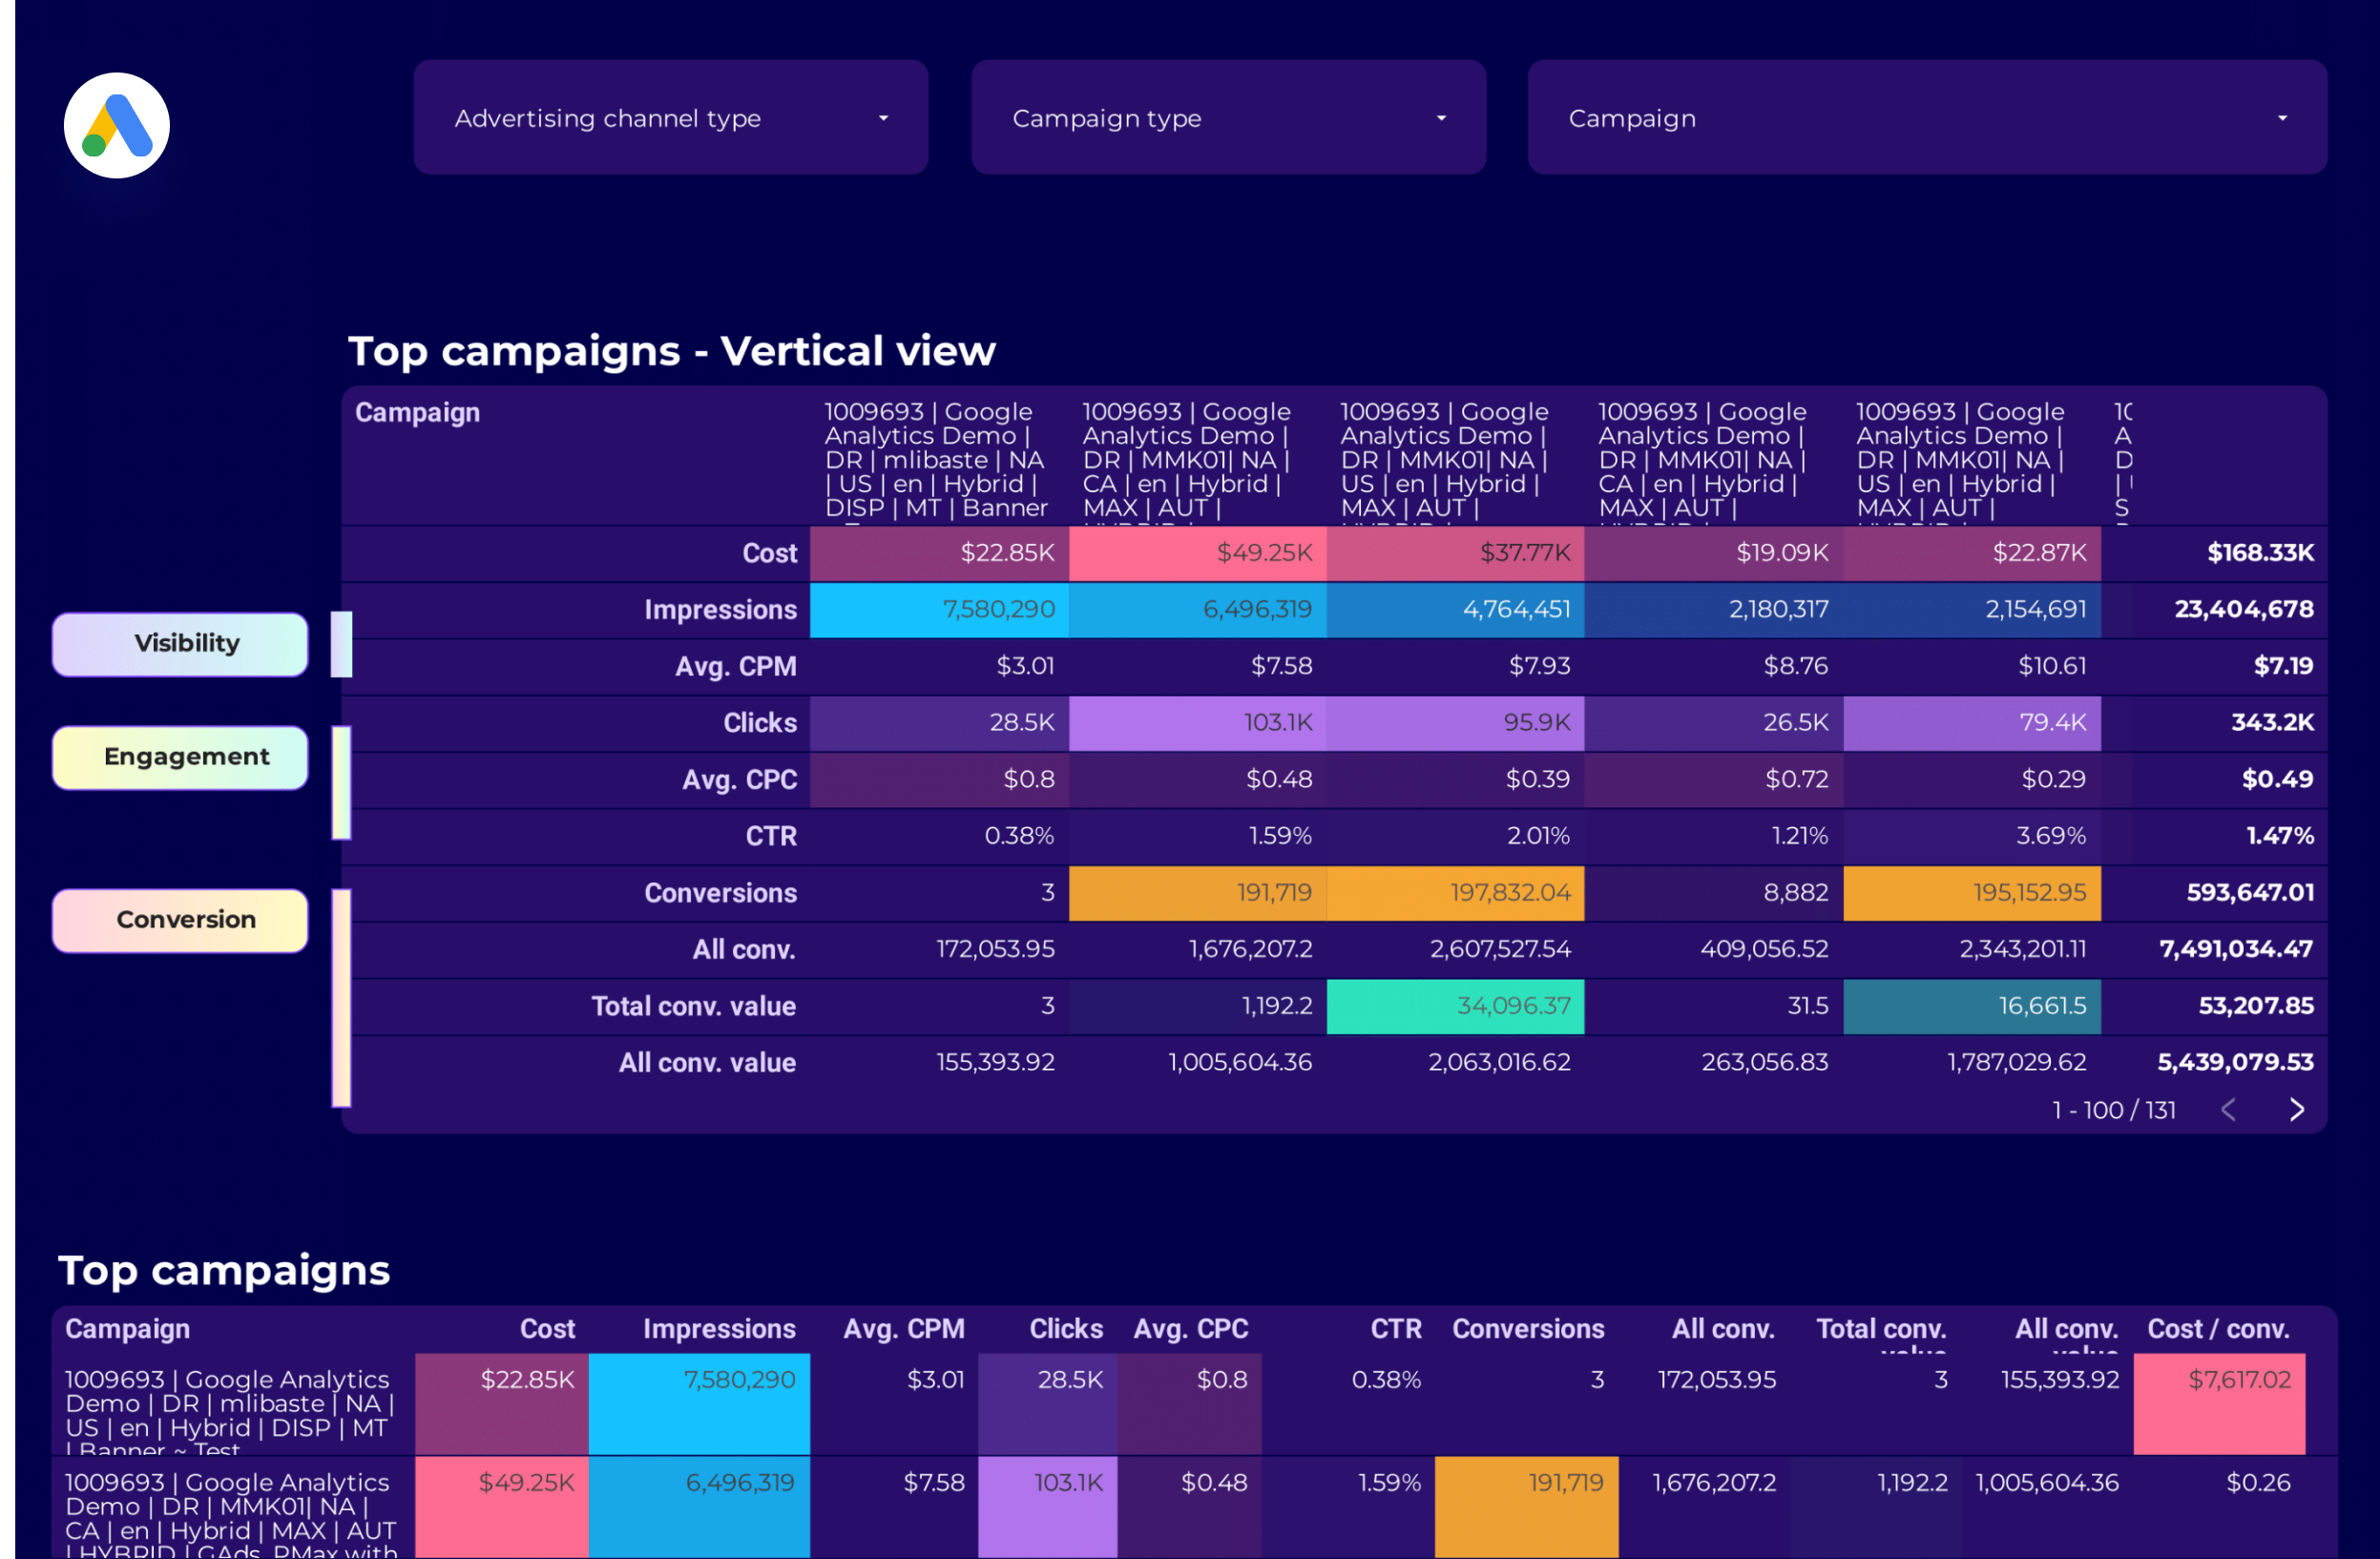
- SEO: competitor keyword rankings, backlinks, content performance.
Operational competitor analysis reports are highly customized, built in flexible tools like Google Sheets or Looker Studio to enable data cleaning, blending, annotations, and integrating multiple sources.
How to build a competitor analysis report?
To build a competitor analysis report, connect your data sources, choose a template on Looker Studio or Sheets, build your queries by selecting metrics and dimensions, choose charts to visualize your data, customize the report, design and share via link, PDF or email.
Here’s the breakdown:
Connect data sources
Define and connect the data sources to bring to your report. Common sources are market research databases, social media analytics tools, web analytics platforms, and competitor websites.
To connect your data sources, go to portermetrics.com, choose the data sources to bring to your report.
You can follow these tutorials on connecting your data:
Choose a template
Choose from dozens of competitor analysis report templates in Google Sheets or Looker Studio, designed for use cases like market share tracking, pricing analysis, and feature comparison.
Learn to copy Looker Studio templates.
While templates are the starting point. Make them specific for your business or agency. Map your specific metrics, especially custom market insights, competitor data, and all the fields and metrics that you define as "competitive advantages" and "market positioning".
Depending on your reporting tool—Google Sheets or Google Looker Studio, pick any of the dozens of templates created by our team and customers to solve your competitor analysis use cases, such as market share tracking, pricing analysis, and feature comparison.
Select metrics, dimensions, and charts
Once your report template is downloaded, you may 1)modify it or 2) create a blank page to build it from scratch. Whatever the case, setting up a query always follows these steps:
- Select the data source and the account connected to it
- Choose metrics (e.g. Market share, pricing, product features, etc.).
- Choose breakdowns to segment your data (e.g. by date, competitor name, product category, etc.)
You can follow these tutorials on adding data to your reports
Design
To make your competitor analysis reports truly white-label you can add logos, colors, fonts, and styling to mirror your brand.
Follow these tutorials to design your competitor analysis reports:
Share
Share your competitor analysis reports via links, PDF, schedule emails, and control permissions.
KPIs to include in a competitor analysis report?
Competitor analysis reports should include a mix of market position, pricing, product features, and customer sentiment metrics and KPIs to fully understand the competitive landscape. They include:
Market position KPIs measure the competitive standing in the market:
- Market share metrics: percentage of market, growth rate
- Pricing metrics: average price, discount strategies
- Product feature metrics: unique features, innovation index
Efficiency KPIs compare your competitive outputs to the cost, including:
- Market share: cost per market share point
- Pricing: price elasticity
- Product features: R&D cost per feature
Effectiveness KPIs compare the input with the output from one competitive stage to another
- Market share: growth rate
- Pricing: price competitiveness index
- Product features: feature adoption rate
Sales and cost KPIs show the bottom-line impact of your competitive performance:
- Sales: revenue, units sold
- Cost: production cost, marketing spend
- Efficiency: ROI, cost per feature
- Effectiveness: customer satisfaction index
To analyze these competitor KPIs, segment them by:
- Competitor: major, emerging, direct vs indirect
- Time: Hourly, daily, weekly, monthly
- Product: category, lifecycle stage
- Customer: demographics, preferences, behavior
- Content: marketing materials, campaigns, messaging