Everyone wants to be first on Google’s SERP. Some people might even think it’s simple: produce excellent content and presto! You are featured in the snippet.
Sorry to burst your bubbles, but it doesn’t happen like that. To make that wish come true, you will need a lot of SEO expertise, effort, and data tracking.
Making data-driven decisions is essential to get the most out of your SEO efforts in the long term.
But how can you make better-informed decisions with so much data to track and examine and many SEO tools claiming to collect data?
The truth is that not all tools are the same and most are so complicated that it feels like you need a degree to understand their interface.
To perform better with the available resources, you need a tool that provides you with a simple, quick overview of your activities and makes it simple for you to understand the numbers.
Google Data Studio is the tool and solution you are looking for. This blog post will tell you more about how to create your own SEO dashboard for Google Data studio to monitor relevant data easily.
Check out our free templates gallery
What is an SEO Dashboard?
An SEO Dashboard is a place for all your web analytics data. An SEO dashboard serves as a central hub for all of these data sources so that digital marketers can fully use KPIs and metrics to understand SEO performance from various angles.
SEO (Search Engine Optimization) is the process of making a webpage or website more visible using organic search engine results.
SEO aims to create valuable and personalized content that answers users’ online searches and can be recognized as useful and beneficial by search engines.
Without SEO, your website or business will lack visibility or awareness making it harder for people to find your business. Because of this, SEO is a crucial task for all businesses.
SEO metrics can help businesses know the best-converting keywords, best-performing web pages, and web pages that need to be optimized for search.
What KPIs Should Be Included in my SEO Dashboard?
● Impressions
When a user views an advertisement, this is referred to as an impression (also called a view-through). I
n reality, an impression happens each time a user launches an app or visits a website and sees an advertisement usually popping up before the user does anything, like YouTube ads.
In a broader sense, impressions are significant because they clearly represent the number of people viewing an ad on a given channel.
One of the simplest ways to determine how far an advertising channel actually reaches is to calculate the number of impressions a campaign produces.
● Keywords
Keywords are the words and phrases that people type into search engines to find what they are searching for.
For example, if you are looking to purchase a new laptop, you might type something like “laptops under $500” into Google.
Google in return will bring up businesses that are selling laptops under $500. And even though that phrase contains more than one word, it is still a keyword.
Keywords are crucial because your business can show up when people type certain keywords related to your business into search engines.
For instance, if you Google “Best Google Analytics 4 Report Templates” Google shows us on top.

Because of this keyword, people looking for Google Analytics 4 templates will see us, click our link, and then get exposed to other beneficial services we offer.
● Average Position
Average Position is a metric in Google Ads that help advertisers determine where, on average, their ads are showing on Google search results pages.
There are typically 4 available ad slots at the top of a search result page (where 1 is the first ad, 2 is the second ad, and so on).
So for the best results, advertisers will want an average position that is between 1- 4. The average position of 5+ means that your ads are at the bottom of the search results page.
You want your ads to perform and be seen by people. Most people won’t check the second page of the Google search.
So if your ad is located on the second page, there is a good chance that people won’t see it. Strive for 1-4 to get good results.
● Total Clicks
Total clicks are basically all of the clicks that were made on your campaign. Whether the click is unique or useful or not, this metric doesn’t care. As long as a click was made, it will be counted.
This is particularly useful to get a broader view of your campaign’s performance. Clicks mean your website has attracted enough interest from someone that they want to know more about what you offer.
● Click-Through-Rate (CTR)
Click-through rate is the ratio of users who click on a particular link to all users who view a page, email, or advertisement. It is mostly used to measure the success of ad campaigns for websites or even email campaigns.
A high CTR is a good sign that users find your listings and ads relevant and helpful. You can use CTR to determine which of your ads, listings, and keywords are effective for you and which could use some improvement.
● Country
This KPI is part of the demographic section and shows your audience’s countries. This data can help you personalize your marketing campaign to fit a particular audience.
For instance, if your data shows that most of your audiences are from Canada, you might decide to run targeted ads toward that country using familiar themes to make them comfortable.
● Device Type
This KPI shows the percentage of users visiting your website across all devices within your chosen timeframe.
It is crucial to understand how your users prefer to access your website so that you can optimize their experience on their preferred devices.
You don’t want to have a website that works well on a laptop and terrible on mobile, this means you will lose a lot of potential customers that access your website with mobiles.
Google Data Studio Connectors: Data Sources for Creating an SEO Dashboard
To start using Google Data studio, you need to first connect it with a data source. The good thing about Google Data Studio is, it’s quite easy to do and you can connect to any data source of your choice, some of which we will look at right now.
● Google Search Console
If your data source is Google search console, type “search console” in the search bar and click on it. Click on “authorize” if it’s your first time and it will link your website to the data studio automatically.

That simple.
● Google Analytics
If your data source is GoogleAnalytics, type “Analytics” in the search bar and click on it. Click on “authorize” for first-timers in Data Studio and it will link your Google Analytics to data studio automatically.

● Semrush
What if you are using a third-party tool already? That’s not a problem with Data Studio. Type in “Semrush” in the search bar and scroll down to partner connectors.

Select Semrush and it will integrate it into the data studio.
● Google Ads
You can connect your google ads easily into the data studio and edit them.

● Ahrefs Site Audit
As you can see in the image below, you can also connect the Ahrefs site audit to data studio.

● Amazon RedShift
As said earlier, type “Amazon RedShift” in the search bar and click on it. Click on “authorize” for first-timers in Data Studio and it will link your Amazon RedShift account to data studio automatically.

● Cloud Spanner
You can also integrate a SQL database through Cloud Spanner in Google data studio.

● eBay
You will most likely find this in the partner connector once you search for it.

● YouTube Analytics
Measure your campaign success on YouTube with YouTube analytics, which you can seamlessly add into a report in Google Data studio.

● Google My Business
Google my business is not officially in Google connectors but you will find it in Partner connector. Don’t worry your data is safe. Any third-party connector in partner connector is already vetted by Google.

The beauty of Google Data Studio is that you can also have multiple data sources in one report. That means a report can have data from YouTube, Google Ads, eBay, and Google My Business all in one report.
How to Build an SEO Dashboard in Google Data Studio?
Building an SEO dashboard isn’t that hard in Google Data Studio. Anyone and everyone can do it and before you know it, you would be creating something like this:
1. Sign in to Google Data Studio
Start by signing in at datastudio.google.com with the Google account you want to build the dashboard for.
2. Create a Blank Report
Once you are signed in, you will see a blank box with the + sign at the top of the page Click on it to create a blank report.

3. Connect to your Data Sources – Google Search Console
Once you click on the blank report, you will be prompted with a window to connect a data source to the report. You will see “add data to report” This is where you can add any data source you want.
For us, it will be Google Search Console.
4. Add the Second Data Source[1] [2] – G4
Adding a second data source slightly differs but is still easy to do. From your main screen click on “Resource” then select “Manage added data sources.”

Tip: This is where you can manage all data sources for your dashboard. Edit, Duplicate, or Remove a data source from the report can be done here.
Click on “Add a Data Source” and it will take you back to the list of data source options.

Click on the Data source you want to add and follow the same steps as above.
If you want to add a third-party data source like Semrush, eBay, or Facebook analytics, scroll down to the Partner Connector section and select the applicable data source.
5. Determine Your KPIs and Metrics
Next is to determine what KPI you want to track. Is it impression or CTR? Or maybe you want to know your follower growth so far on social media. Whatever it is, determine it and edit your data according to it.
6. Add Preferred Visualizations
Now we start editing our data with the various themes and charts options. Anything you want to add is acceptable, as long as it helps your report to be stunning and understandable.
7. Add Charts
To add charts, click on “ add a chart” and choose which chart you want to work with.

As you can see, there are multiple options to pick from.
8. Add a Table
Once you click “add a chart” the first subsection you will see under it is Table. Click on it and drop it on the page. It will load up with a random metric.
But you can change the metric by clicking the setup panel on the right-hand side. Here you can change the metric and the dimension to whatever you want to be displayed on the table.

Adding a table with the most crucial SEO KPIs – impressions, clicks, average position, and CTR is the best way to provide a high-level overview of SEO performance.
9. Add a Time Series Chart
The time series chart is also under “add a chart” You can use this to see how a metric performed during a period of time.
This is useful if your campaign has a clear start and end date, allowing you to see the improved performance of your SEO as a result of your optimizations and strategic approach.

Since it can take a few months for SEO optimizations to take effect, providing monthly or quarterly reporting can provide compelling evidence of improved SEO performance.
10. Add a Bar Chart
There are six different types of bar charts at your disposal. Use any of them while creating your report. A bar chart is a useful tool for visualizing SEO data.

A bar chart can show you which top pages on a website are performing the best in organic search especially if you want to compare them.
11. Add a Geo Chart
You can use a geo chart to identify the specific regions of the world where your clicks, users, impressions, etc. come from.

12. Add a Device-Type Pie Chart
If your SEO success is partially dependent on the type of device your visitors are using, then you can use the pie chart to represent the data.
The pie chart is under “add a chart” and you can reveal your data in the form of a pie chart.

This information is vital because users behave differently on desktops compared to mobile or tablet devices.
For instance, if a website isn’t mobile-friendly, but the majority of its organic visitors come from mobile devices, that information might persuade the website owner that site speed or mobile optimization services are necessary.
13. Add a Scorecard
A scorecard summarizes the total value of a metric.

So for instance, to get the total sales, average bounce rate, active users, purchases, CTR, and so on, use a scorecard.
14. Add a Date Slicer
Follow these steps to add a date slicer that will allow you to compare your performance over time:
- In the toolbar at the top, click “Add a control” scroll down, and click the “date range icon.”
- Click and drop or drag and drop it in your dashboard.
- Then under the Data tab, select the default date range.


You can use the date slicer to gauge how your SEO efforts have been over a specific period of time.
15. Mix & Match Your Visualizations
You can alter the themes, colors, and text that appear on your SEO report. You can include your agency’s or your SEO company’s logo to give the document a more professional look.

Remember that the specific data story you want to tell will determine the data combinations and visualizations you will include in your report.
16. Change Themes
You can easily change your theme in data studio. Click on Theme and layout in the upper panel, scroll down to the right panel, pick your theme, and customize it to your preferences.

17. Download and Share the dashboard
To download your report, click on “file” and select “download as” you will get the option of PDF. Click on it and it will download.

You can now share your report. Alternatively, you can also click on the share button and add the email of the person you want to share it too. Click on manage access to set the permissions of the users to how you see fit.
Use Cases for Google Data Studio SEO Dashboards
1. Real-time reporting
You can monitor your website in real-time. This will enable you to see the pages that are currently drawing visitors to your website as well as their sources.
You can assess the effectiveness of your campaigns, events, and social media posts to see whether or not they are bringing visitors to your website.
2. Insights report
You can analyze behavioural metrics and find certain data points with the help of SEO dashboards. For instance, do you want to know where your engaged audience is from, or the behaviour of certain user segments? All these and more you can do with an SEO dashboard.
3. Session
You can tell how engaged a user is with the content by how long they stay on a page. Every SEO goal list should include average session time since it provides insight into user engagement by tracking how long visitors stay on a given landing page.
This is a useful tool for determining whether page content meets search intent because if it doesn’t, Google will rank down your page for that specific search query on the grounds that it doesn’t meet users’ expectations.
Best SEO Reporting Dashboards to Check out
1. Porter Metrics

Porter Metrics is one of the best SEO reporting dashboards you will ever get. It’s budget-friendly compared to the others listed in this list, with a starting price of $15.
Porter Metrics integrates your daily social media and marketing data to Google Data Studio, enabling you to automate your reporting with just a few mouse clicks.
We also provide templates so you don’t have to build from scratch, making it easier to organize and visualize all of your high-volume marketing data.
You can either create your own reports and dashboard using one of Porter Metrics’ 80+ report templates. Porter metrics is a crucial tool for businesses looking to track their most important KPIs.
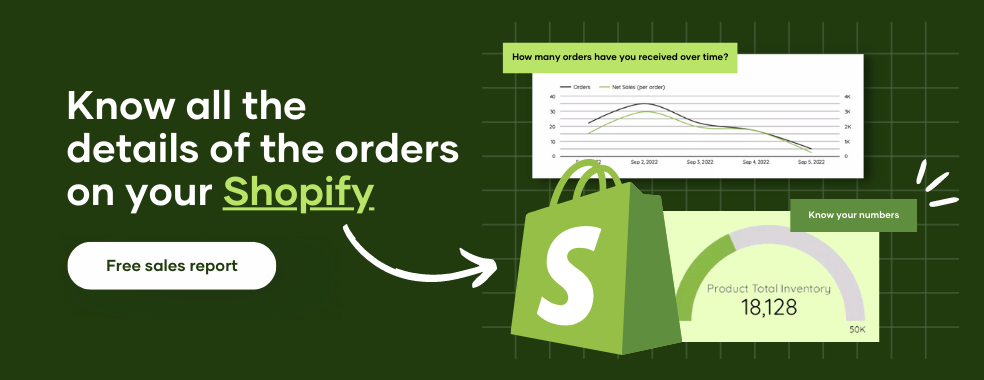
It allows you to connect your essential business data with other applications you already use, such as Hubspot, Mailchimp, Shopify, Instagram, TikTok, and other social media sites, as well as all of your marketing data.
Additionally, you can use Porter to calculate your overall advertising expenditure and return on investment from different ad channels, including those provided by Google, Facebook, Instagram, LinkedIn, and TikTok.
Interestingly, you can get connected for free and then pick any band packages from our price packages that starts from $15/month.
Below is a sample of what you can expect when you use Porter Metrics to access your SEO backend.

Would you rather painstakingly develop an SEO Dashboard template from scratch or use a proven growth-focused template that has helped thousands of similar brands consistently grow their revenue?
Right here, for free and on one SEO Google Data Studio template, we offer you the opportunity to see a lot more than customers who frequently visit your website.
On this template, you’ll find insights you need to grow your revenue and outsmart your competitors to gain new insights to become a thought leader and a giant in your space.
You can now access this conversion-focused SEO dashboard you need to spark and sustain business growth consistently.
All you’ll need to do to grow your store will be to starve the negative numbers and feed the positive numbers.
Like others, you will experience mind-blowing growth when you stick to the plan, monitor the metrics, and do everything you can to keep the green numbers bigger and better than you met them.
To access this template and get it connected to your backend, please click on this link to access the template or you can have our support staff guide you through the entire process of linking this template to your backend here.
Please have this template’s URL handy when you are scheduling a call with us so we can quickly guide you through the connection process.
Here are a few more screenshots of our templates you might want to try for free for 14 days.

And this

These and more will be available to you when you pick Portermetrics, and schedule a call with us to guide you through the setup process.
Once you can get this working, then you are good to go. Let’s look at other available options.
2. Dashthis

Dashthis is a digital marketing dashboard solution for all things sales and marketing. It is one of the best SEO reporting dashboards because it makes creating reports for your marketing data more accessible and faster.
Along with the standard features, it has a number of pre-made templates that let you get going immediately. You can choose to change how the dashboard’s components look.
With Dashthis, you can track KPIs, automate client reporting for SEO projects, and personalize SEO reports, and then finally, you can share your dashboards with your team so they can access all the required data.
The price starts from $39/month.
3. Klipfolio

KlipFolio dashboard clearly shows a good number of important SEO metrics, such as the percentage of traffic coming from the top 10 pages, the number of keywords on Page 2 or above, the time it takes for the page to load, and the number of keywords that are ranked #1.
Additionally, it gives your website a mobile-friendliness score. This enables you to modify your website to appear higher in search results on mobile devices.
Klipfolio can pull data from a variety of several data sources, including SQL databases, FTP servers, Google Drives, hard drives, other SaaS applications, data warehouses, etc., and make it incredibly simple to share reports via email, Slack, published links, or by adding users.
Price starts from $99/month
4. Geckoboard

Geckoboard is a dashboarding platform for gathering and assessing data from various sources. It has a filtering feature that helps you focus on your needed metrics.
Data visualization options are also available on Geckoboard to help present data understandably.
Site audits notify you of mistakes and cautions preventing you from reaching your website traffic objectives. The dashboard seamlessly integrates with Salesforce, MailChimp, Asana, and more.
Price starts from $39/month
5. Whatagraph

Whatagraph is the best SEO dashboard tool for white-label reports. Reports can be fully customized by changing the font, colors, style, and shades.
You can also use your agency’s logo in place of Whatagraph’s to strengthen your branding. You can also send reports with your domain in the URL to stakeholders.
Whatagraph integrates with Semrush, Google Sheets, Google Analytics, Google My Business, and other SEO reporting tools.
The price starts from $199/month.
Benefits of Using Porter for Building SEO Dashboards
1. More accurate revenue and sales forecasting
Porter Metrics provides better insights into customer purchasing behavior, enabling you to precisely plan and anticipate goals and deliverables using accurate historical consumer data.
You can also measure those goals in real-time to validate actions or react and modify any sales or marketing strategies.
2. Effective time management
Porter Metrics provides real-time information, which saves you valuable time by eliminating the need to generate reports manually from various systems.
With quick access for authorized personnel, these centralized platforms gather all relevant data and measurements for you and visually present them.
3. More performance visibility
Essential information about your business is more visible thanks to Porter Metrics SEO dashboards, which you can access whenever possible. This helps you better comprehend market fluctuations and adapt to them.
4. Make data-driven decisions.
With Porter Metrics SEO dashboard, you can quickly and thoroughly analyze data for specific metrics that demonstrate a product’s performance and gain a broad picture of the entire business’s performance.
Vast amounts of data are more understandable, and you can choose statistics relevant to each business decision, which helps make well-informed decisions.
5. Easy to manage
Porter SEO Dashboards are simple to set up, maintain, and use. You require no technical knowledge or “degree” to use Porter SEO dashboards. Anyone and everyone can use it.
They are also mobile, making business intelligence available for use across borders, on the go, or for business travel.
Free SEO Dashboard Templates
These are some of the templates you can use for free with Porter Metrics, and they will significantly help your SEO efforts.
● Google Analytics KPI Dashboard
This template will help you track your Google analytics KPI.

● Google Analytics Acquisition Snapshot Dashboard
This template will help you find out how your acquisition efforts are progressing. Know more about your customer and where they come from.

● Google Analytics Landing Page SEO Dashboard
This template shows how well your landing page SEO is performing.

● Google Analytics Traffic Growth Dashboard
Capture key metrics contributing to your traffic growth with this template.

● Google My Business Dashboard
This Google Business Profile report is the most comprehensive one available online. You can audit your listings and locations with a complete overview of this free service.
This automatic report includes numerous analyses and uses cases for your Google Business Profile, so you don’t need to pull data from the spreadsheets manually.

With the help of this report, you can visualize all the crucial KPIs and metrics you need to understand your Google Business profile Listings Insights.
Additionally, this report can show you how your pages are expanding and give you a comprehensive overview of how your local SEO is working.
● Google Analytics Content Analysis Dashboard
This free template allows you to visualize how people use Google Analytics and Google Data Studio to engage with your website content.

This template includes:
- Setup guide
- Visualization of crucial content consumption and engagement metric
- Toggle metrics on each visualization
- Break down data by page, medium, source, device, and country
- Organize data by day of the week, week, or month.
● Google Search Console Dashboard
By separating keywords into branded and non-branded terms, you can improve your SEO performance analysis using these free templates.
You can connect your Google Search Console account in just a few clicks and create a copy, even with your business name and logo.

Conclusion
Are you sick and tired of chasing your data across multiple dashboards and never knowing where it is? Do you spend hours deciding which visualizations to make the dashboard visually pleasing and clear?
Have trouble deciding which metrics to use and perpetually feeling like something is lacking? If that’s the case for you, try Porter Metrics.
We will surely deliver an outstanding SEO report for you in less than 10 minutes. Yes, 10 minutes. Once you contact us and provide all the required information, we will work on your report, which will be delivered in less than 30 minutes.
Our plan starts at $15, and with it, you are assured customer service you can reach 24/7, even on public holidays, whenever you need assistance.
With Porter Metrics, you can skip straight to the section where you analyze your data and draw conclusions that will help you improve your SEO strategy.
We have mastered the art of creating stunning and easily understandable dashboards.
Frequently Asked Questions
What is the difference between a dashboard and a report?
Reports and dashboards both present information and data. Reports are more intricate and detailed than dashboards, which are meant to be a quick summary.
A real-time dashboard showing your SEO data is helpful for daily operations.
Reporting is more helpful for making future operational plans and getting a general picture of a business and its SEO efforts.
How do I build an SEO dashboard?
- Sign in to datastudio.google.com with your google account.
- Click on create a blank report.
- Add your data source.
- Determine your KPI and Metric
- Edit, Edit, and Edit as much as possible till you are satisfied.
Can I share my SEO report from Google Data Studio?
Yes, you can. Click on the share button and add the email of the person you want to add. You can also copy the link when you click on manage access and share.
Lastly, there is a download button for you to download your SEO report as a PDF and easily share it.
What should an SEO dashboard contain?
An SEO dashboard should have data about organic traffic, keyword position rankings, and the search terms visitors use to find your site and pages.
How many data sources can Google Data Studio have?
Google Data Studio allows you to add/blend up to 5 data sources in one chart.
What is a KPI?
KPIs are quantifiable metrics used to assess the performance and success of an SEO campaign. Monitoring your most crucial search metrics gives you more insight into your visibility and ranking on search engines and conversions that can be attributed to organic performance.