


PPC multi-channel Report template for Marketing teams and agencies
Get the actual PPC multi-channel on Looker Studio template used by Porter to monitor PPC performance.

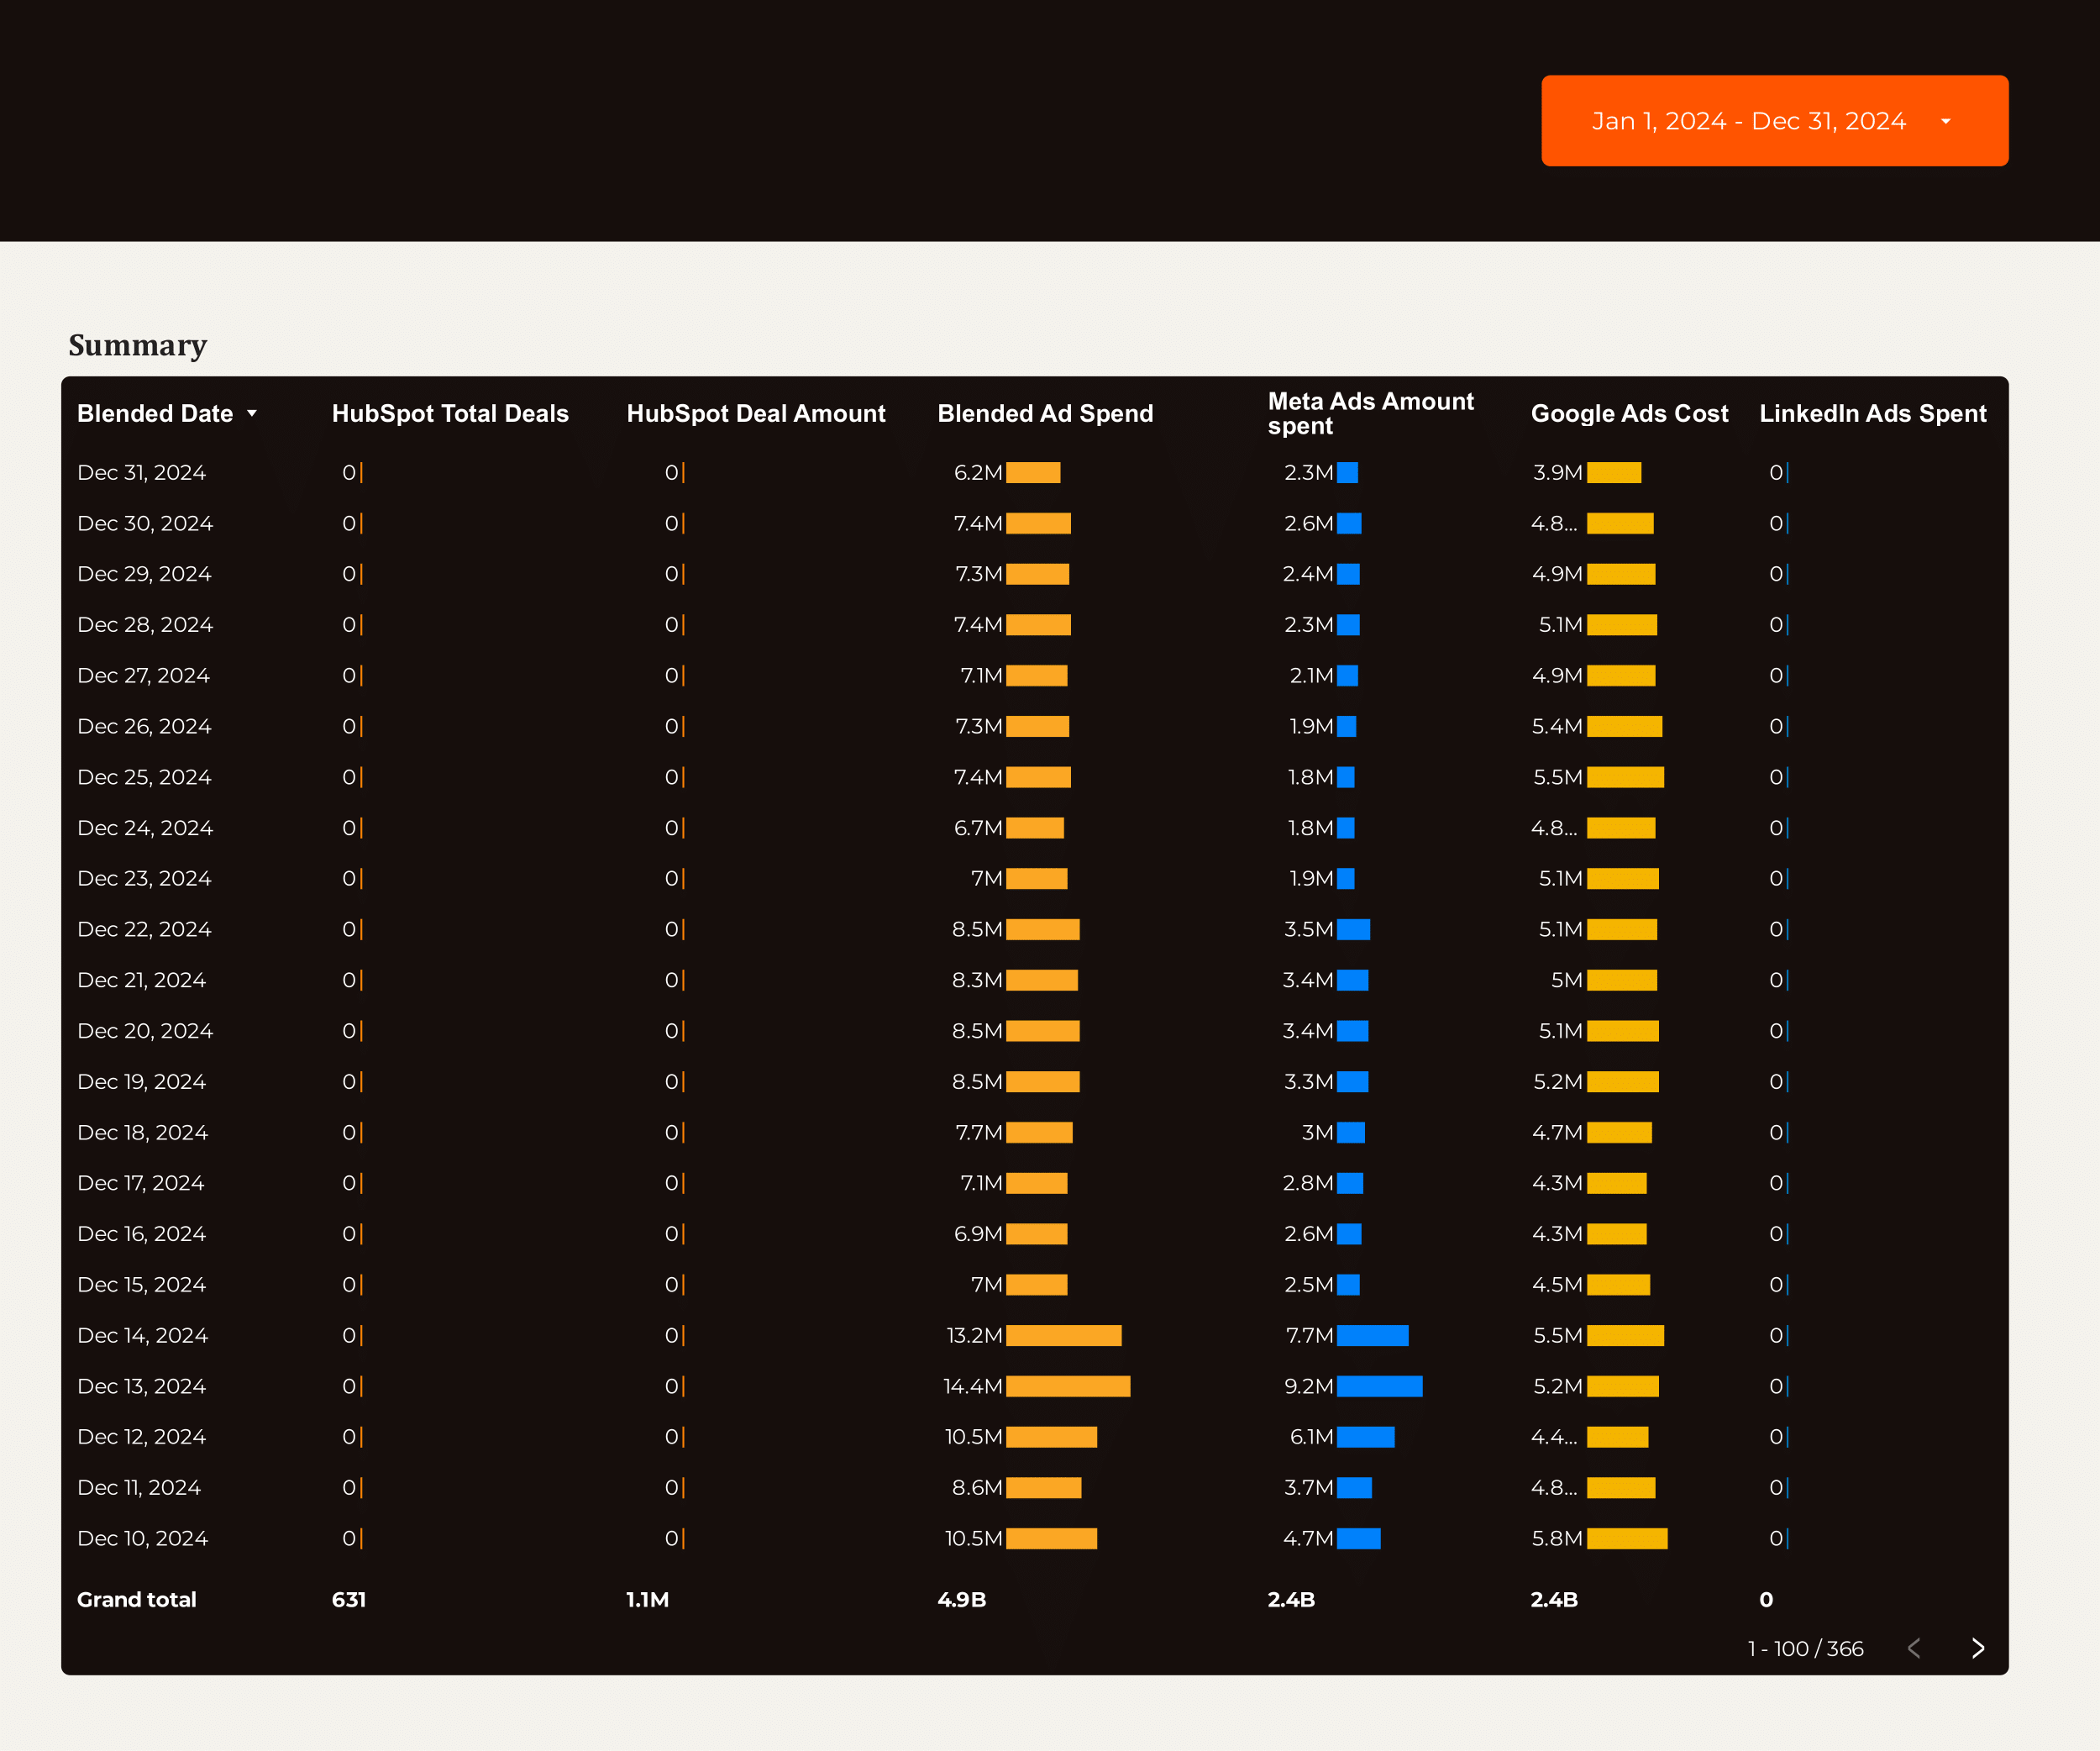
ROAS Report template for Marketing teams and agencies
Track PPC performance with this PPC ROAS report template. Measure CTR, CPA, and conversion rates. Analyze ad placement, audience, and creative formats. Integrate data from Facebook Ads and Paid Media. Segment by time and demographics for actionable insights. Ideal for marketing teams aiming to optimize their strategy and achieve specific goals.
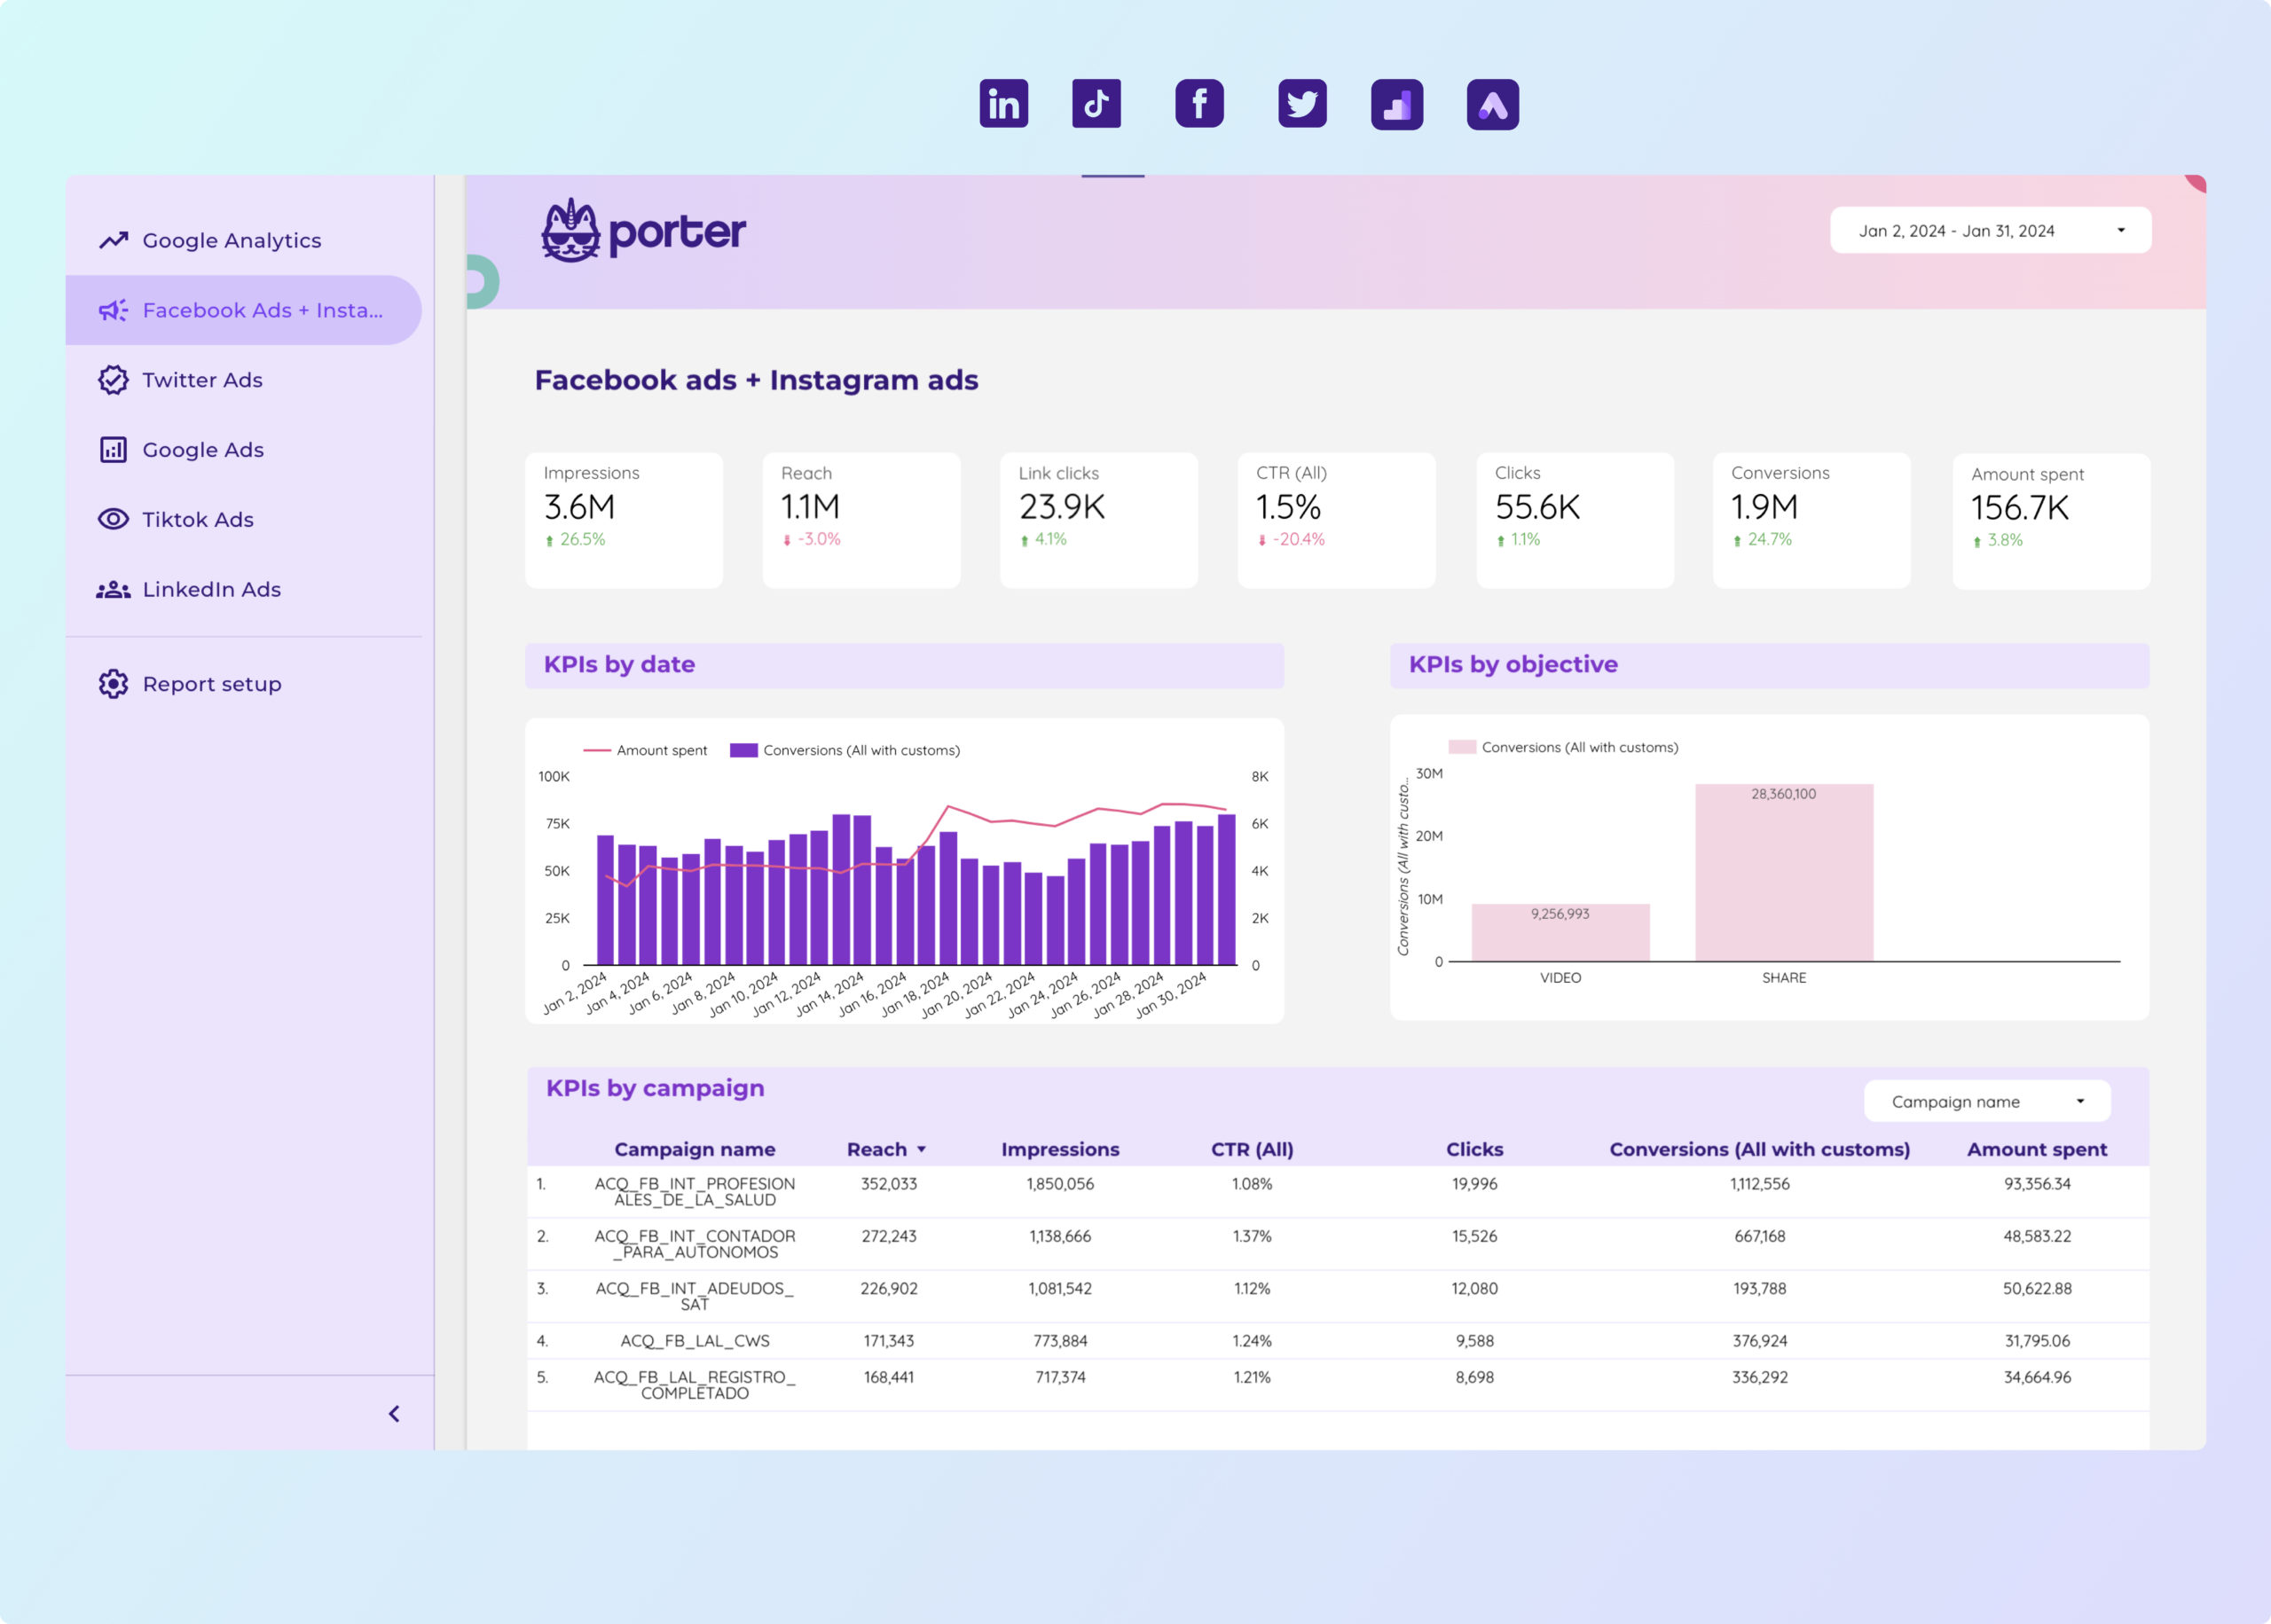
Paid media Report template for Marketing teams and agencies
Analyze key metrics like CTR, conversion rate, and CPA with this Paid media report template. Integrate data from Facebook Ads, TikTok Ads, Google Ads, and more. Segment by location, age, and interests. Ideal for PPC specialists to track performance and refine strategies across platforms using Google Analytics 4.
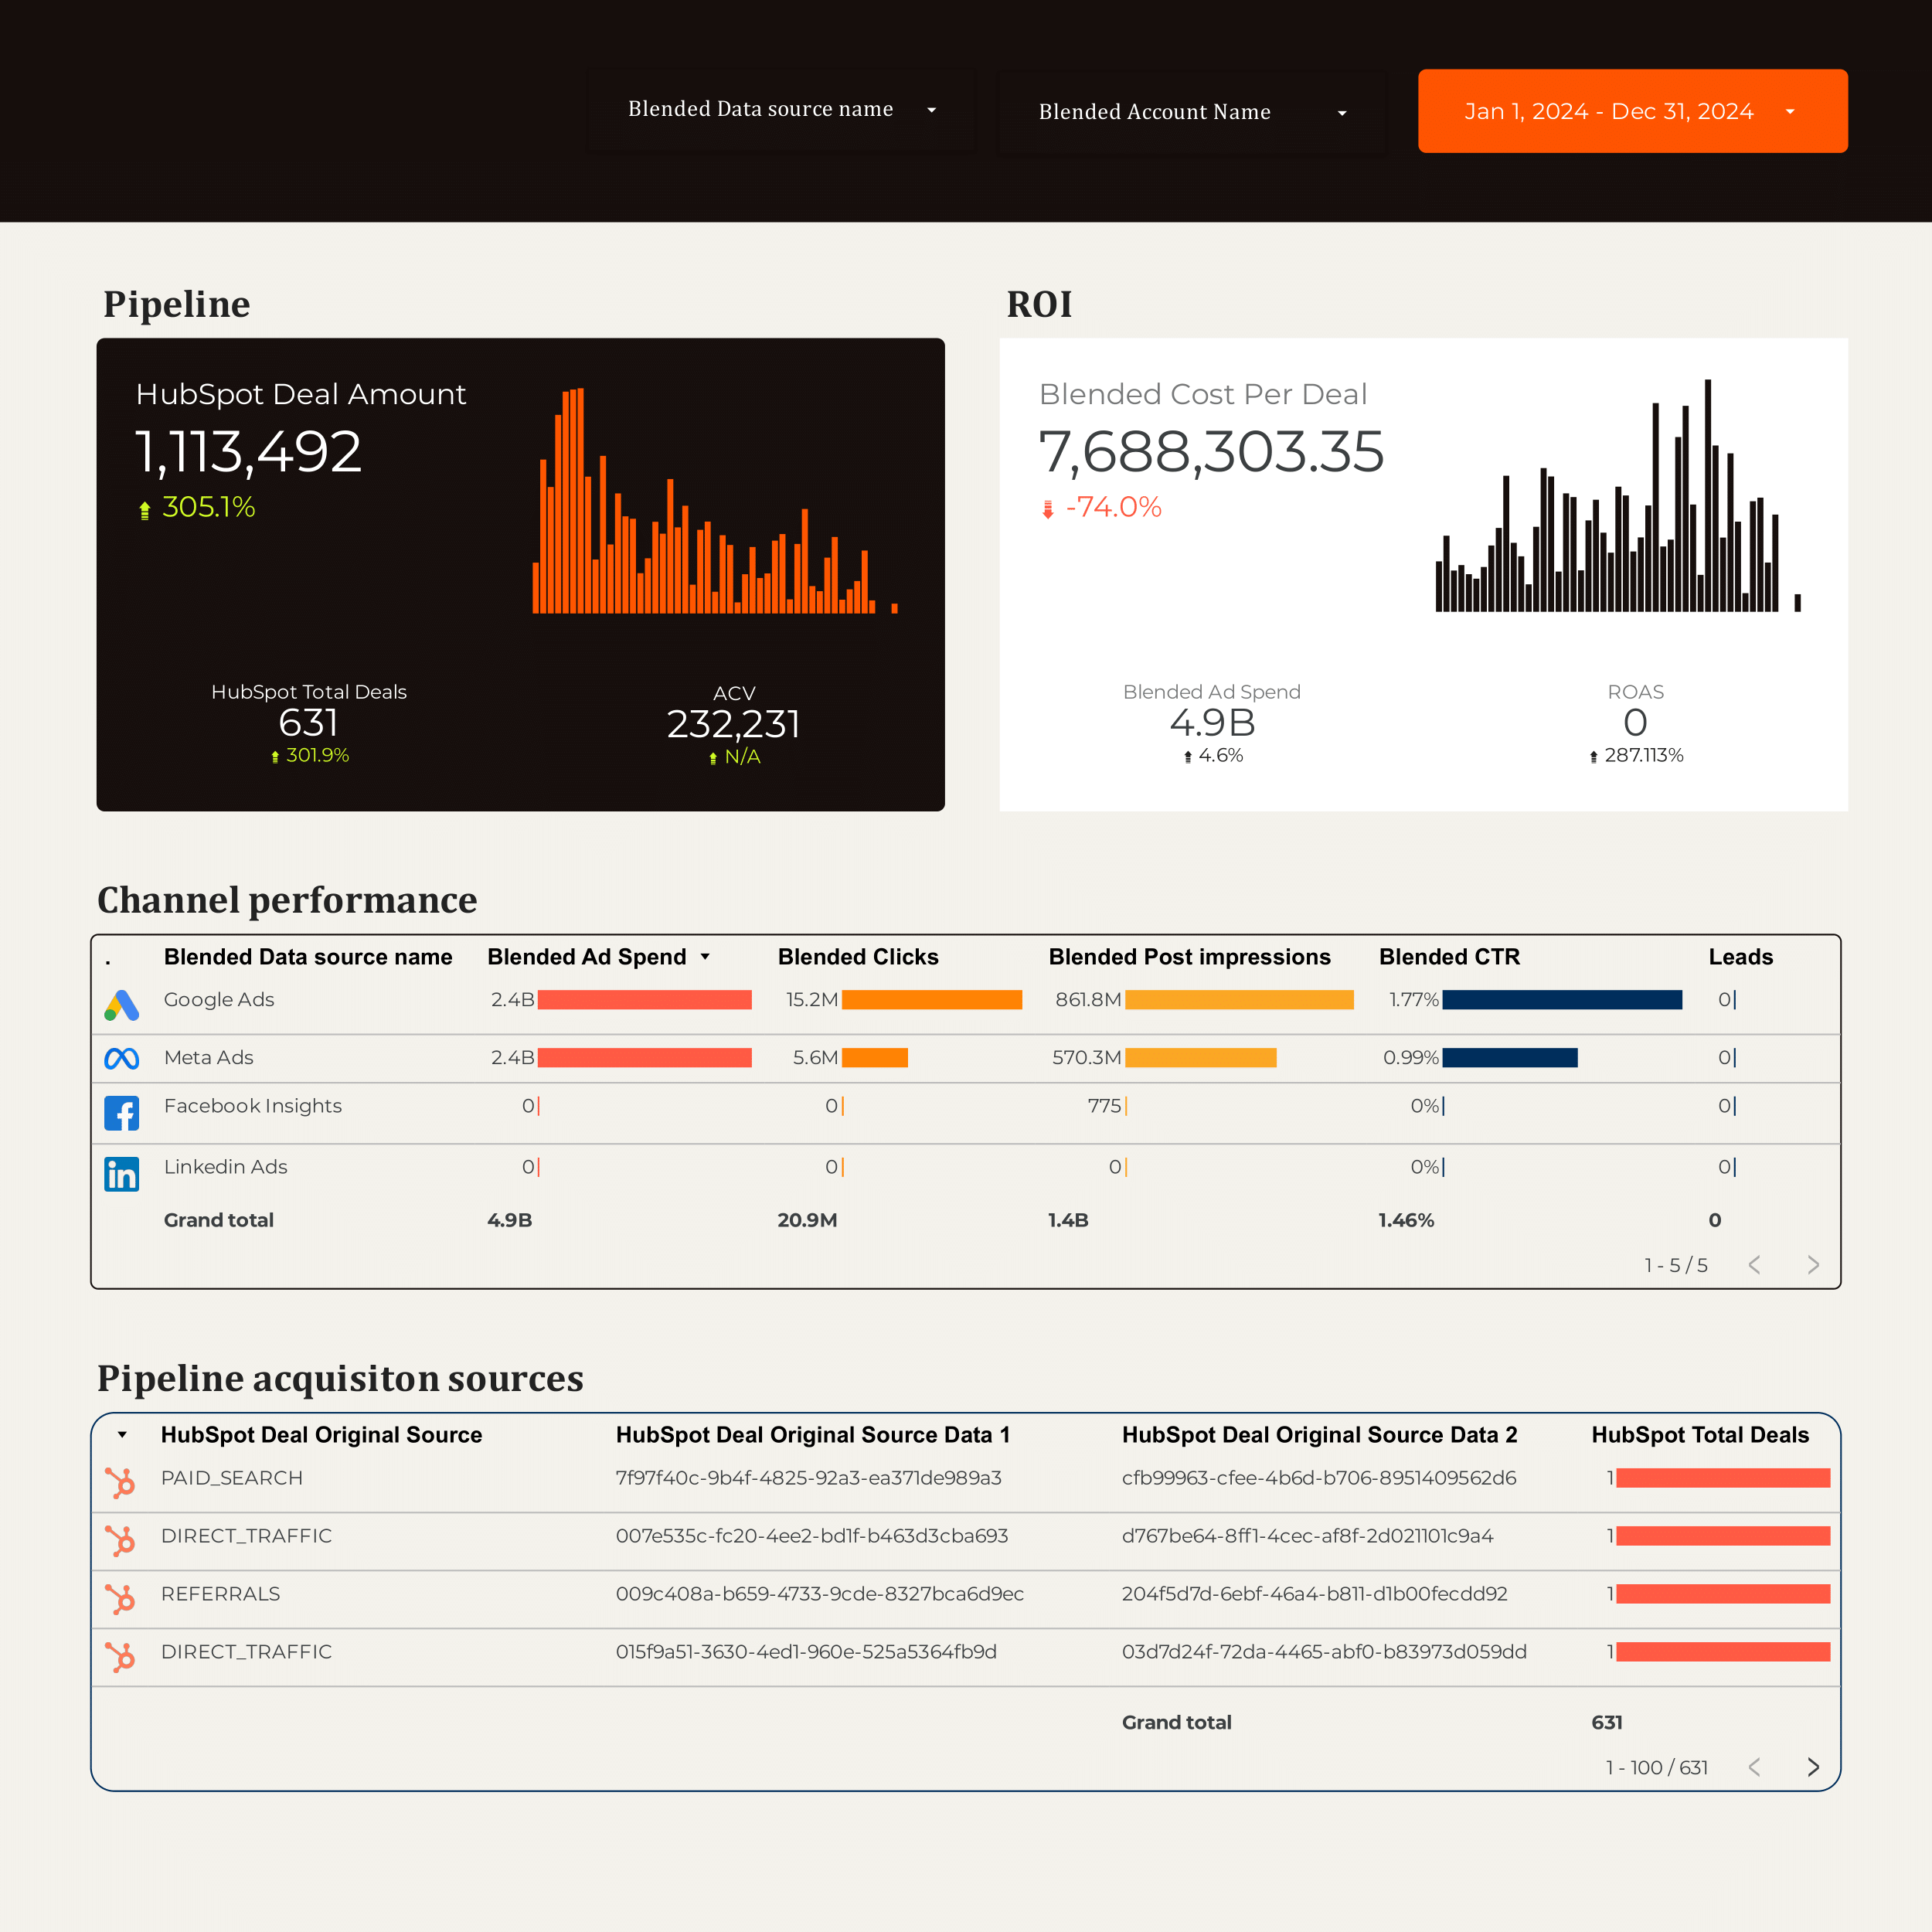
Demand generation Report template for Marketing teams and agencies
Optimize B2B demand generation with this report template. Track conversion rates, cost per conversion, and click-through rates. Analyze social media shares and impressions. Integrate data from CRM, E-commerce, Facebook Ads, Google Analytics 4, and LinkedIn Ads. Segment by demographics and time for strategic insights. Ideal for marketing teams focused on performance.
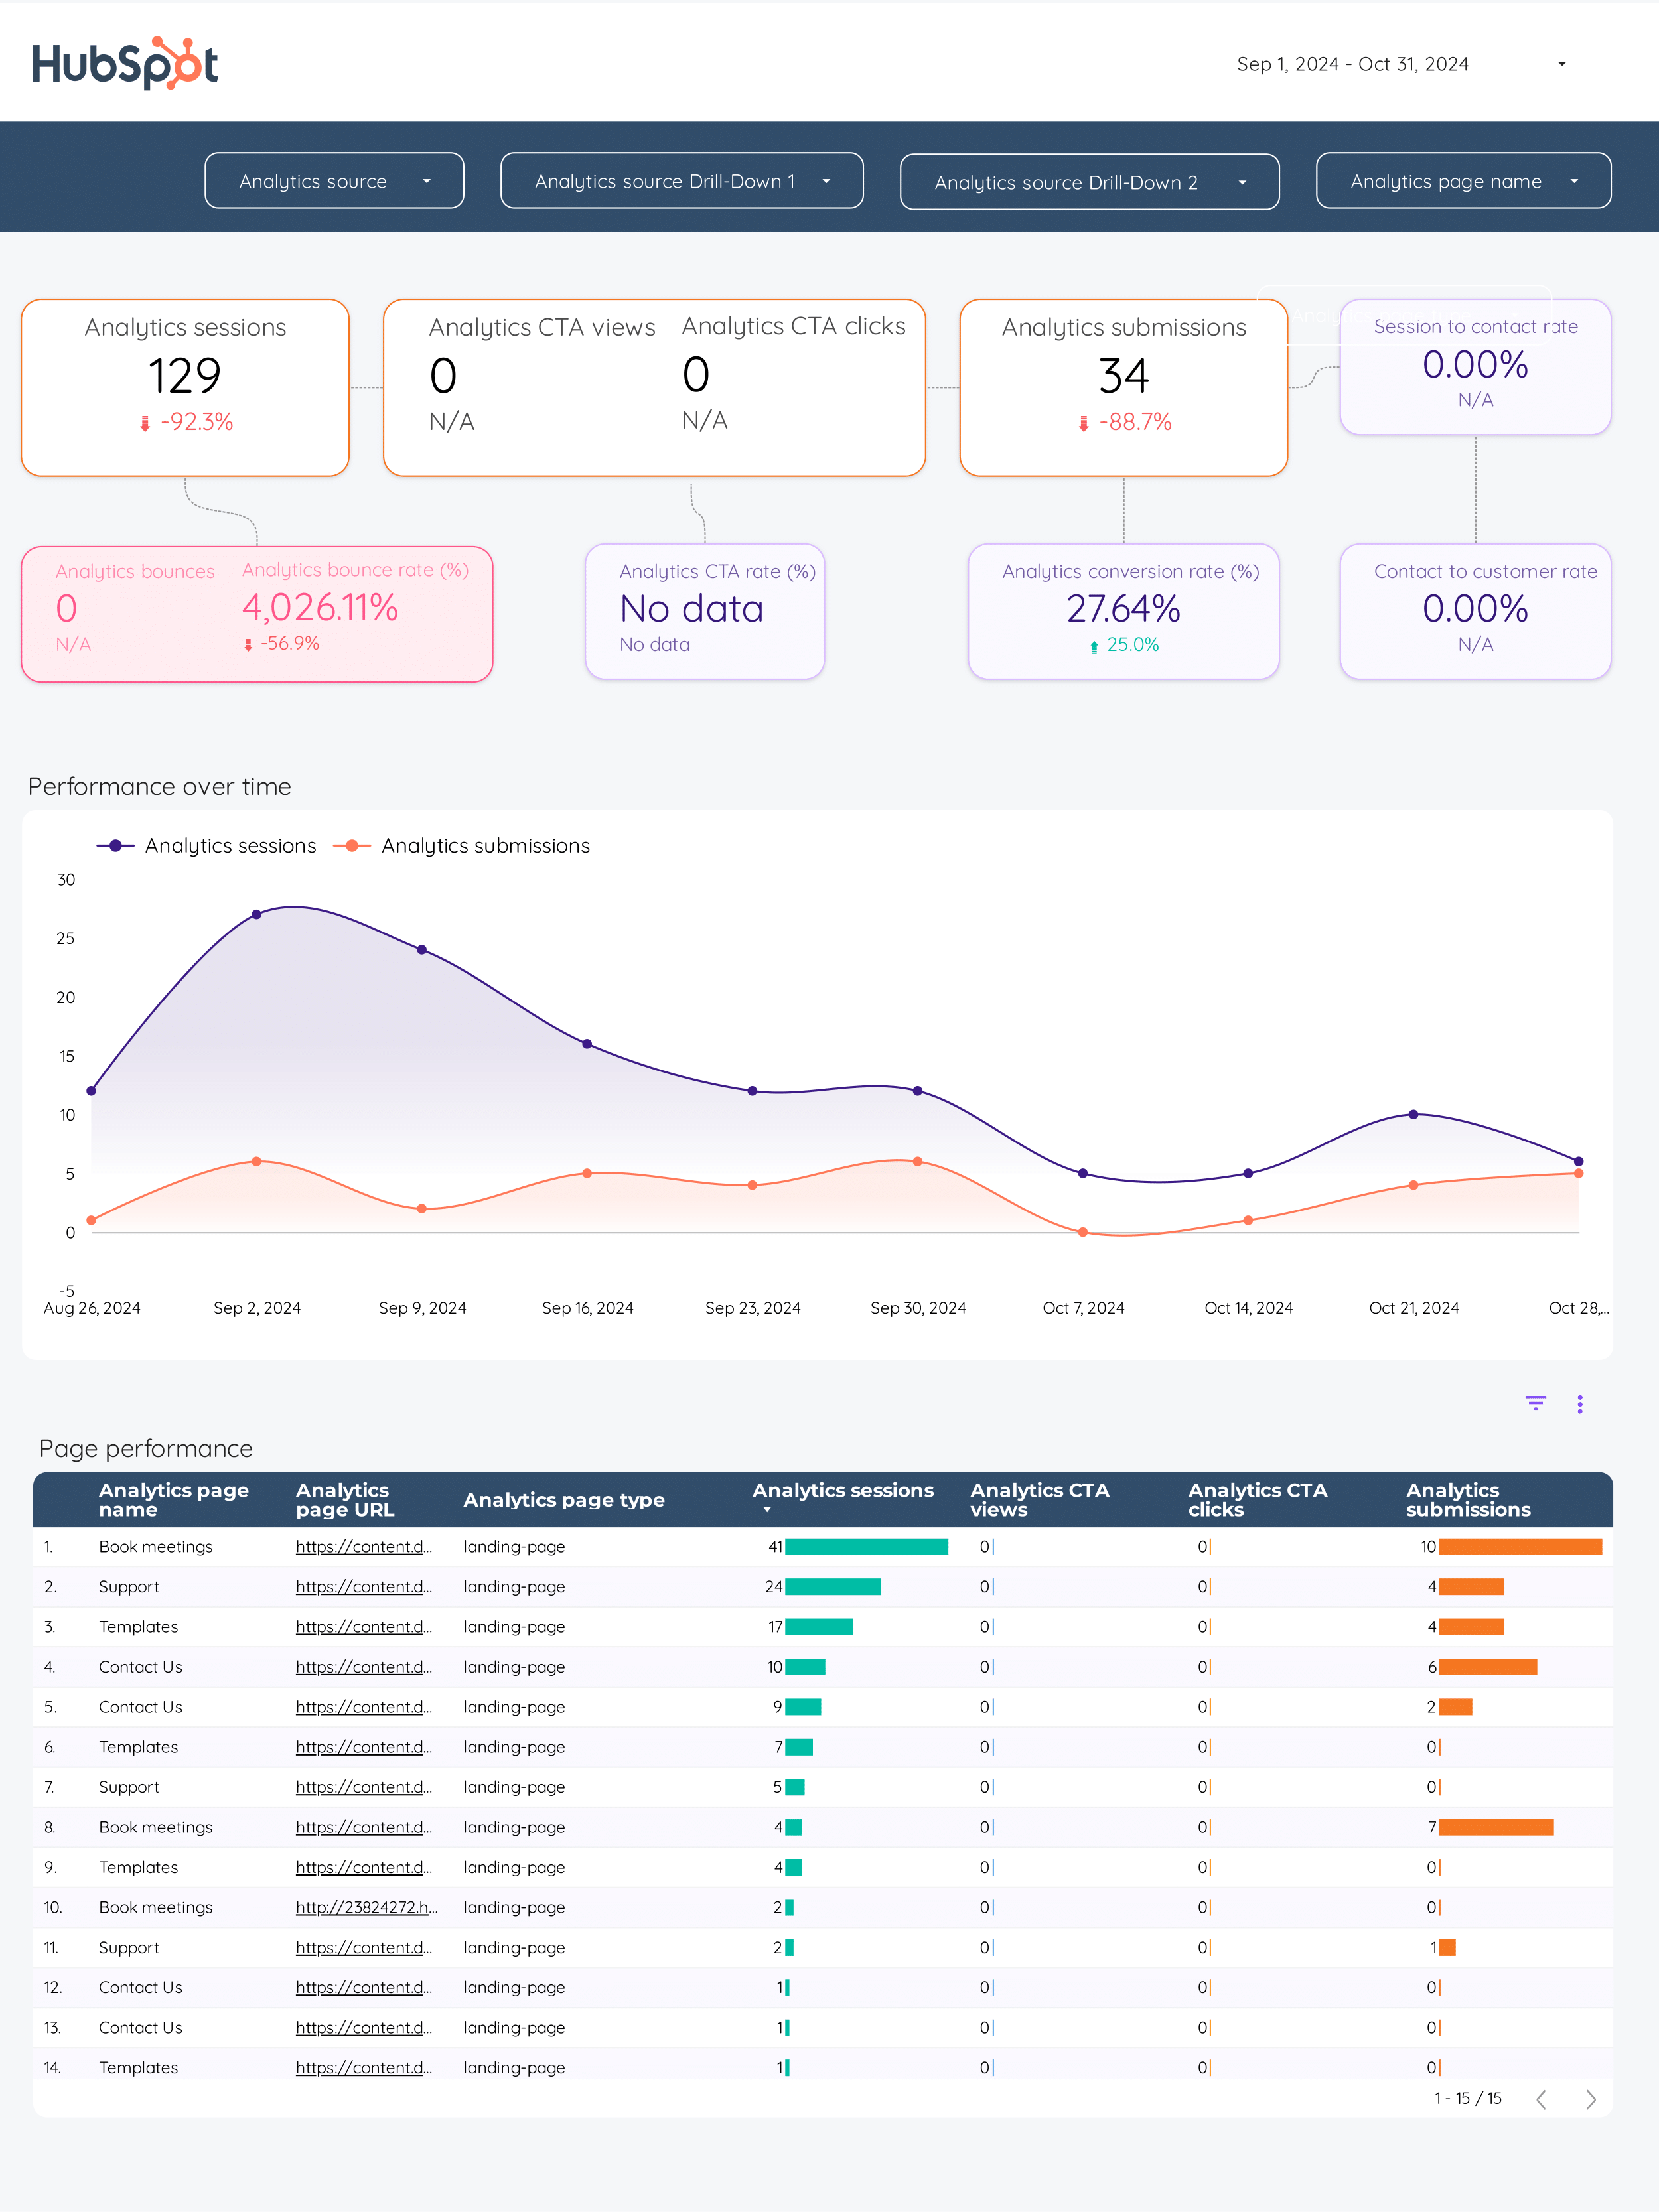
Inbound marketing Report template for Marketing teams and agencies
Optimize your strategy with this Inbound marketing report template. Track KPIs like conversion rates and social media engagement. Analyze data from CRM, E-commerce, Facebook Ads, Google Analytics 4, and LinkedIn Ads. Segment by demographics and timeframes. Ideal for B2B and e-commerce teams to measure performance and achieve marketing goals.
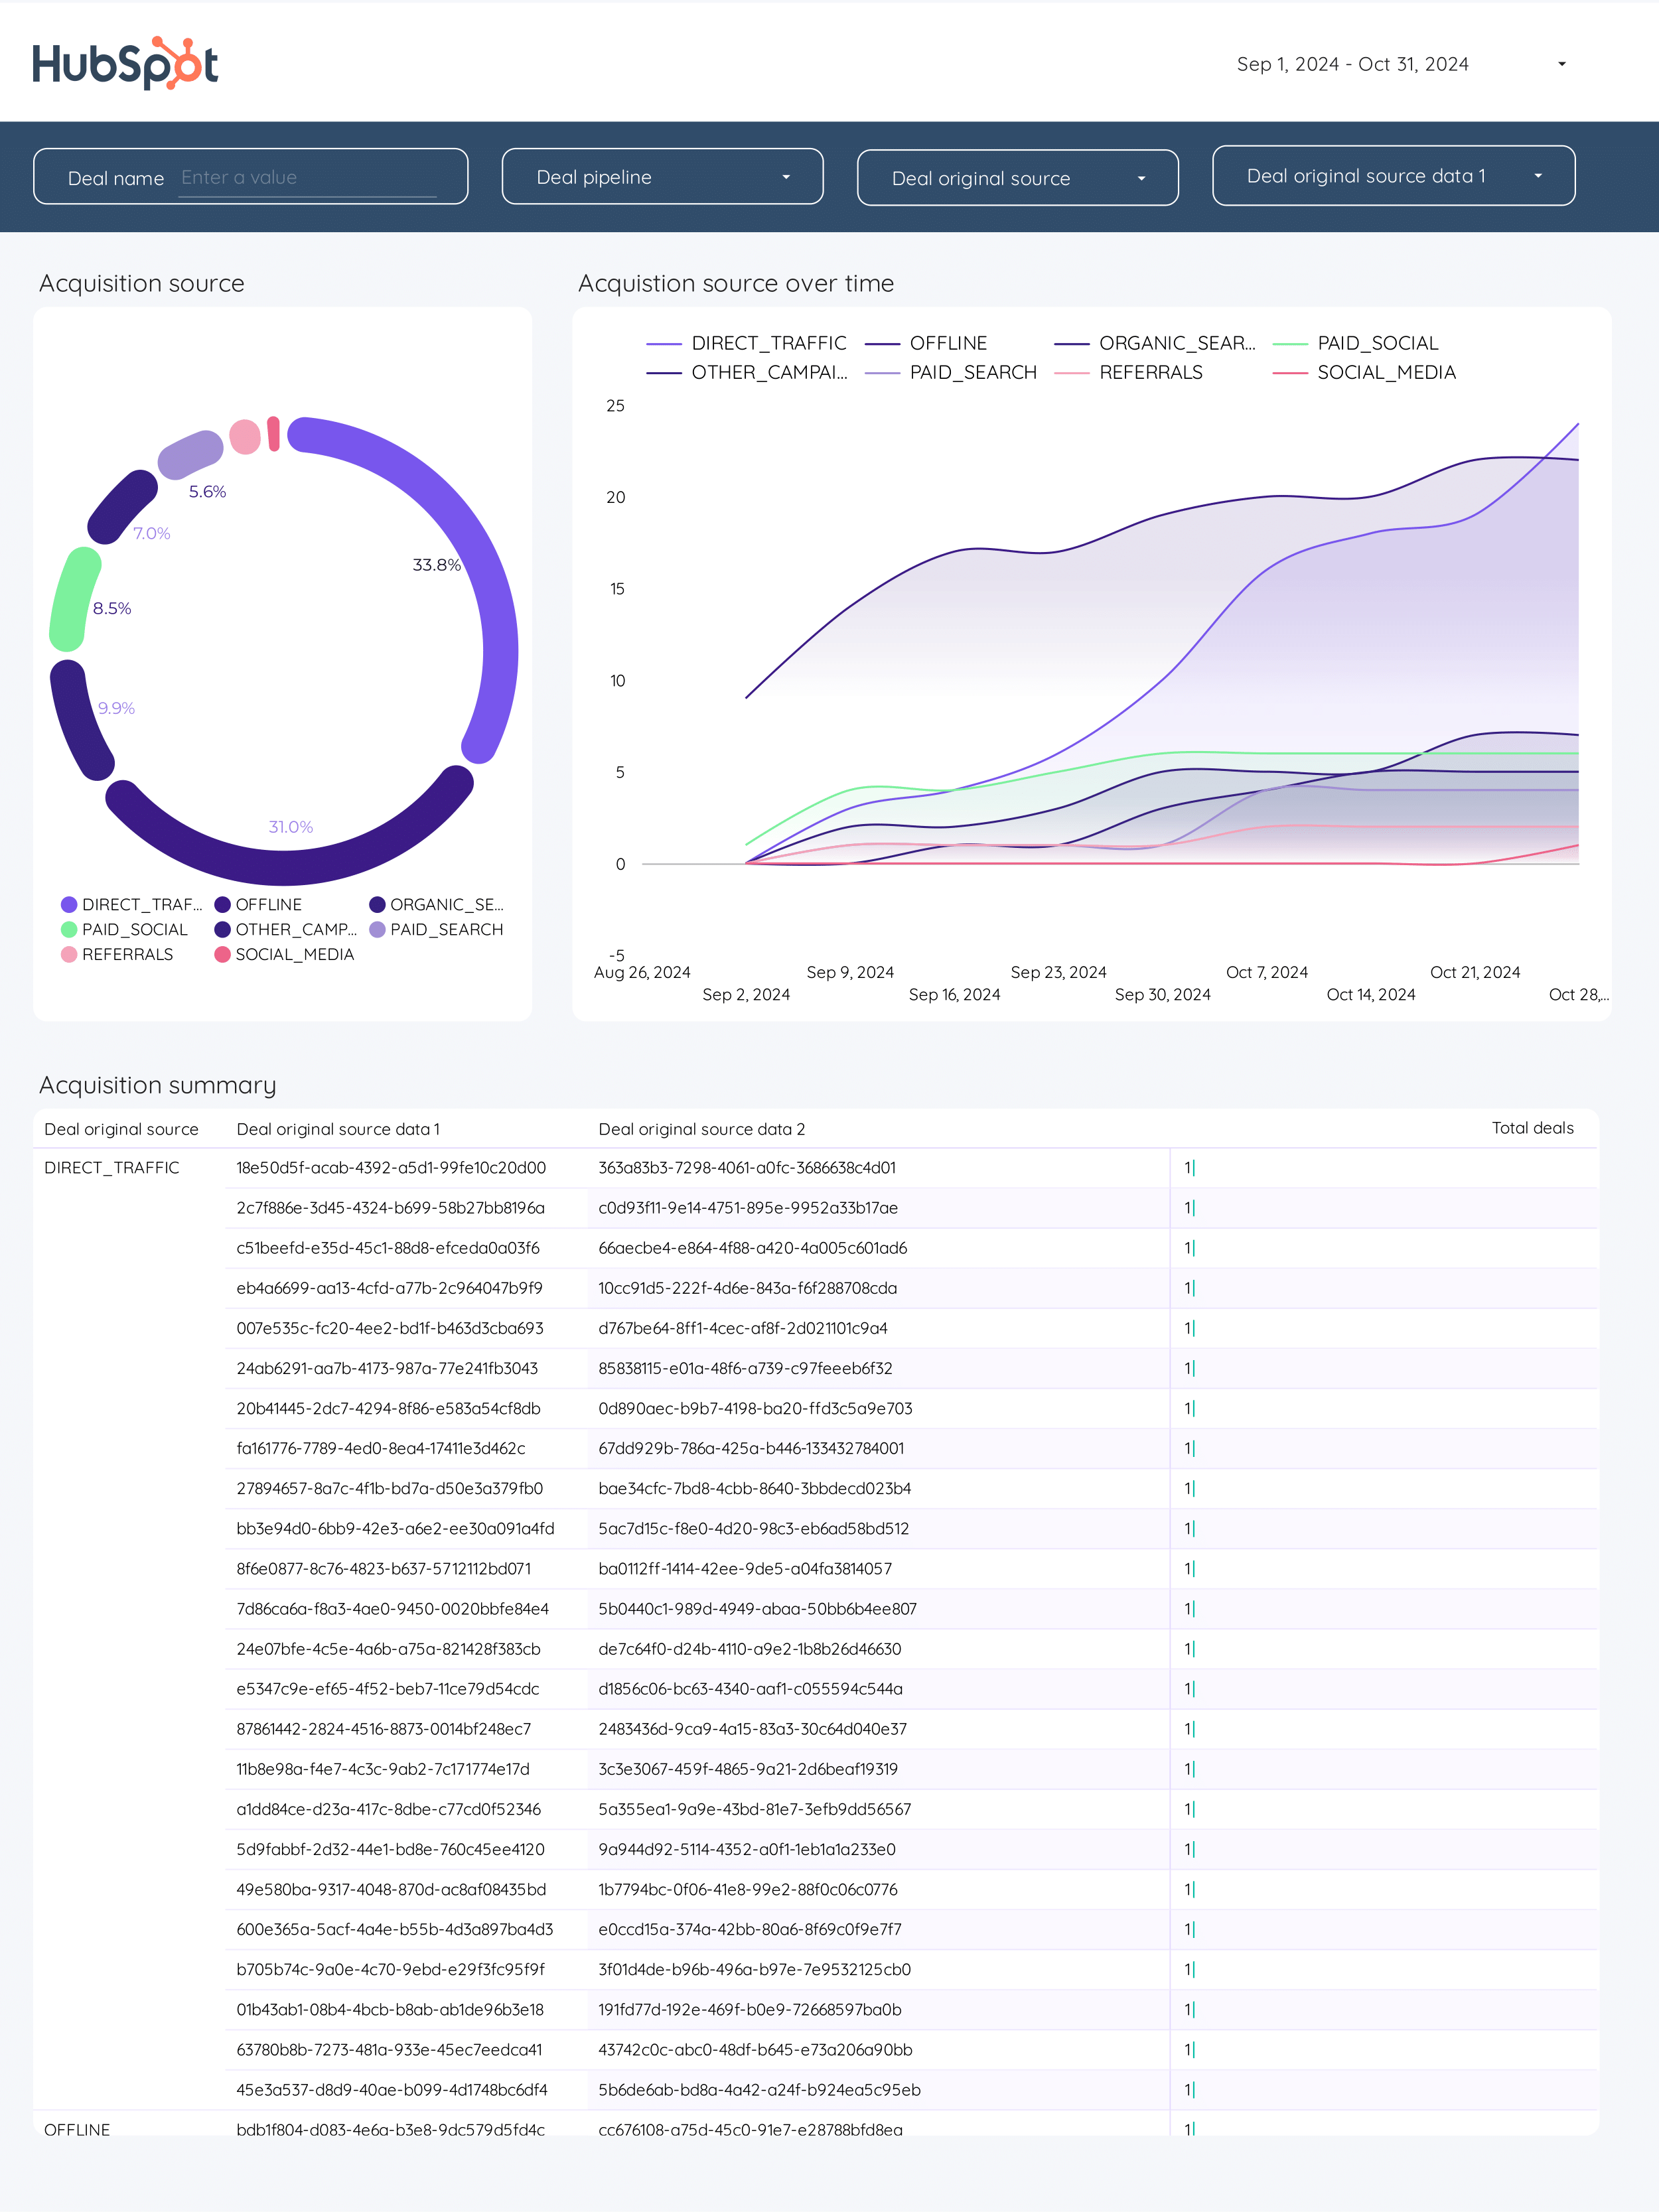
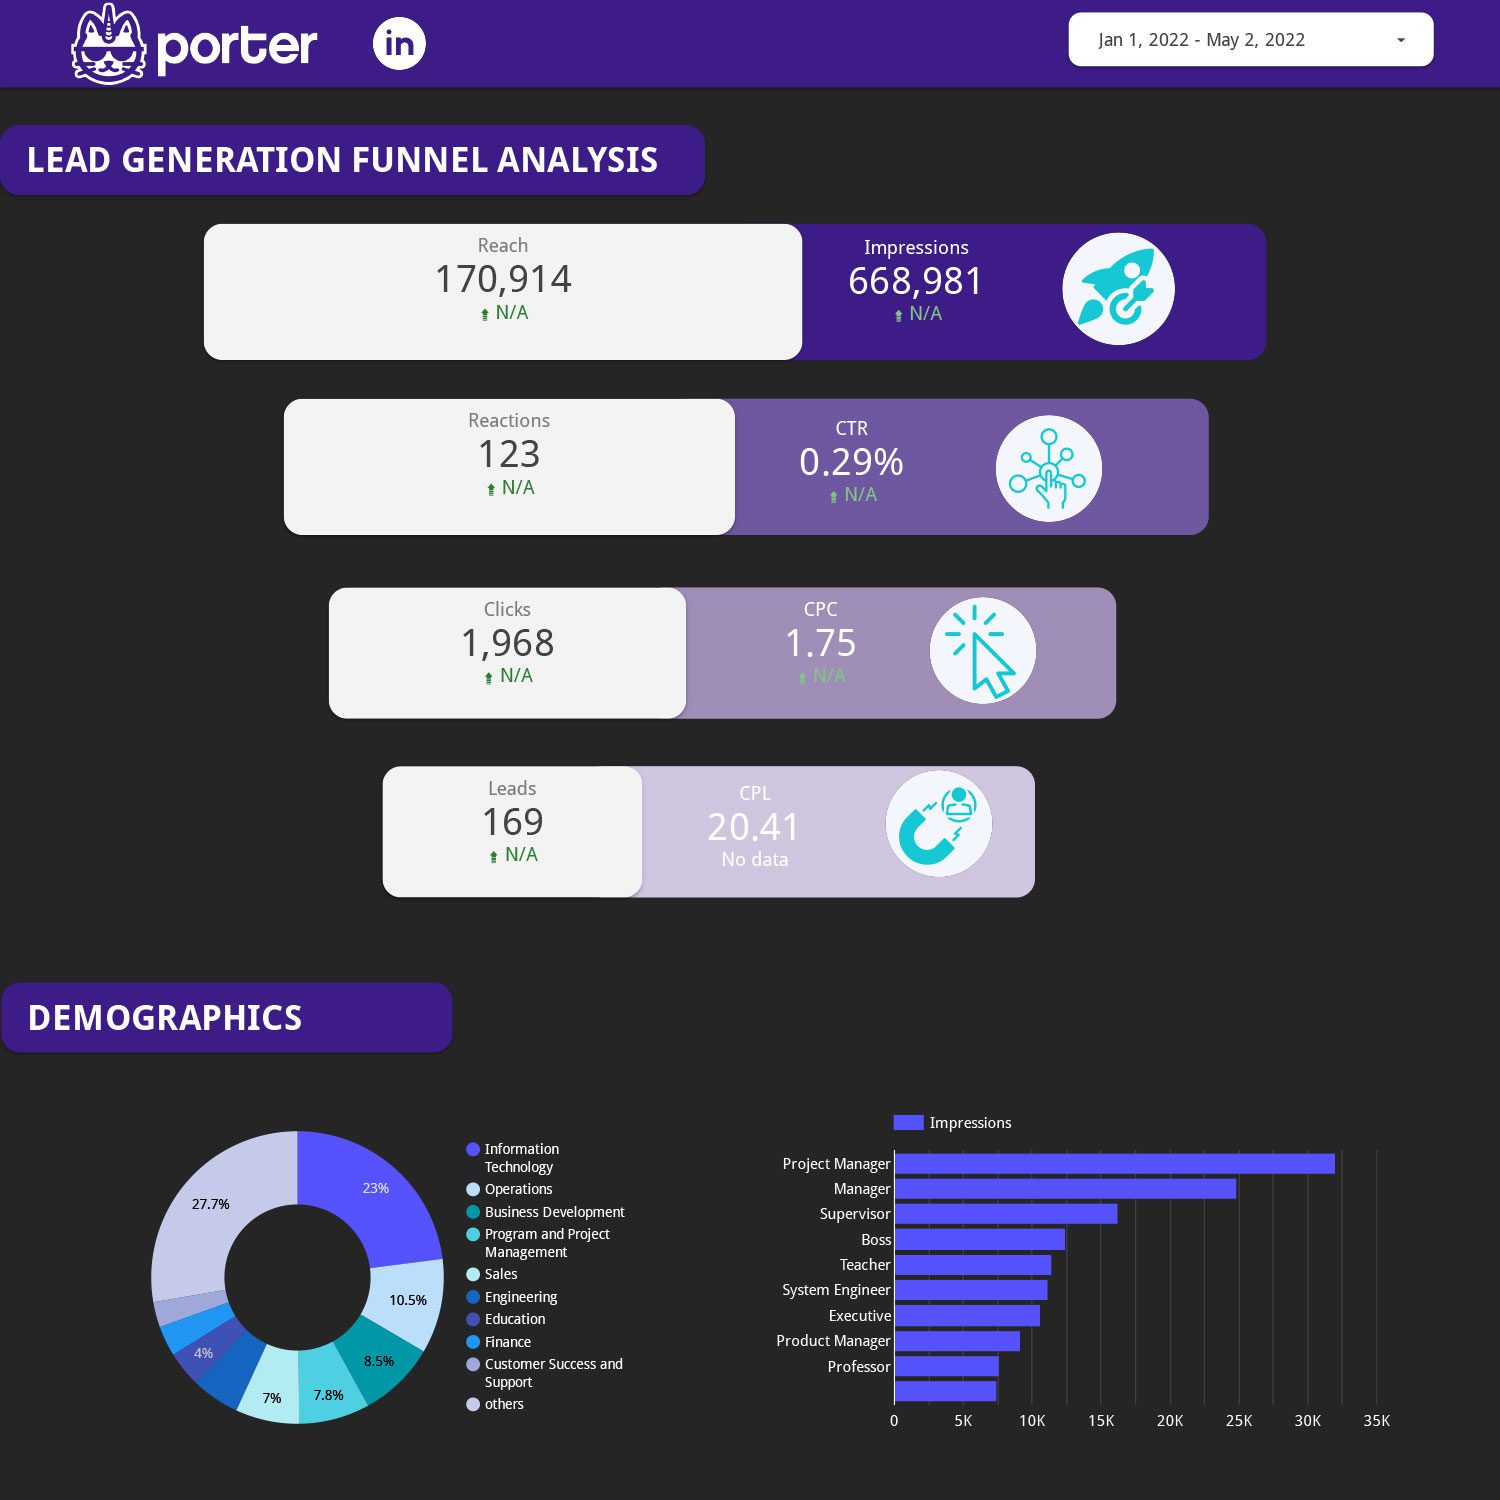
Lead generation Report template for Marketing teams and agencies
Optimize your strategy with the Lead generation report template. Track conversion rates, cost per conversion, and ROI. Analyze B2B, CRM, Email Marketing, and Facebook Ads data. Segment by audience, demographics, and behavior. Measure SQLs, sales cycle length, and CRM contact performance. Ideal for marketing teams seeking actionable insights.
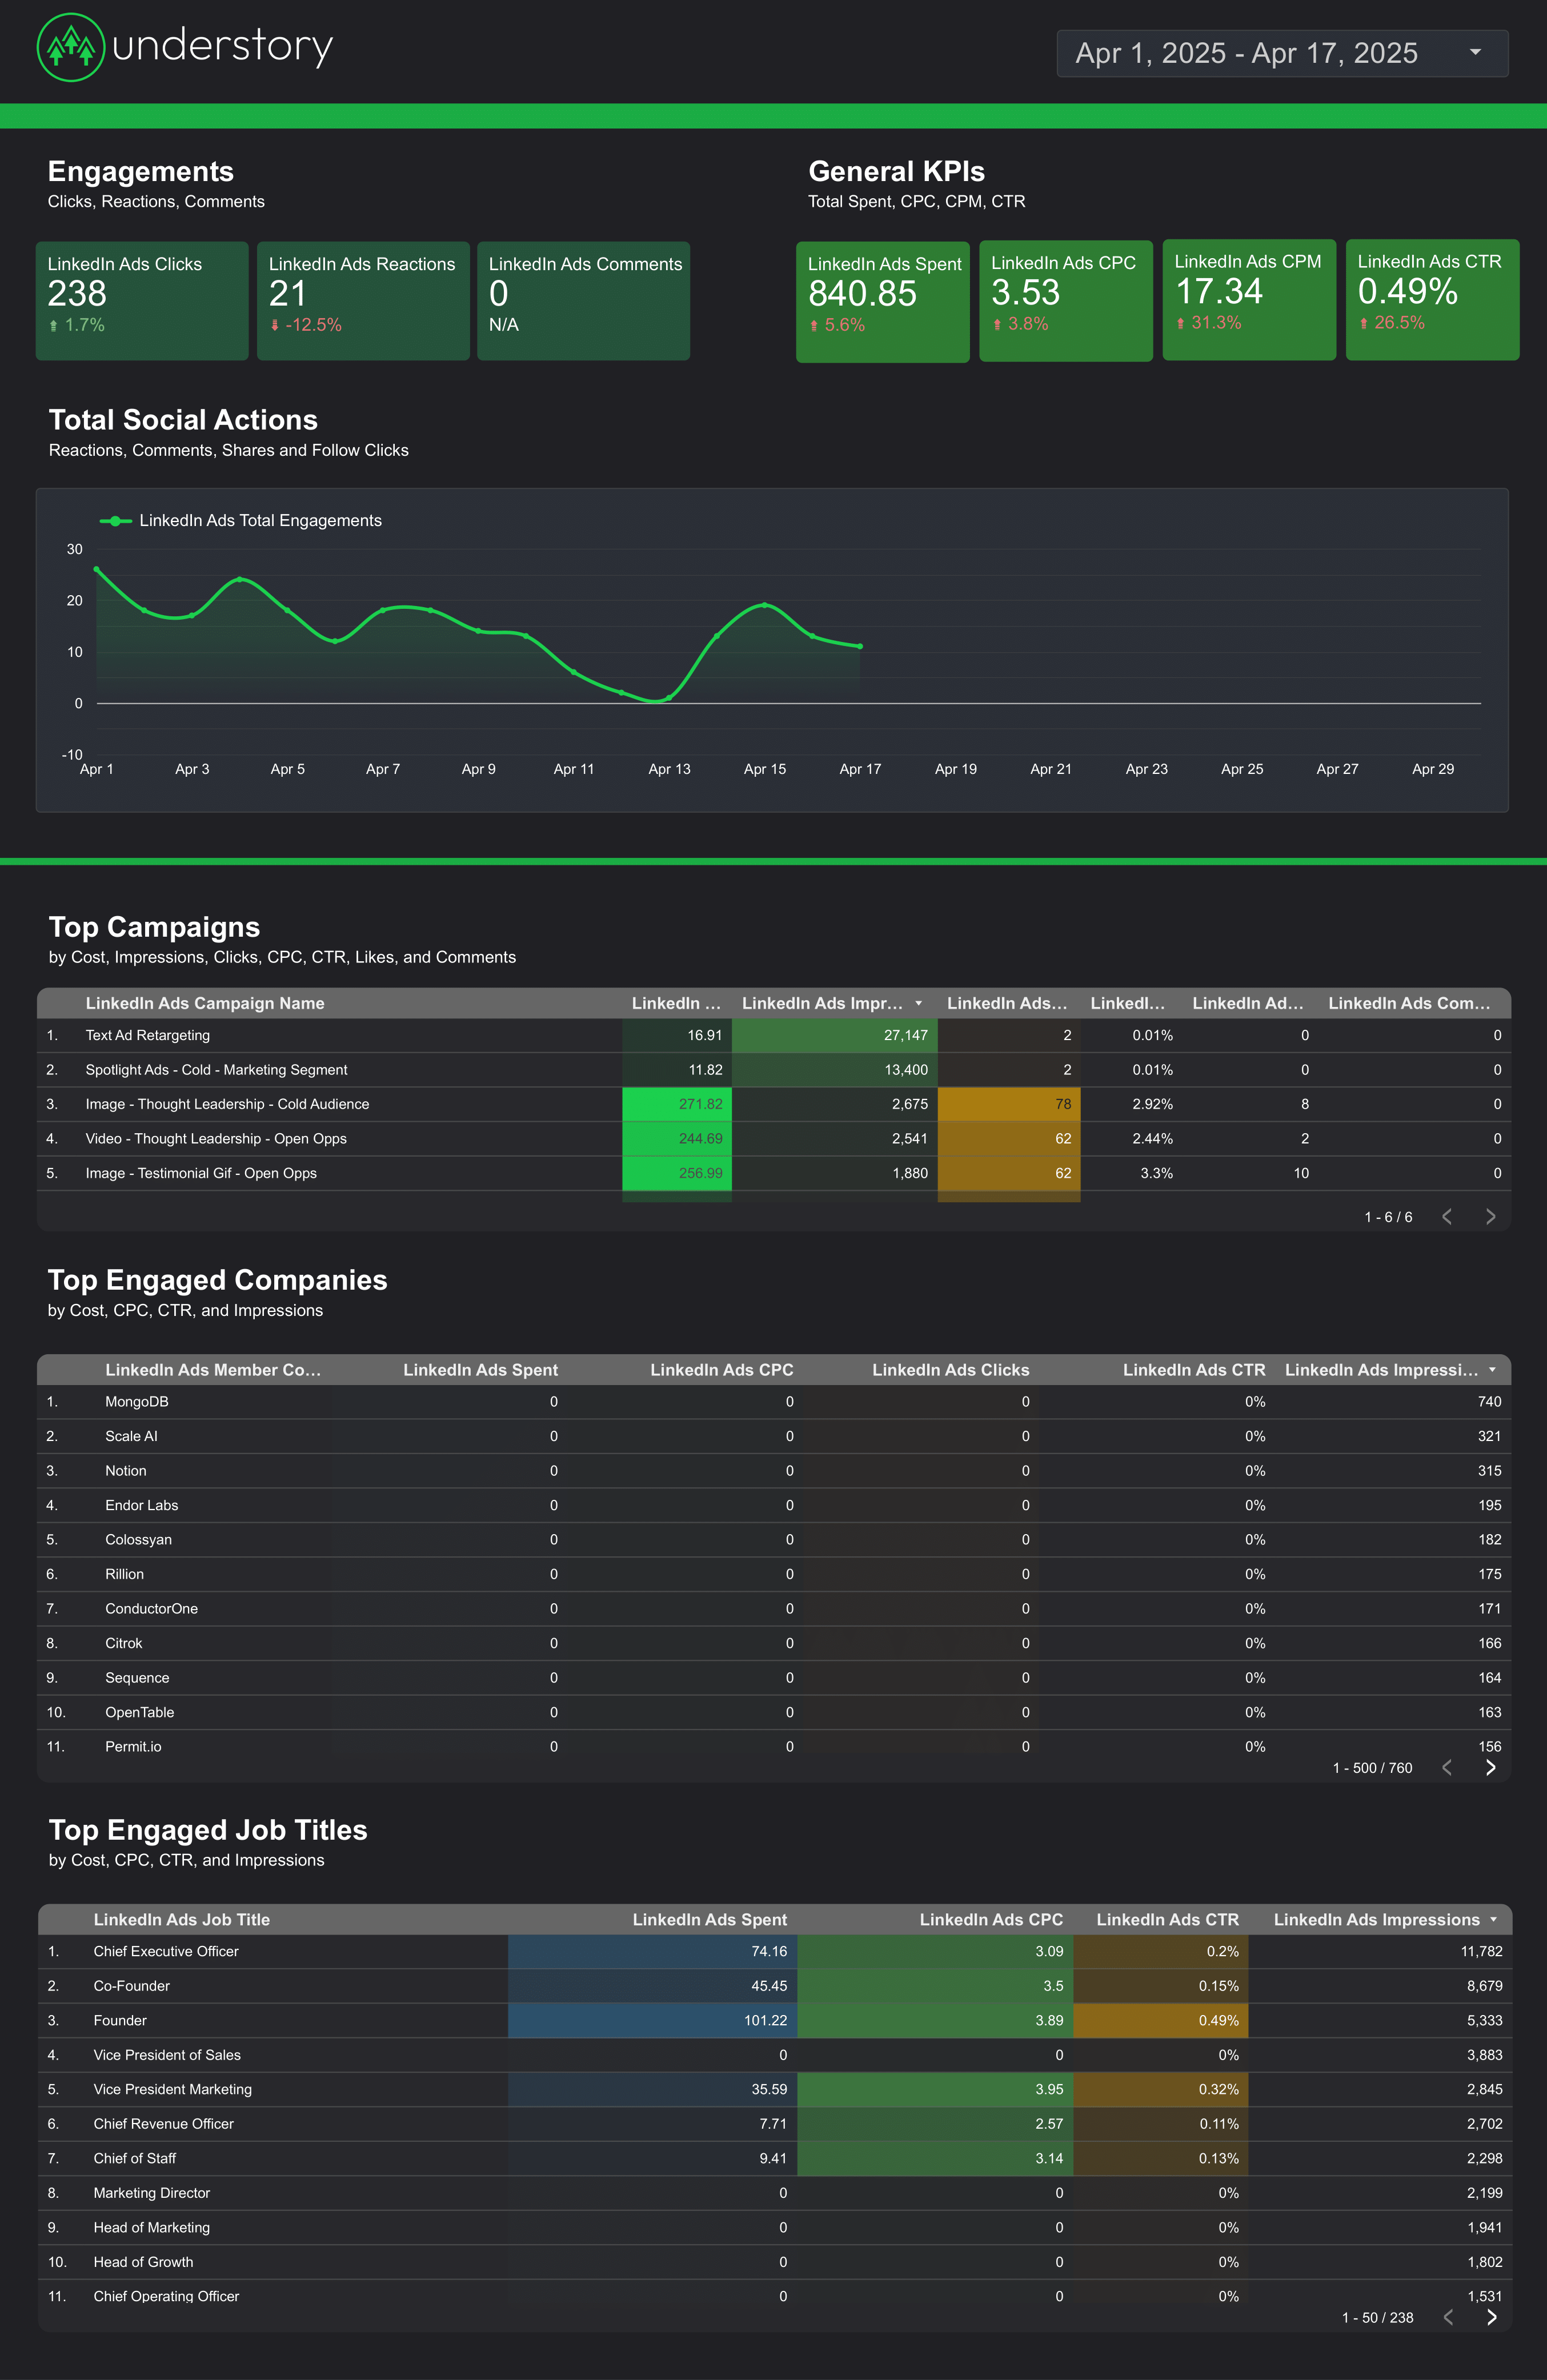
LinkedIn Ads Report template for Marketing teams and agencies
Optimize your LinkedIn Ads strategy with this report template. Track leads, conversions, and CTR. Analyze by campaign, job title, or industry. Ideal for B2B and PPC marketing teams to measure performance and refine goals. Consolidate data across various timeframes for actionable insights.

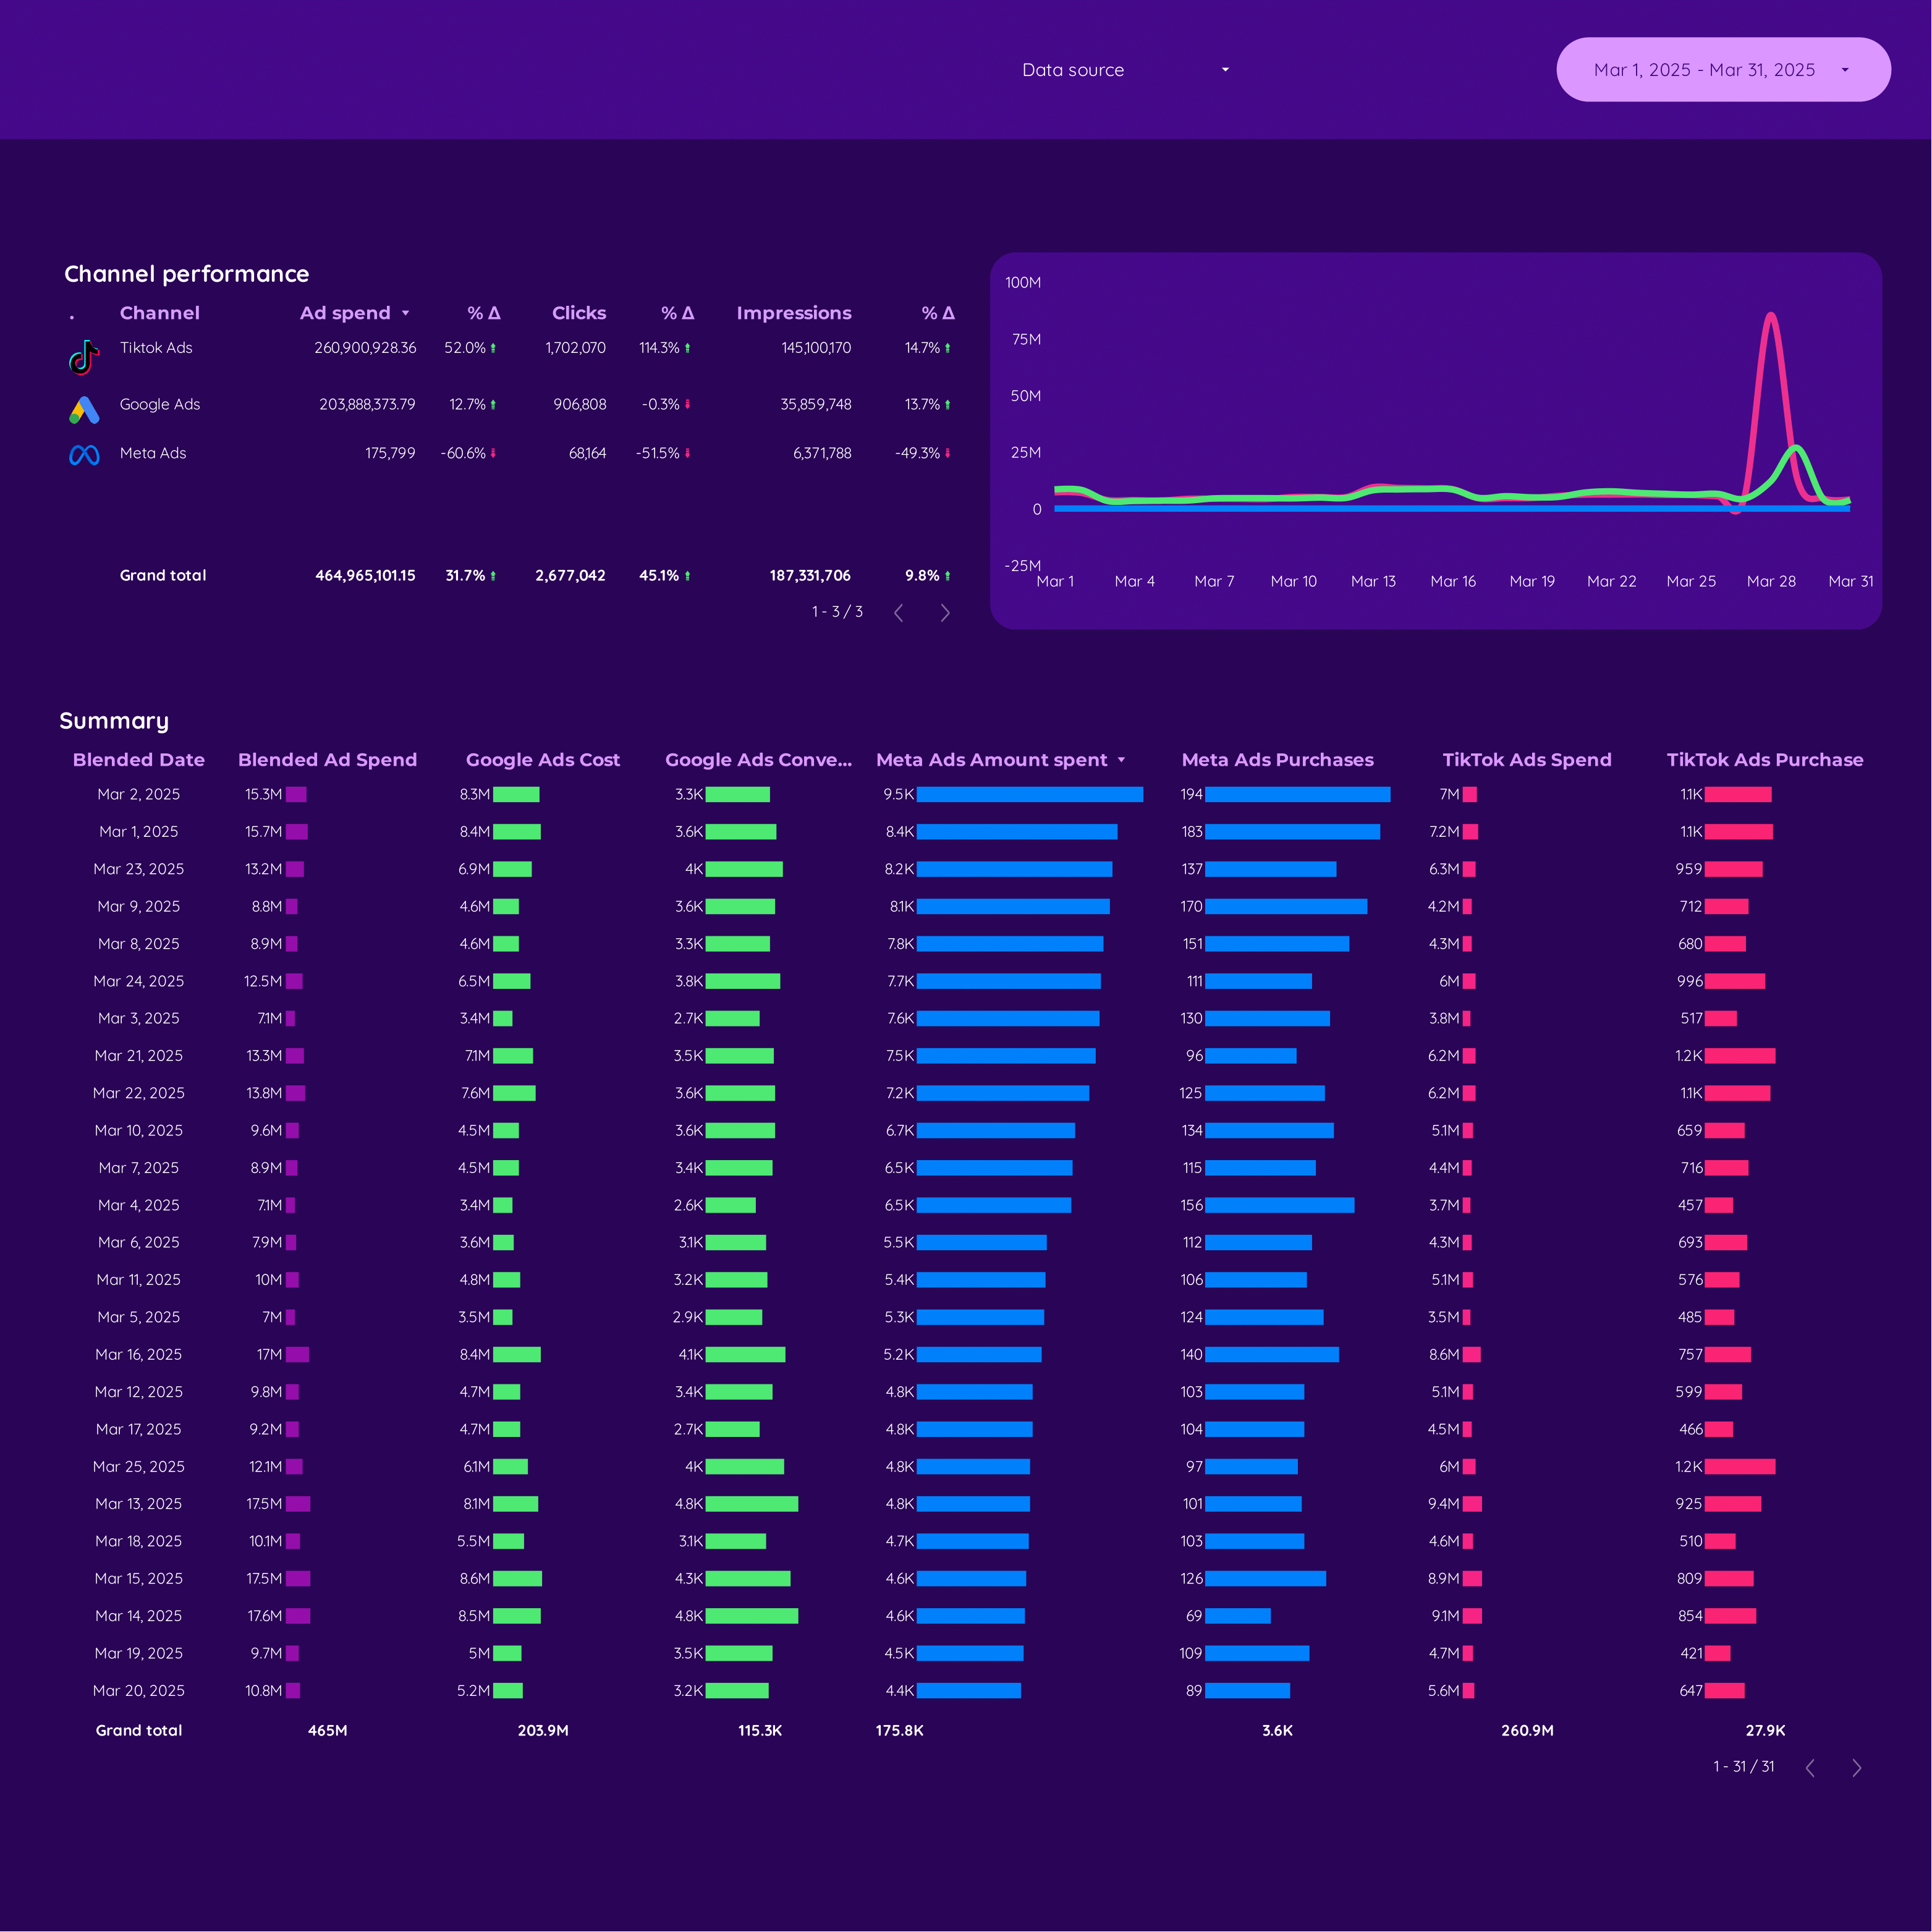
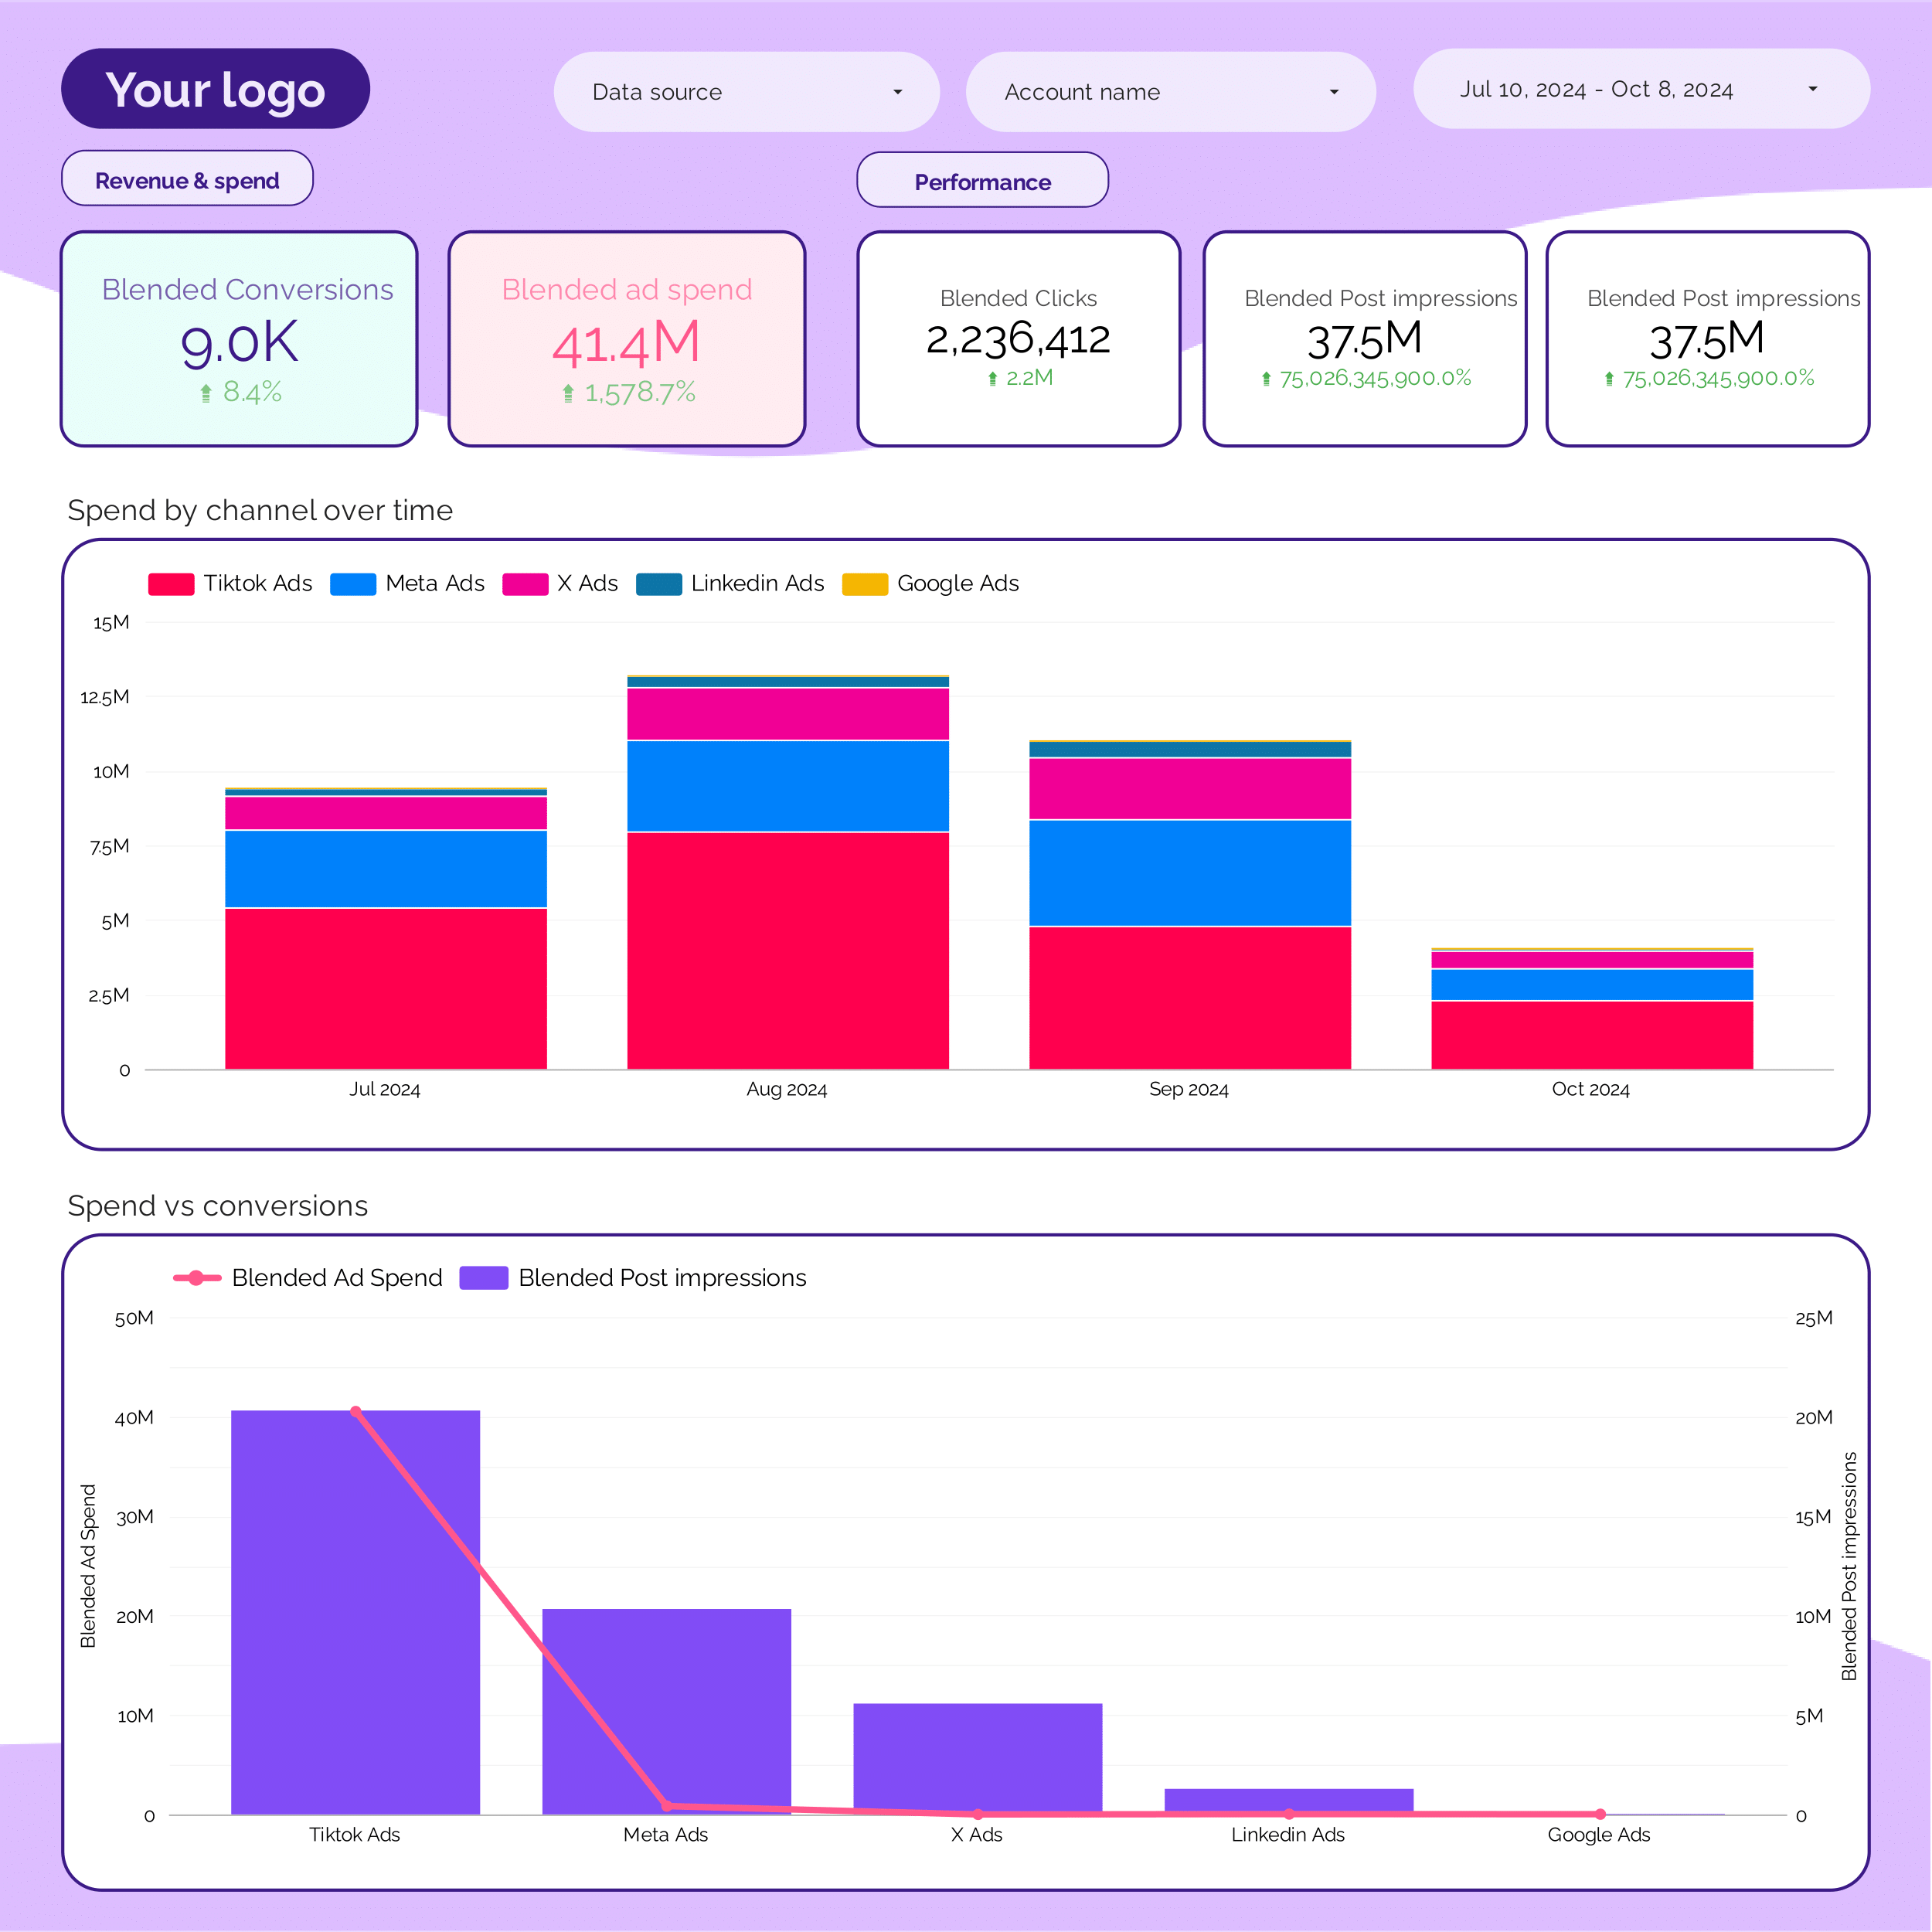
PPC Report template for Marketing teams and agencies
Optimize your PPC strategy with this report template. Track metrics like conversion rate, ROAS, and CTR across Facebook Ads, TikTok Ads, and Google Ads. Analyze by audience, channel, and time. Ideal for marketing teams to measure campaign performance and achieve objectives efficiently.
PPC budget tracking and pacing Report template for Marketing teams and agencies
Get the actual PPC budget tracking and pacing on Looker Studio template used by Porter to monitor PPC performance.
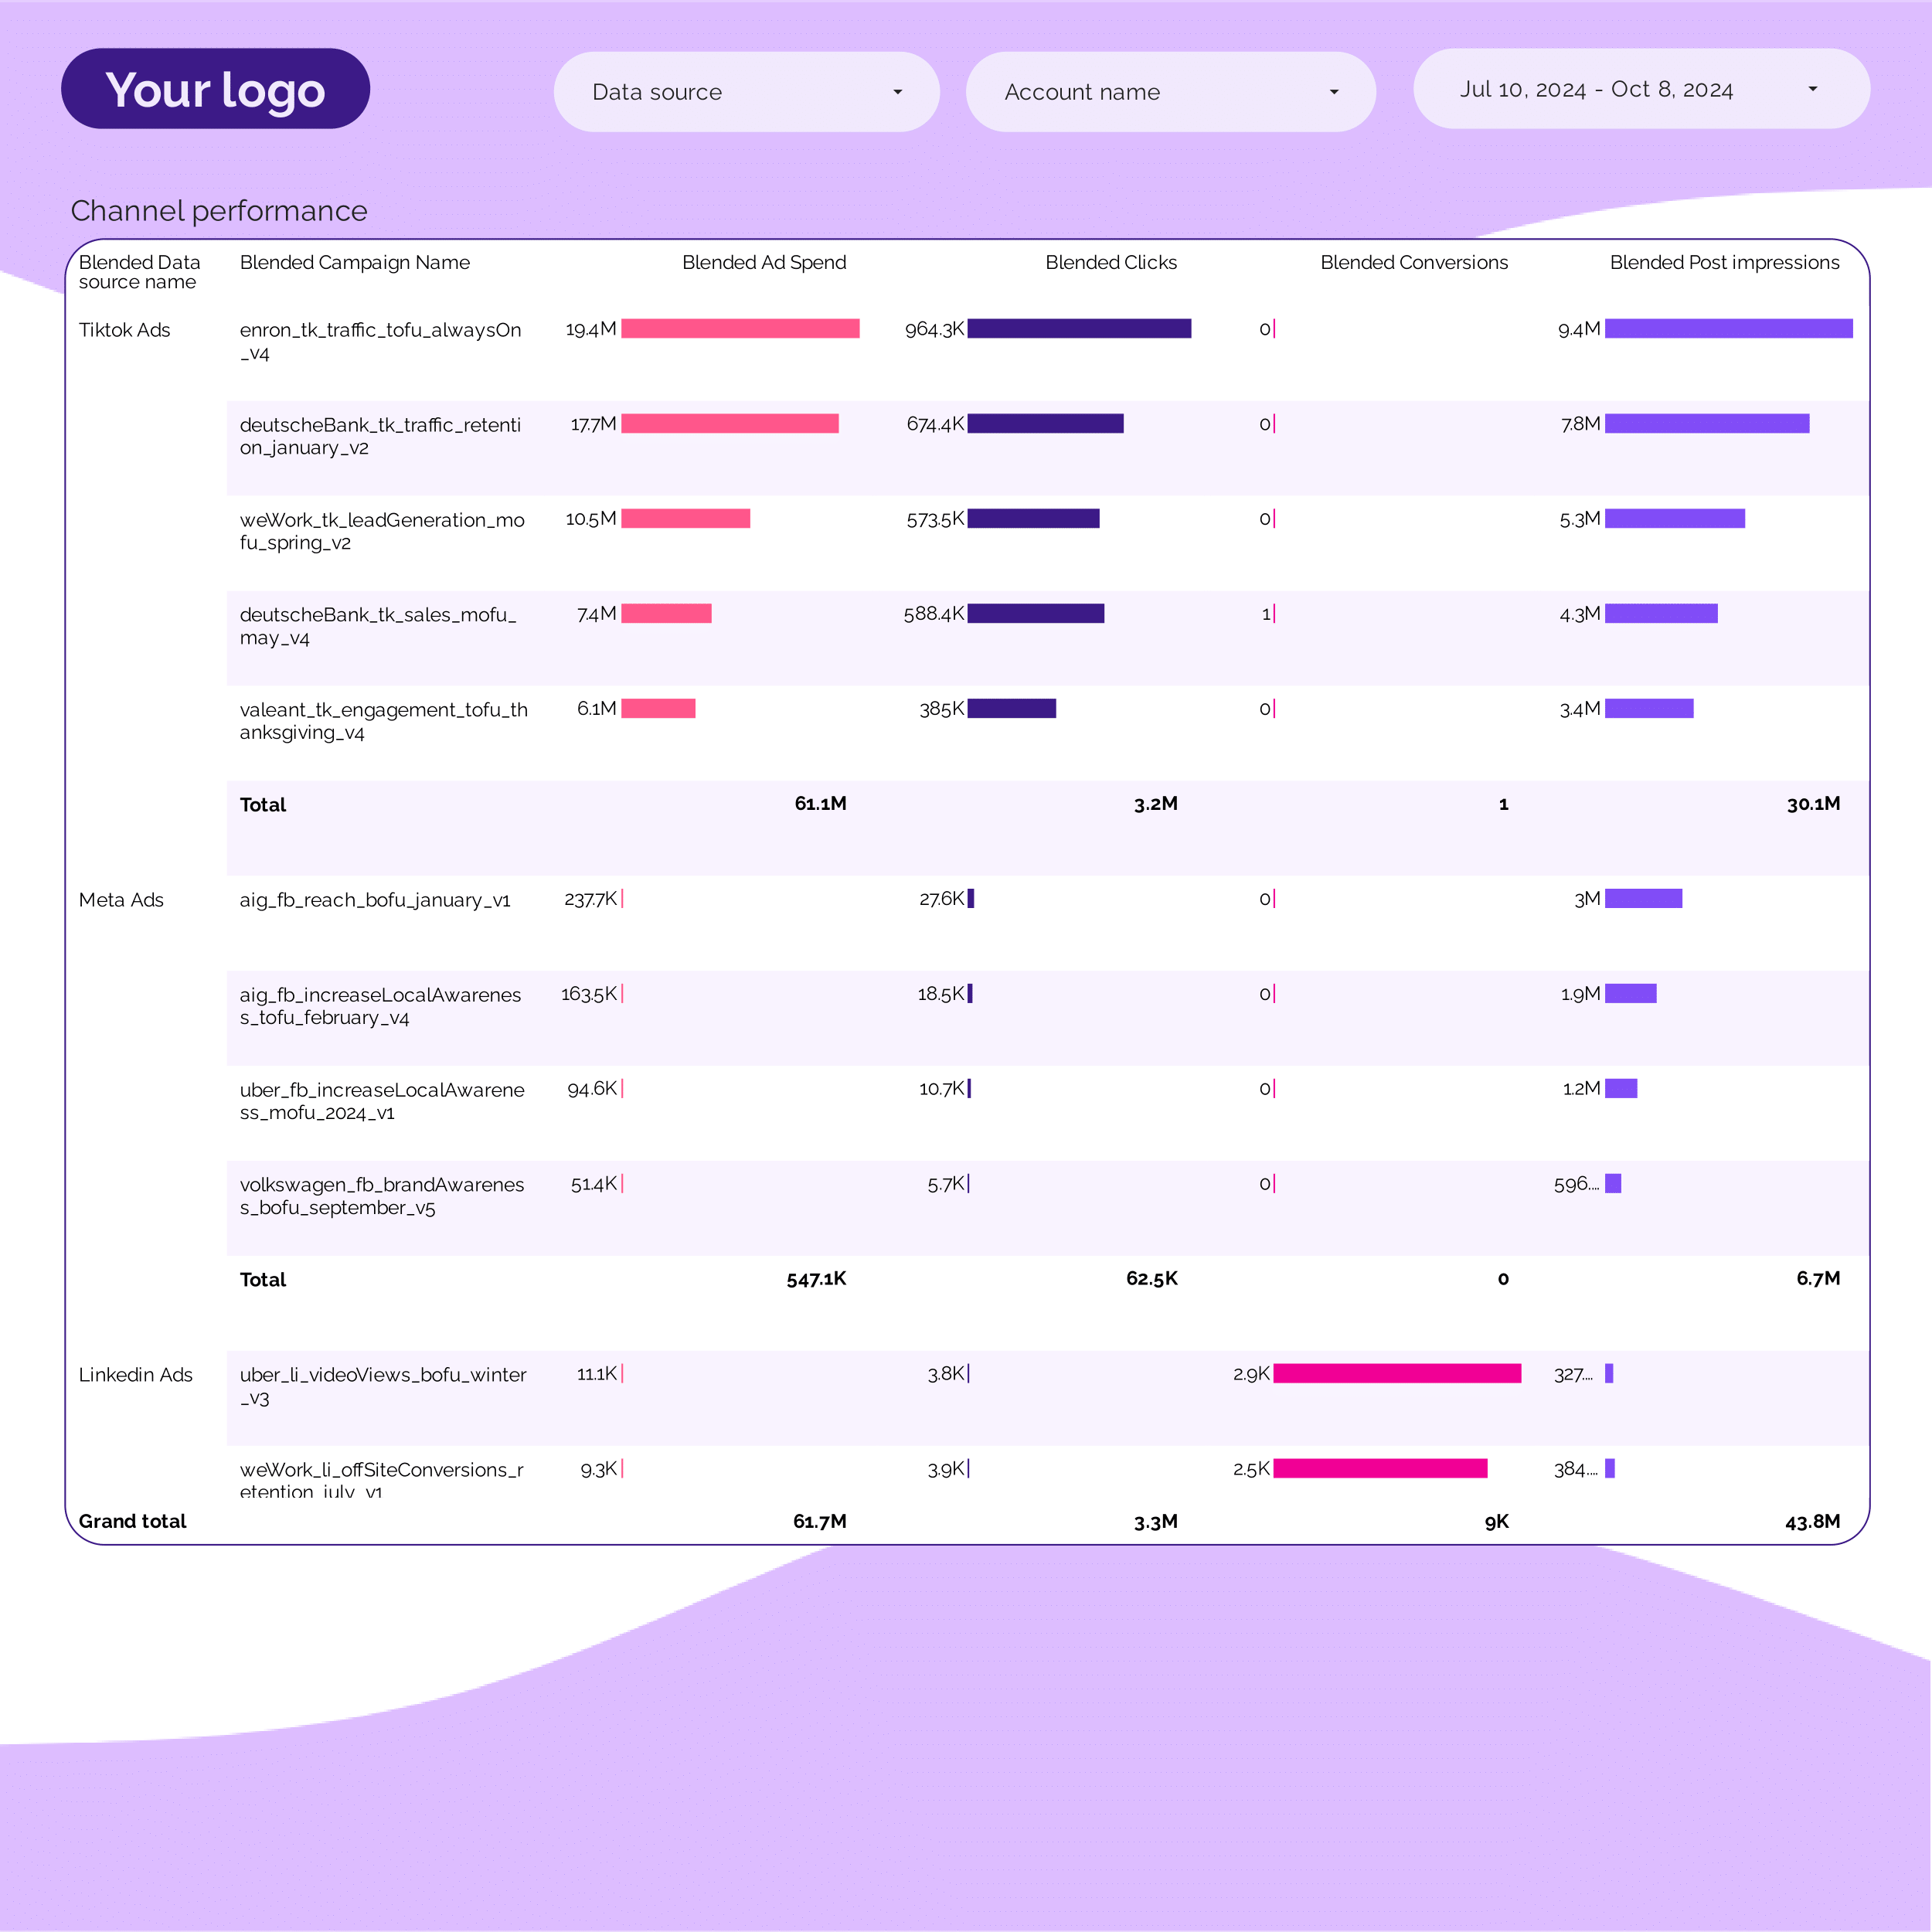
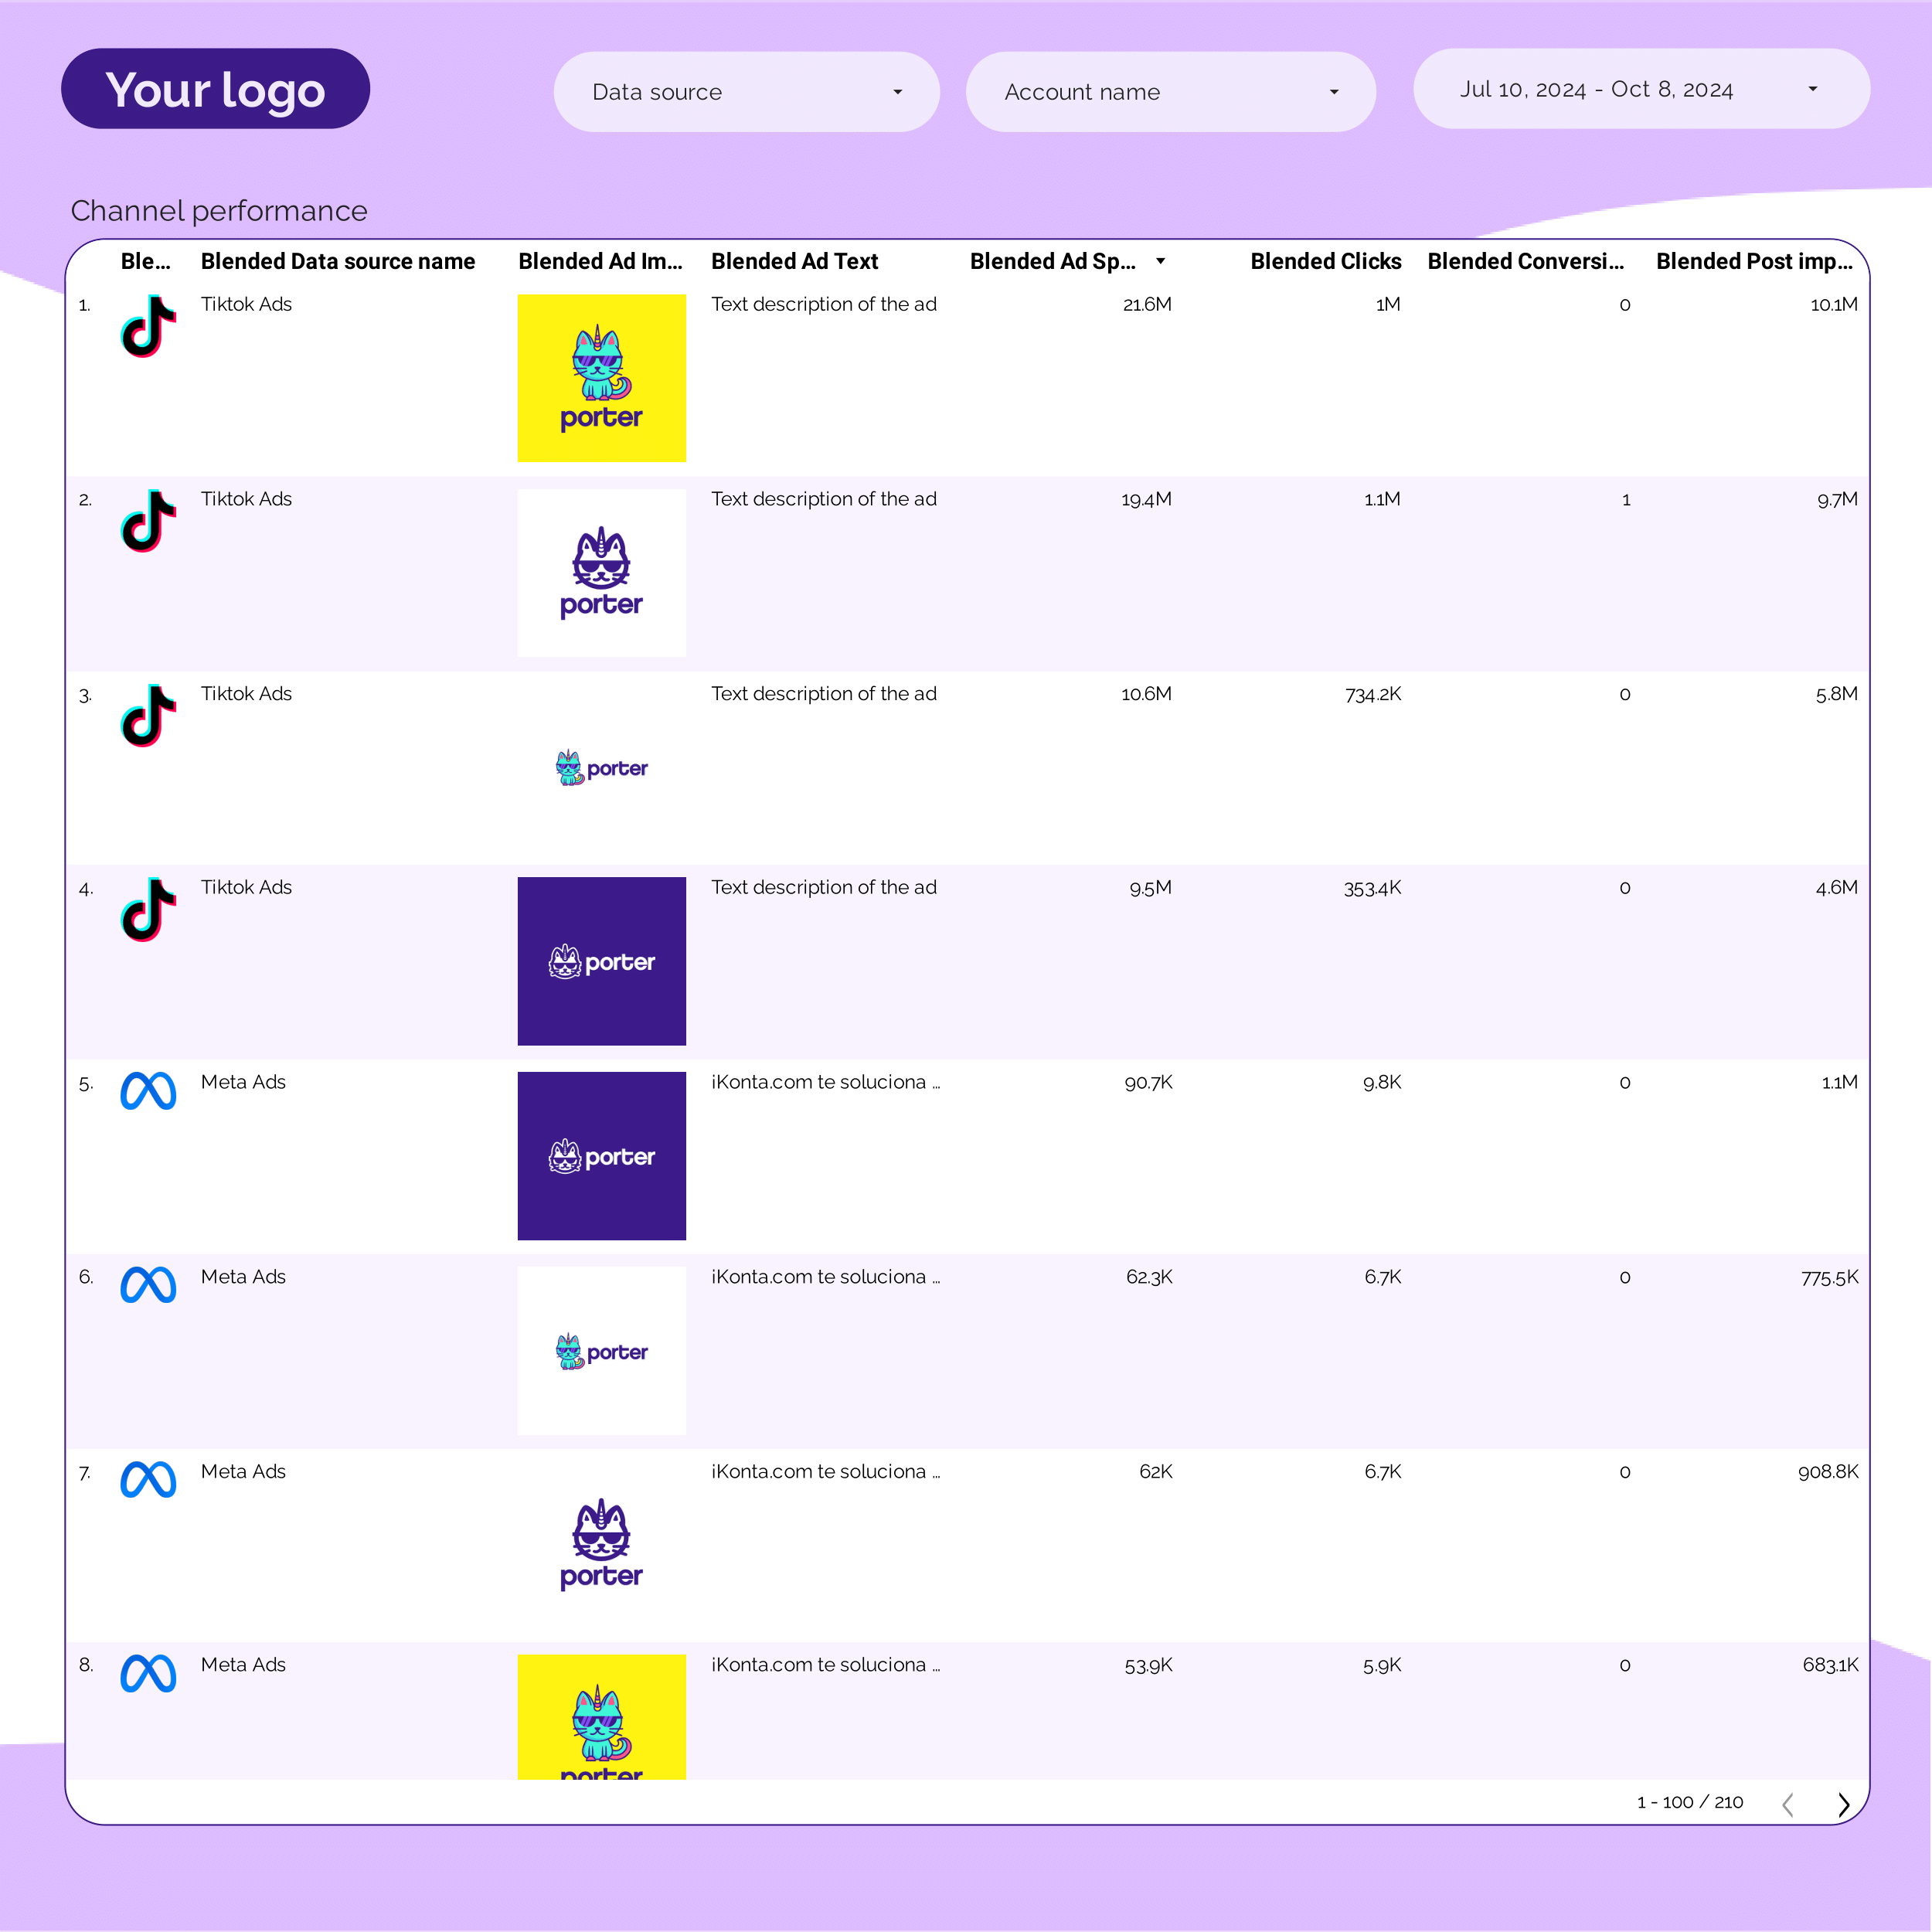
PPC Campaign performance Report template for Marketing teams and agencies
Get the actual PPC Campaign performance on Looker Studio template used by Porter to monitor PPC performance.
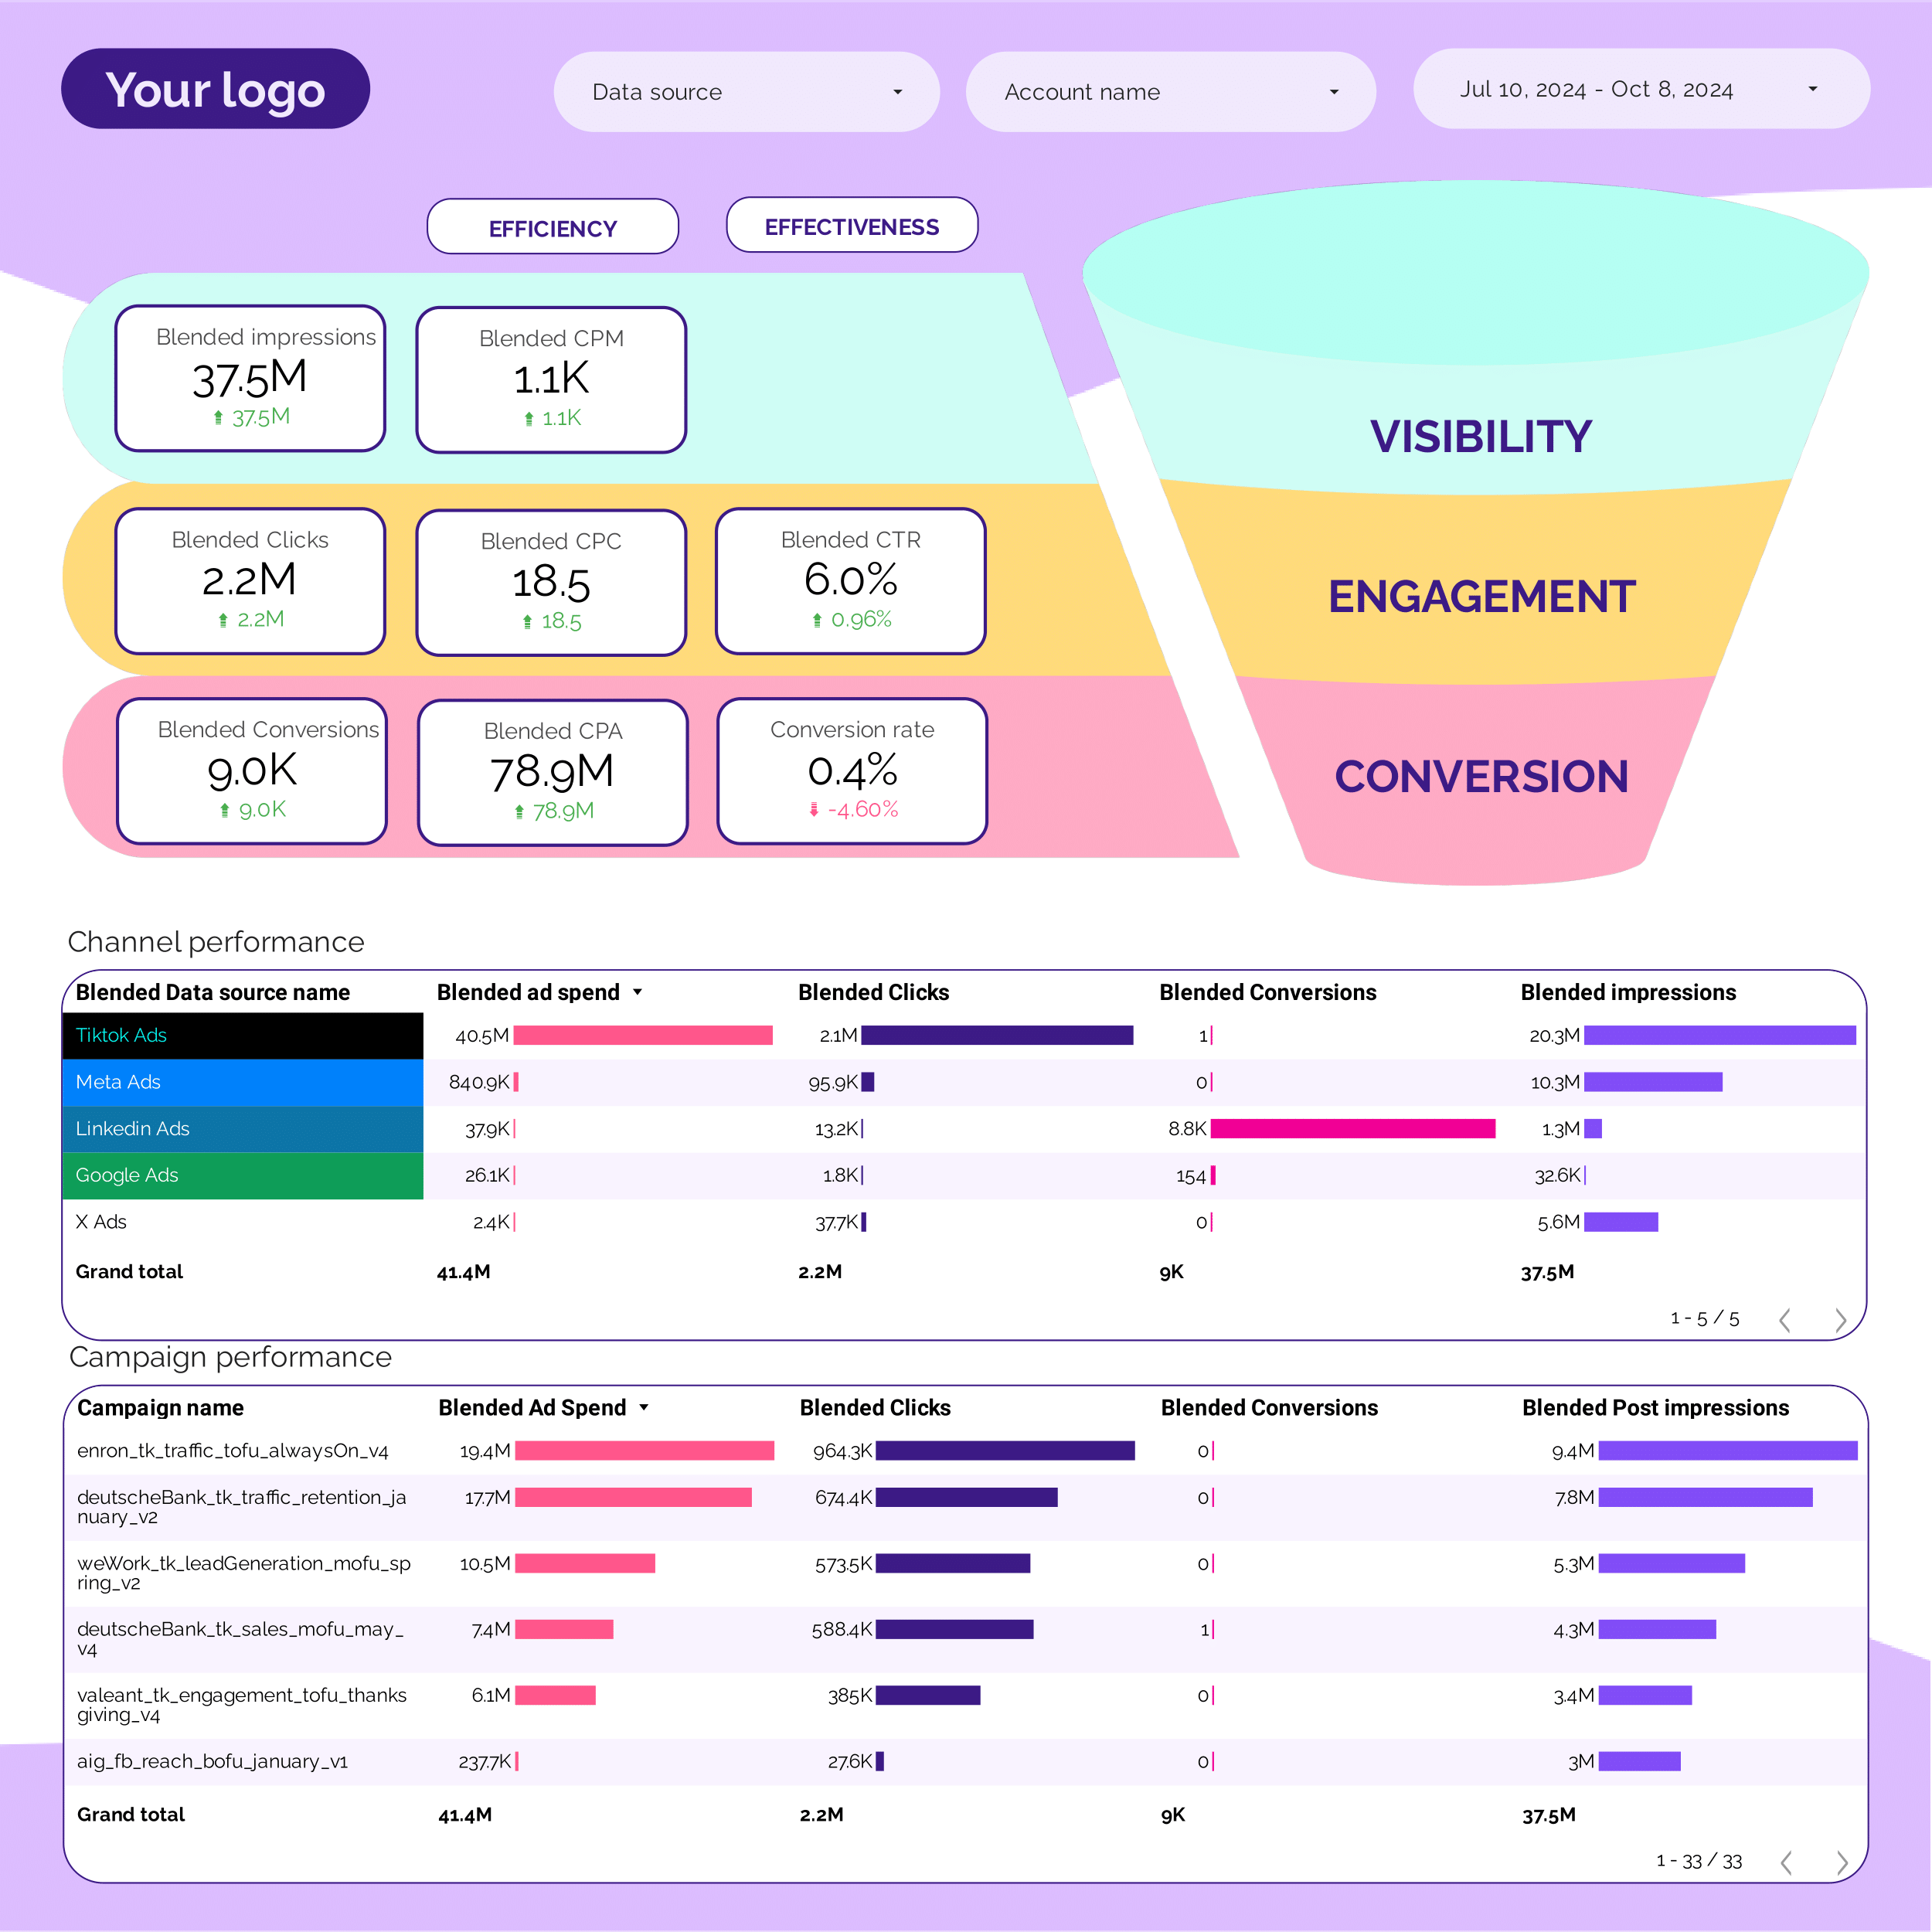
PPC Funnel Report template for Marketing teams and agencies
Get the actual PPC Funnel on Looker Studio template used by Porter to monitor PPC performance.
PPC KPIs Report template for Marketing teams and agencies
Get the actual PPC KPIs on Looker Studio template used by Porter to monitor PPC performance.
PPC monthly Report template for Marketing teams and agencies
Get the actual PPC monthly on Looker Studio template used by Porter to monitor PPC performance.