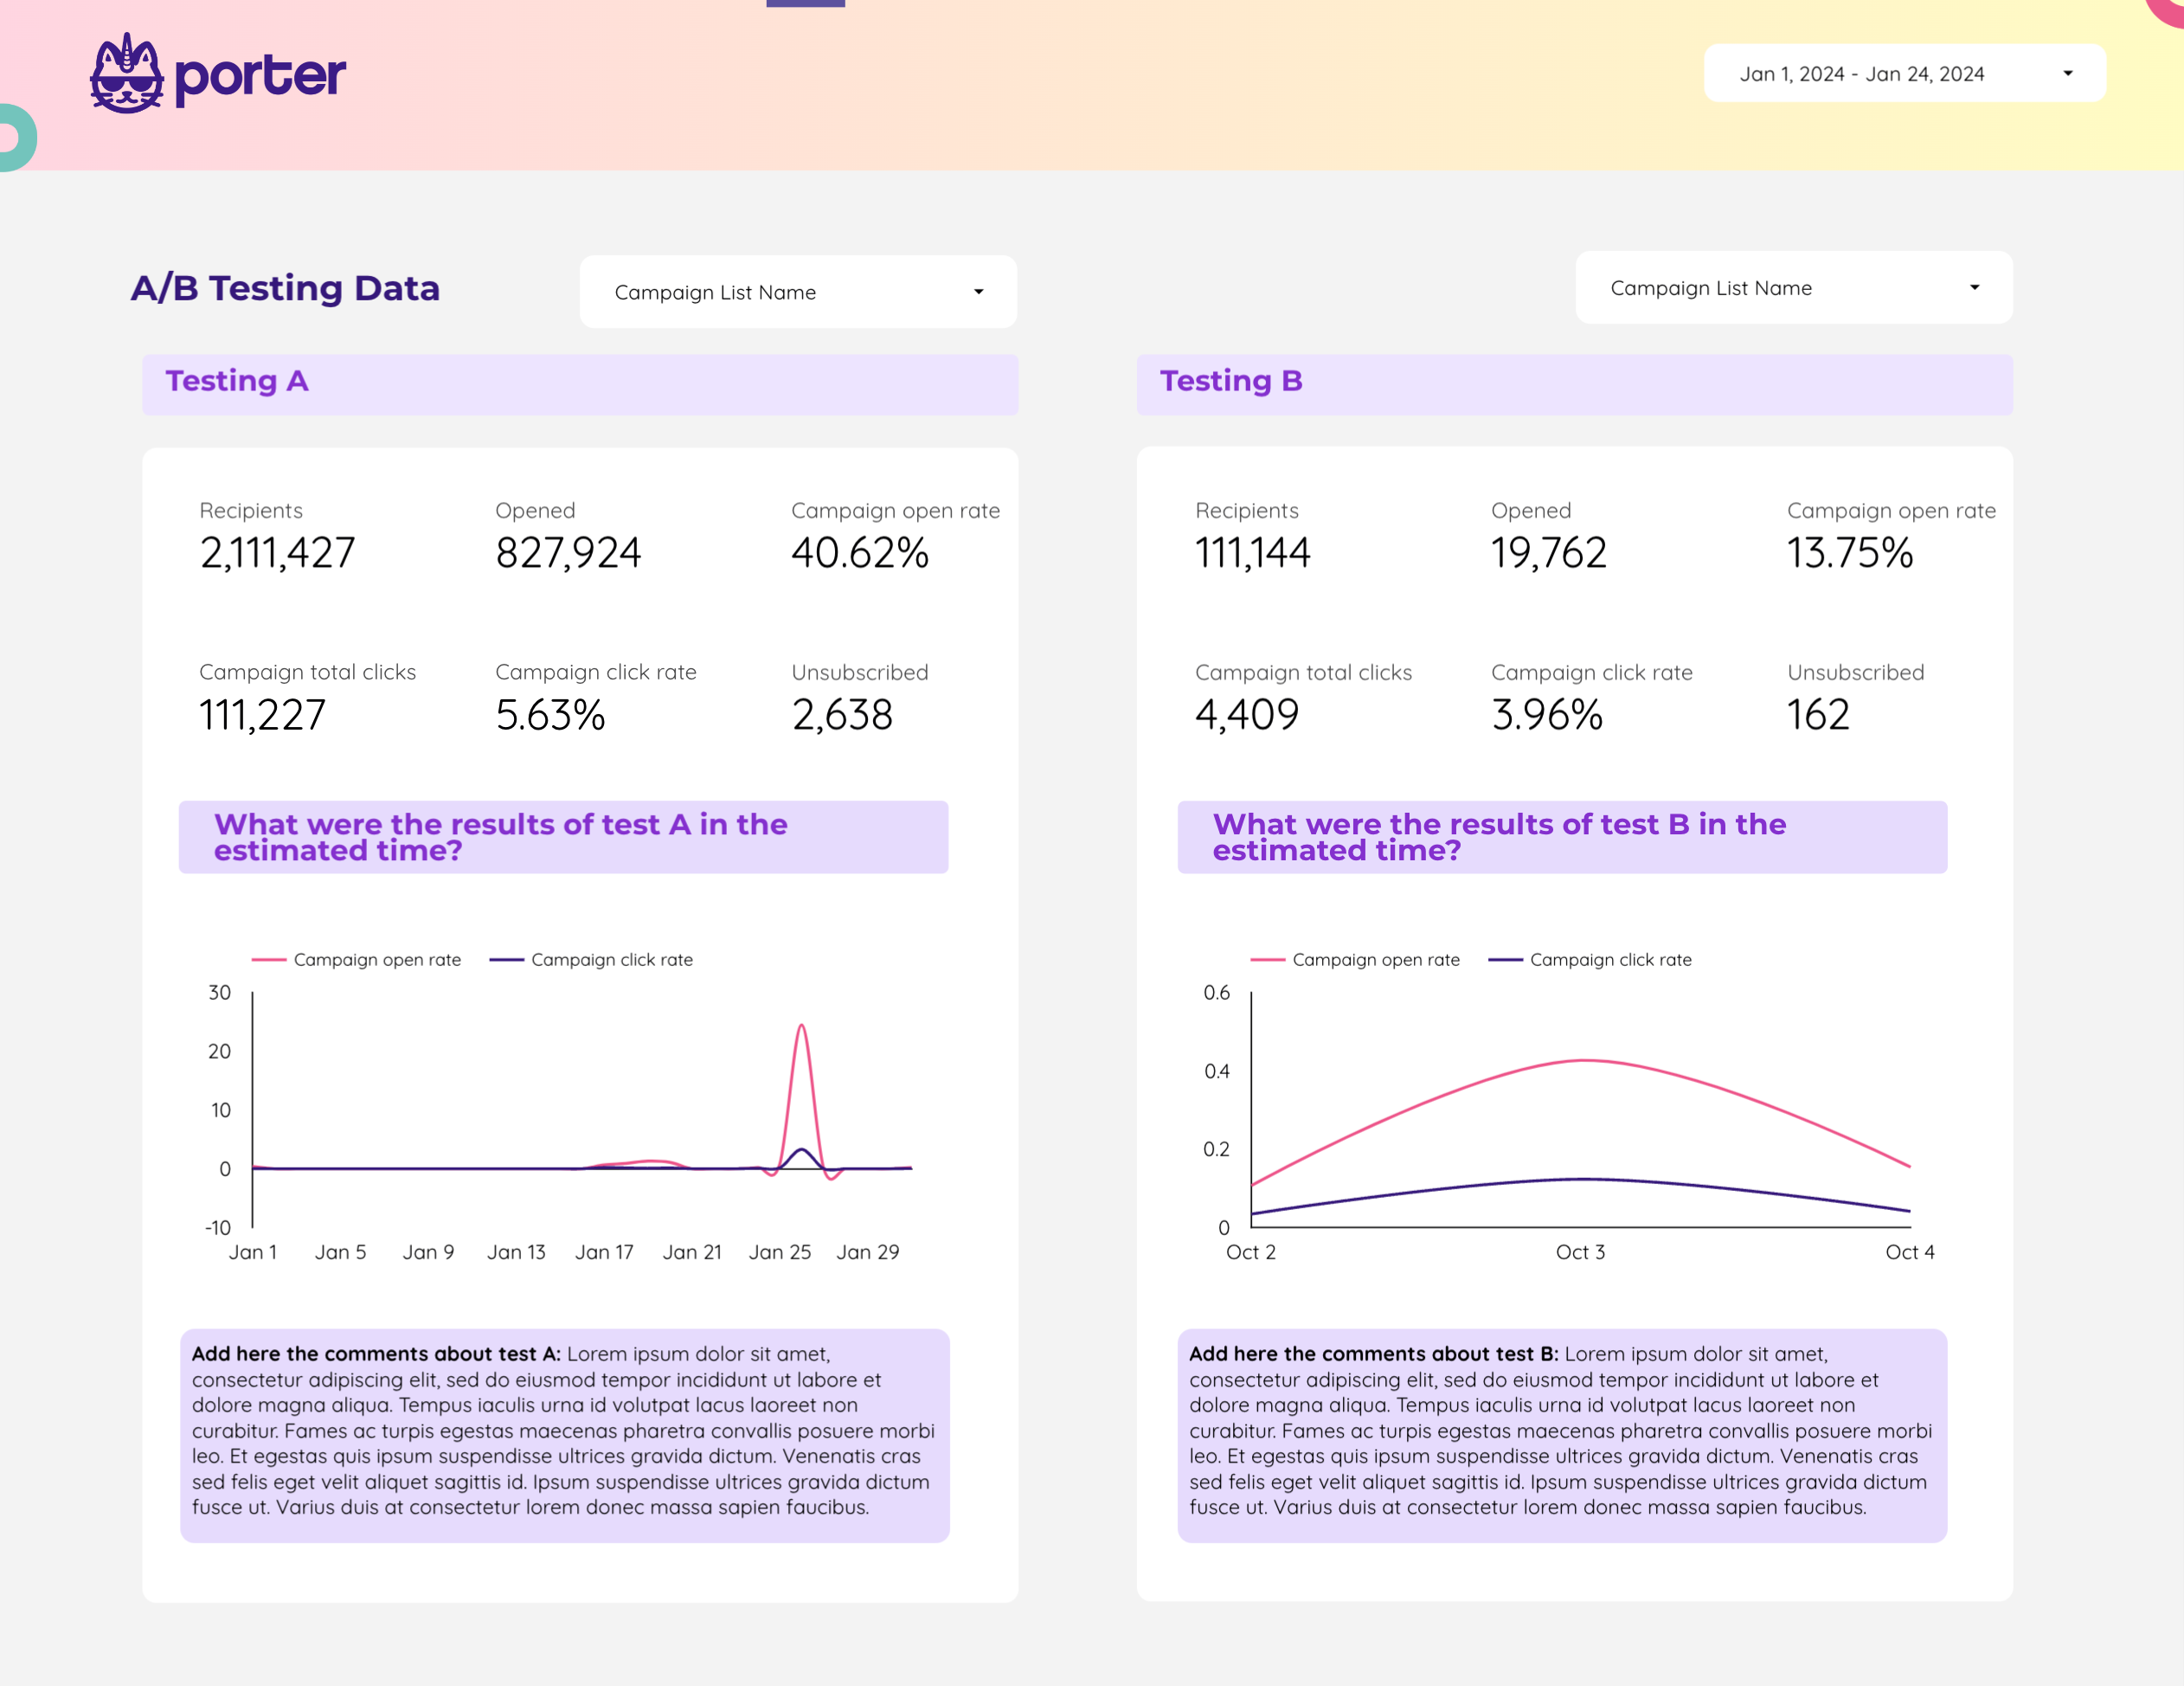
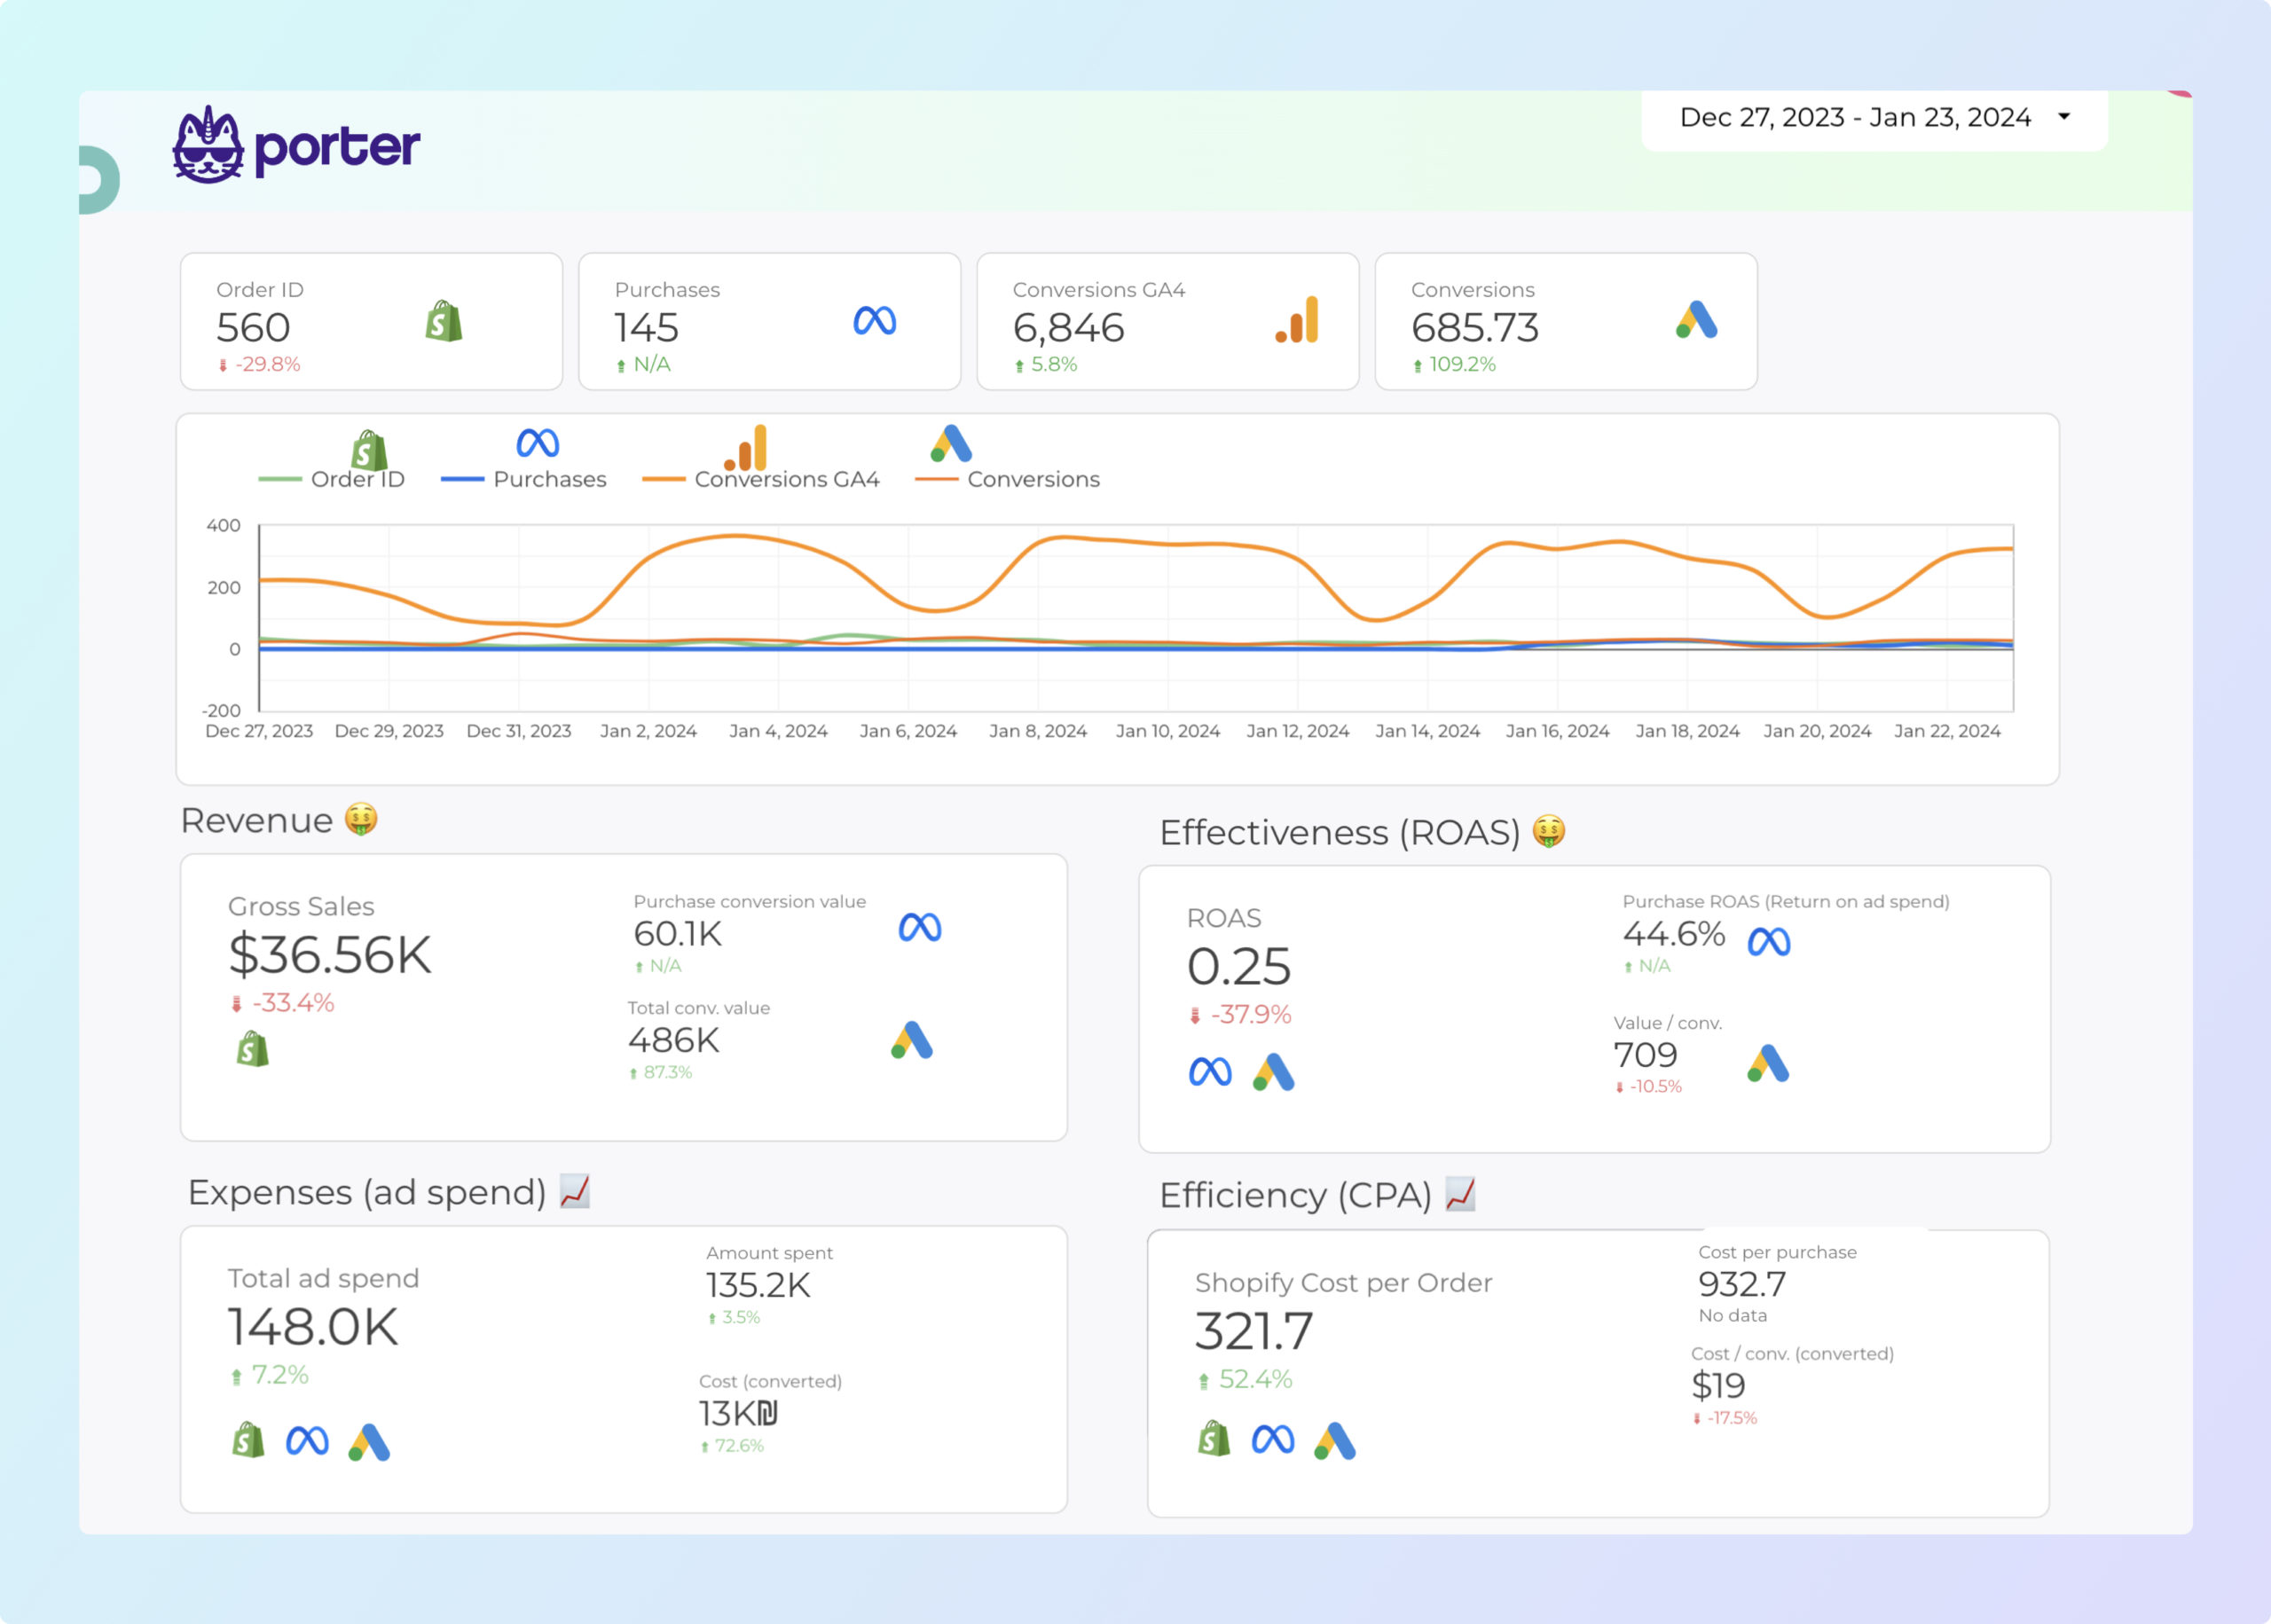
What is a data analytics report?
A data analytics report is a document that consolidates data from multiple sources (e.g., databases, APIs, spreadsheets) to track and display key performance indicators (KPIs) (e.g., data accuracy, processing time, user engagement), enabling teams to monitor data performance and create presentations for stakeholders and executives.
Data analytics reports are typically created using flexible tools like Google Looker Studio, Power BI, Google Sheets, or platform-specific solutions to enable high customization and integration of multiple data sources.
What to include in a data analytics report?
An actionable data analytics report balances context and specificity based on the audience (executives, managers, and analysts) and their use cases.
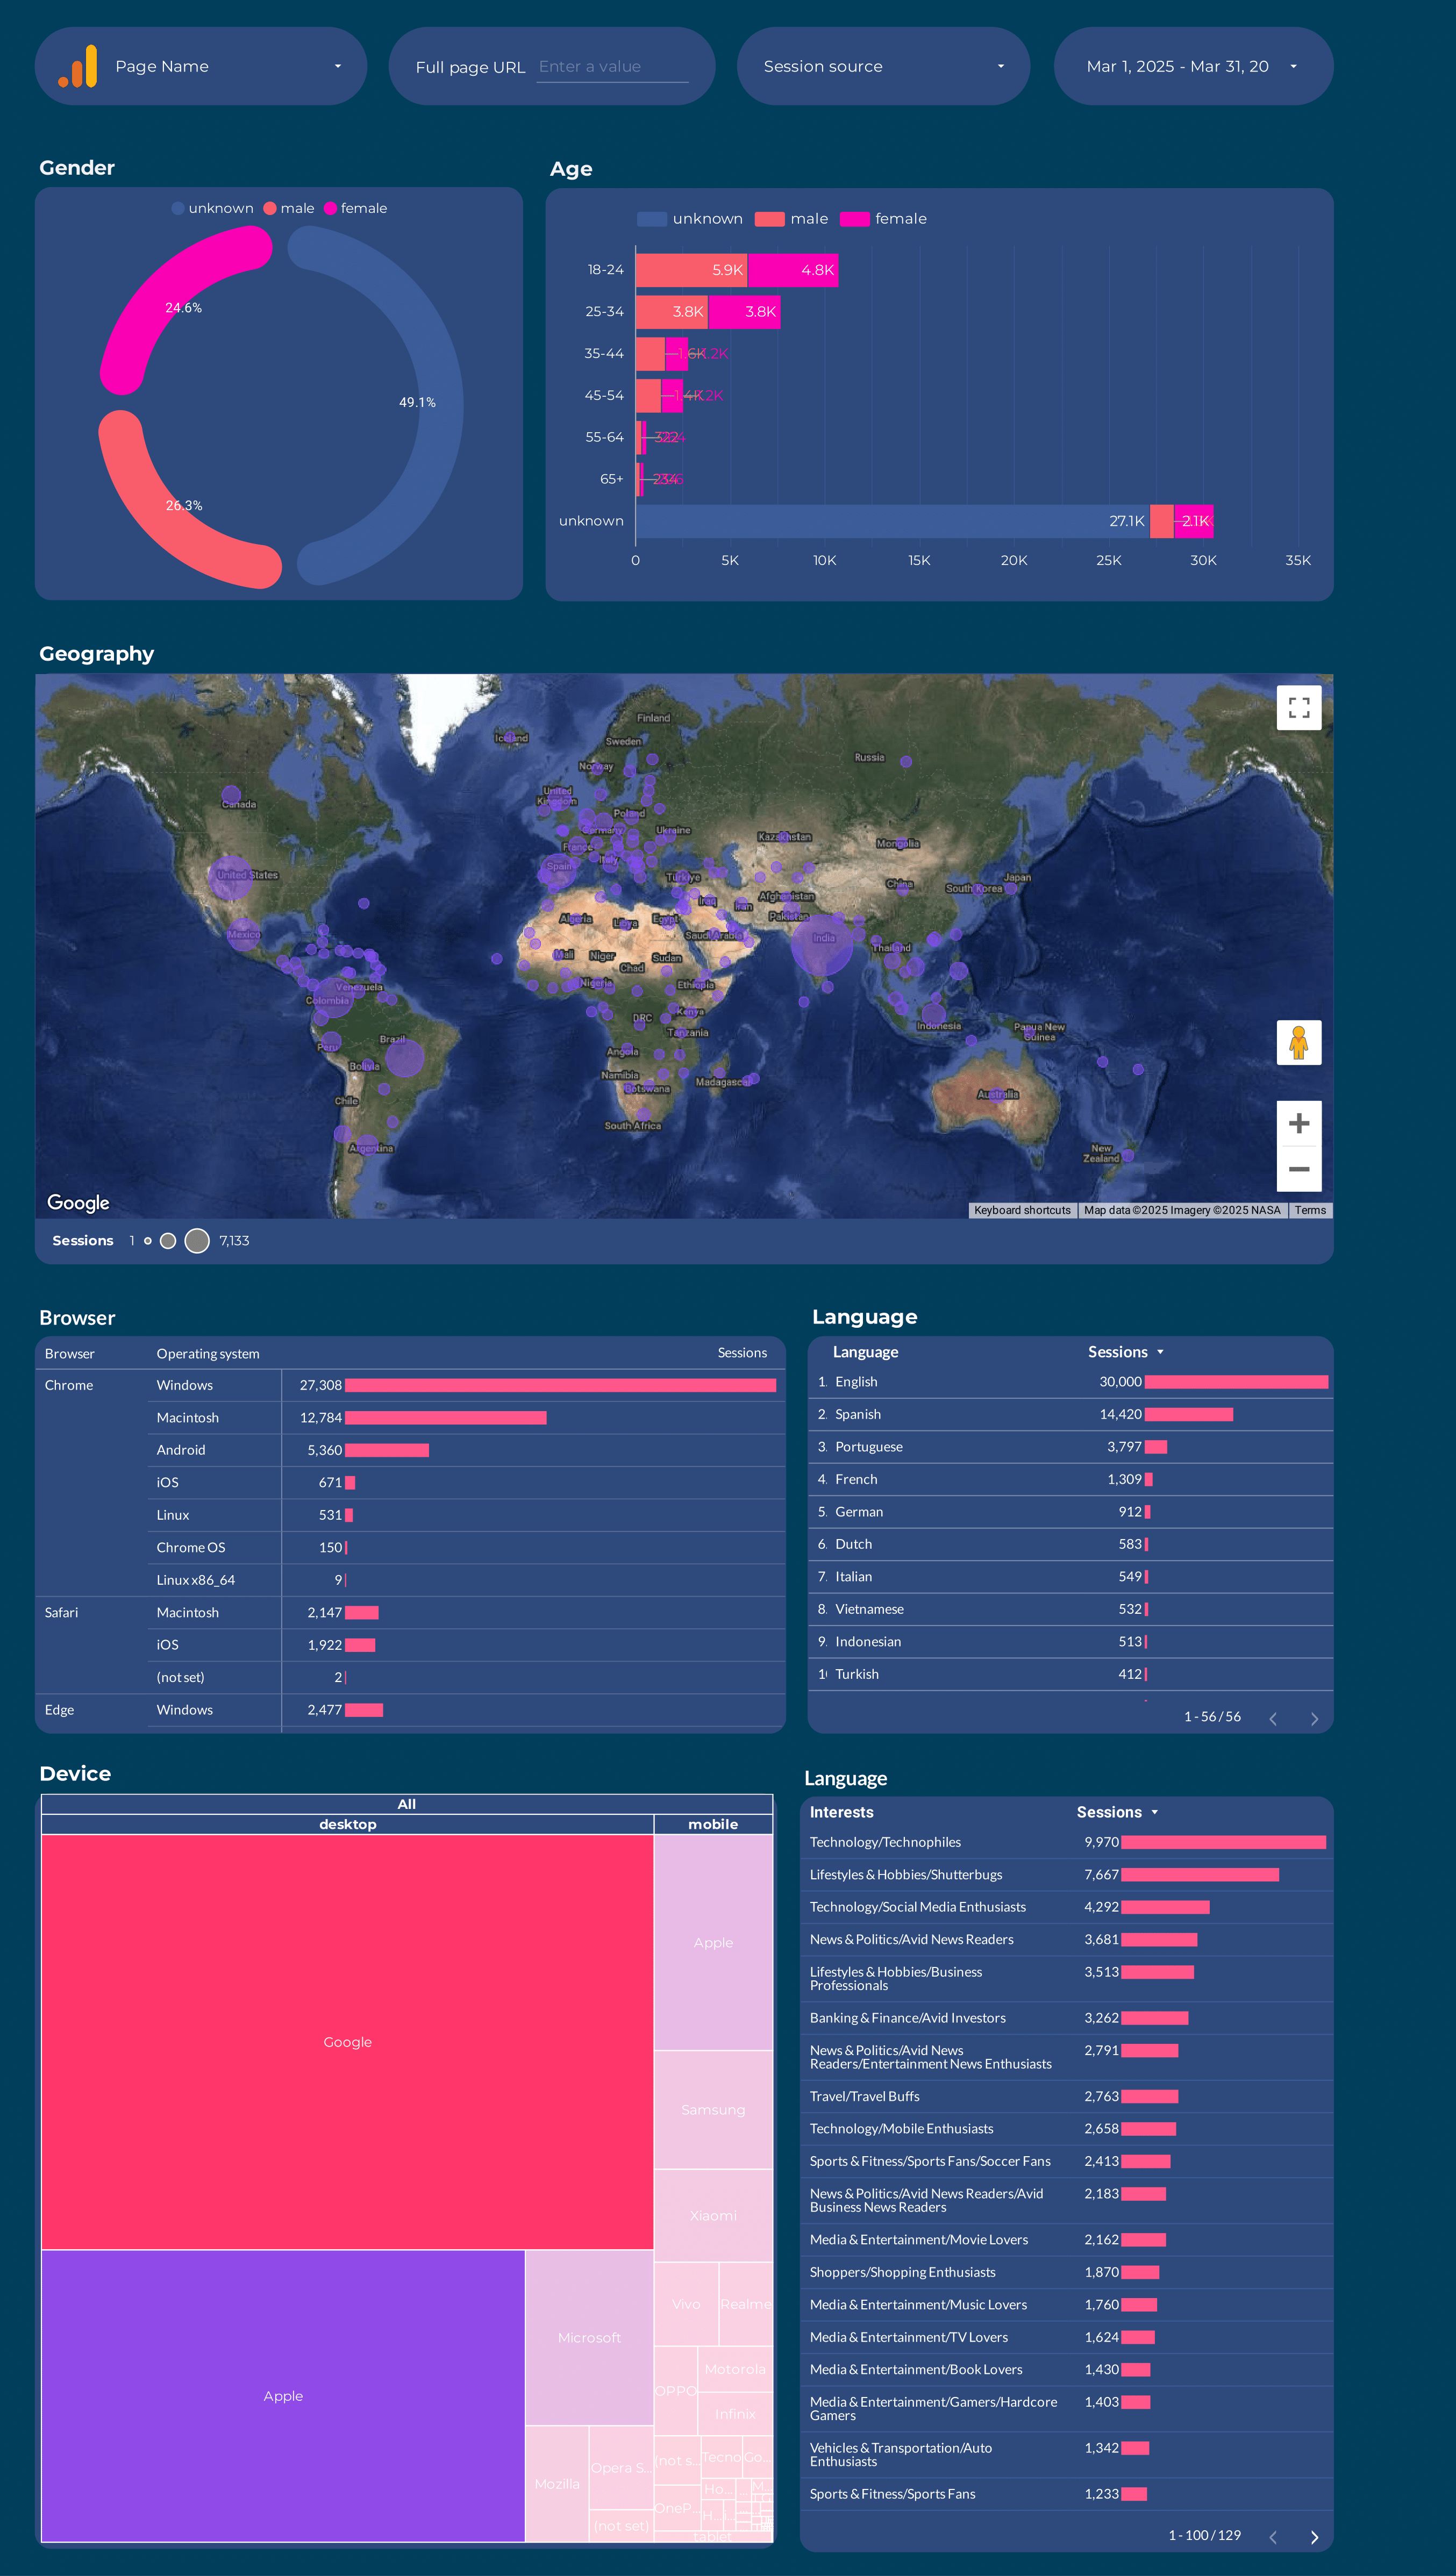
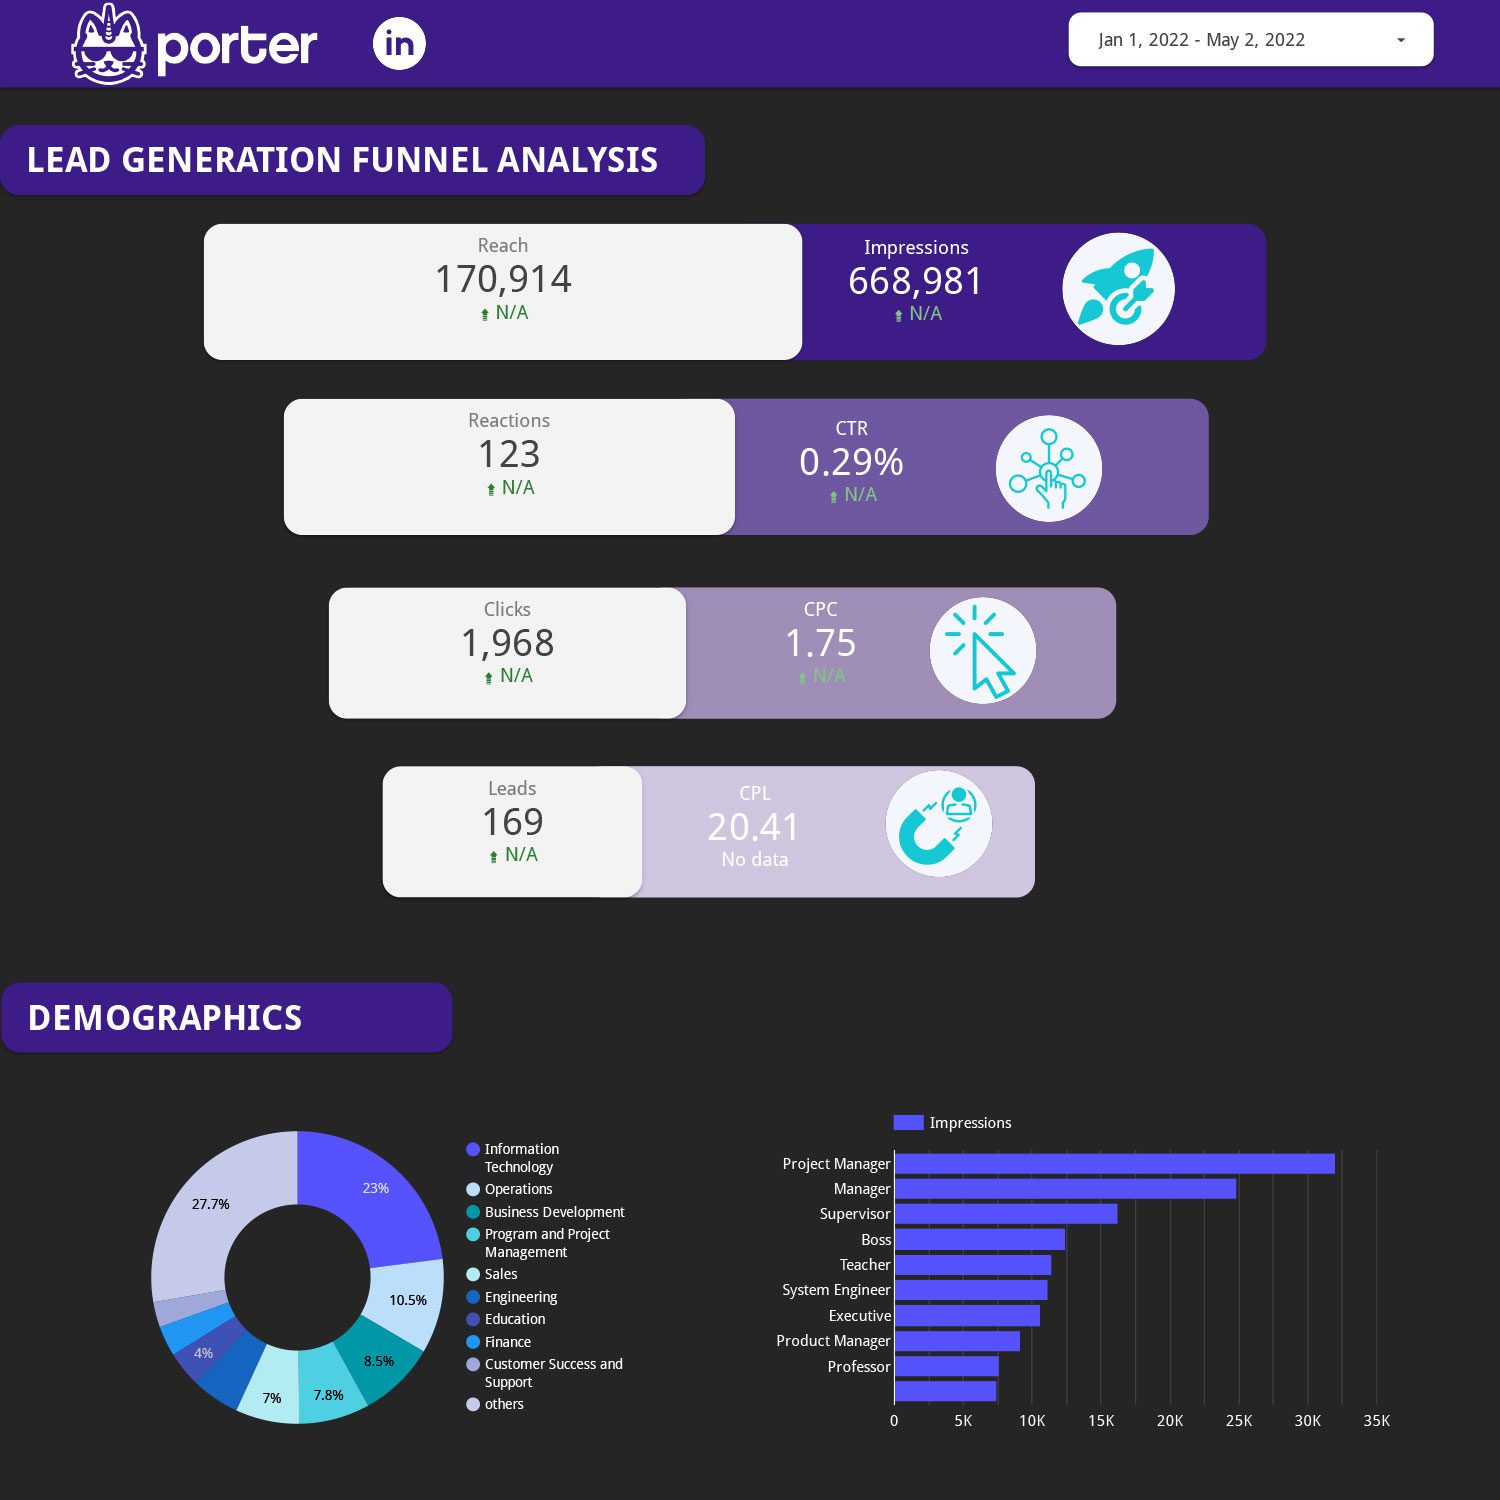
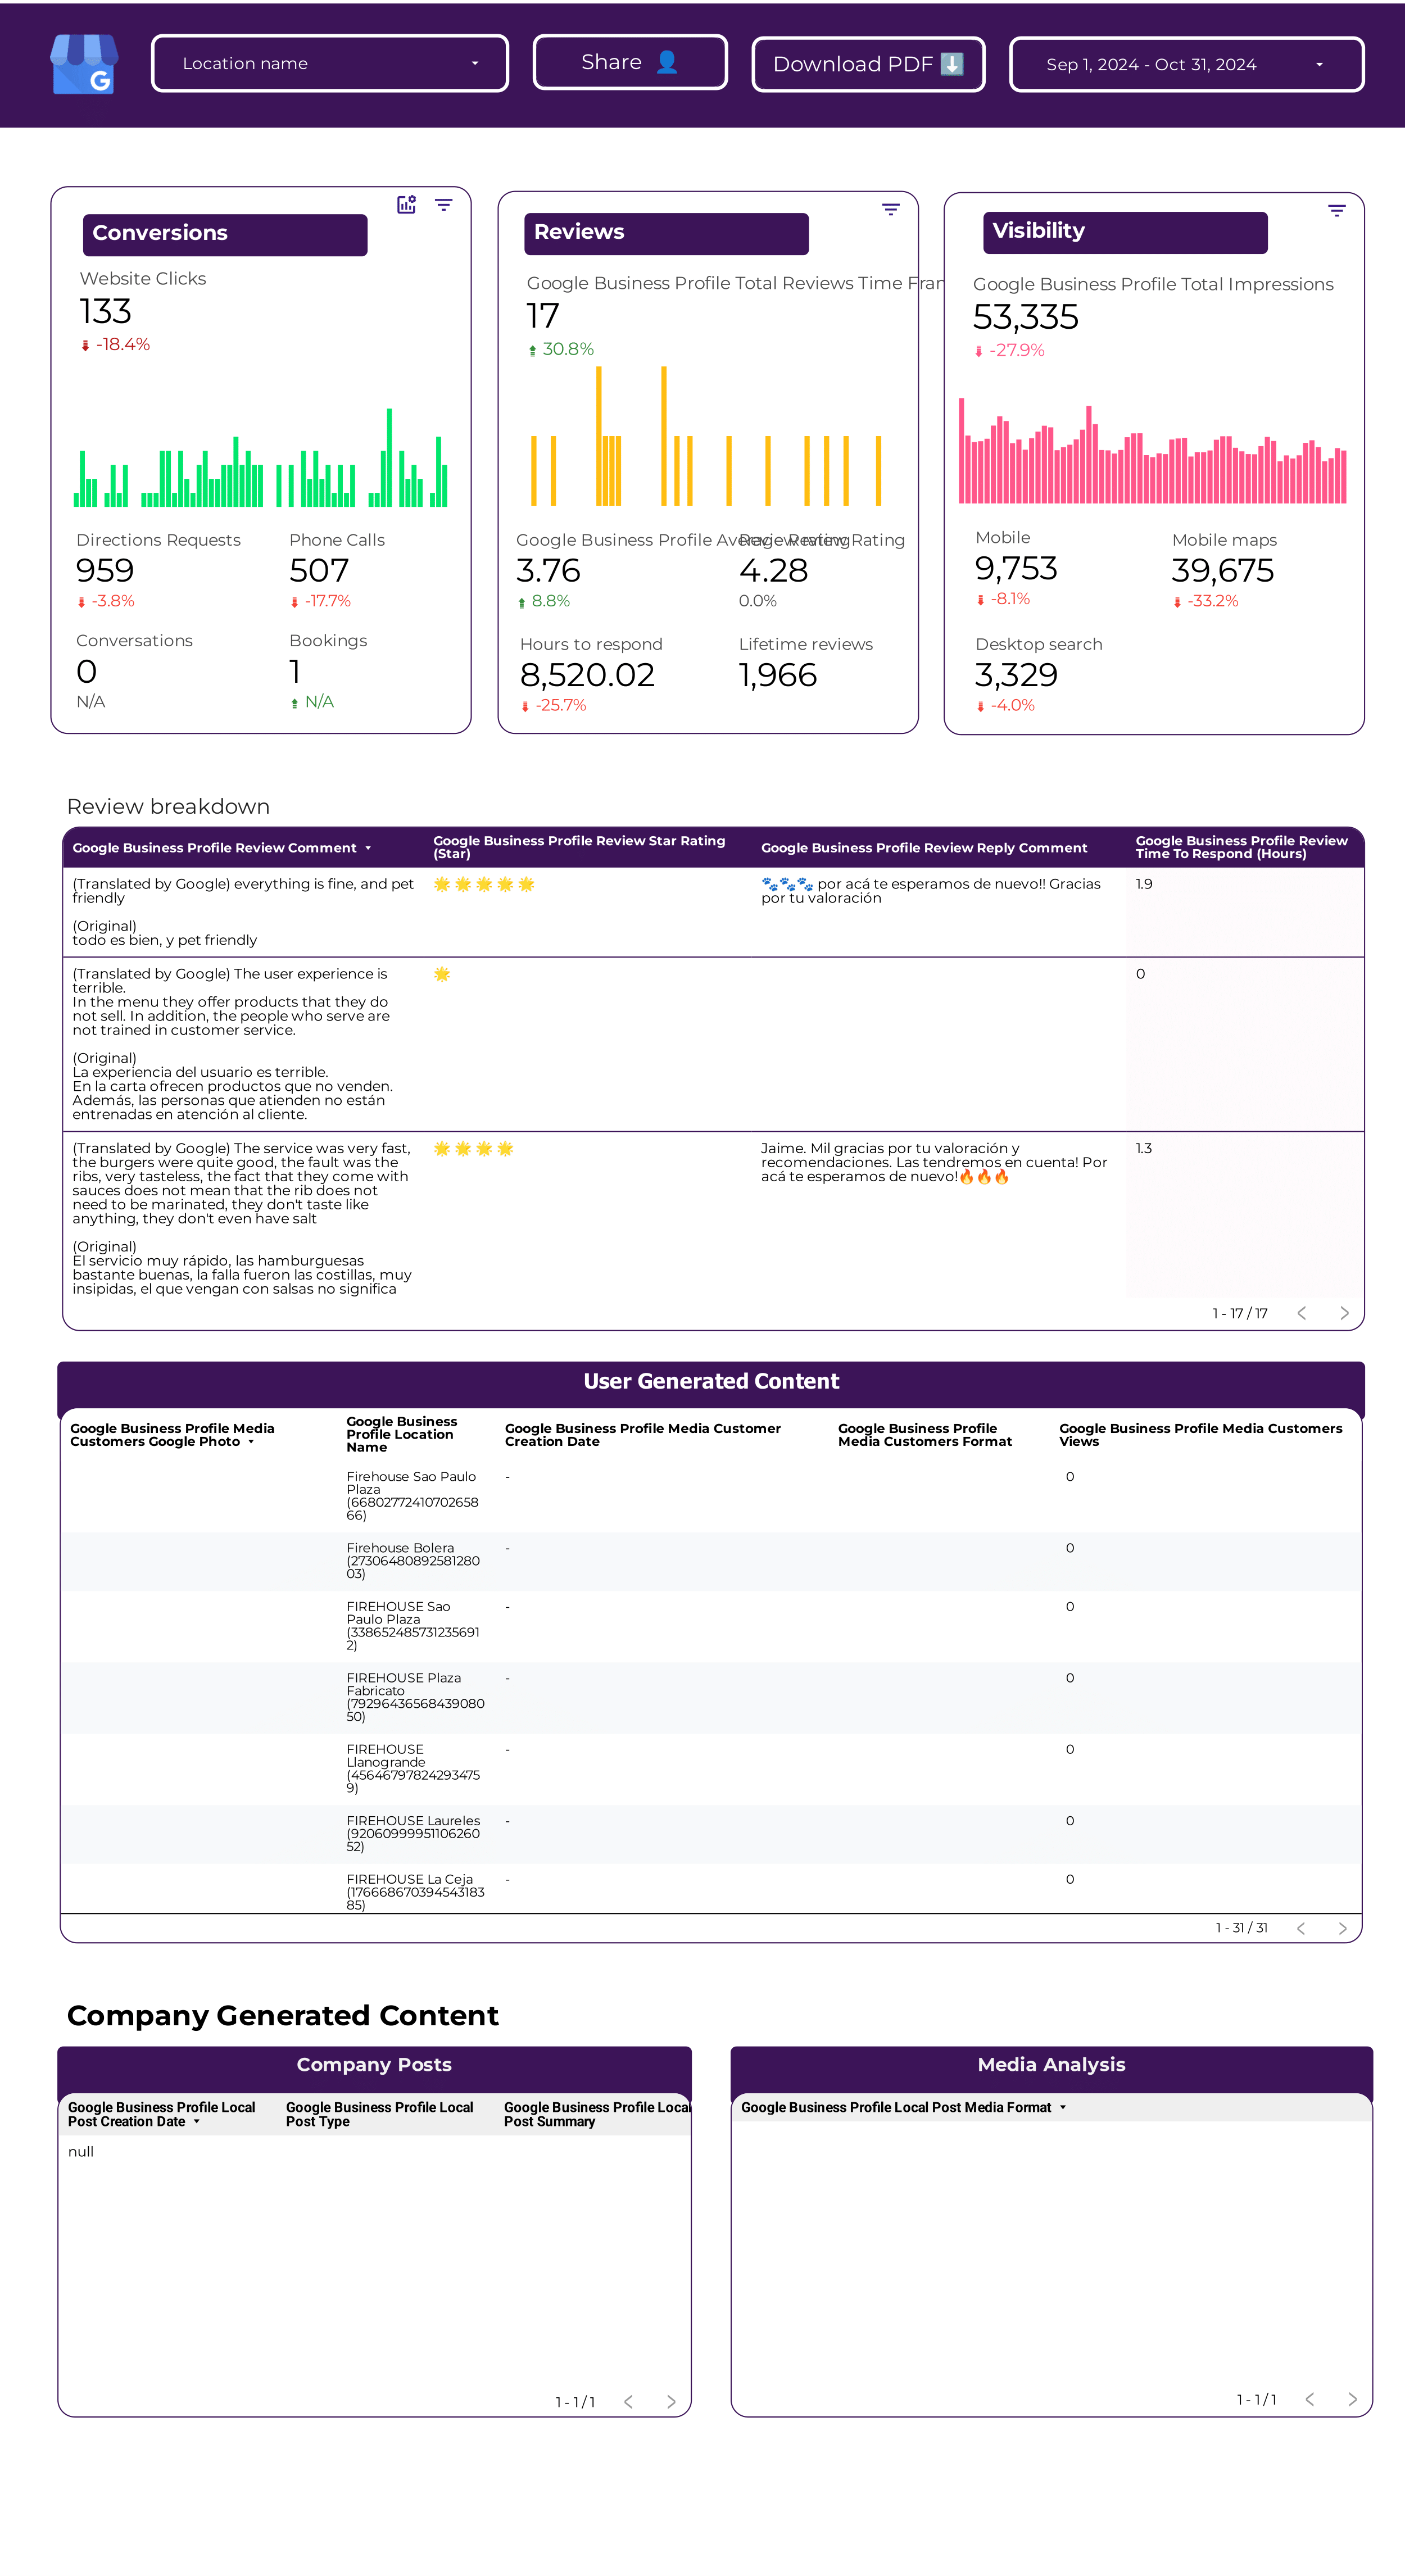
Executive data analytics reports
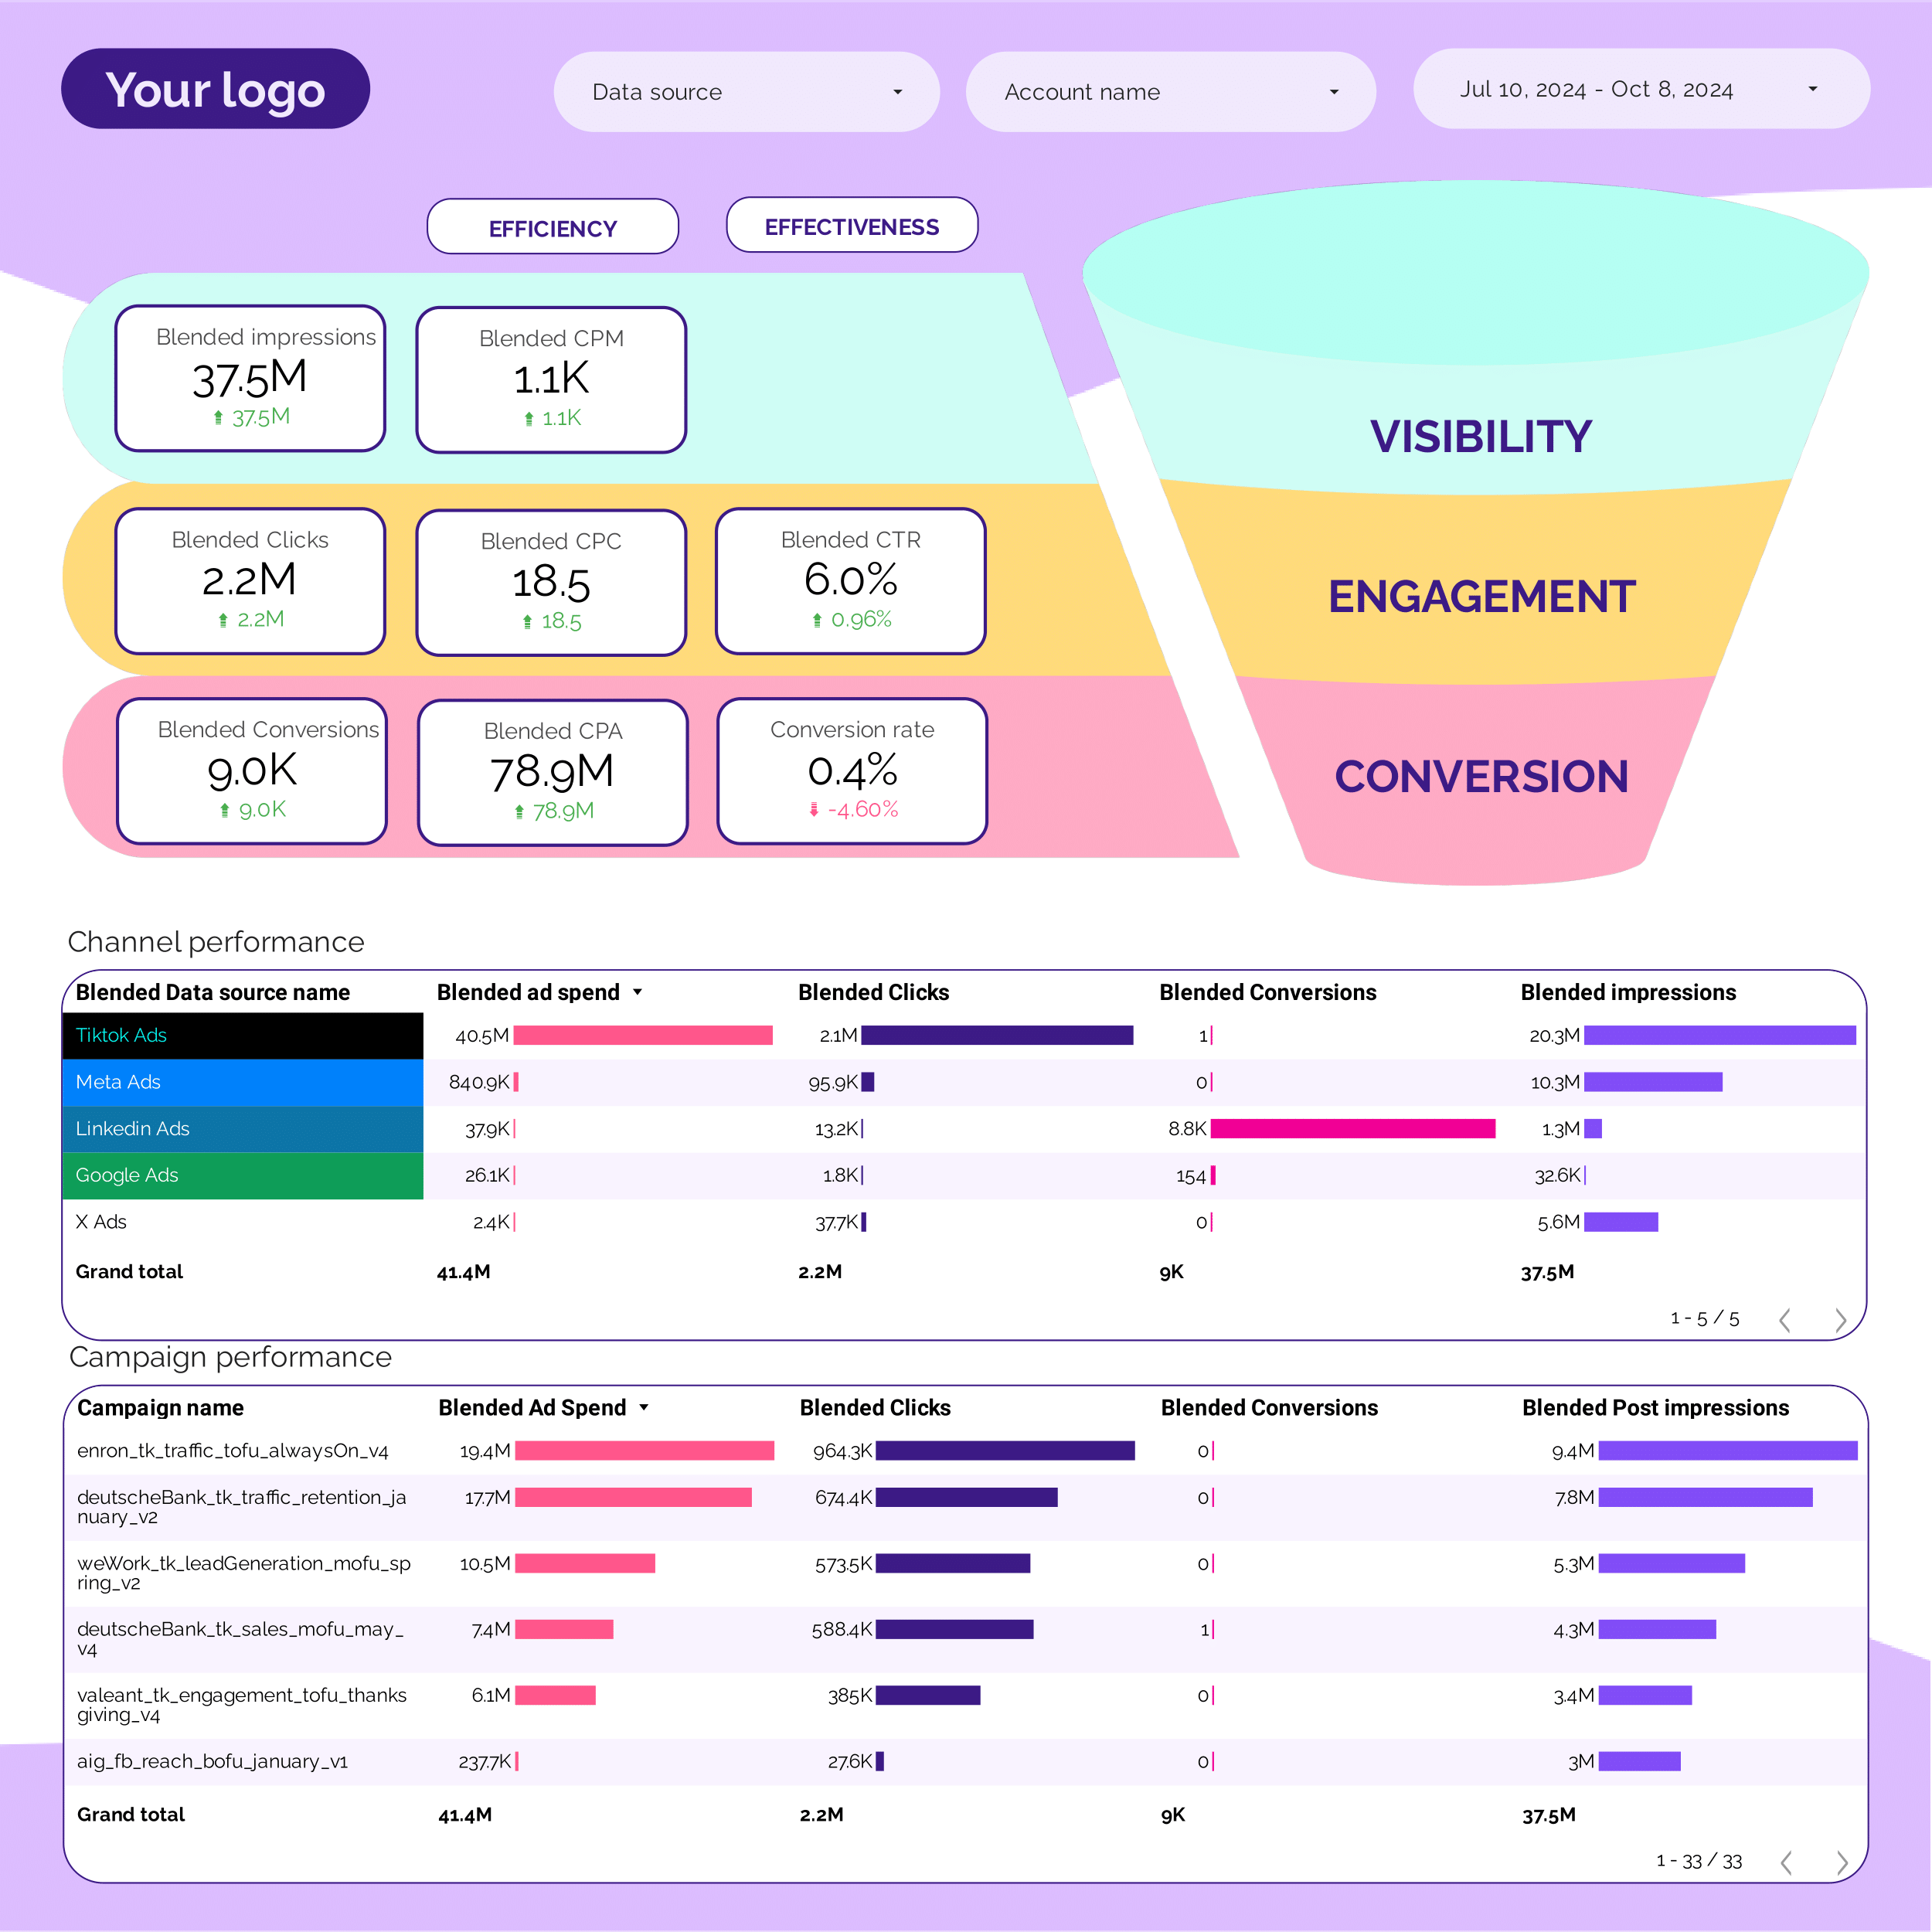
Executive reports for CTOs, CIOs, and stakeholders show data's impact on business outcomes. Reviewed weekly, monthly, or quarterly, they include:
- Data quality analysis: accuracy, completeness, and consistency of data across systems.
- Performance metrics: system uptime, response time, and data processing speed.
- User engagement analysis: user activity, adoption rates, and feedback.
- Add text for additional context to translate metrics for non-technical audiences. Present in slide decks and simplified Looker Studio reports.
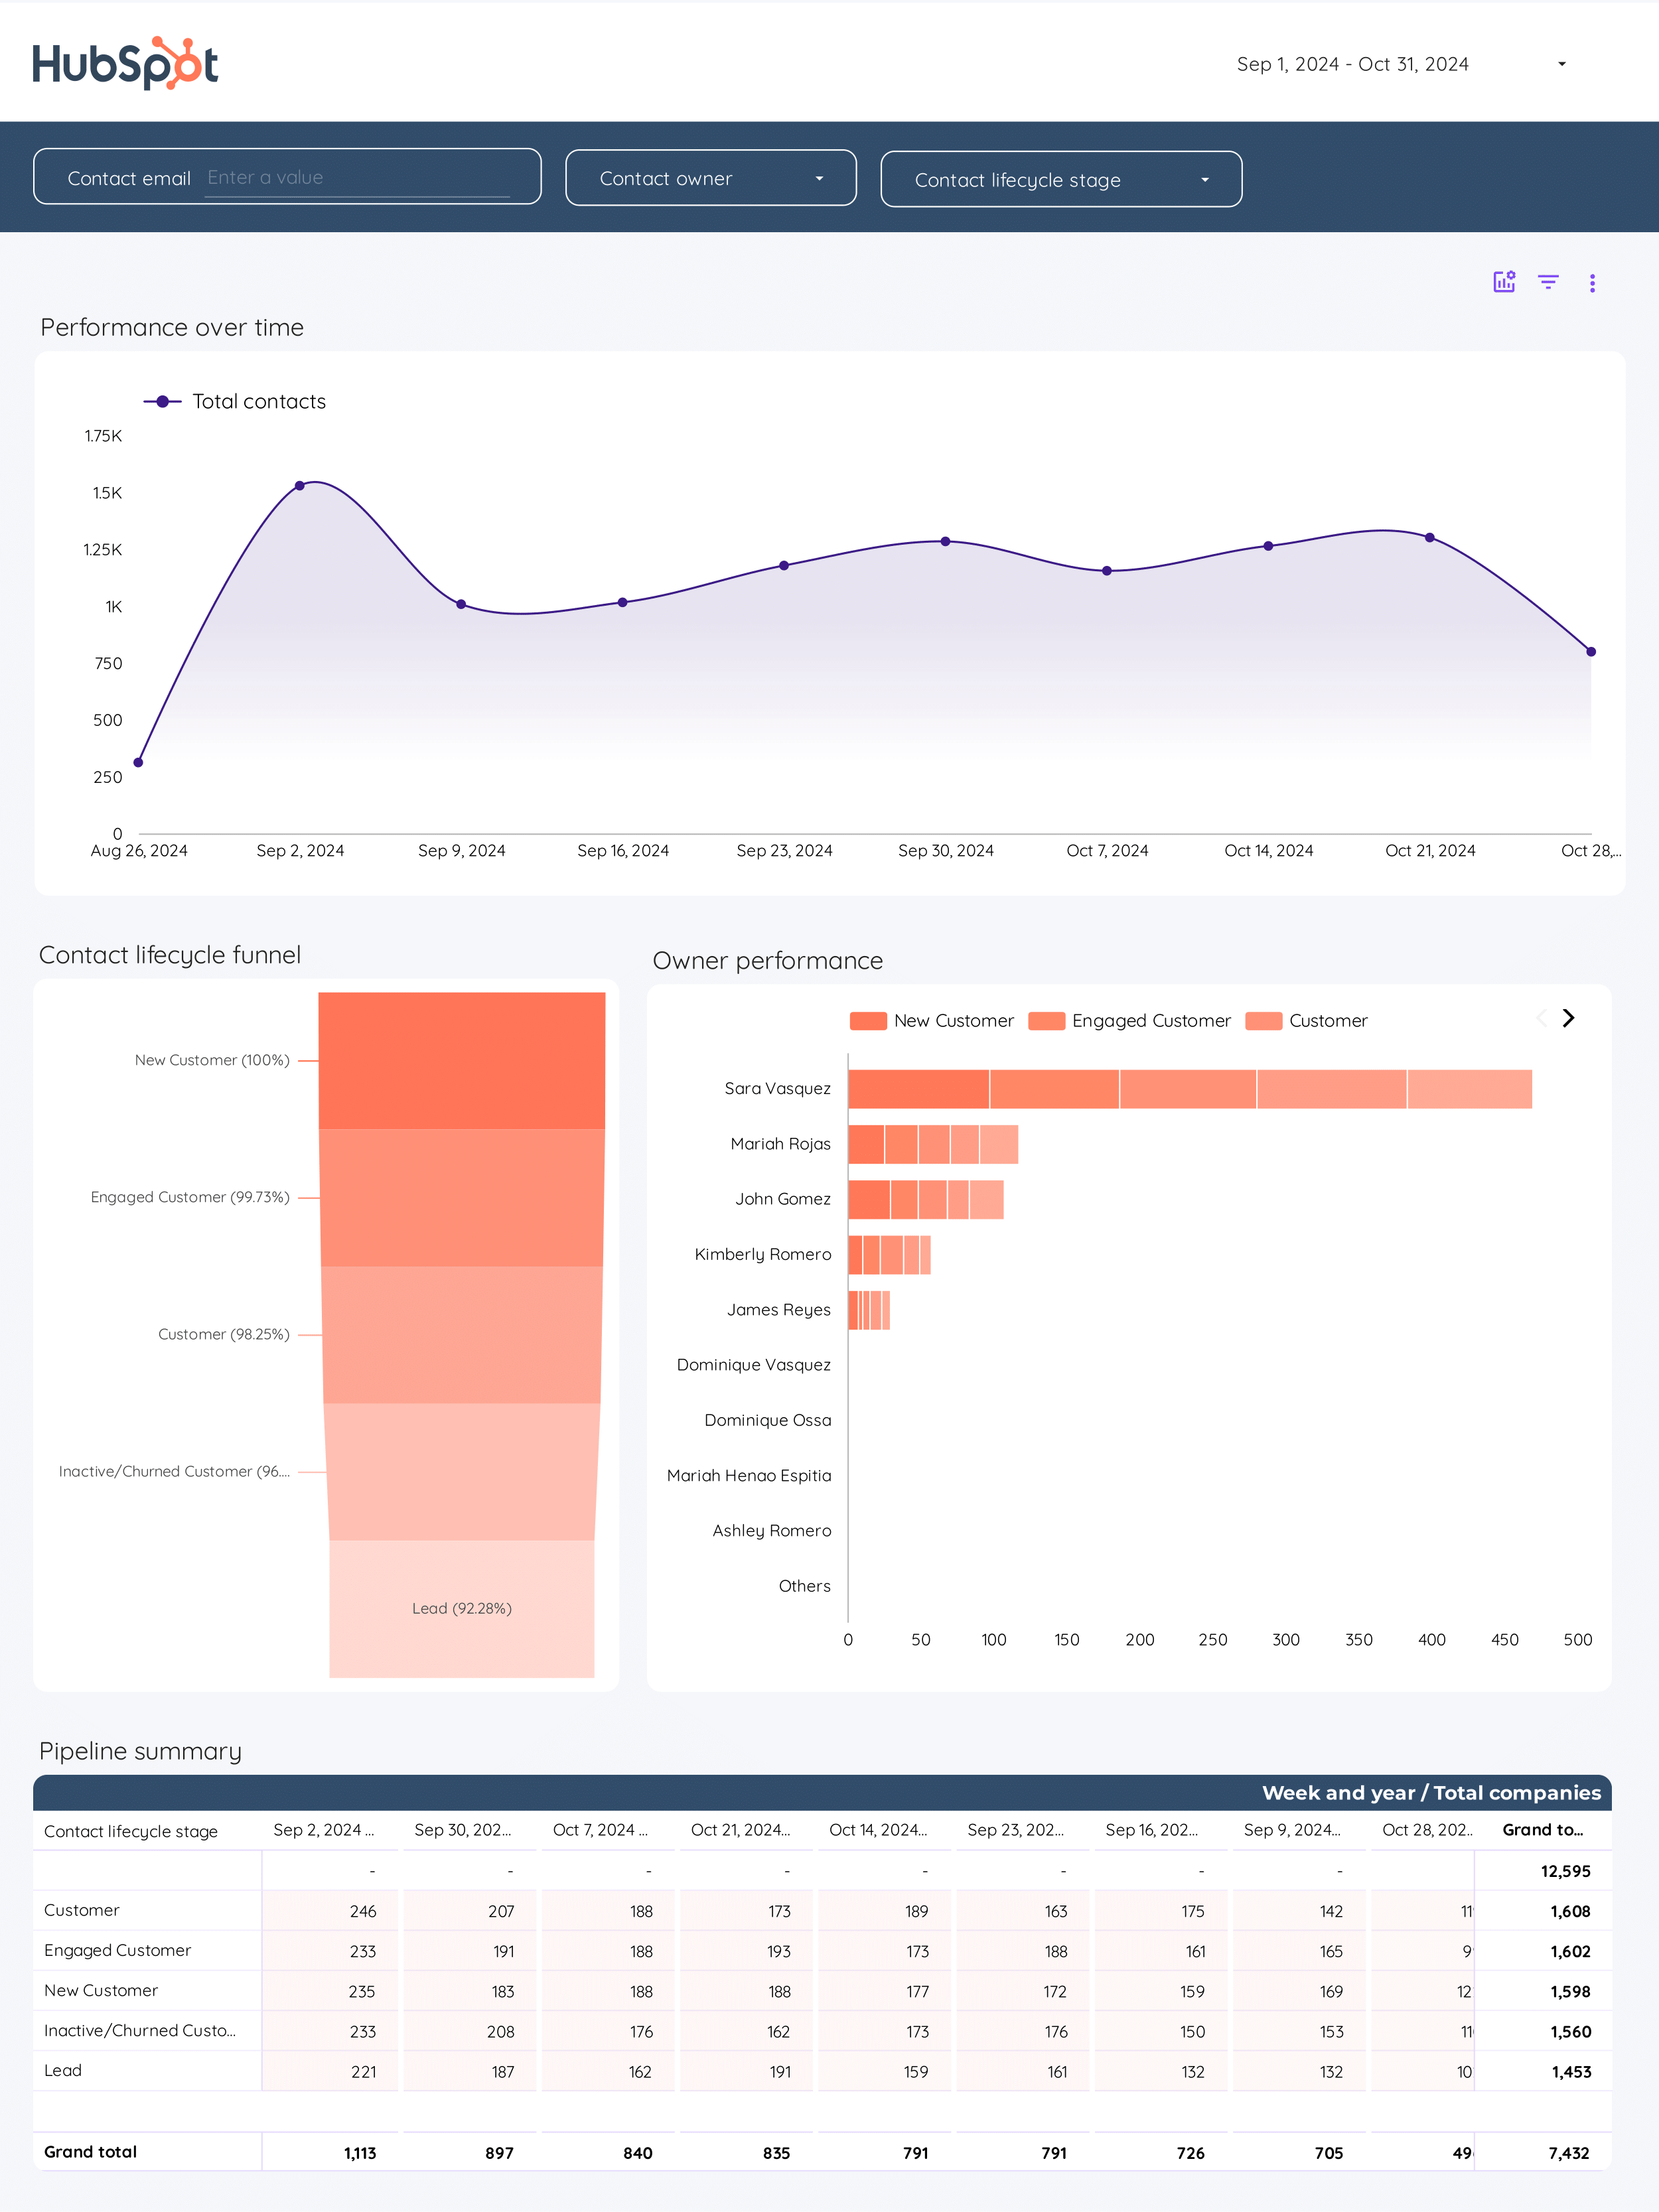
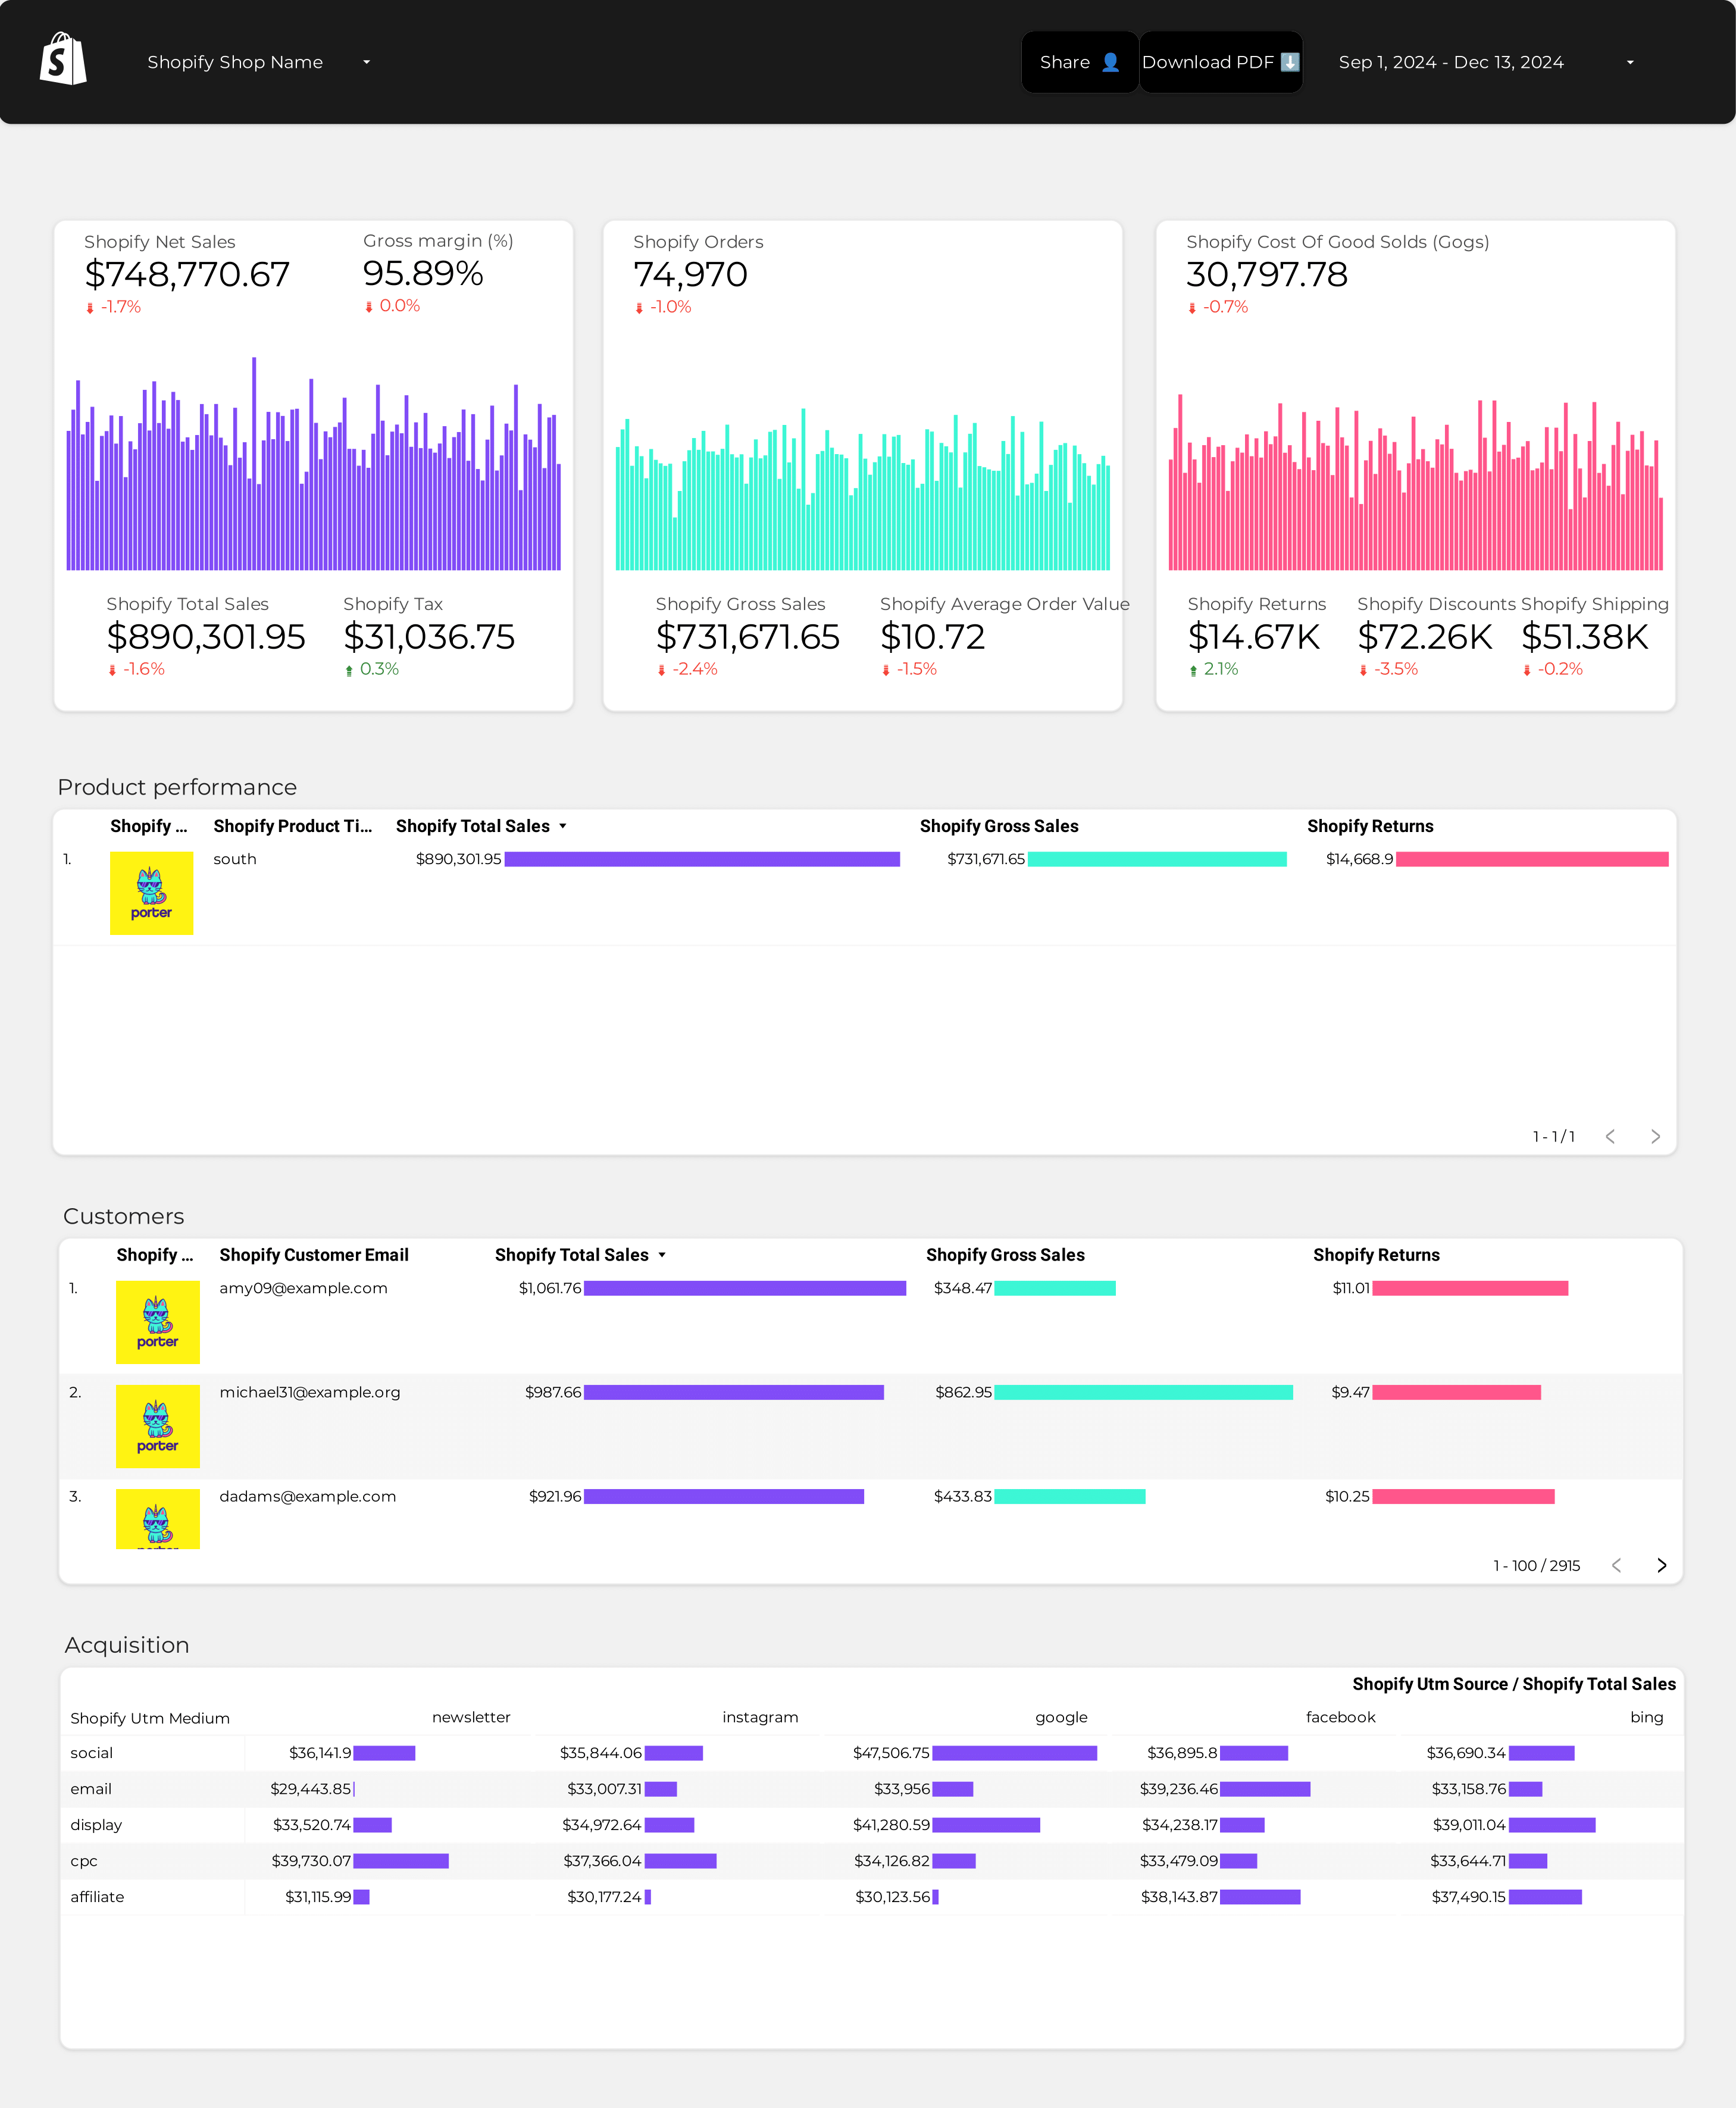
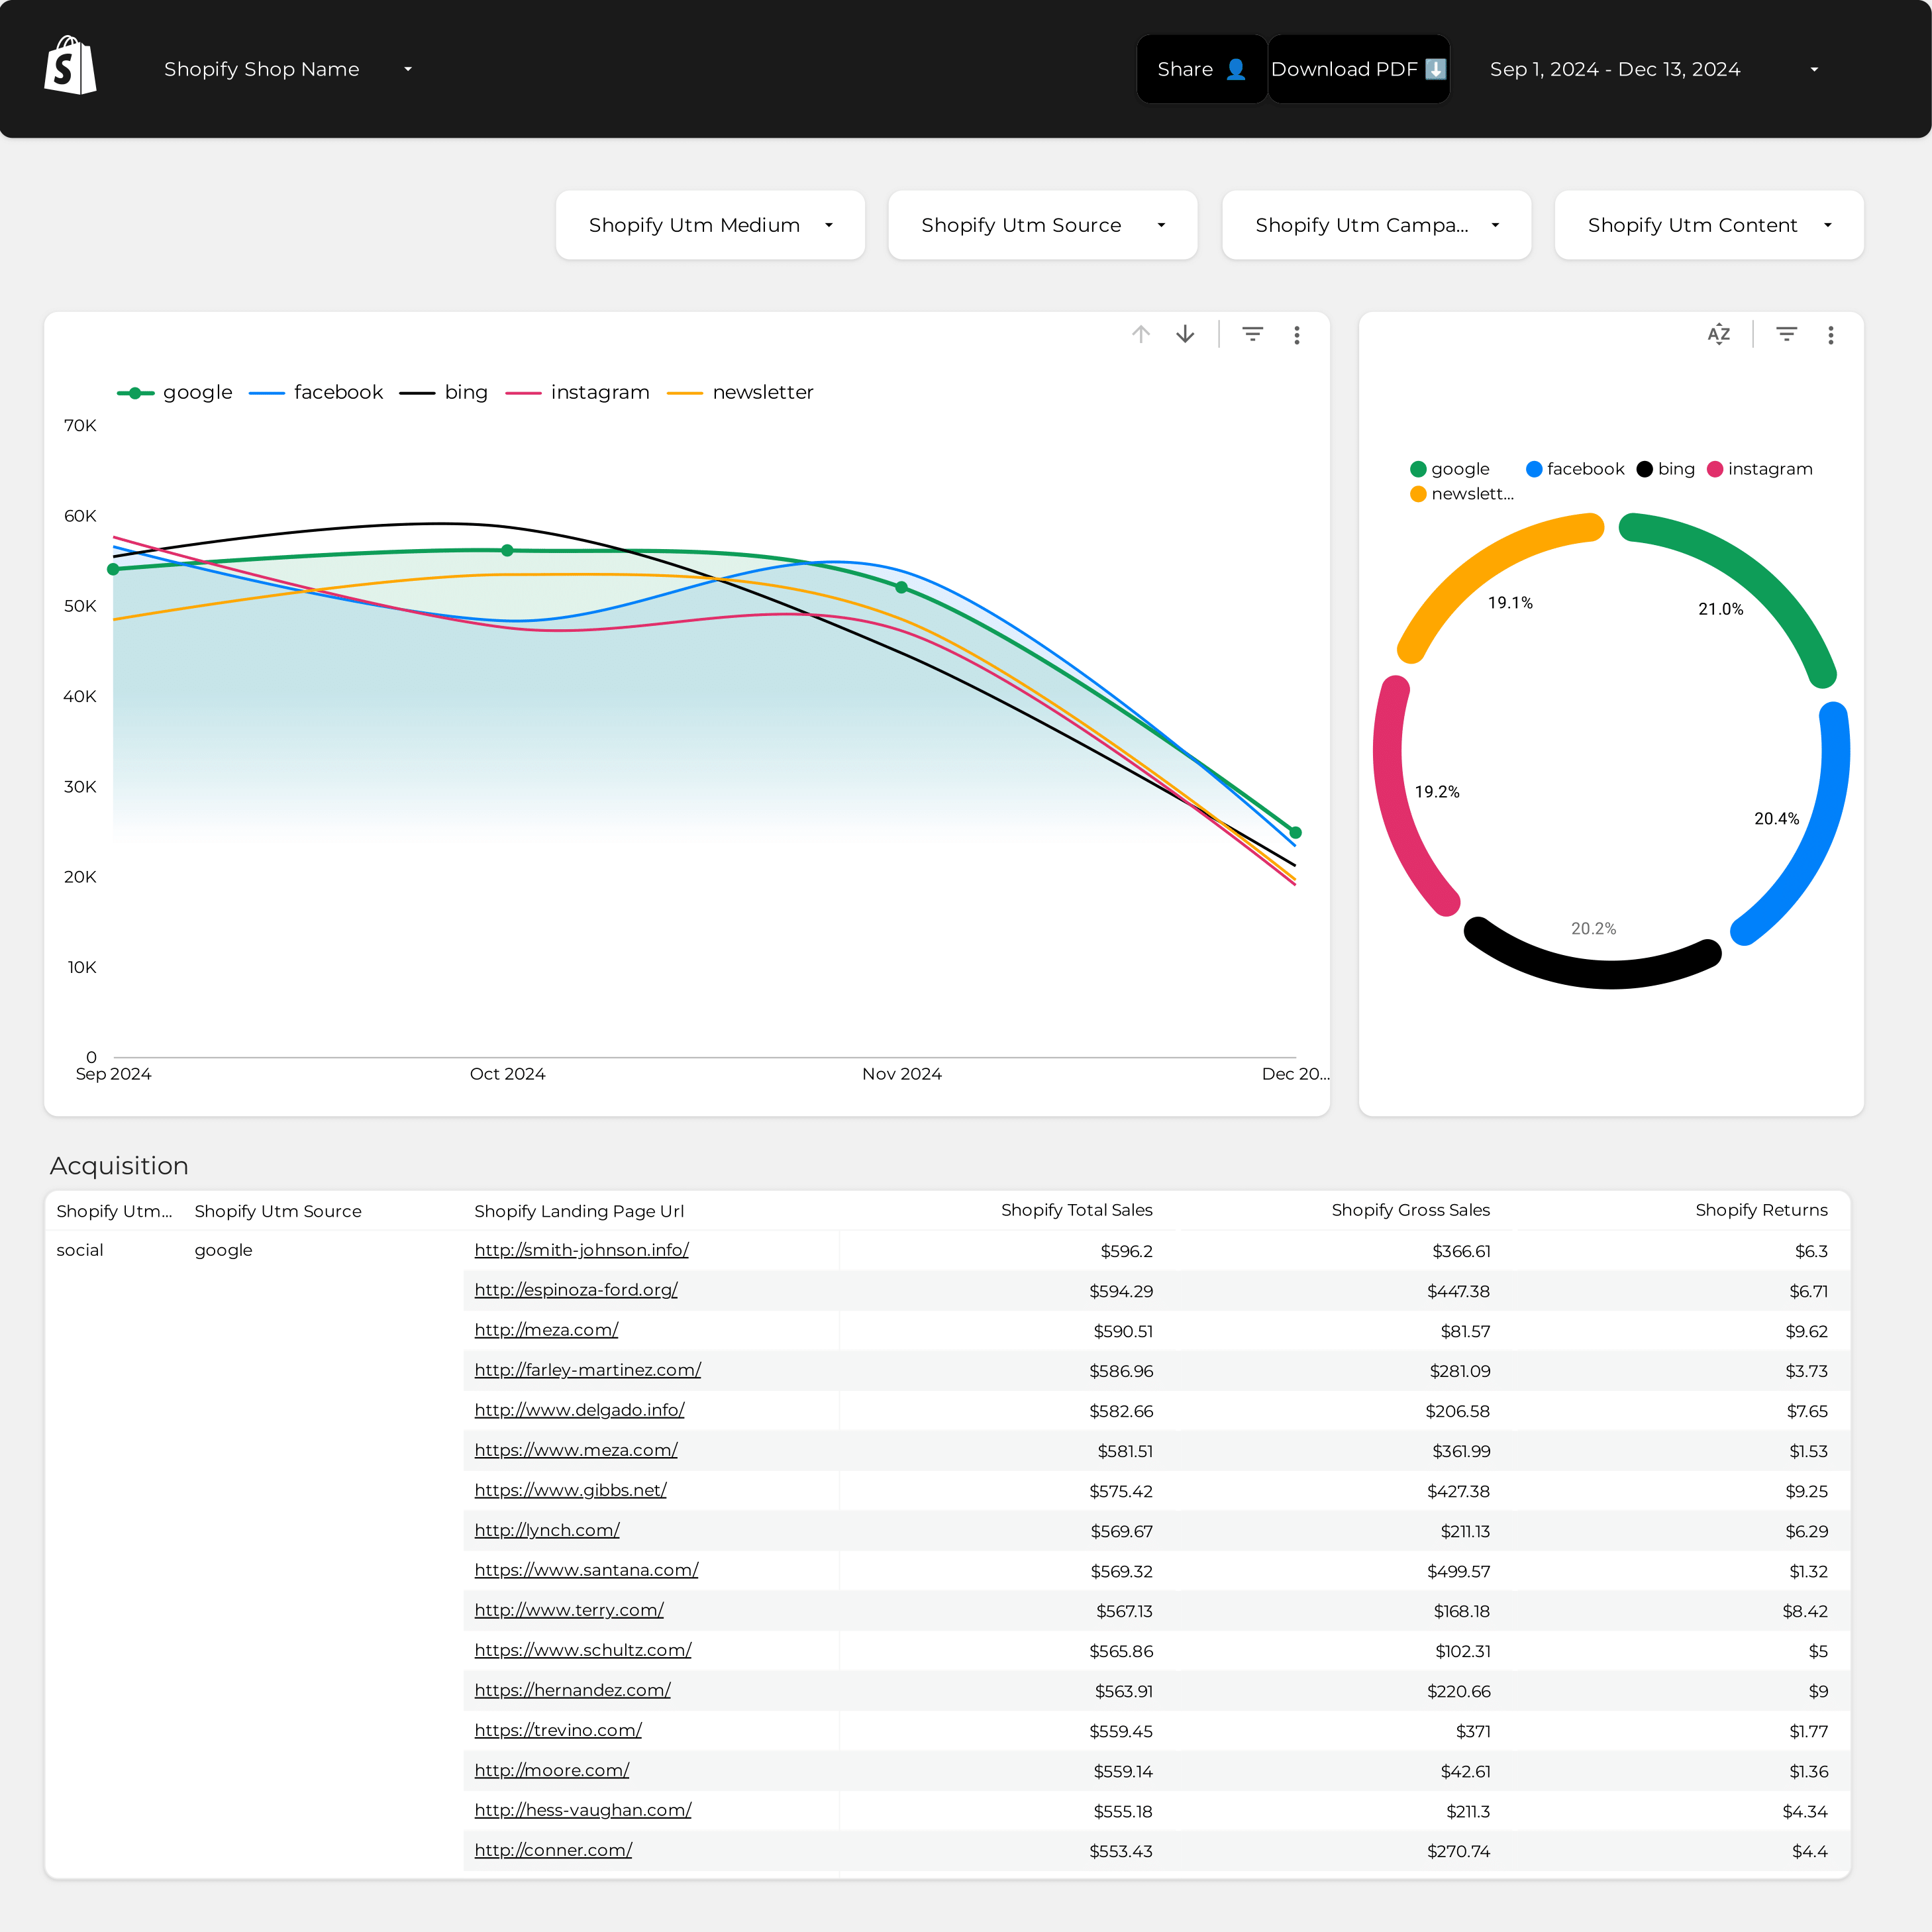
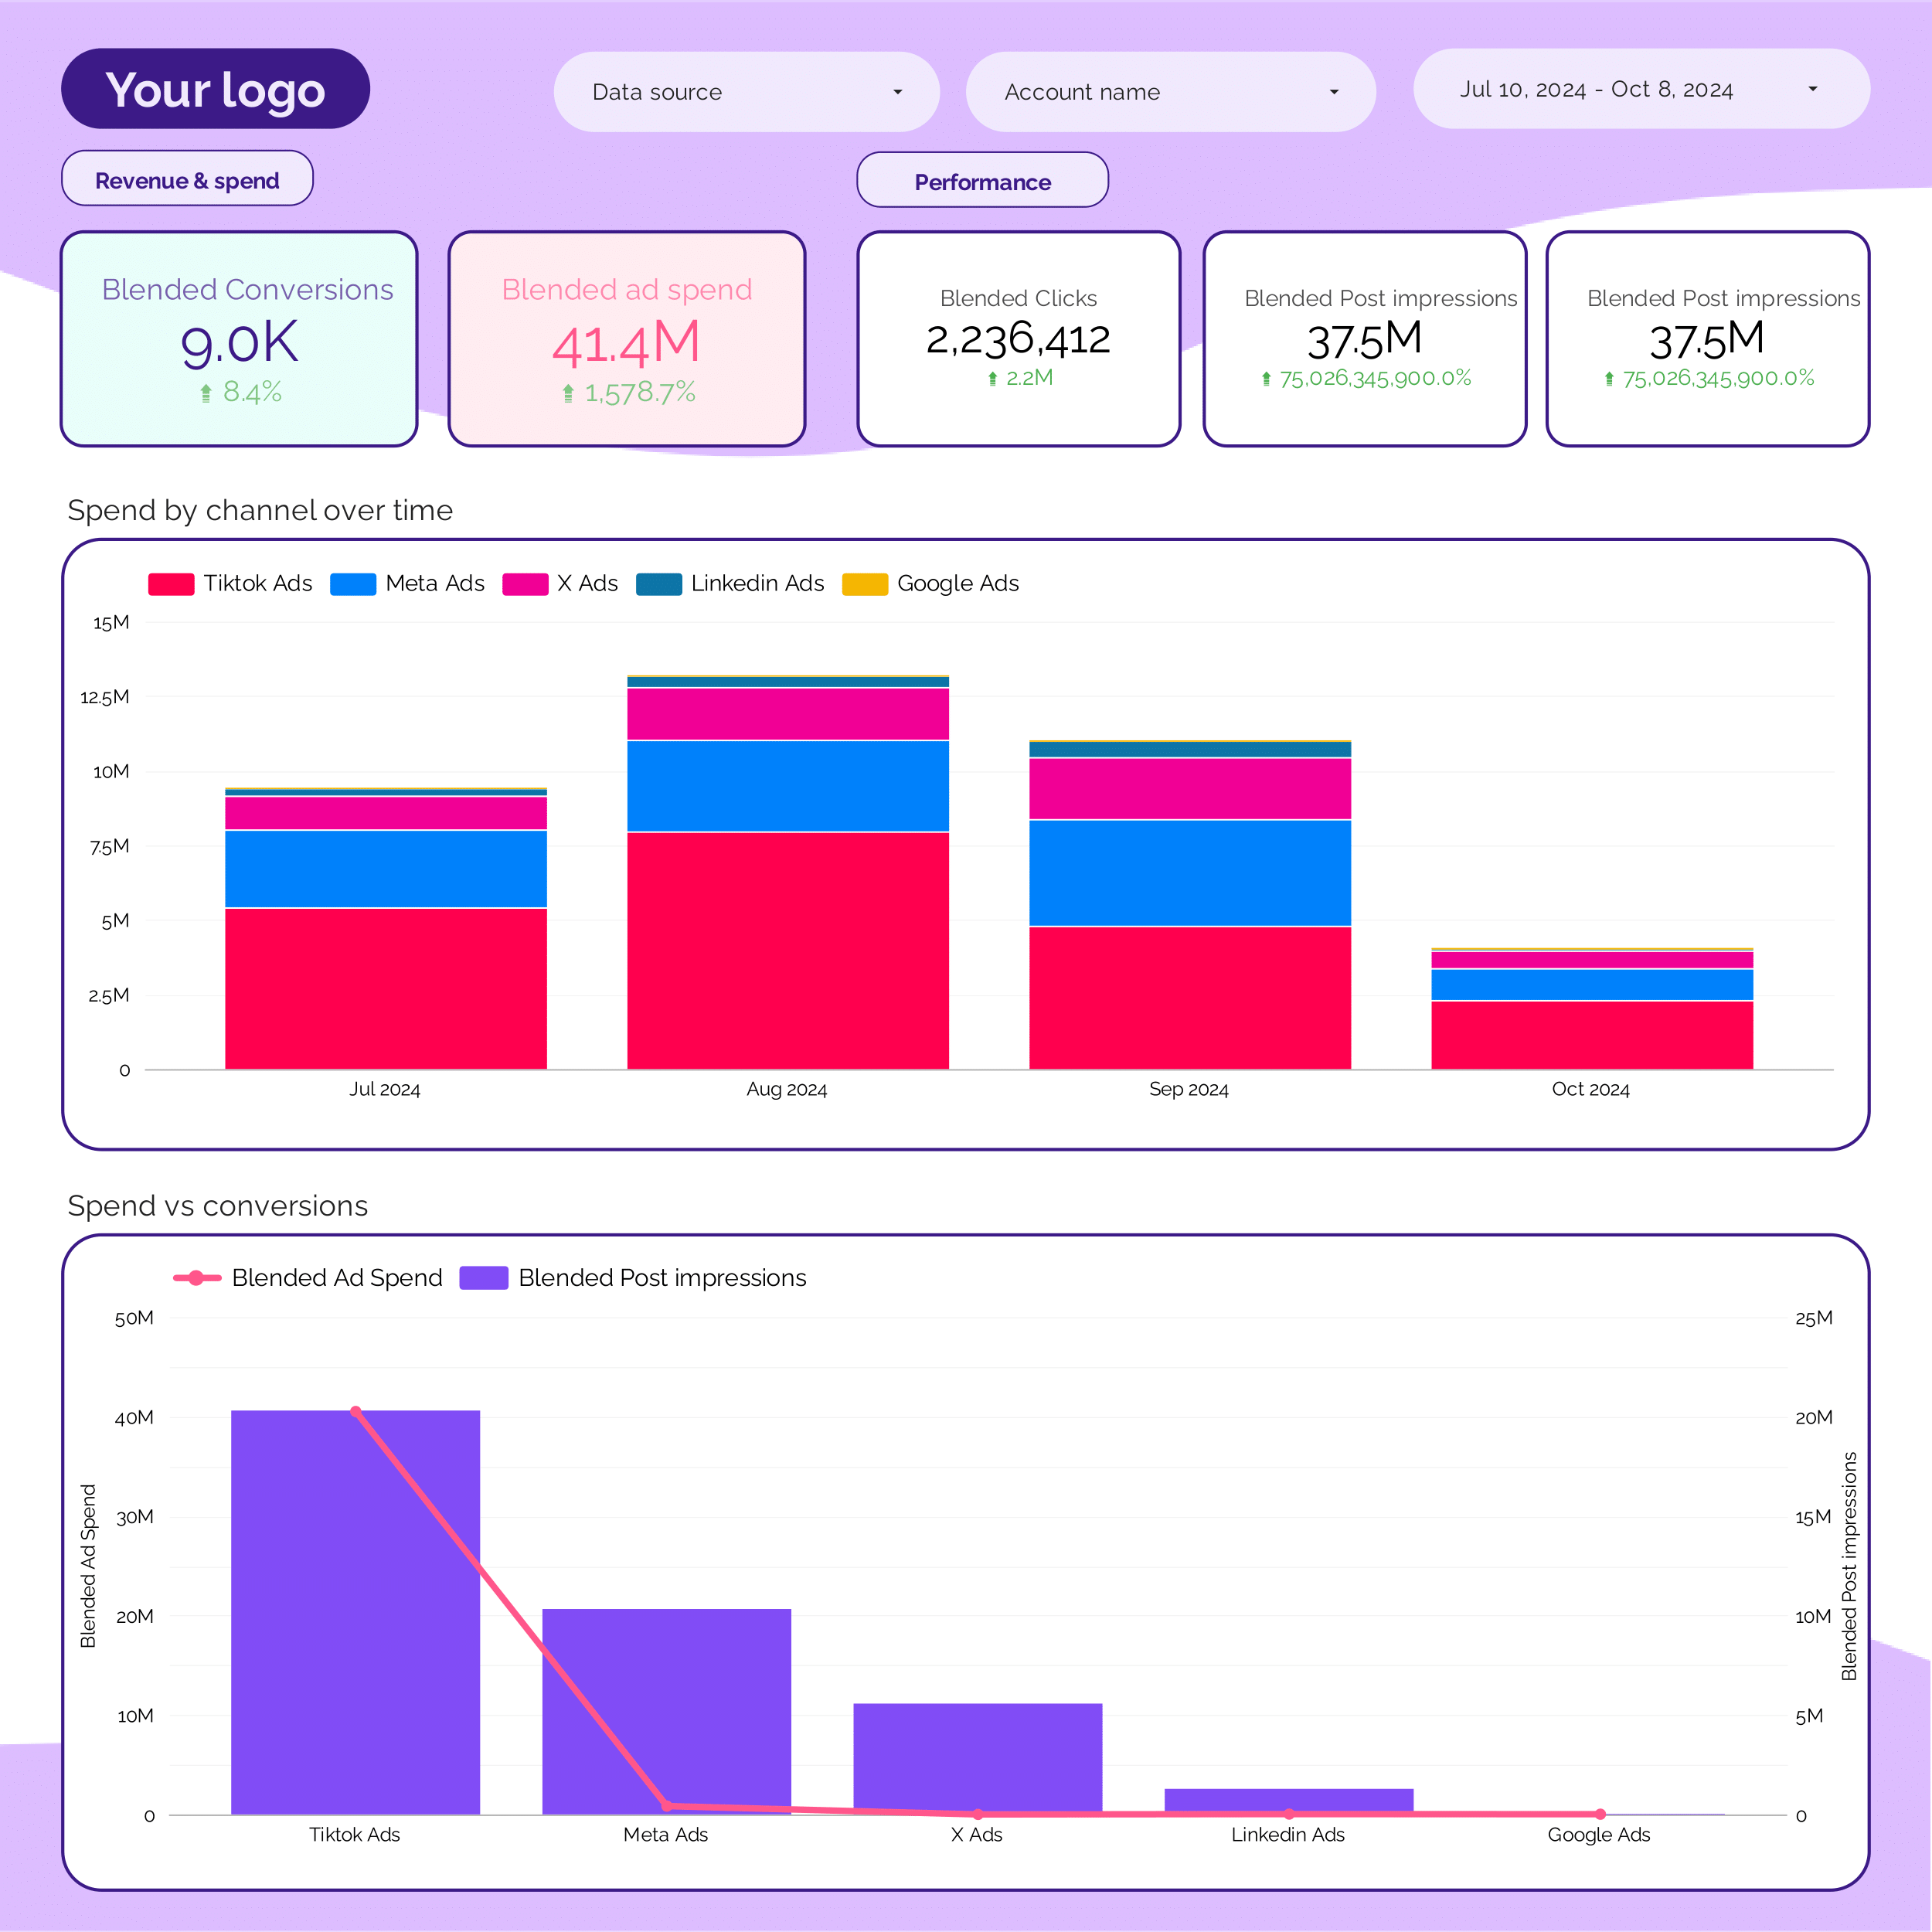
Data manager reports
Manager reports have cross-system views with drill-downs to see performance by department, project, region, team member, and data source. They help align teams, define strategies, and include:
- Cross-system reporting: overall data flow, project, department, or region reporting across systems.
- Goal tracking: compare current performance vs objectives.
- Data audits for prioritization and spotting issues
- Benchmarking for performance and efficiency mapping.
- Data source and integration analysis
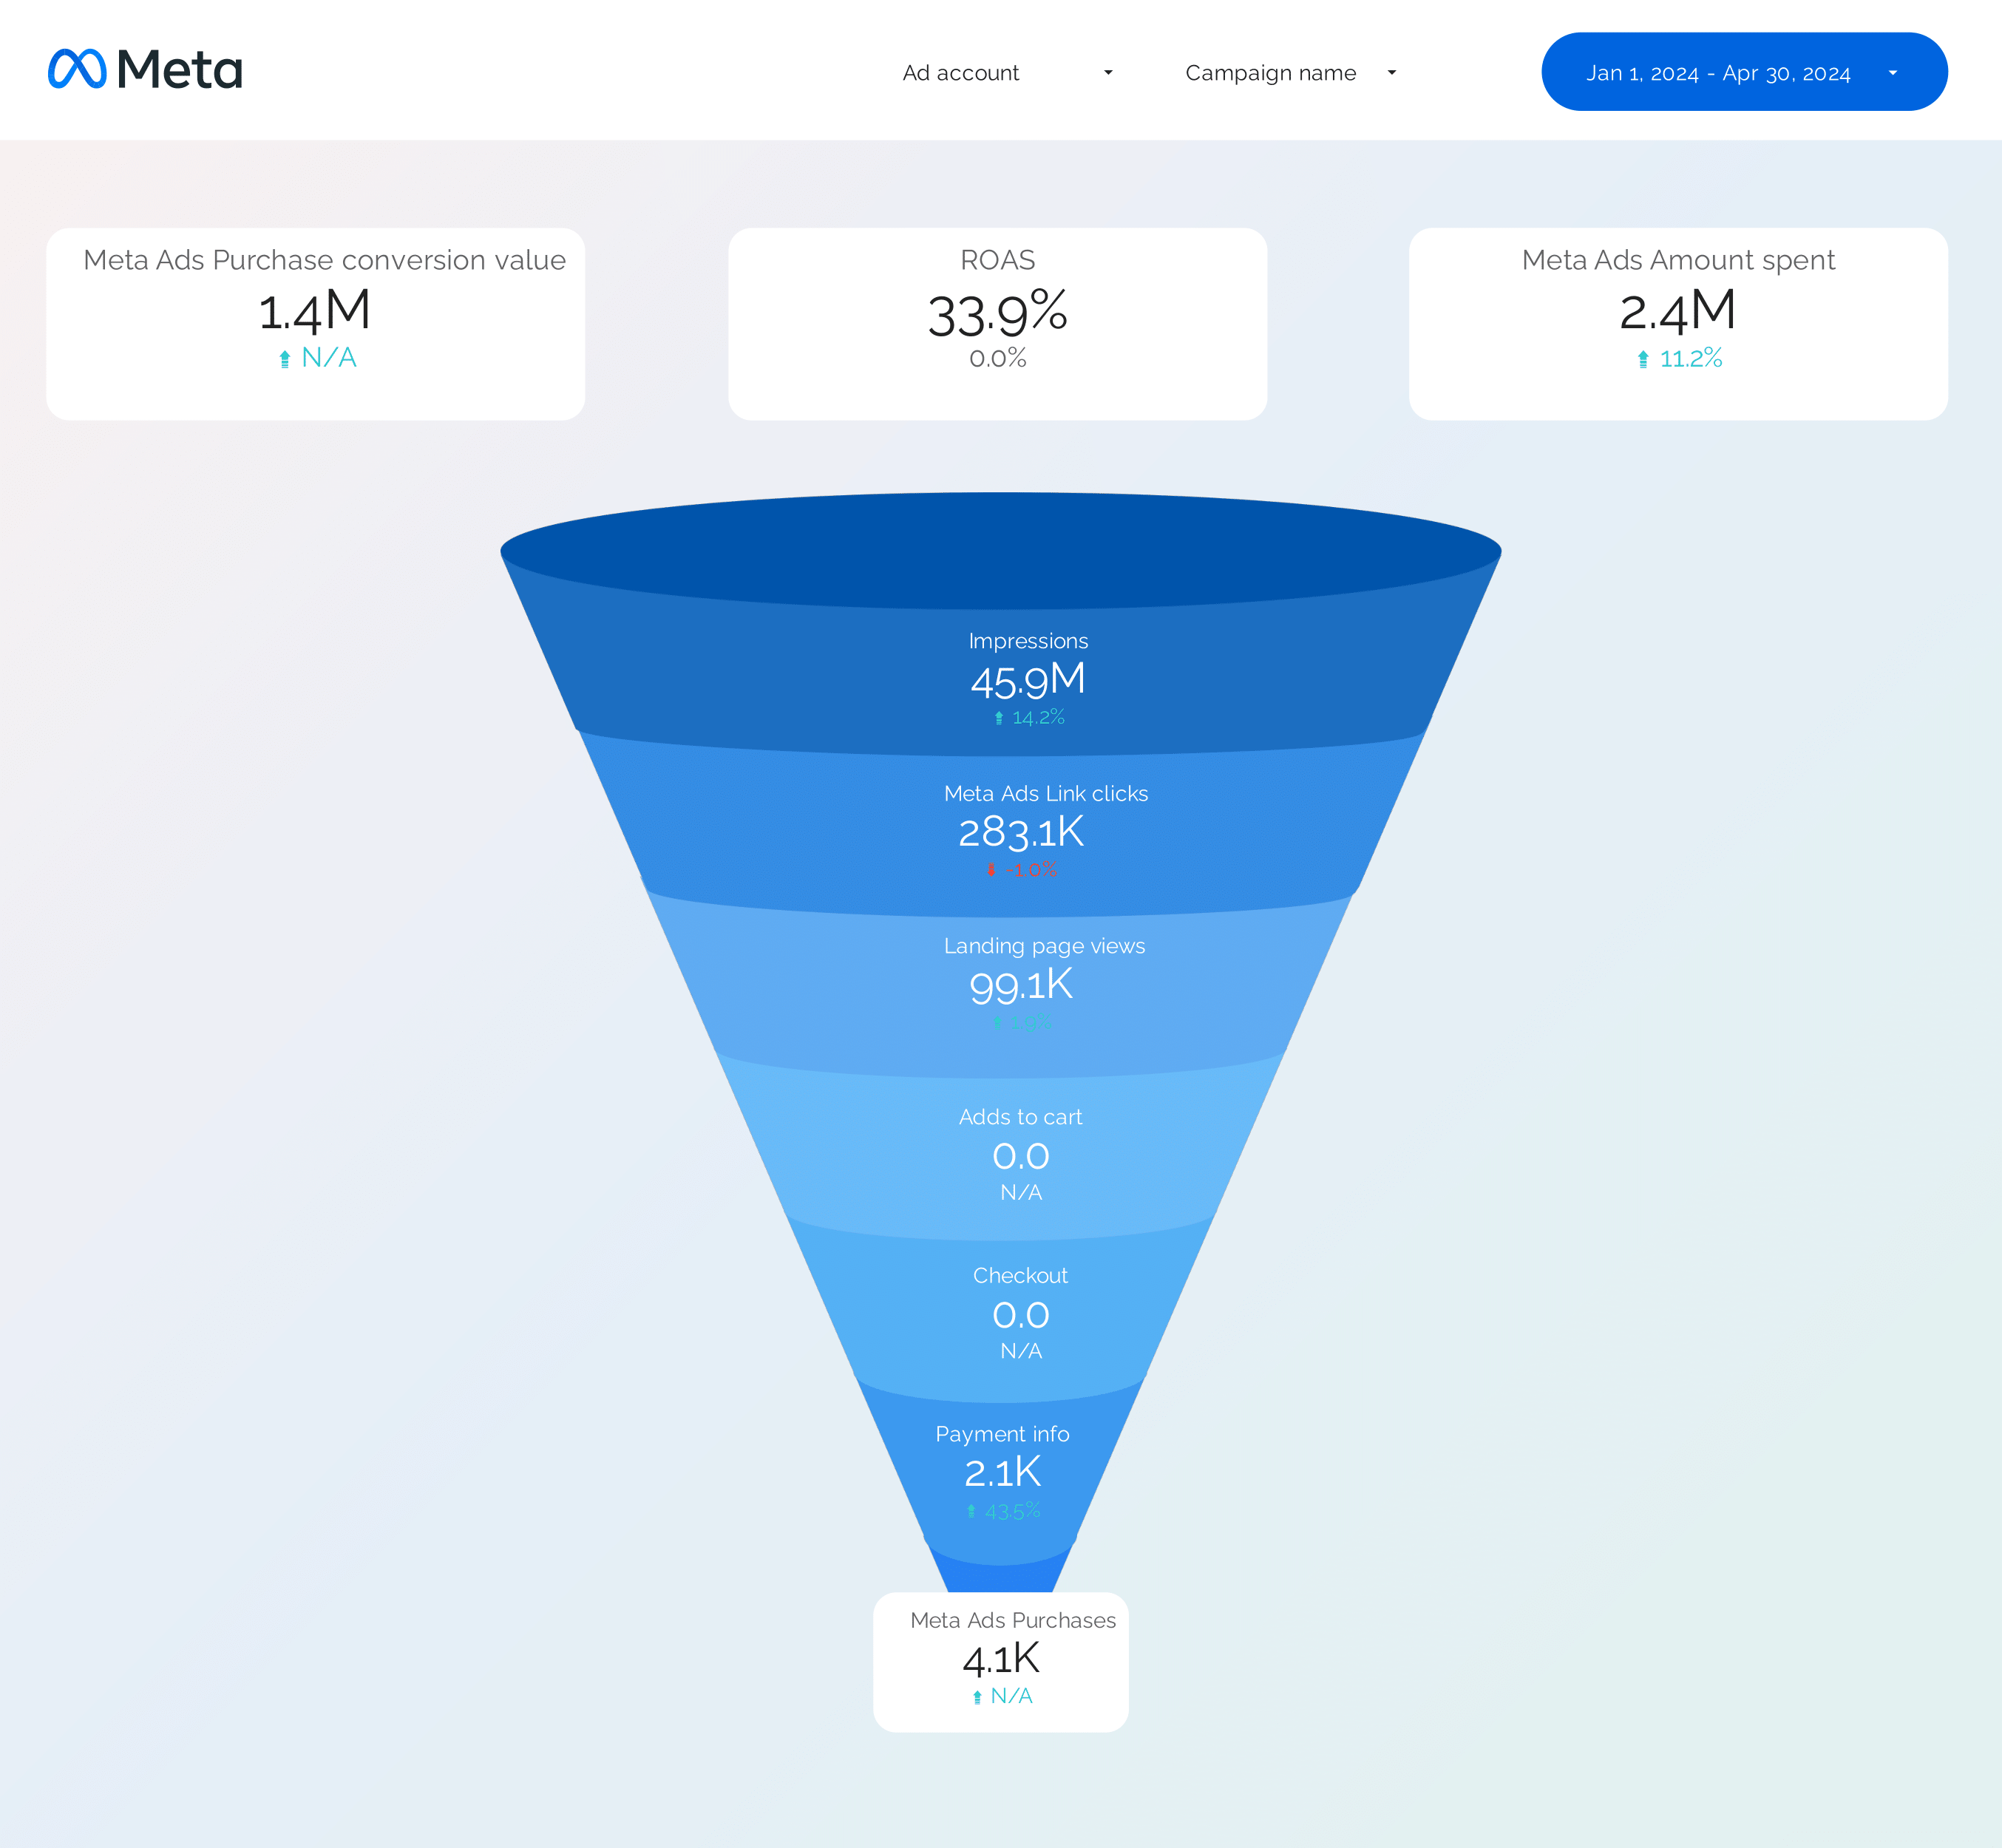
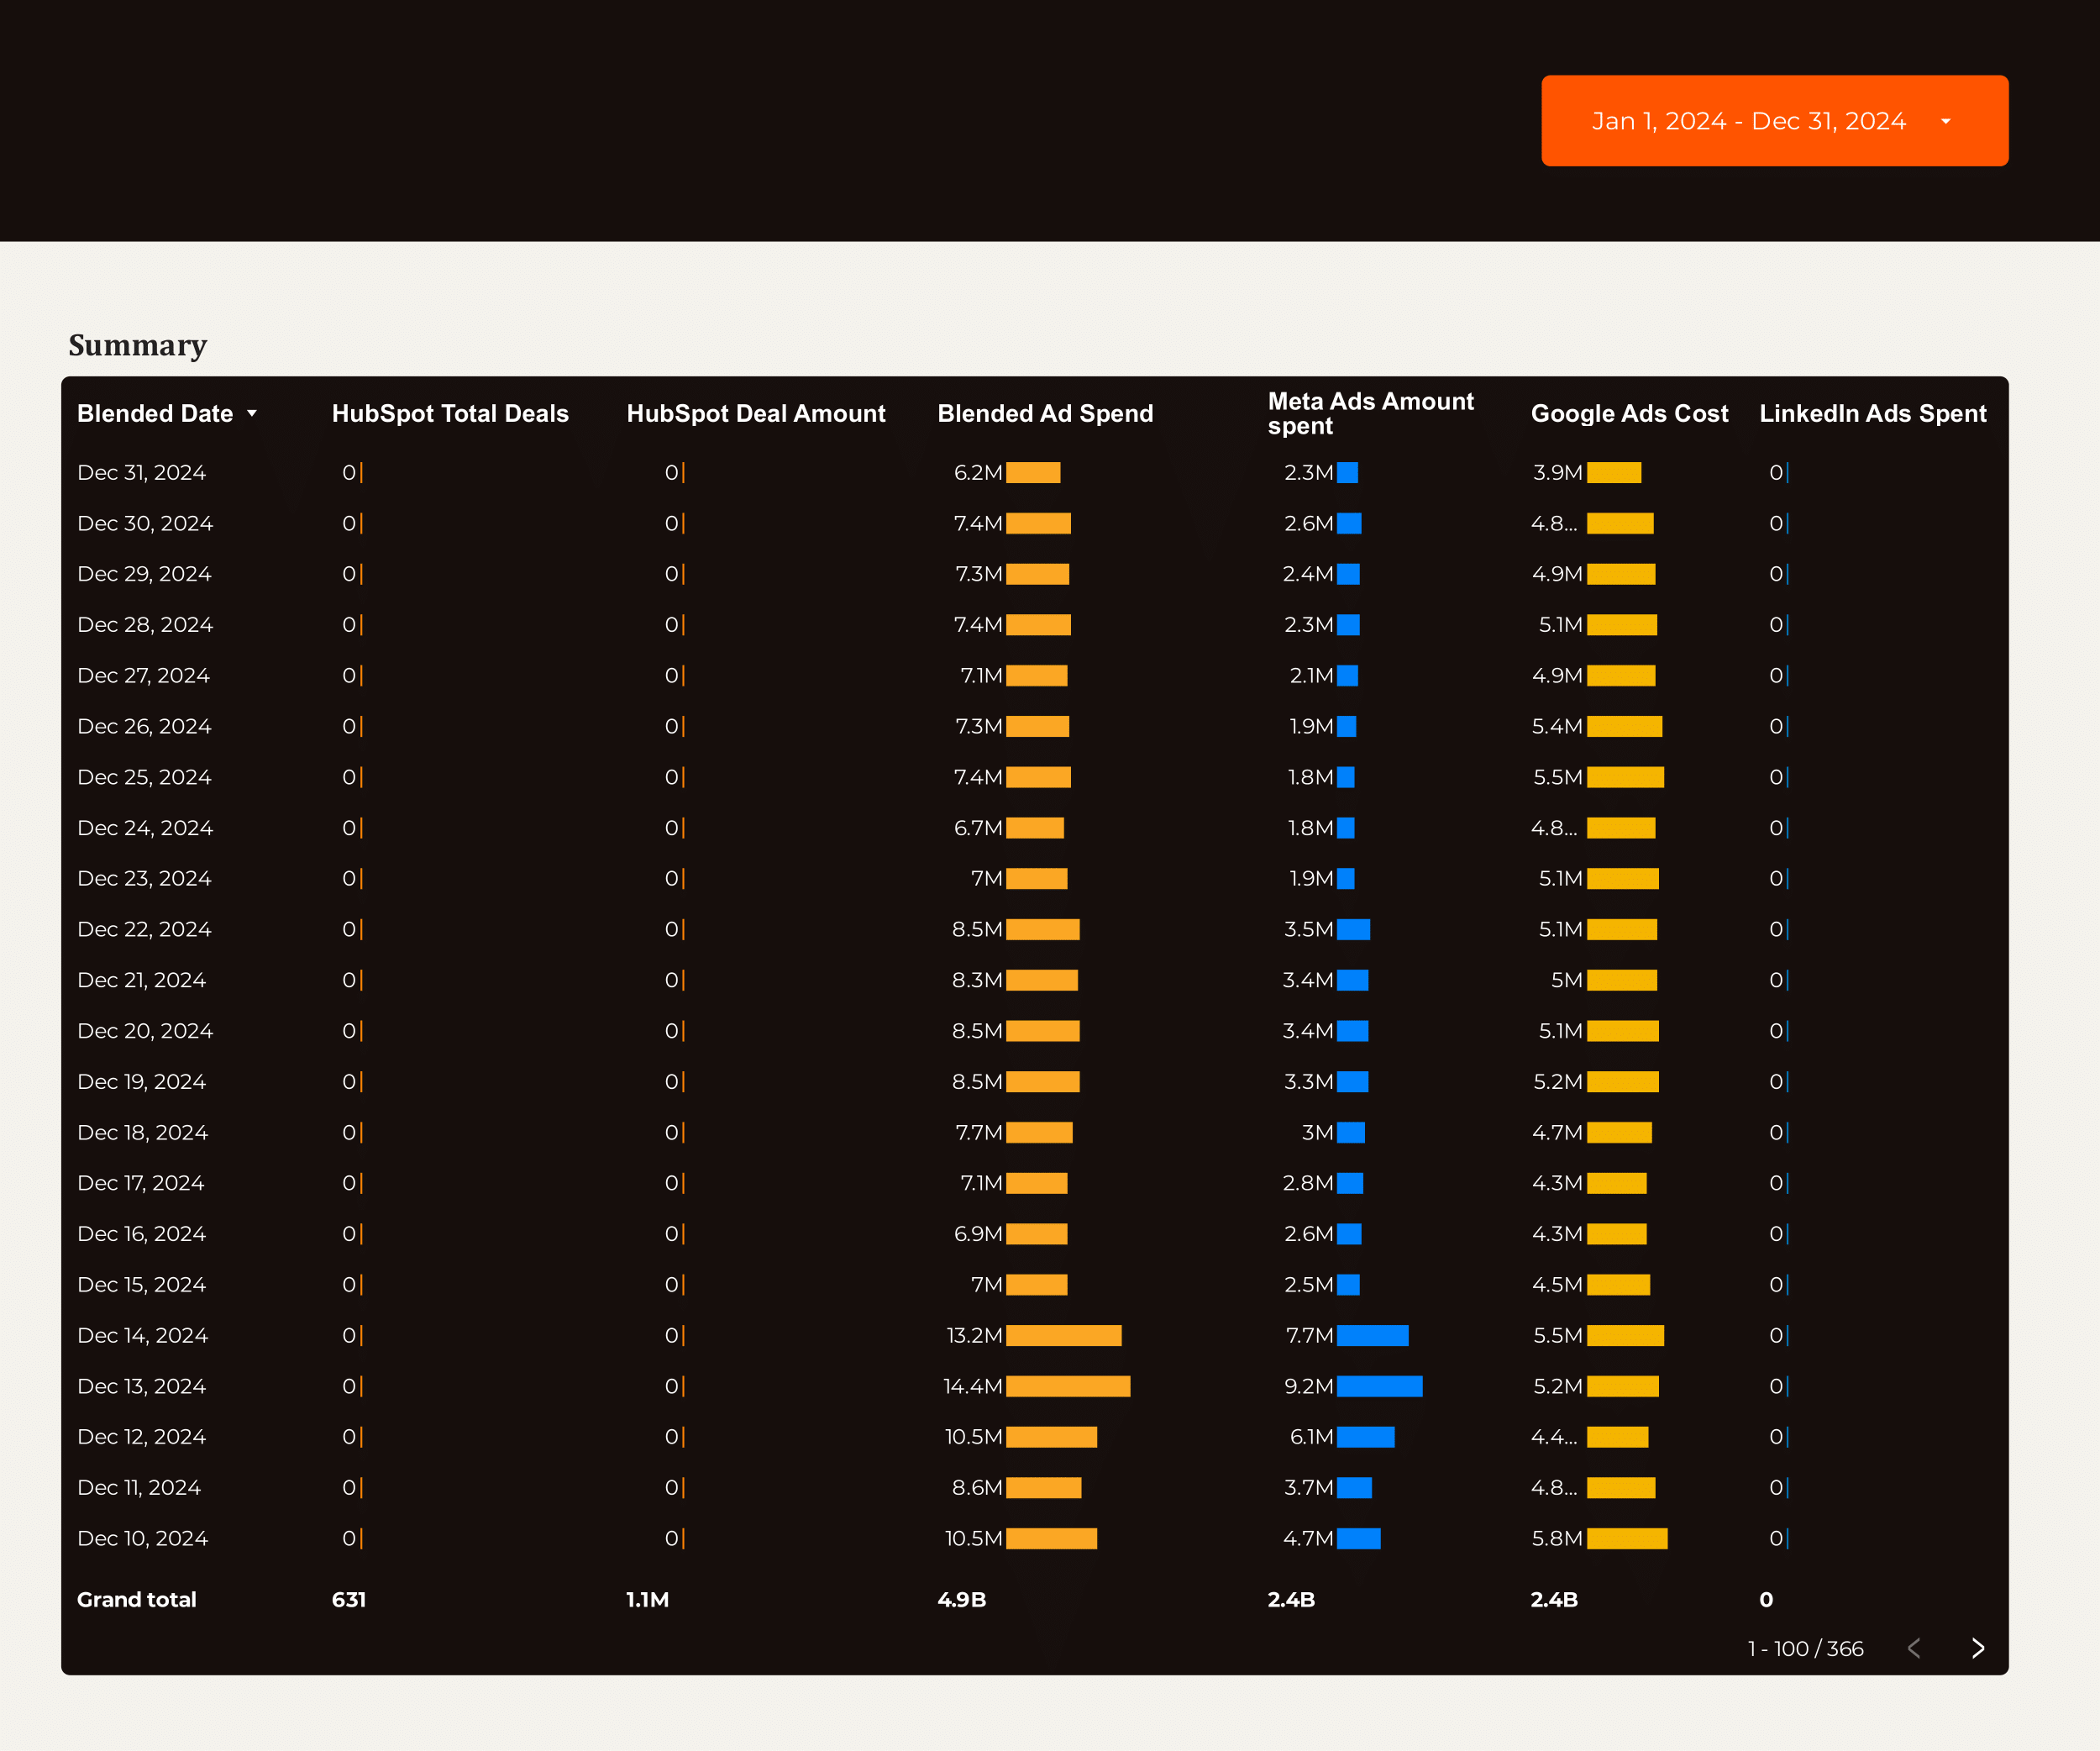
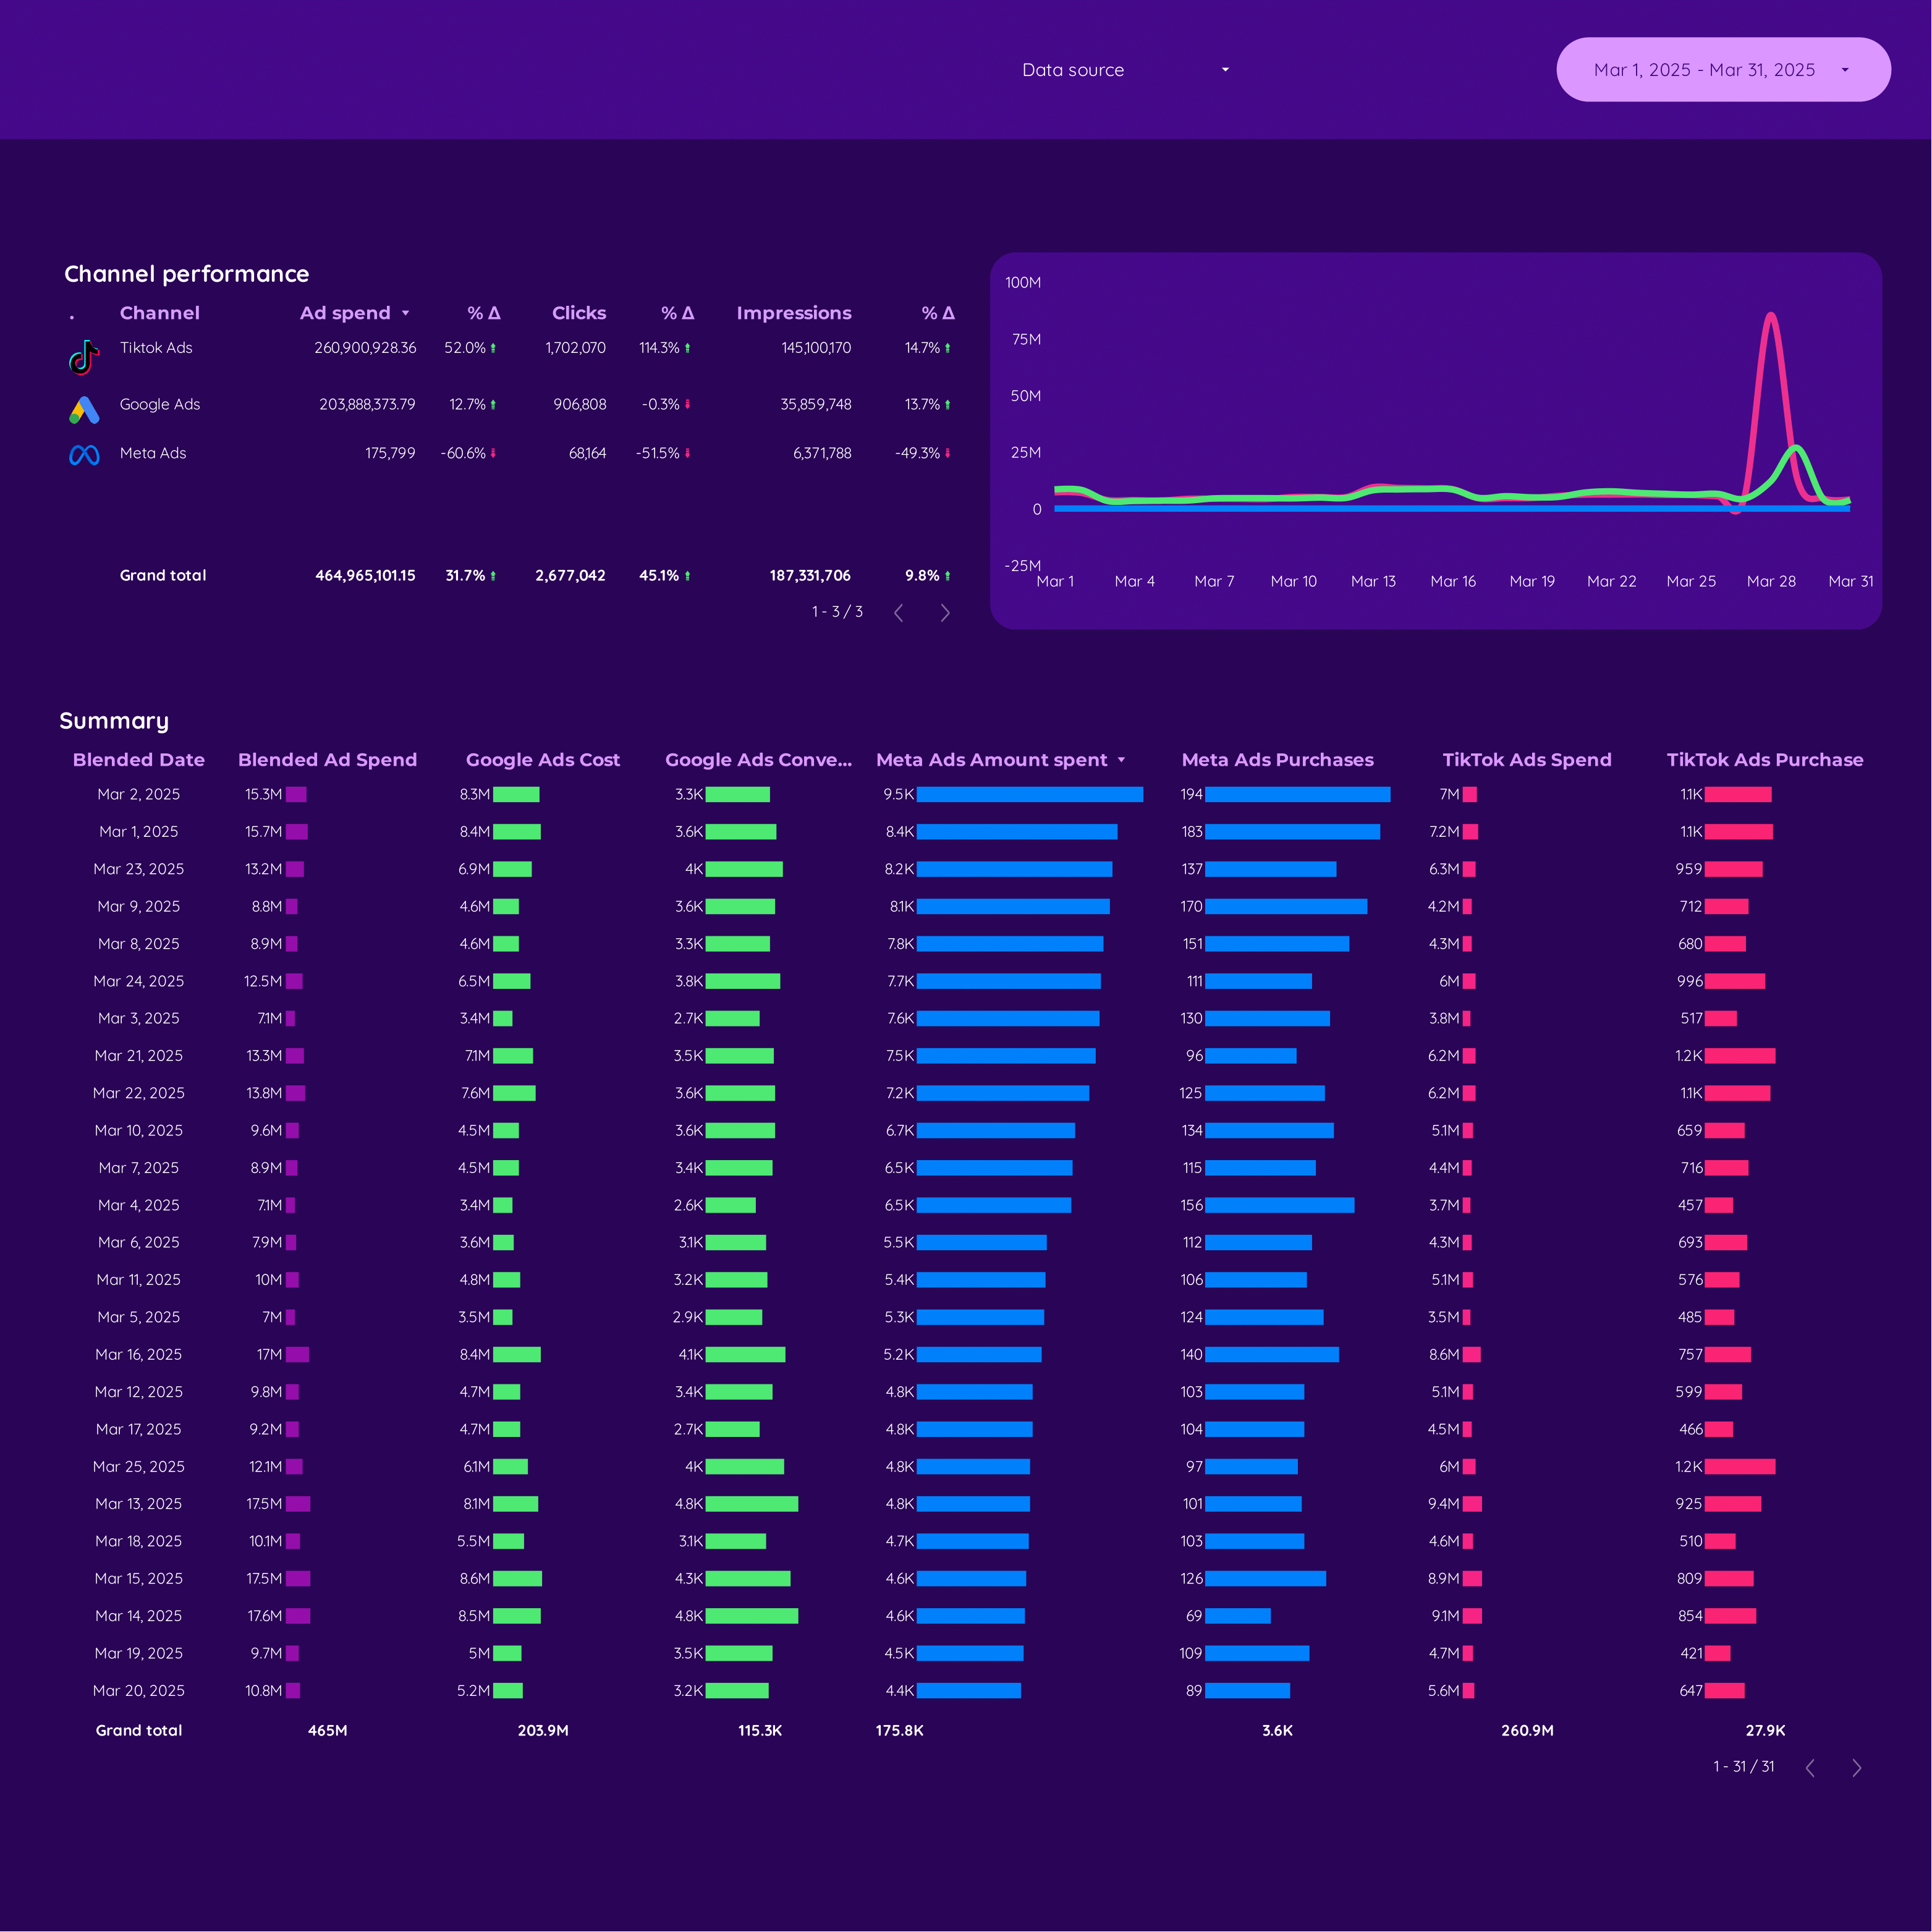
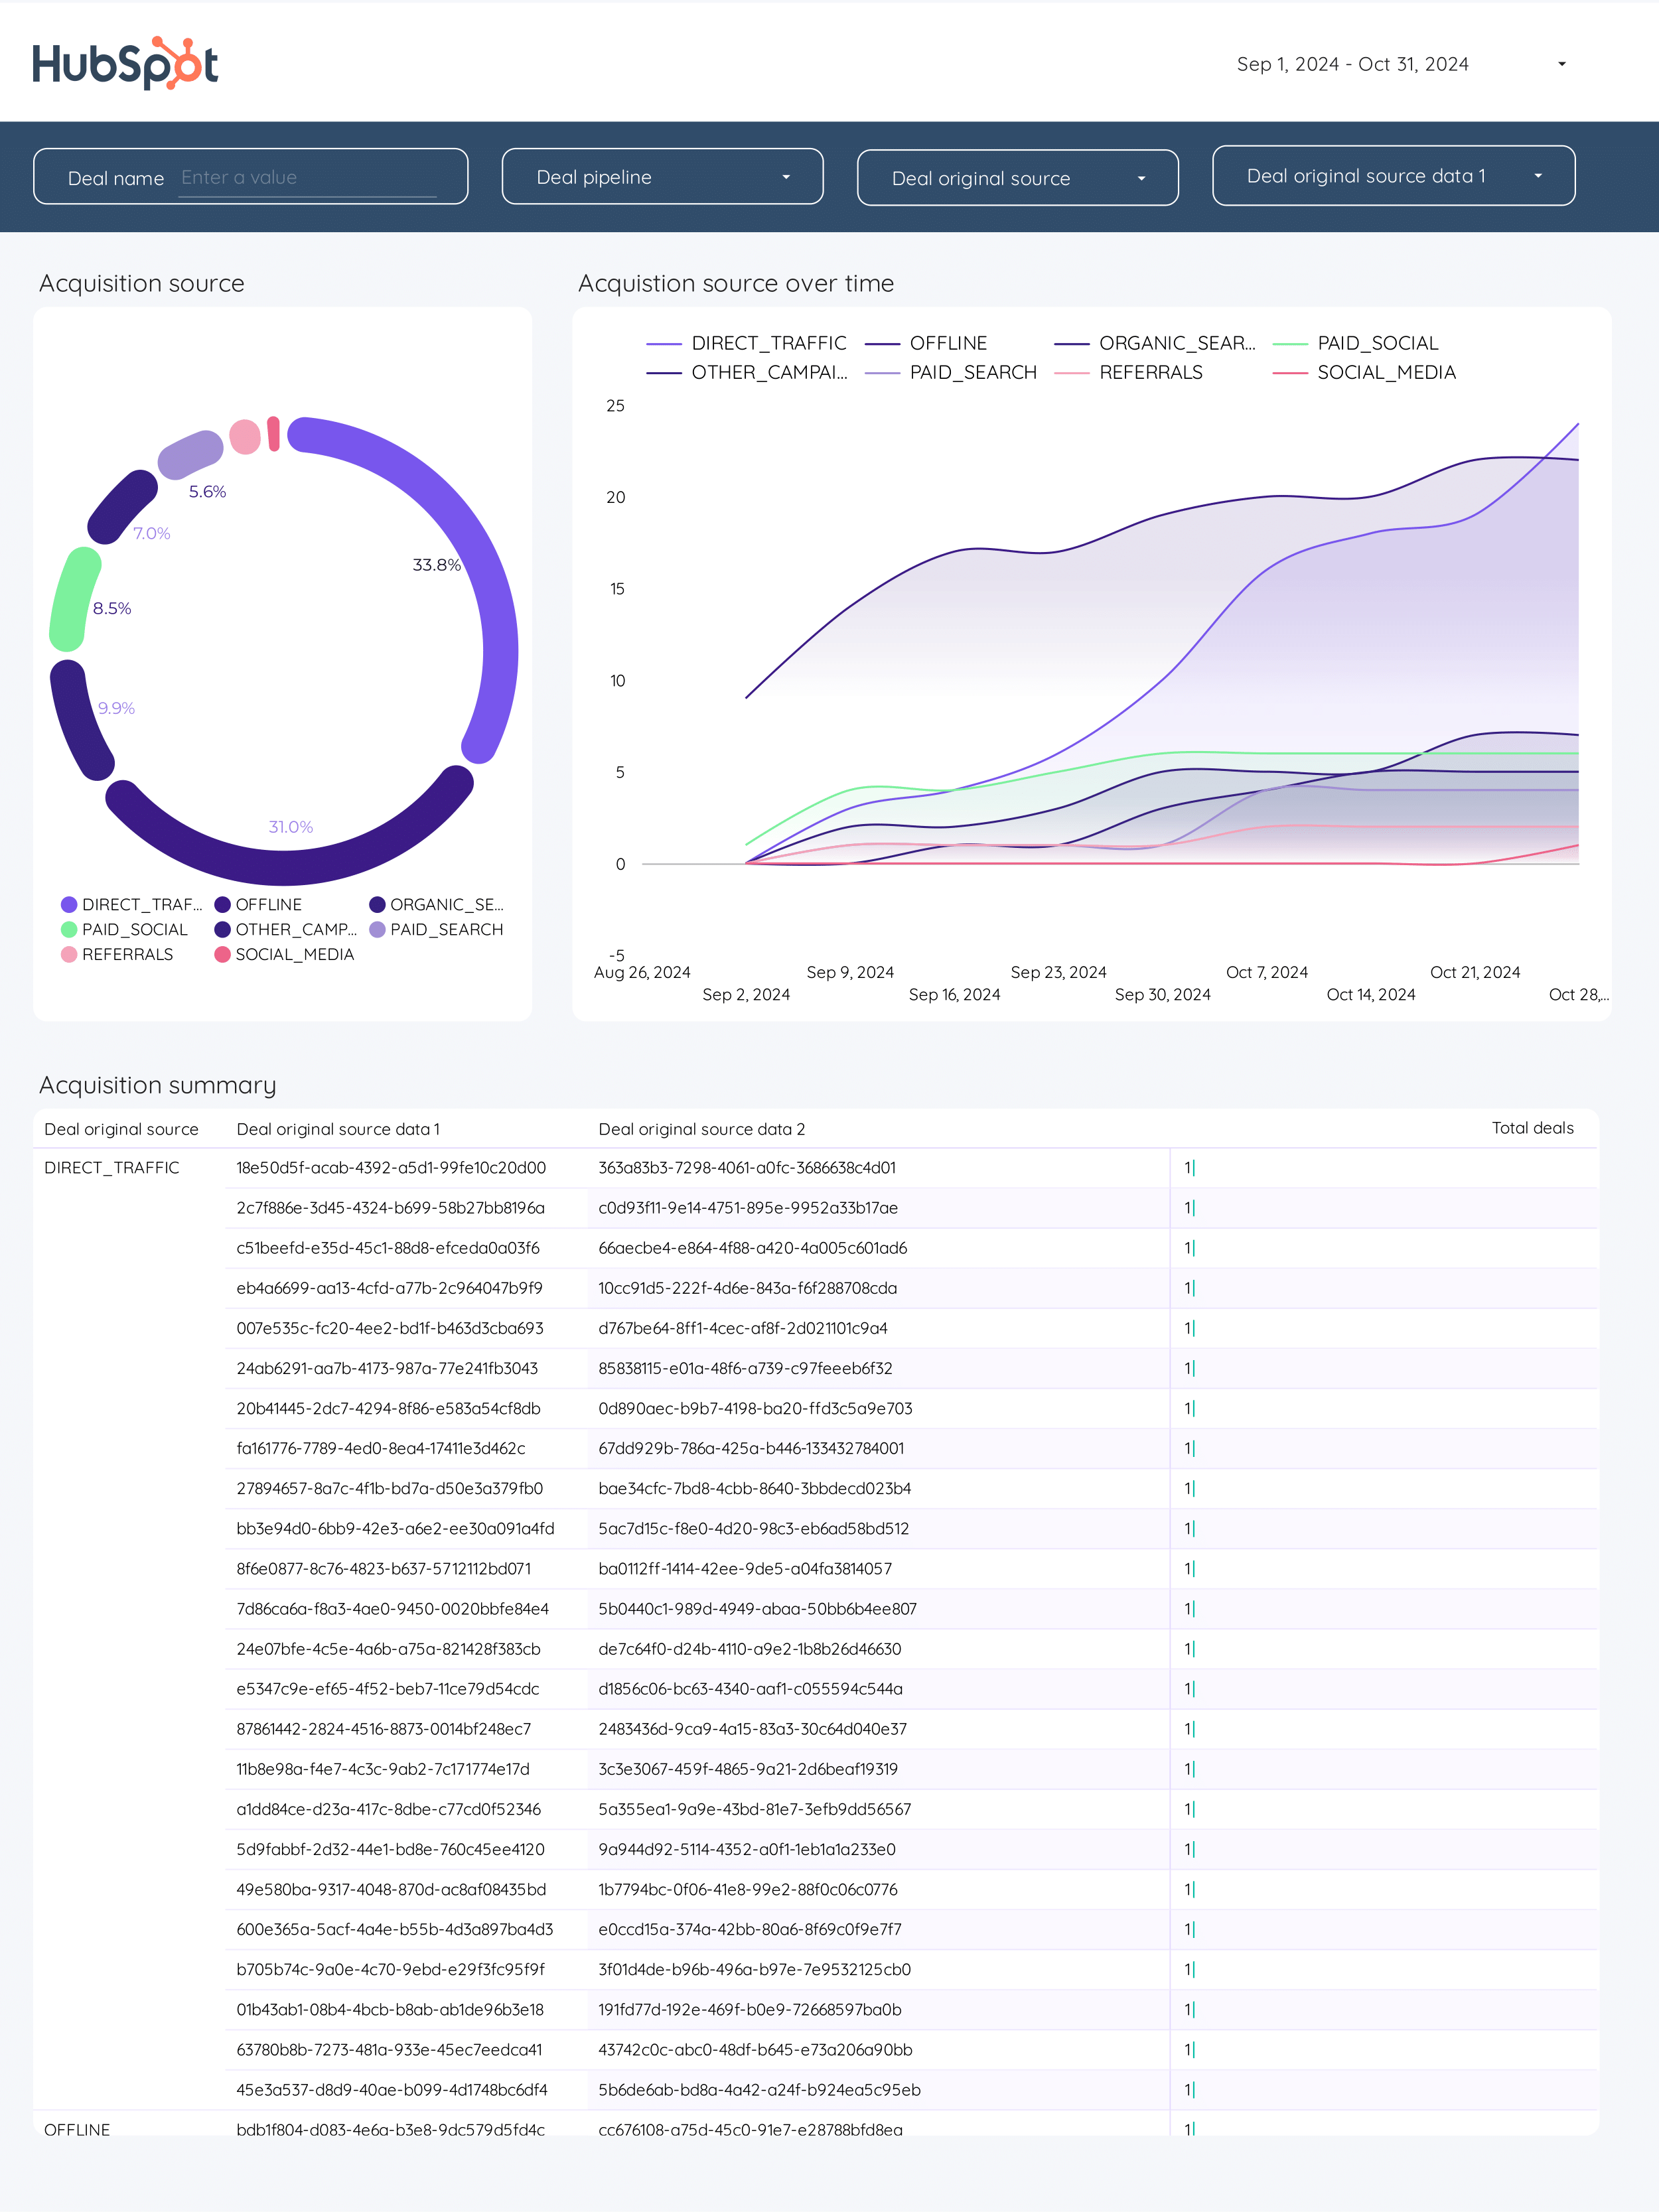
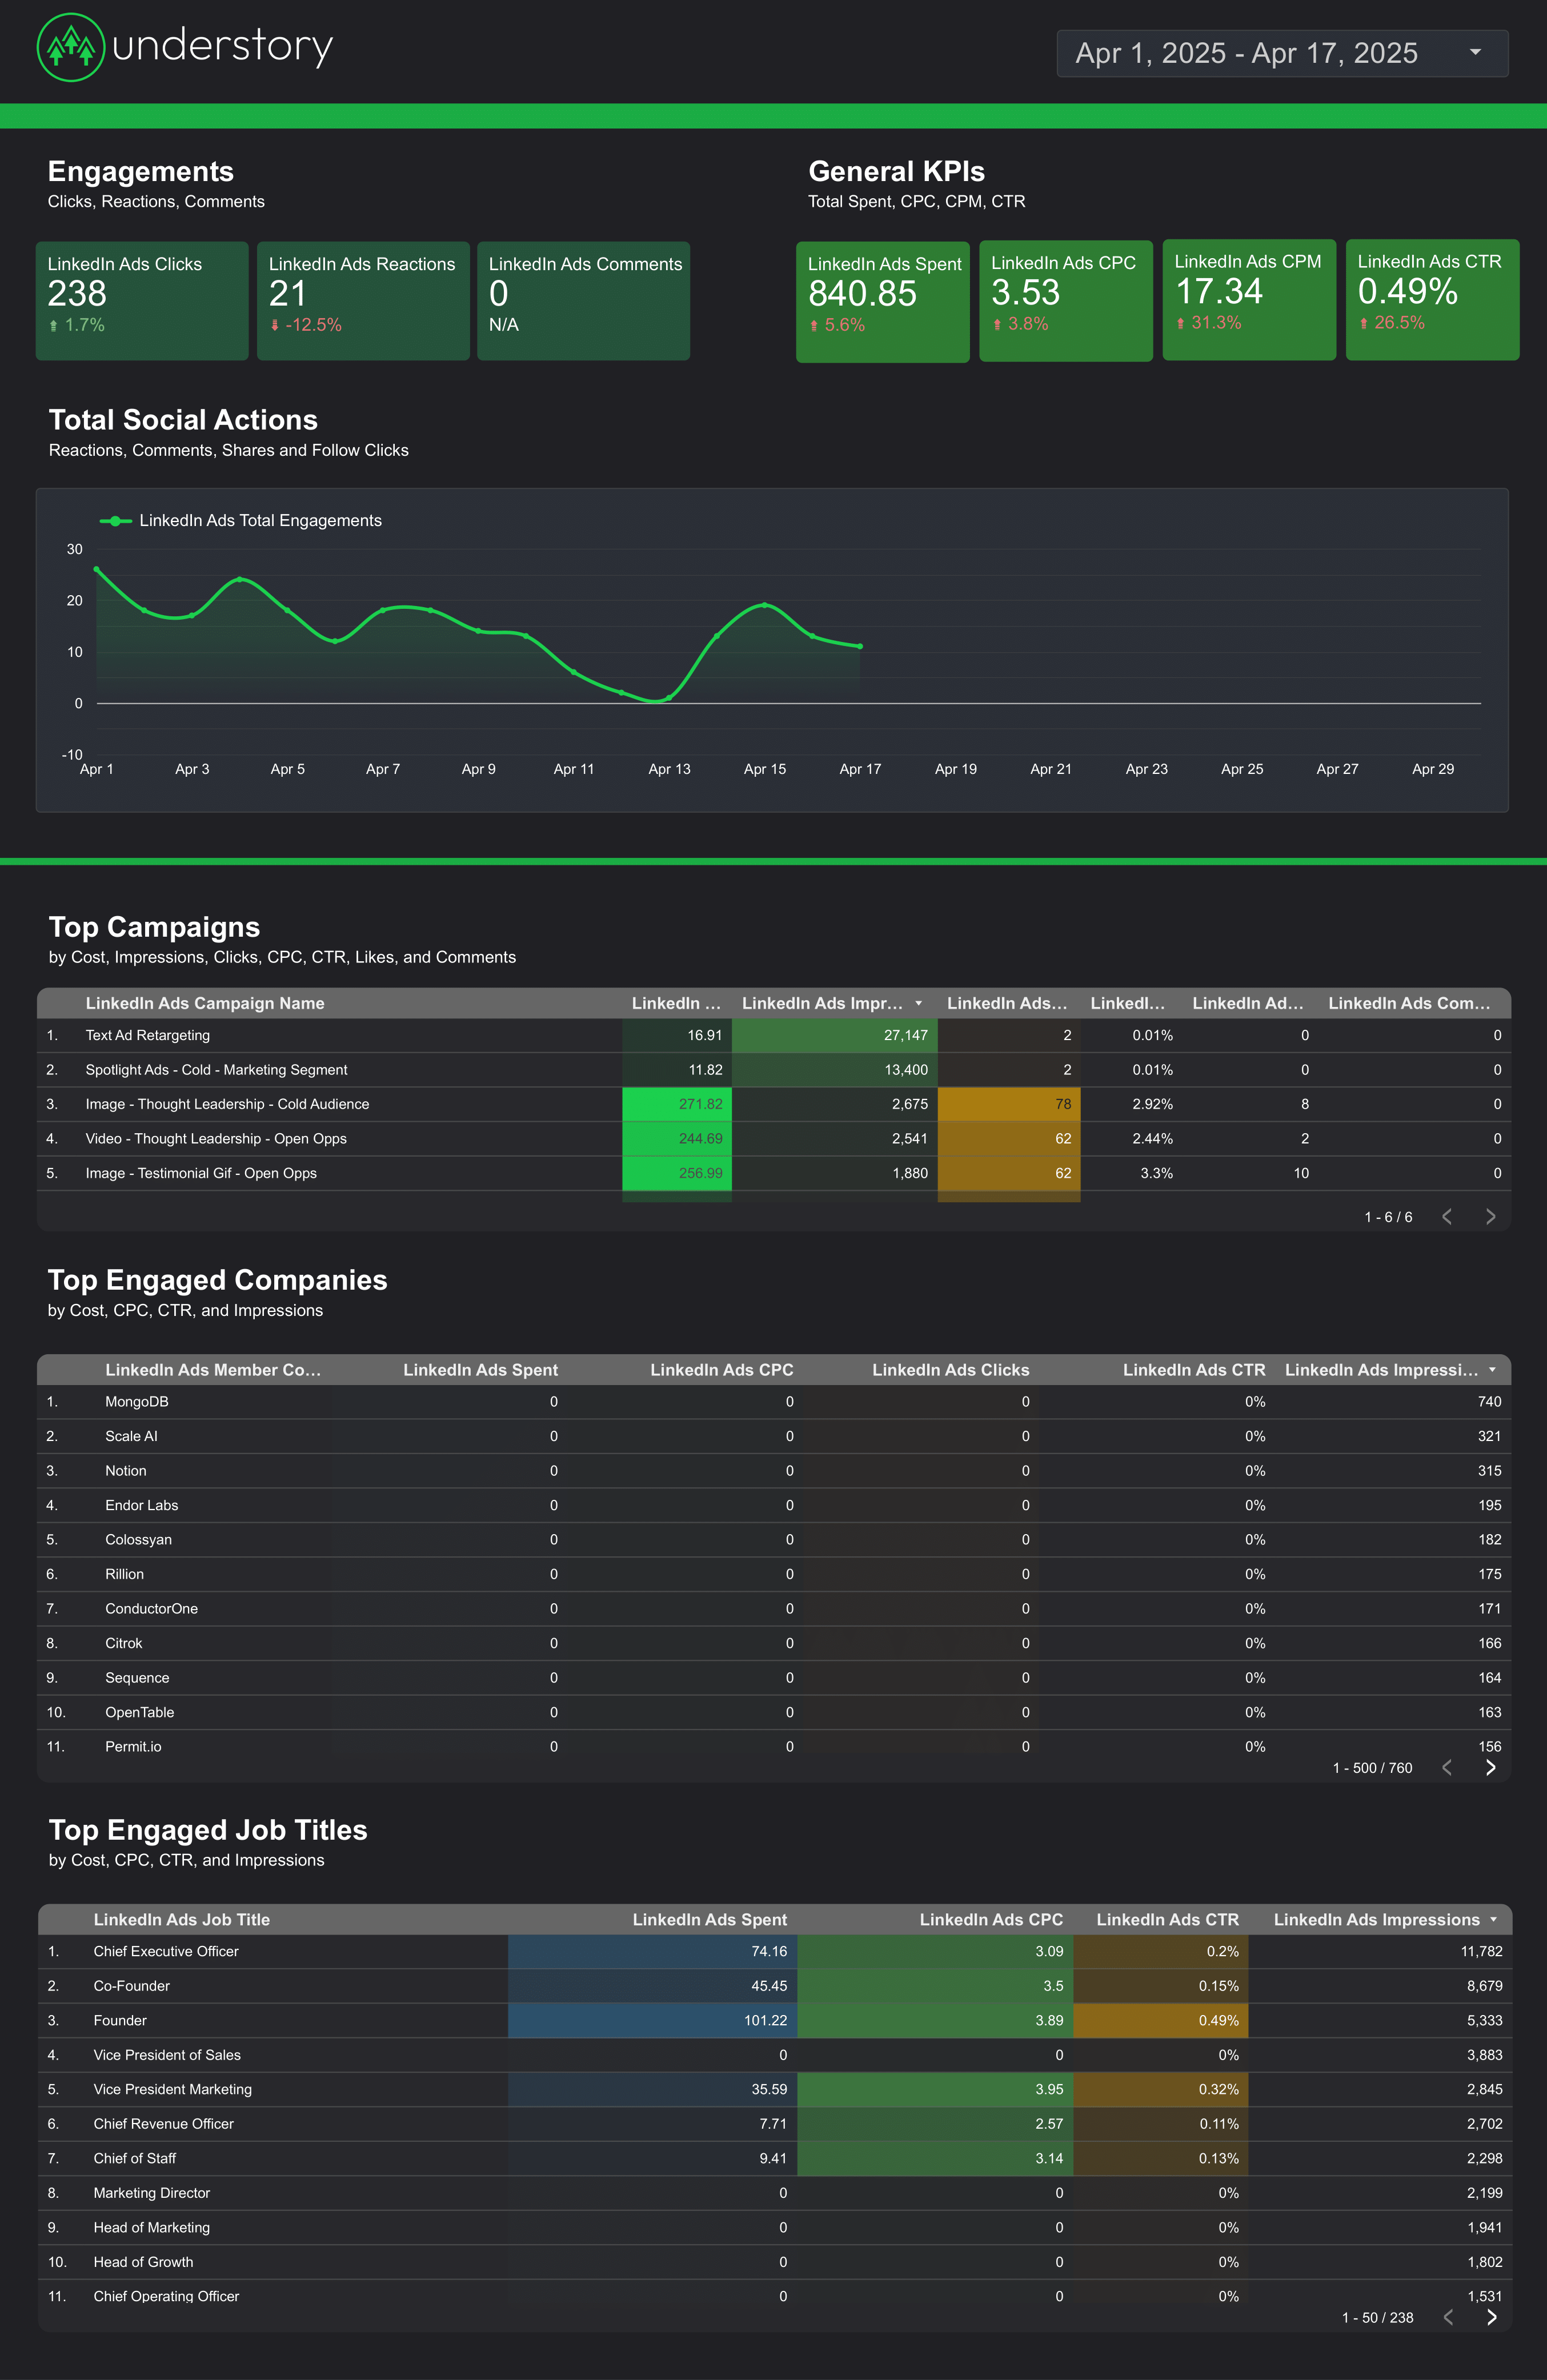
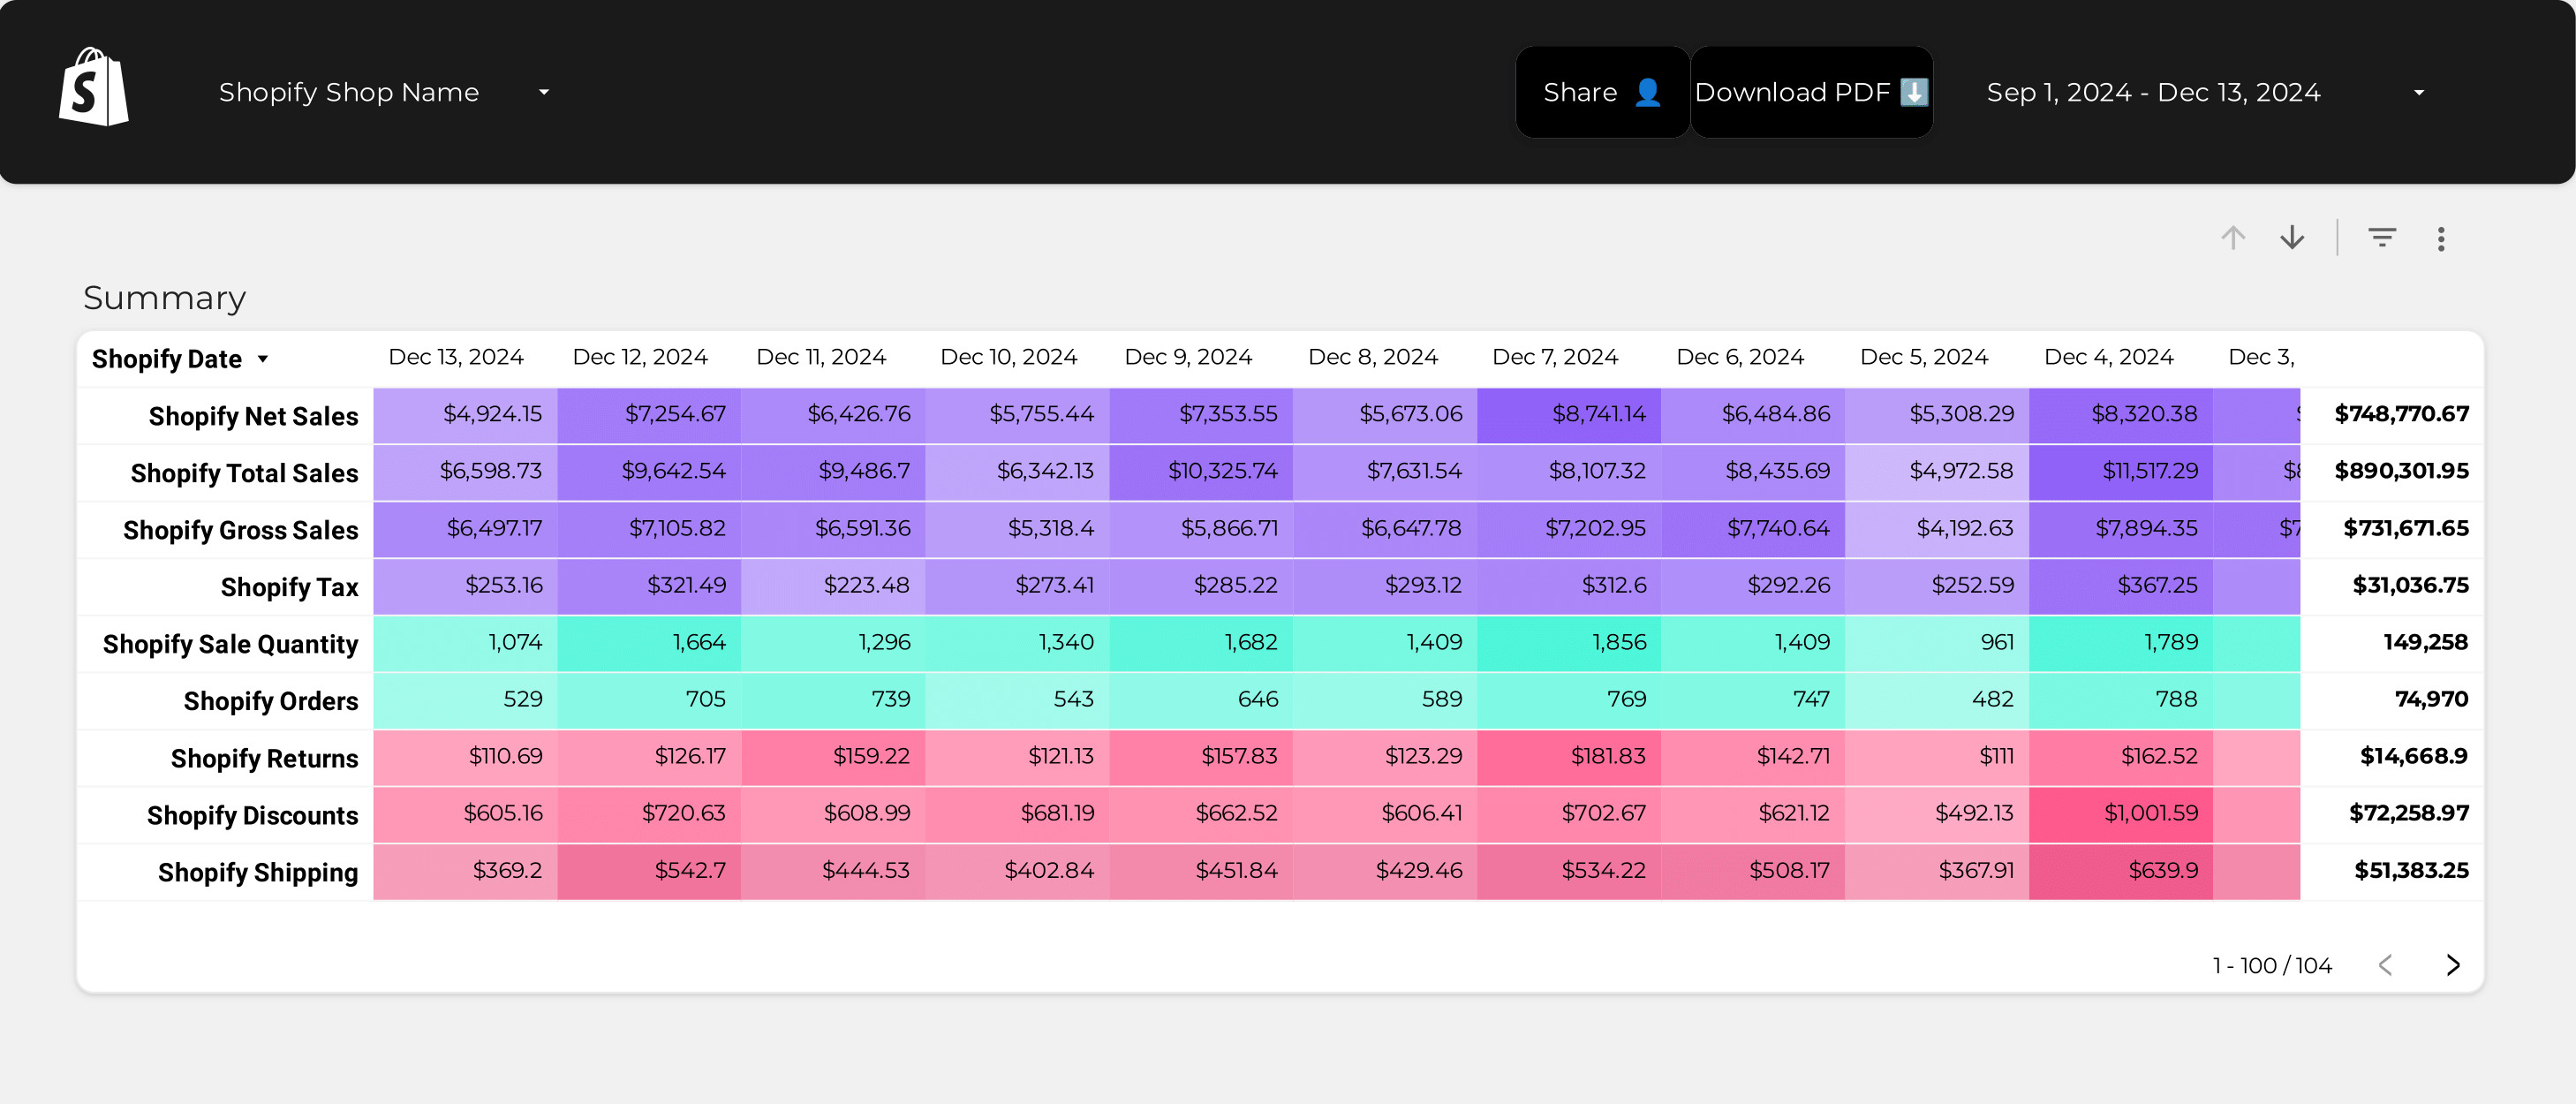
Operational Data Analytics Reports
Operational reports for analysts and data engineers have granular, customizable KPIs to solve technical issues. Monitored hourly, daily, or weekly, they cover:
- Data processing: ETL performance, data pipeline efficiency, error rates.
- System monitoring: server load, memory usage, network latency.
- User activity: login rates, session duration, feature usage.
- Data integrity: validation errors, data anomalies, reconciliation issues.
Operational data analytics reports are highly customized, built in flexible tools like Google Sheets or Looker Studio to enable data cleaning, blending, annotations, and integrating multiple sources.
How to build a data analytics report?
To build a data analytics report, connect your data sources, choose a template on Looker Studio or Sheets, build your queries by selecting metrics and dimensions, choose charts to visualize your data, customize the report, design and share via link, PDF or email.
Here’s the breakdown:
Connect data sources
Define and connect the data sources to bring to your report. Common sources are databases, APIs, CRM systems, and cloud storage for data analytics.
To connect your data sources, go to portermetrics.com, choose the data sources to bring to your report.
You can follow these tutorials on connecting your data:
Choose a template
Choose from dozens of data analytics report templates in Google Sheets or Looker Studio, designed for use cases like data monitoring, performance tracking, and user engagement analysis.
Learn to copy Looker Studio templates.
While templates are the starting point. Make them specific for your business or agency. Map your specific metrics, especially custom data points, CRM data, and all the fields and metrics that you define as "key performance indicators" and "outcomes".
Depending on your reporting tool—Google Sheets or Google Looker Studio, pick any of the dozens of templates created by our team and customers to solve your data analytics reporting use cases, such as data monitoring, performance tracking, and user engagement analysis.
Select metrics, dimensions, and charts
Once your report template is downloaded, you may 1)modify it or 2) create a blank page to build it from scratch. Whatever the case, setting up a query always follows these steps:
- Select the data source and the account connected to it
- Choose metrics (e.g., data accuracy, processing time, user engagement, etc.).
- Choose breakdowns to segment your data (e.g., by date, department, data source, etc.)
You can follow these tutorials on adding data to your reports
Design
To make your data analytics reports truly white-label you can add logos, colors, fonts, and styling to mirror your brand.
Follow these tutorials to design your data analytics reports:
Share
Share your data analytics reports via links, PDF, schedule emails, and control permissions.
KPIs to include in a data analytics report?
Data analytics reports should include a mix of data quality, performance, user engagement, and cost metrics and KPIs to fully understand the performance of data systems towards business goals. They include:
Data quality KPIs measure the integrity and reliability of data:
- Accuracy metrics: error rates, validation success, data consistency
- Completeness metrics: missing values, data coverage, record counts
- Timeliness metrics: data latency, update frequency, processing time
Performance KPIs compare your data processing outputs to the system capabilities, including:
- Processing speed: data throughput, ETL efficiency
- System uptime: availability, downtime incidents
- Resource utilization: CPU, memory, network usage
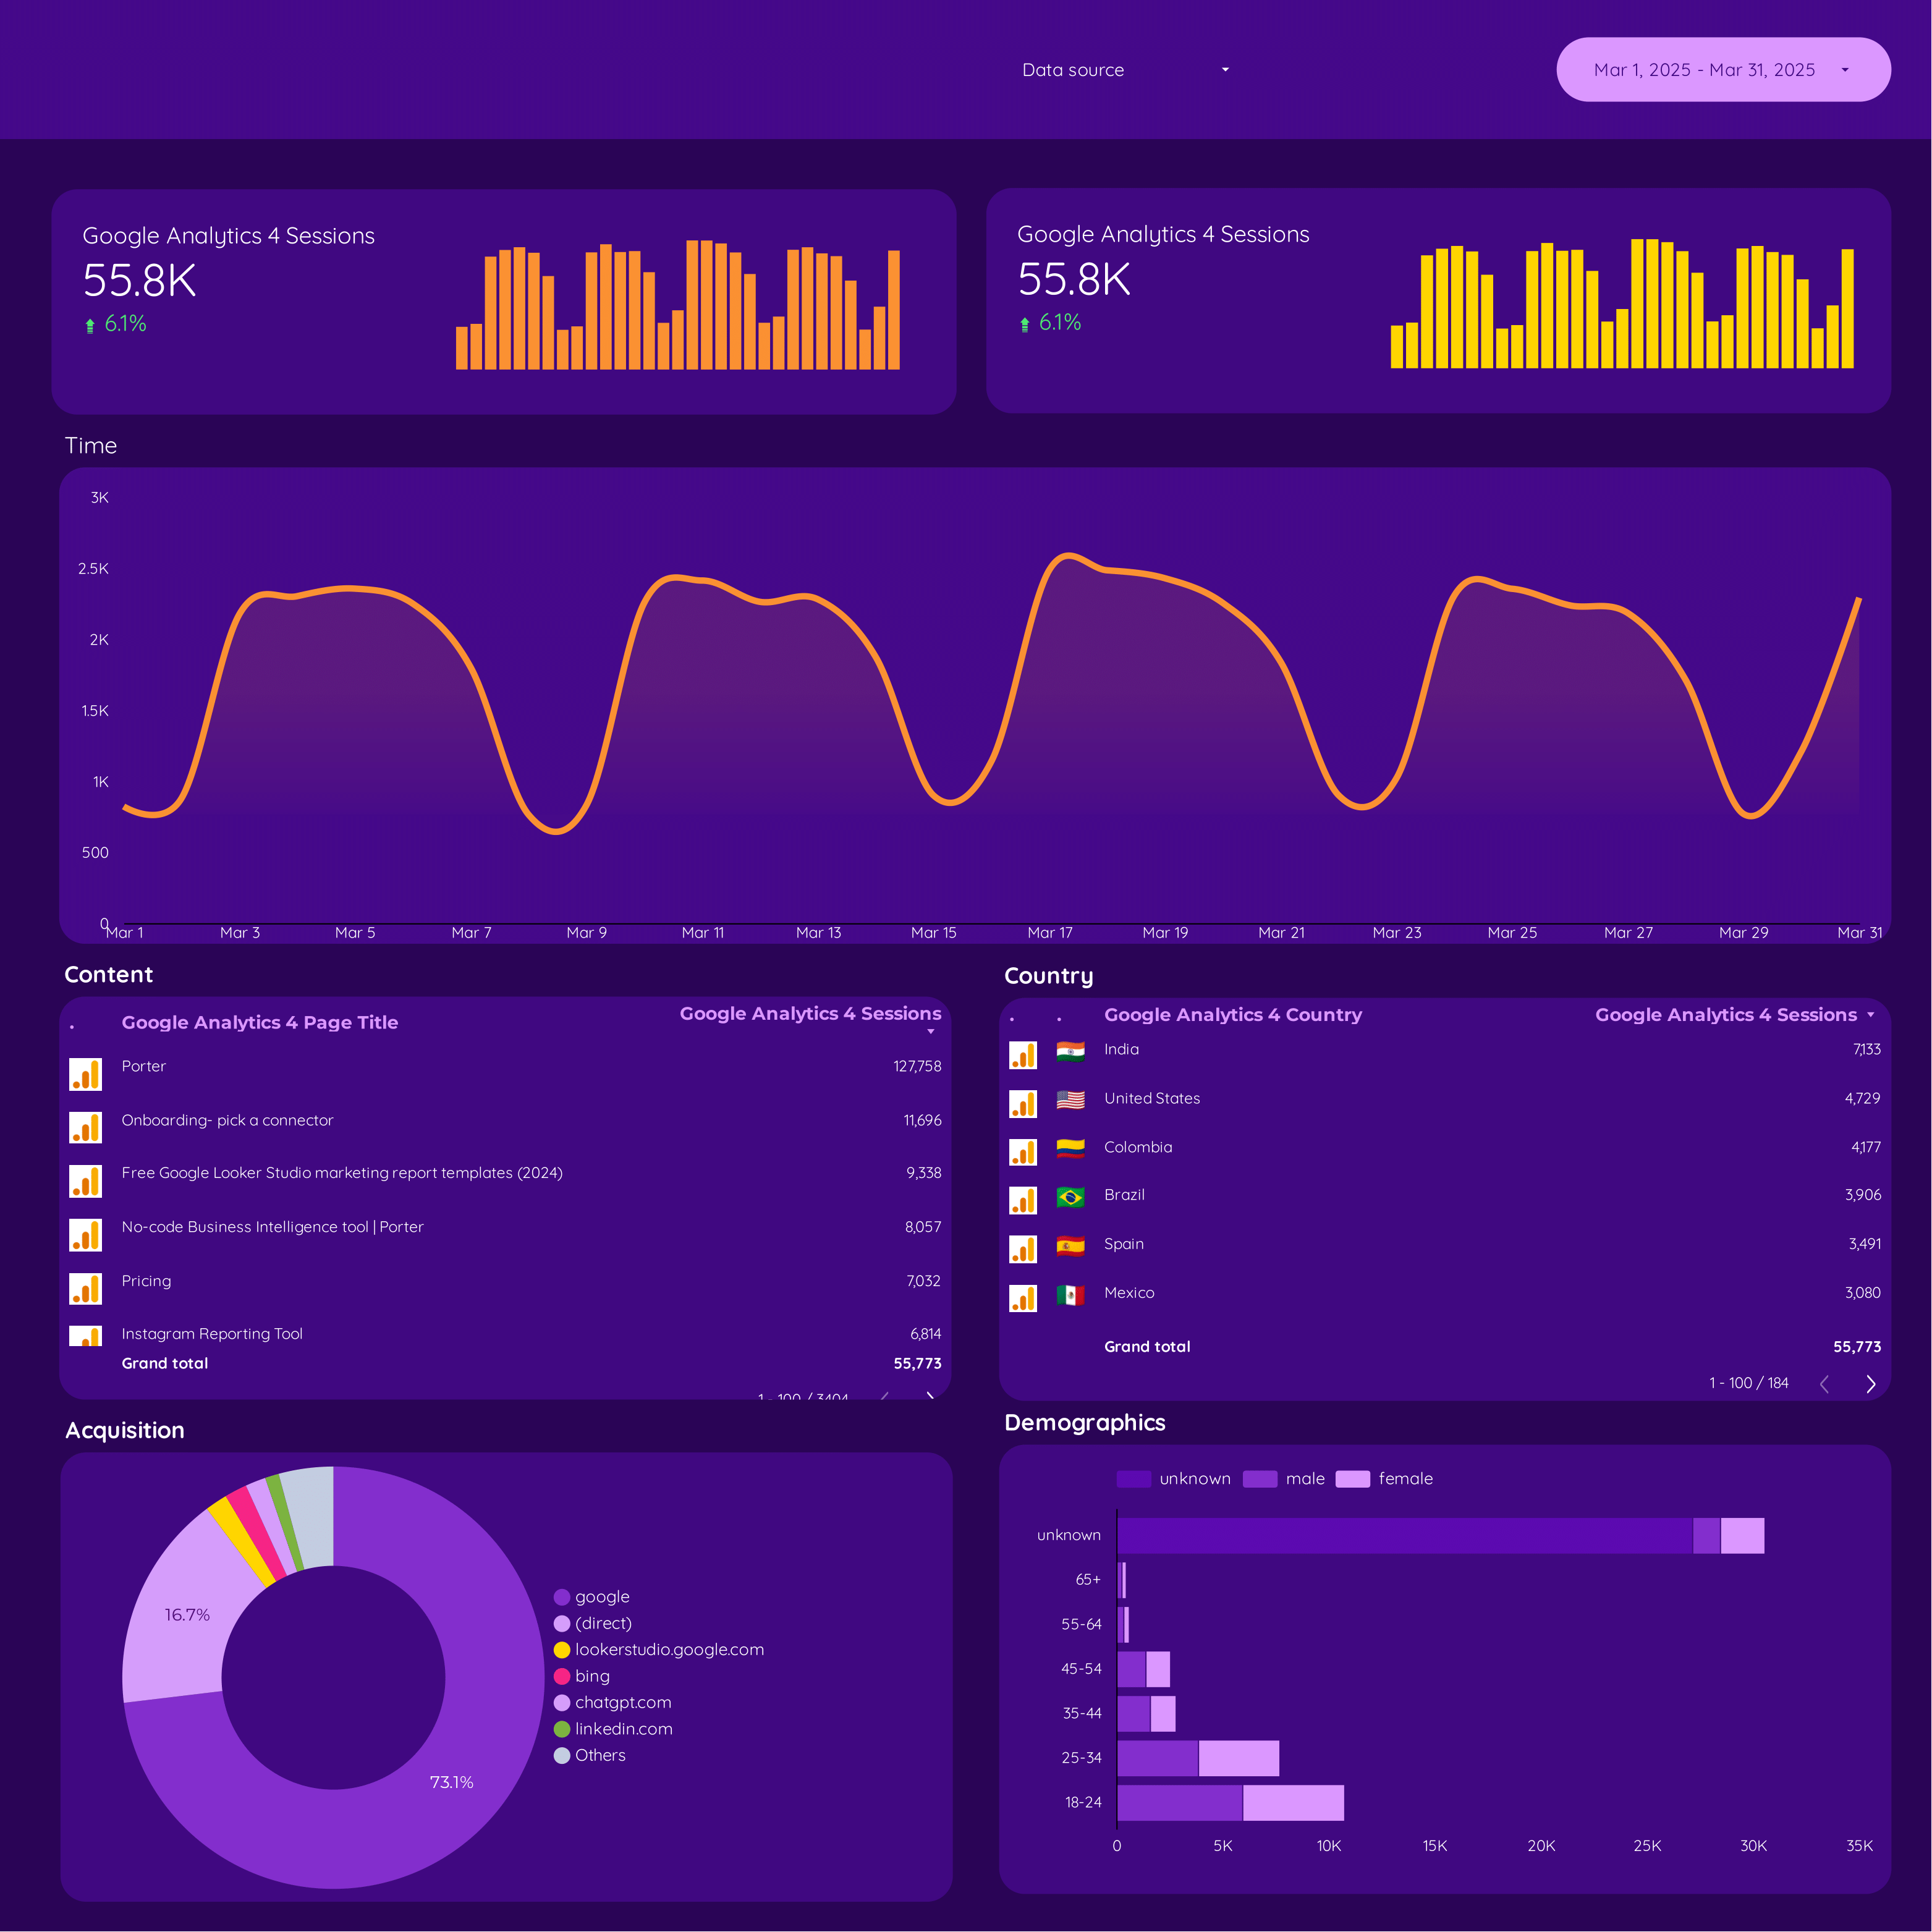
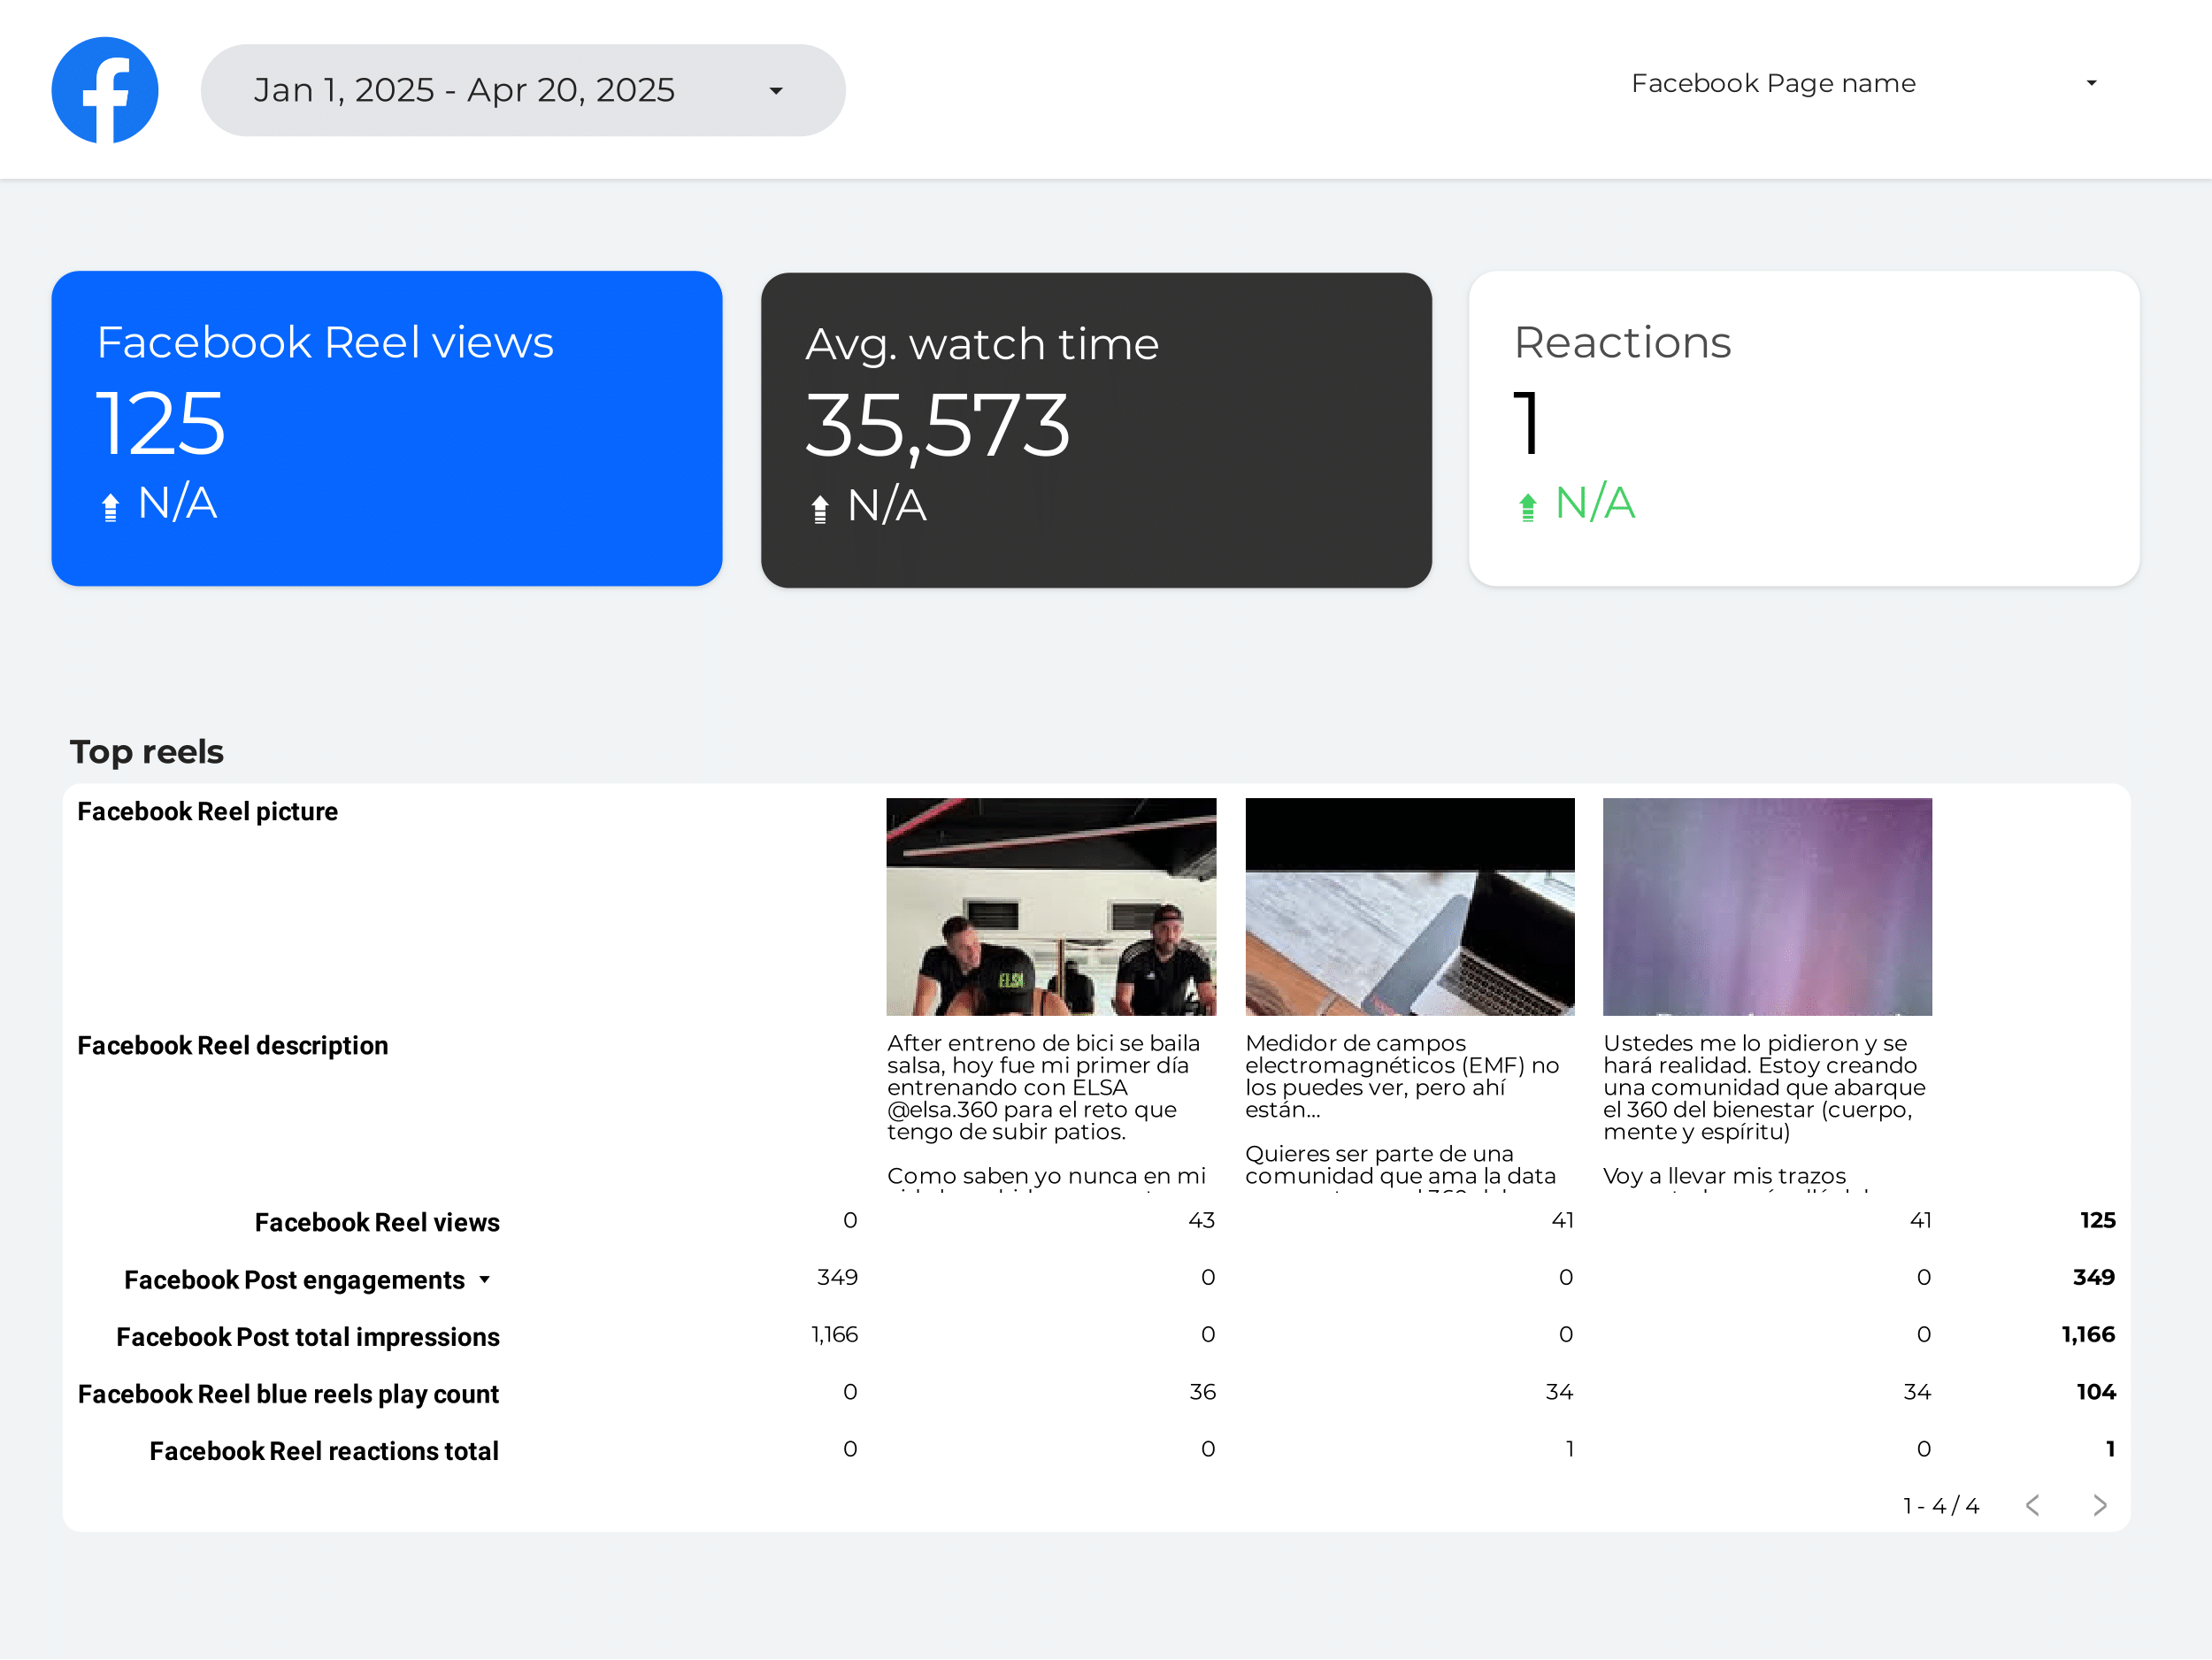
User engagement KPIs measure the interaction with data systems:
- Activity metrics: login rates, session duration
- Adoption metrics: feature usage, user growth
- Feedback metrics: user satisfaction, issue reports
Cost KPIs show the financial impact of your data systems:
- Operational costs: infrastructure, maintenance
- Efficiency: cost per transaction, cost savings
- Effectiveness: ROI, cost-benefit analysis
To analyze these data analytics KPIs, segment them by:
- System: database, application, cloud service
- Time: Hourly, daily, weekly, monthly
- Project: phase, objective
- Business: department, branch, region
- User: role, location, behavior
- Data source: type, format, origin