

LTV Report template for Marketing teams and agencies
Analyze key metrics such as conversion rate, CPA, and CLTV with this LTV report template. Ideal for e-commerce and Shopify, it helps marketing teams track customer segmentation and channel attribution. Gain insights by age, location, and income to refine your strategy and boost sales performance.
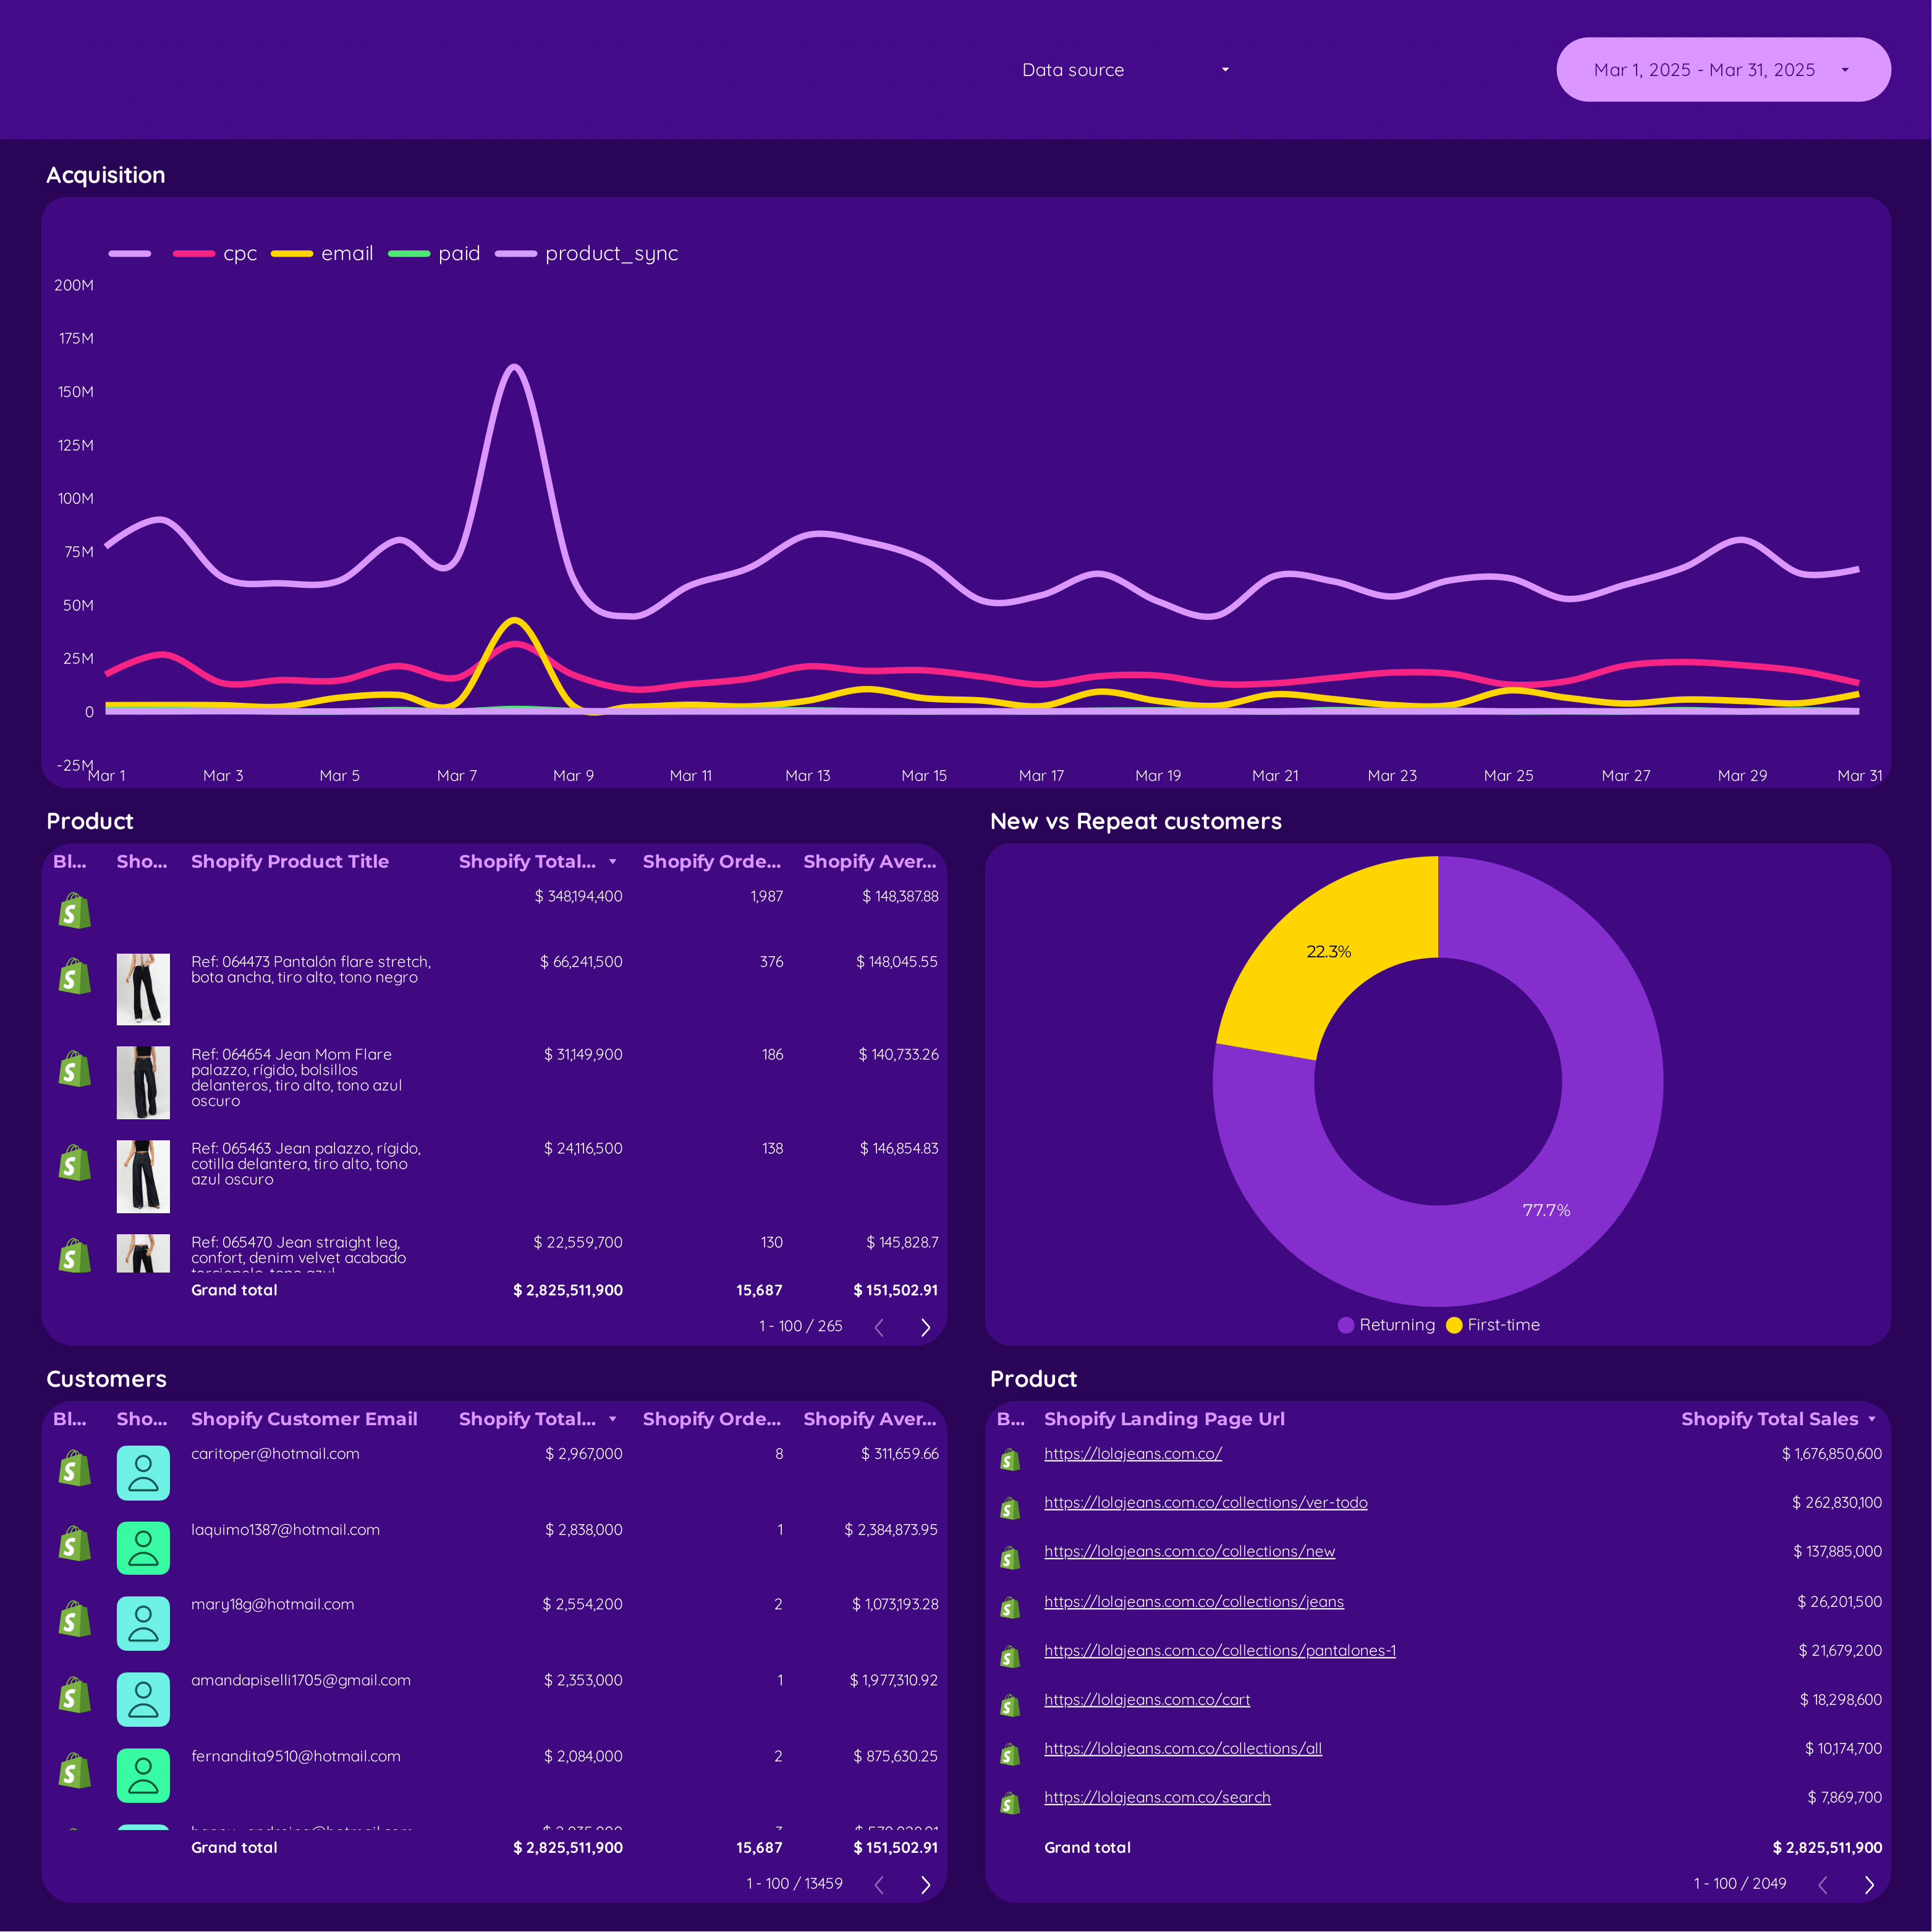
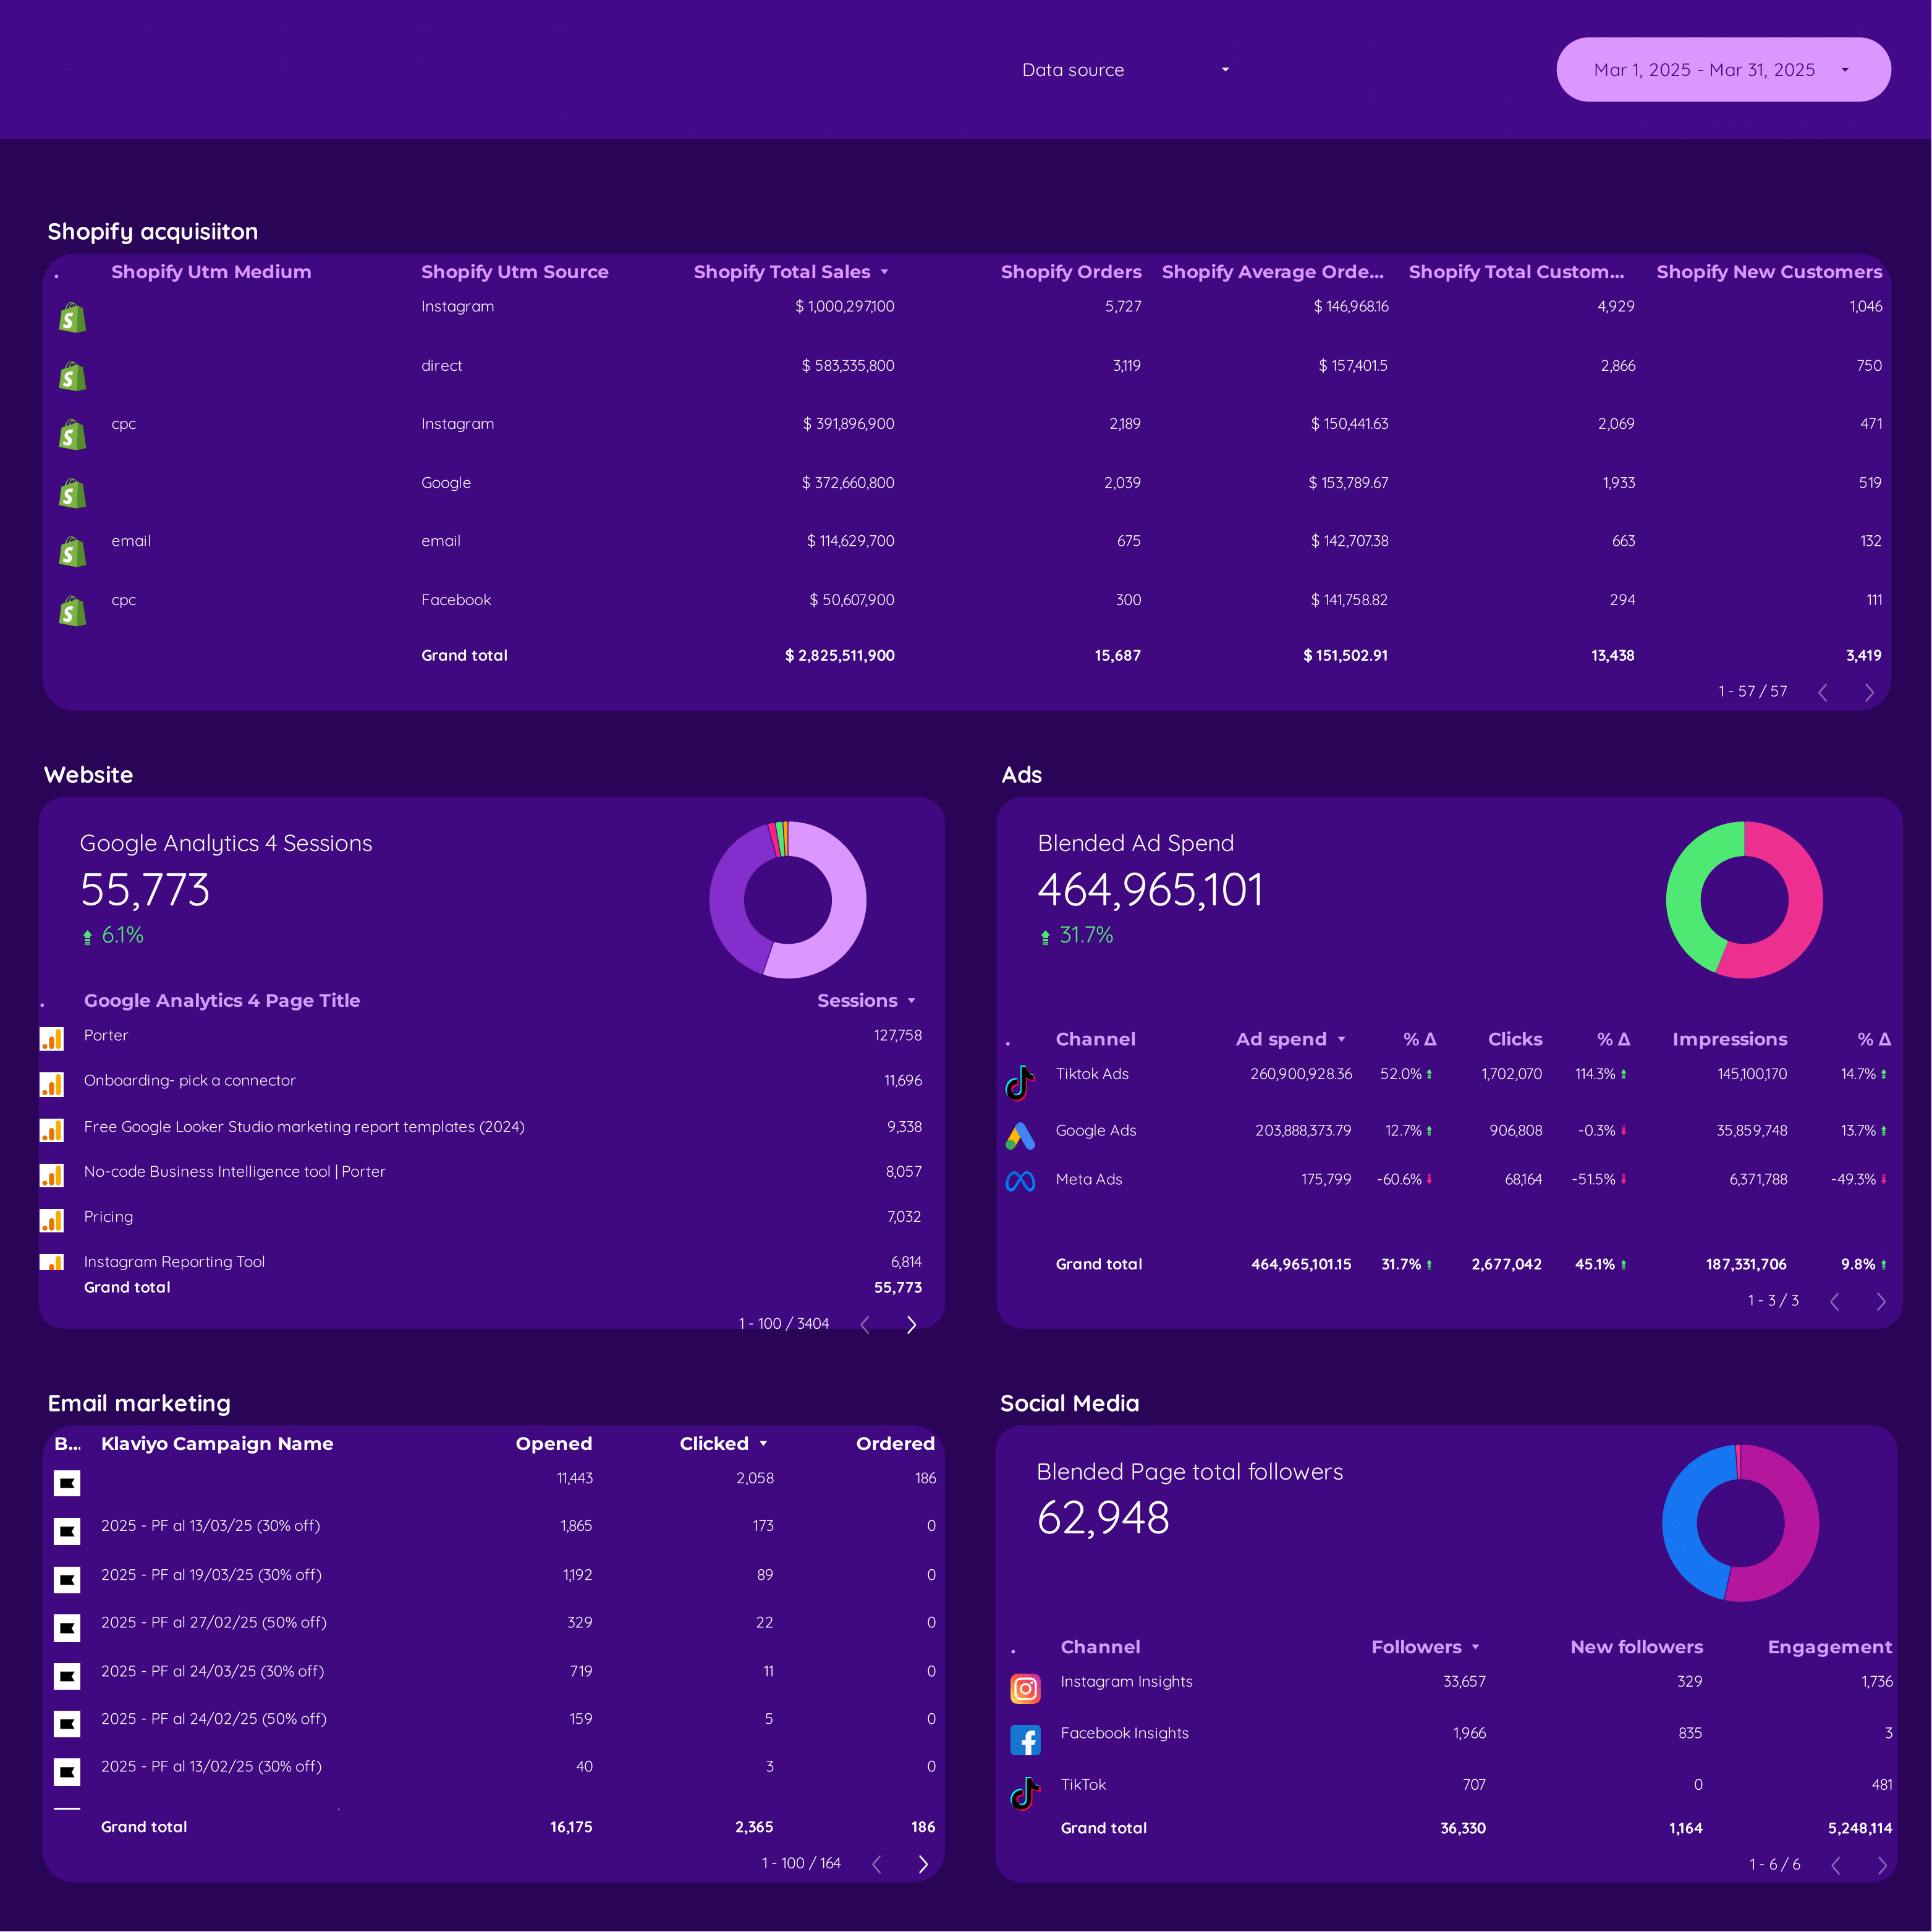
Shopify Store performance Report template for Marketing teams and agencies
Measure key metrics with the Store performance report template. Analyze total revenue, conversion rates, and traffic sources. Segment by audience, marketing channels, and campaign objectives. Consolidate data from E-commerce, Google Analytics 4, Shopify, Google Ads, Facebook Ads, and SEO. Perfect for marketing teams to track performance and optimize strategies.
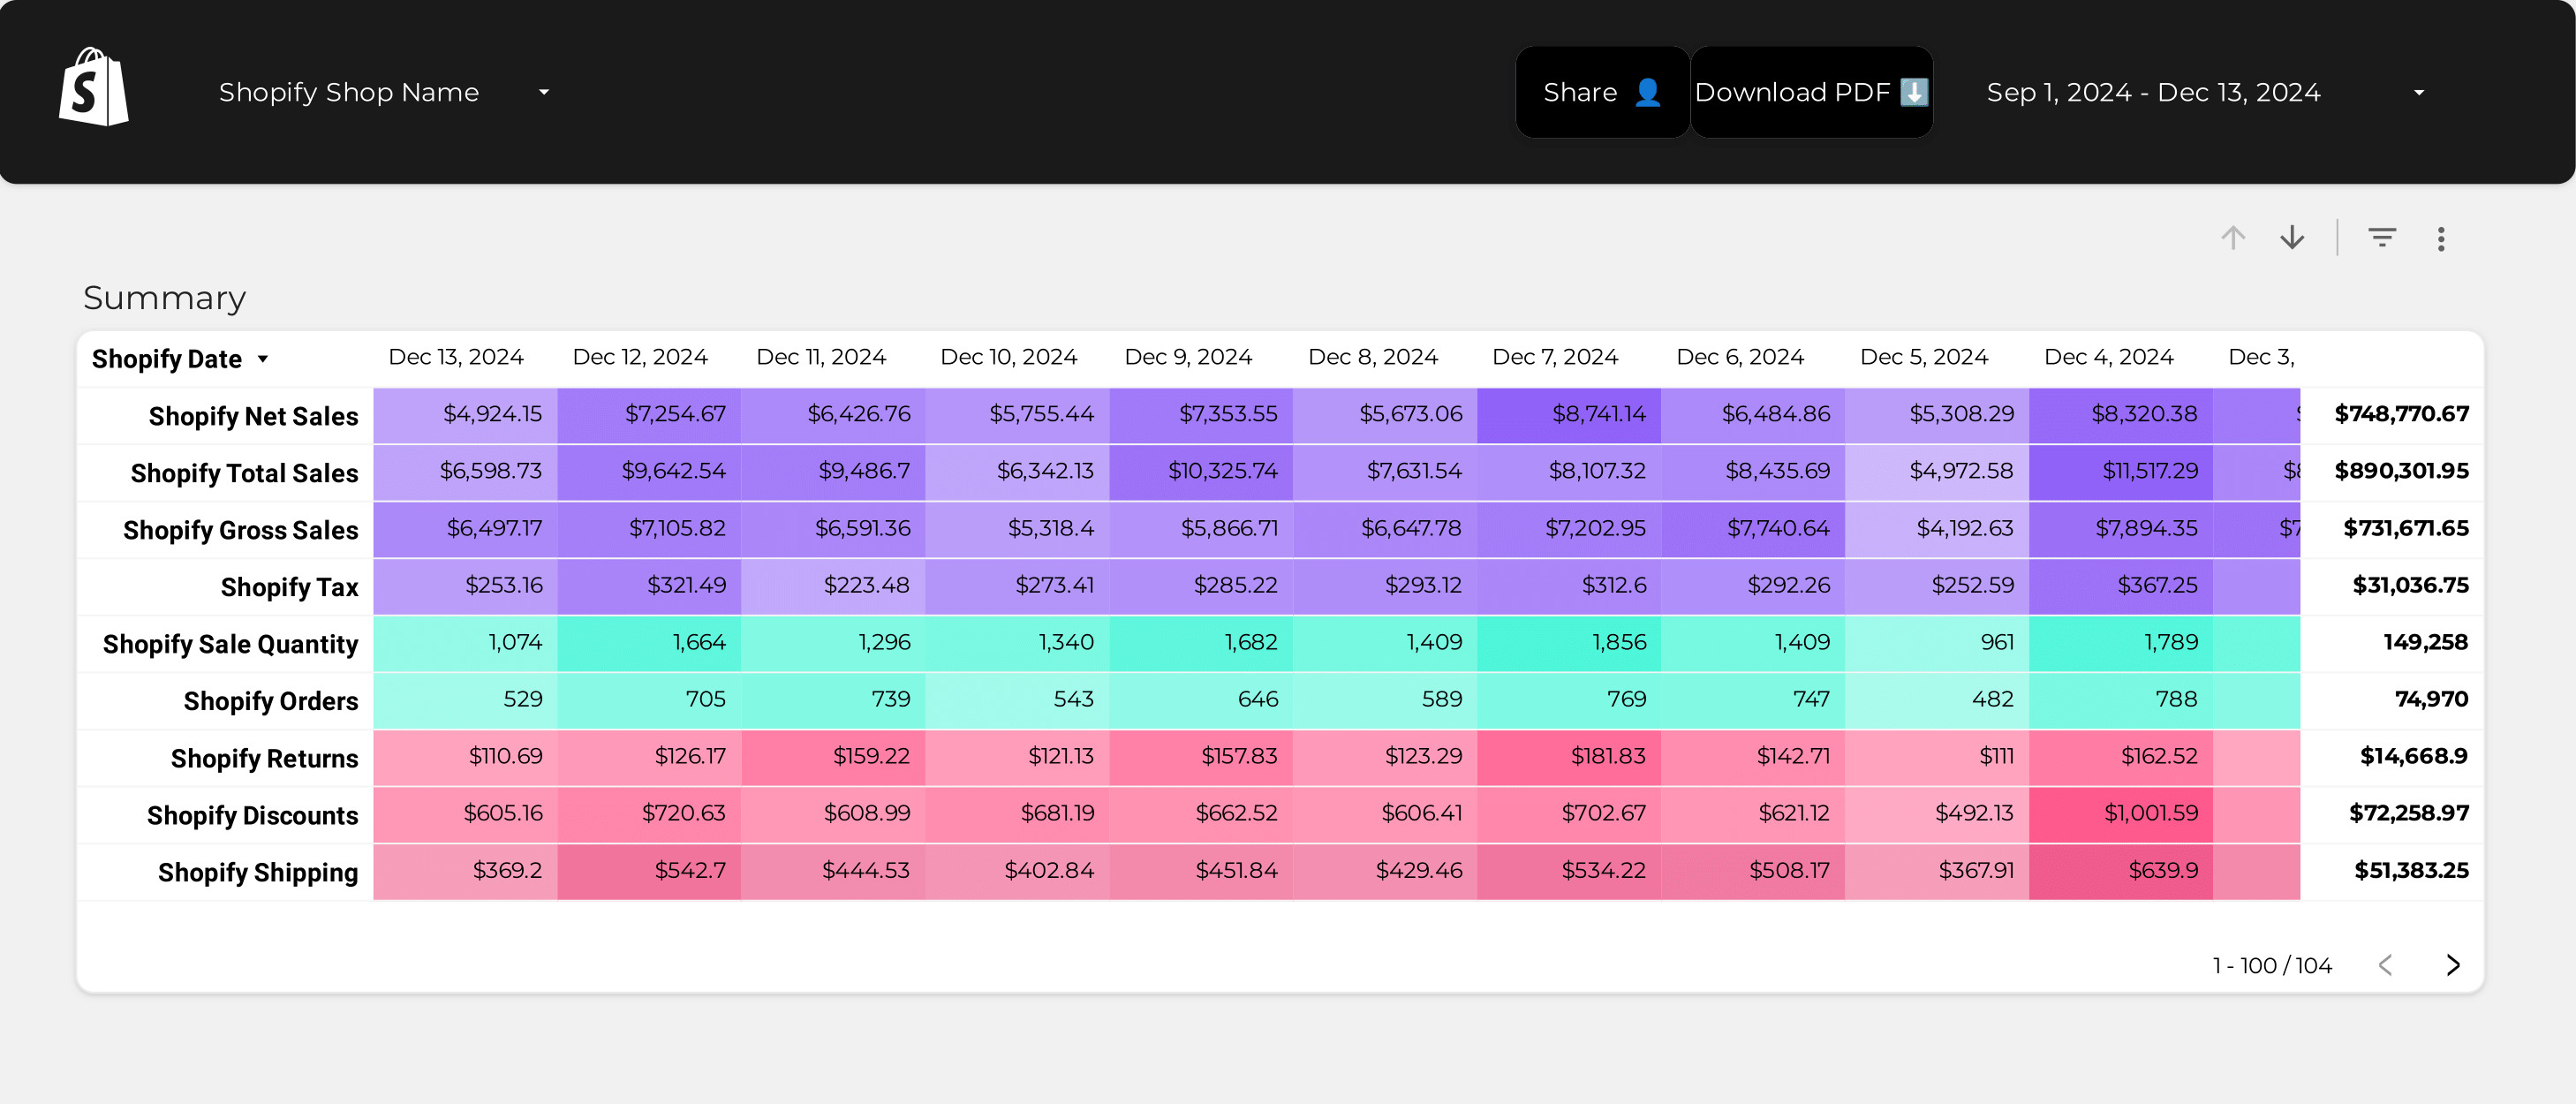
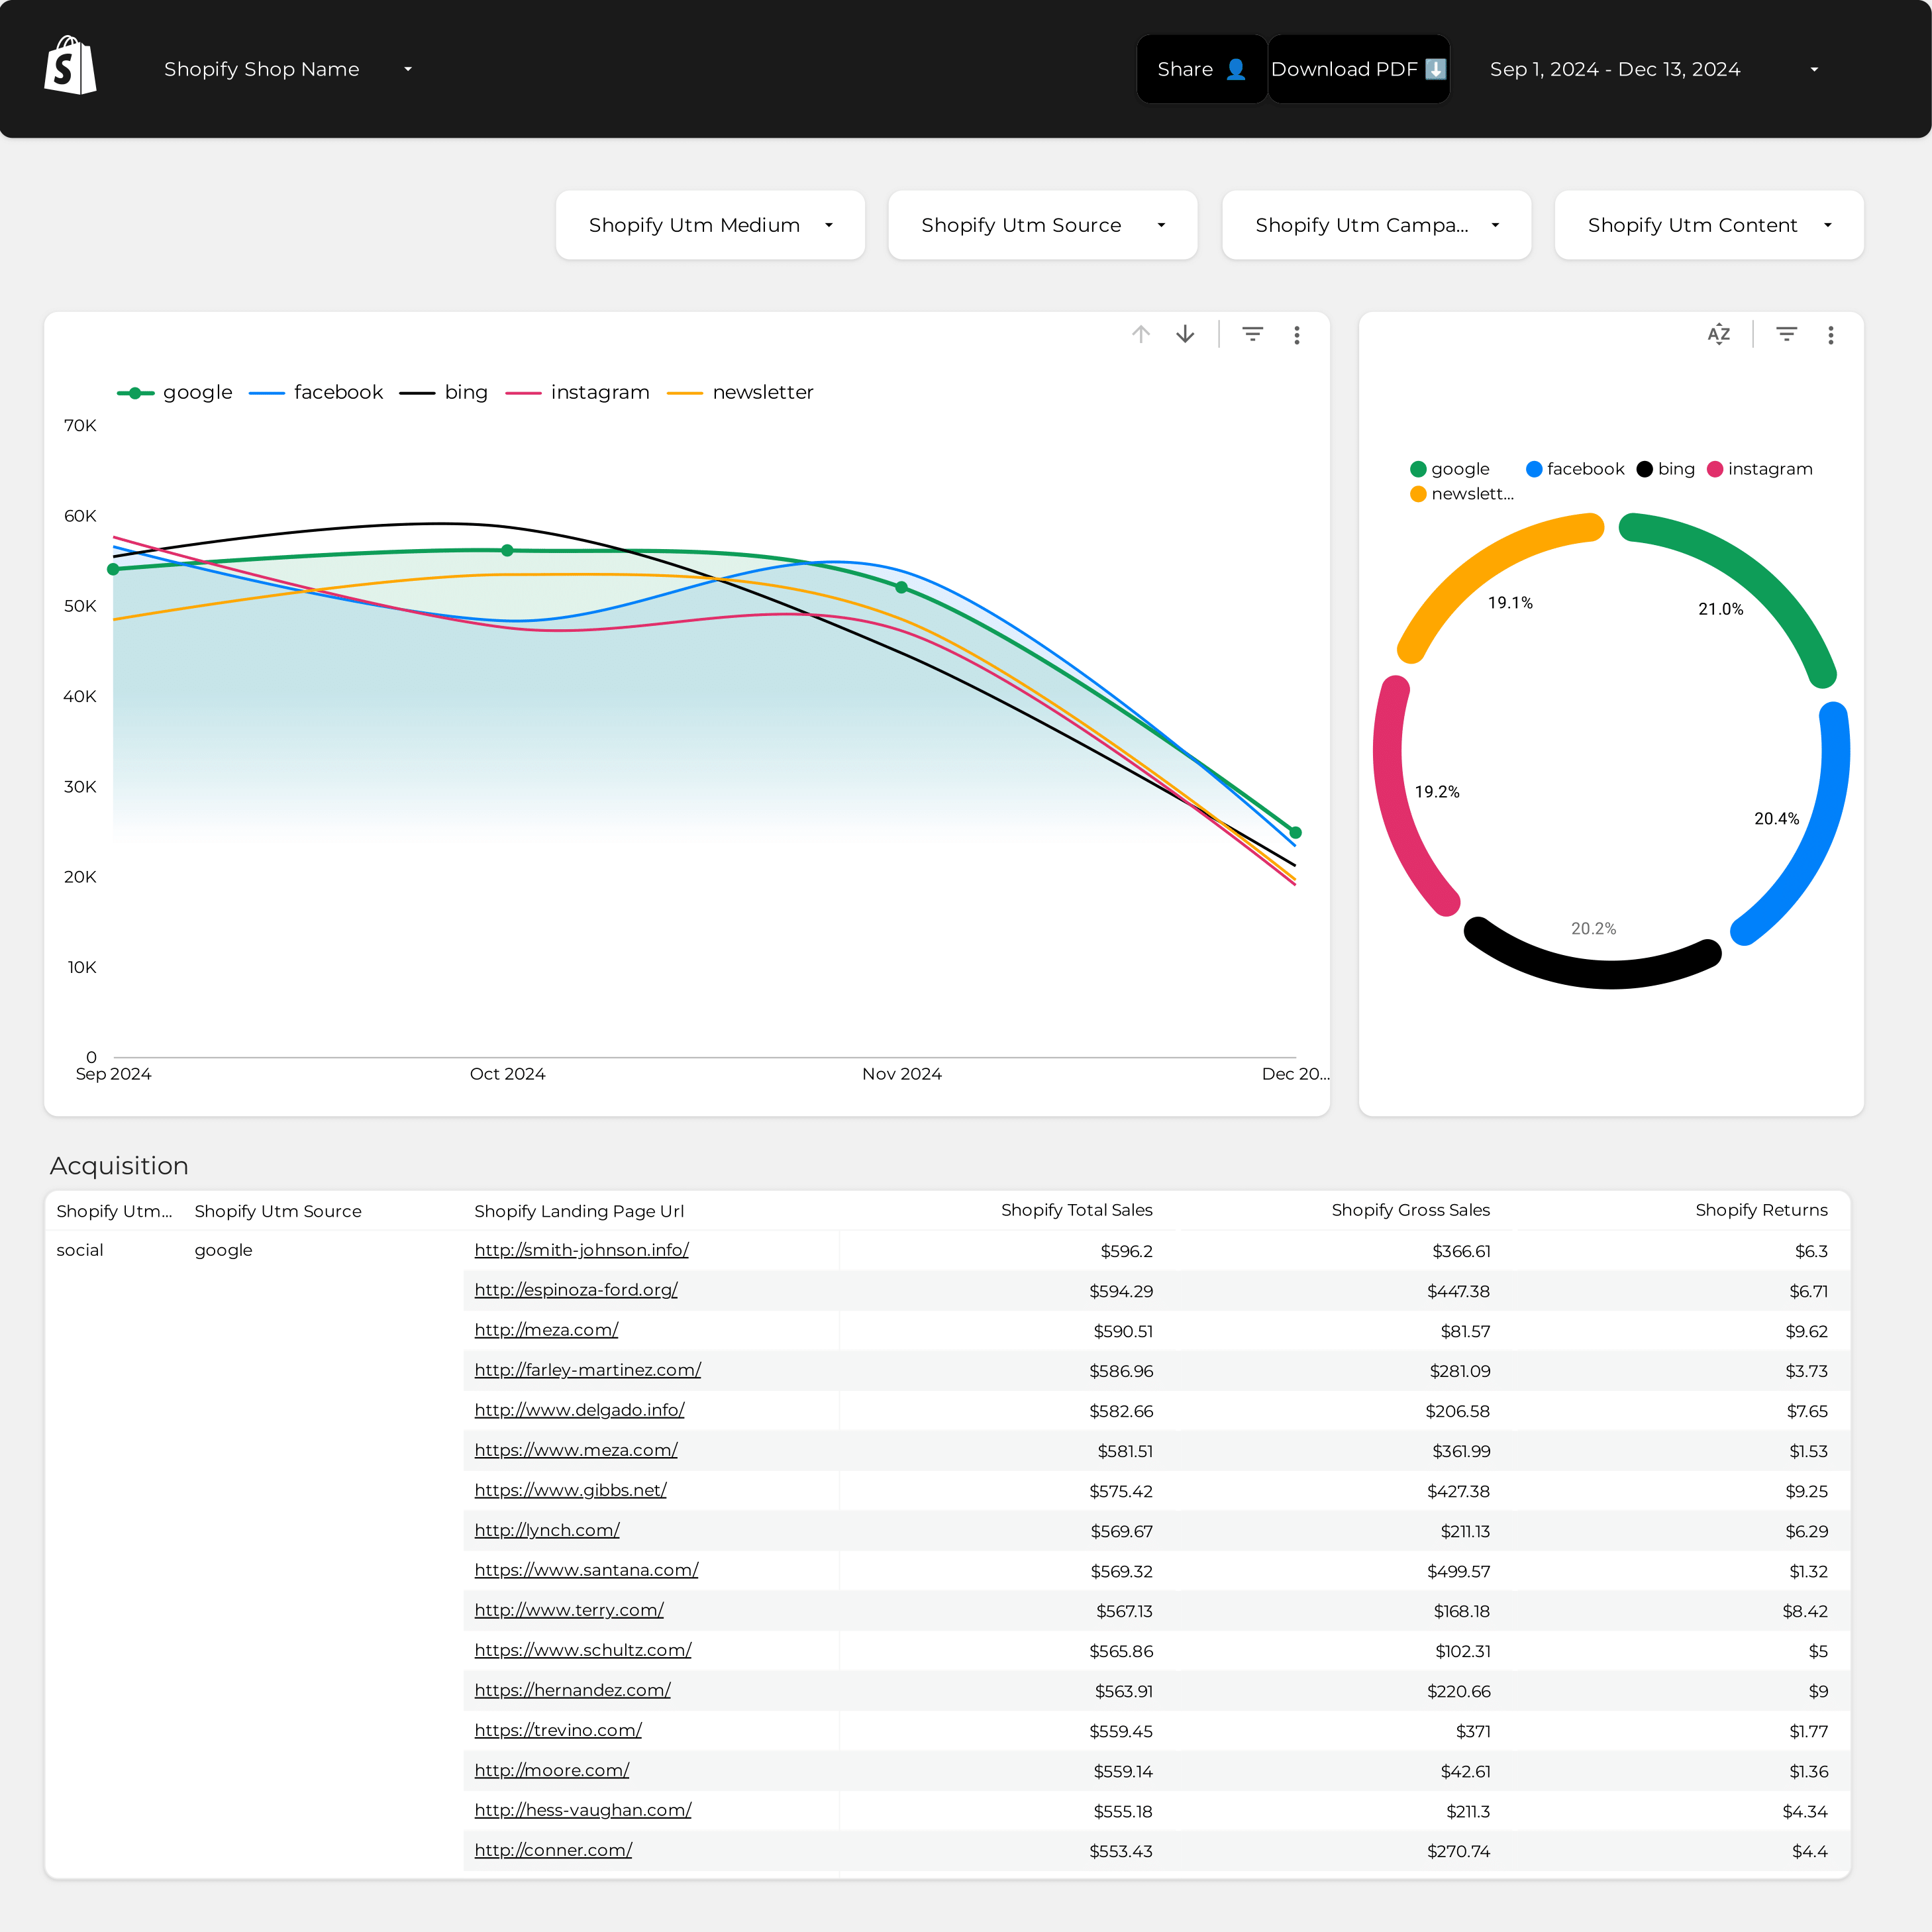
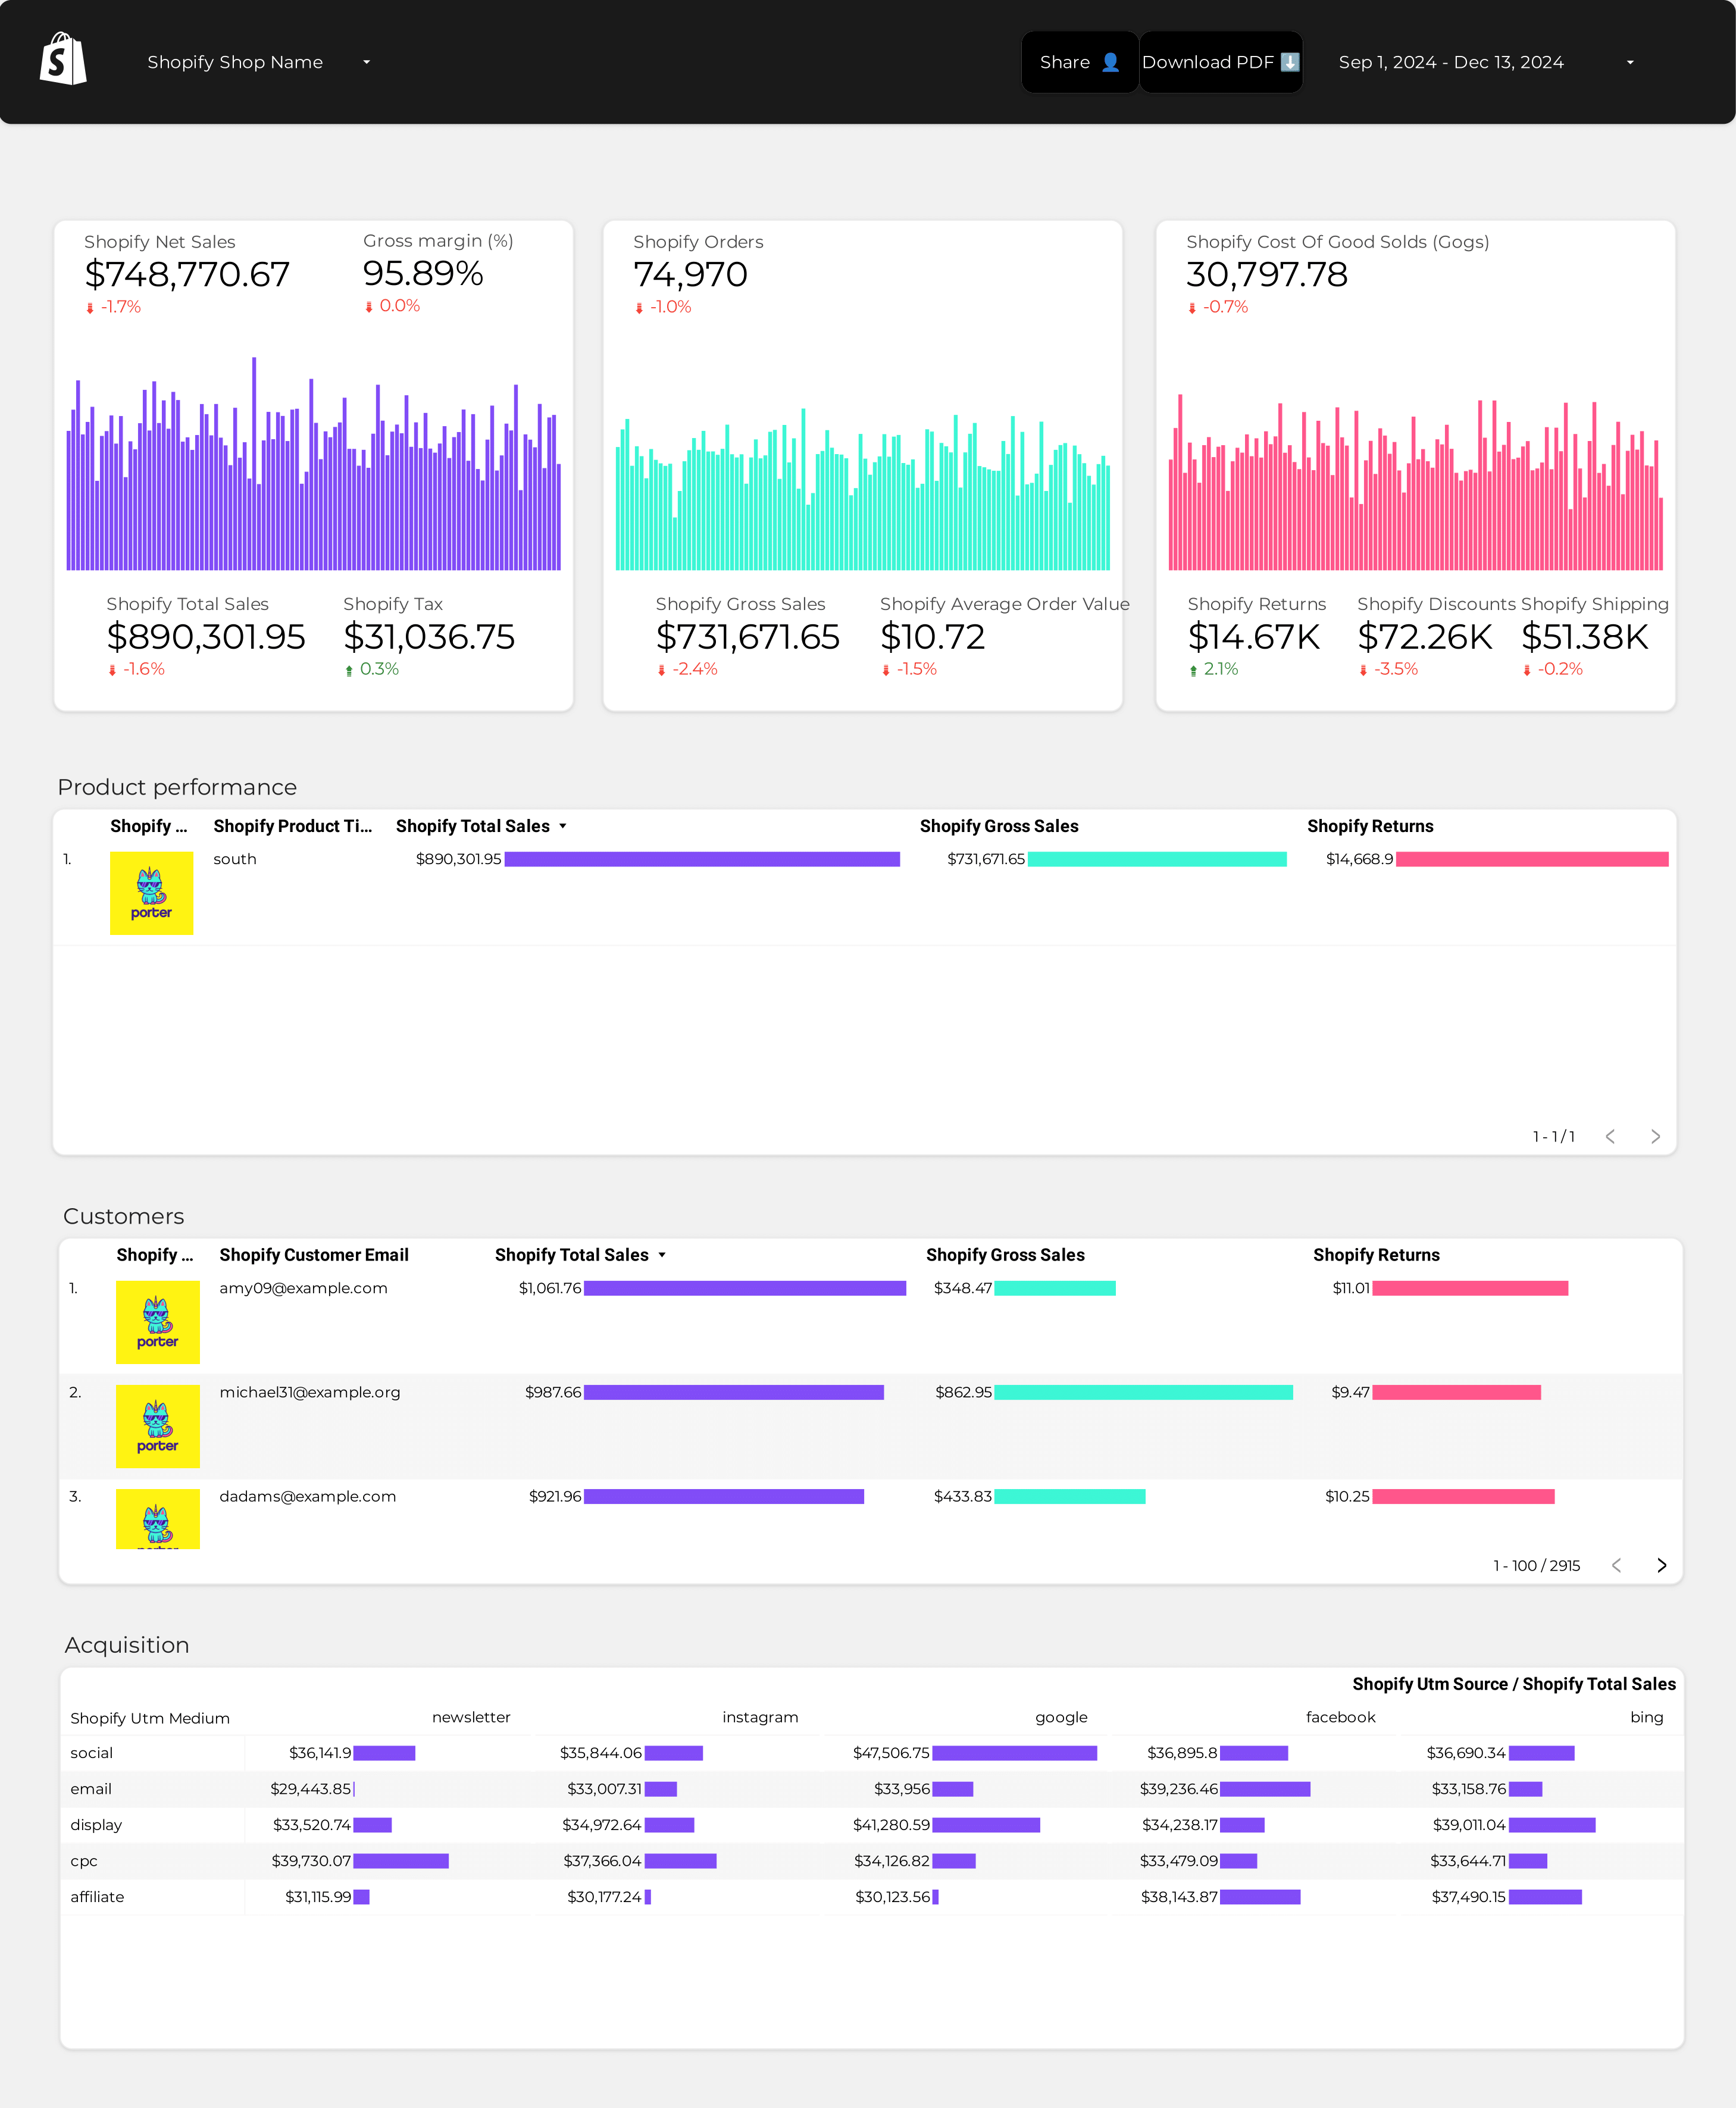
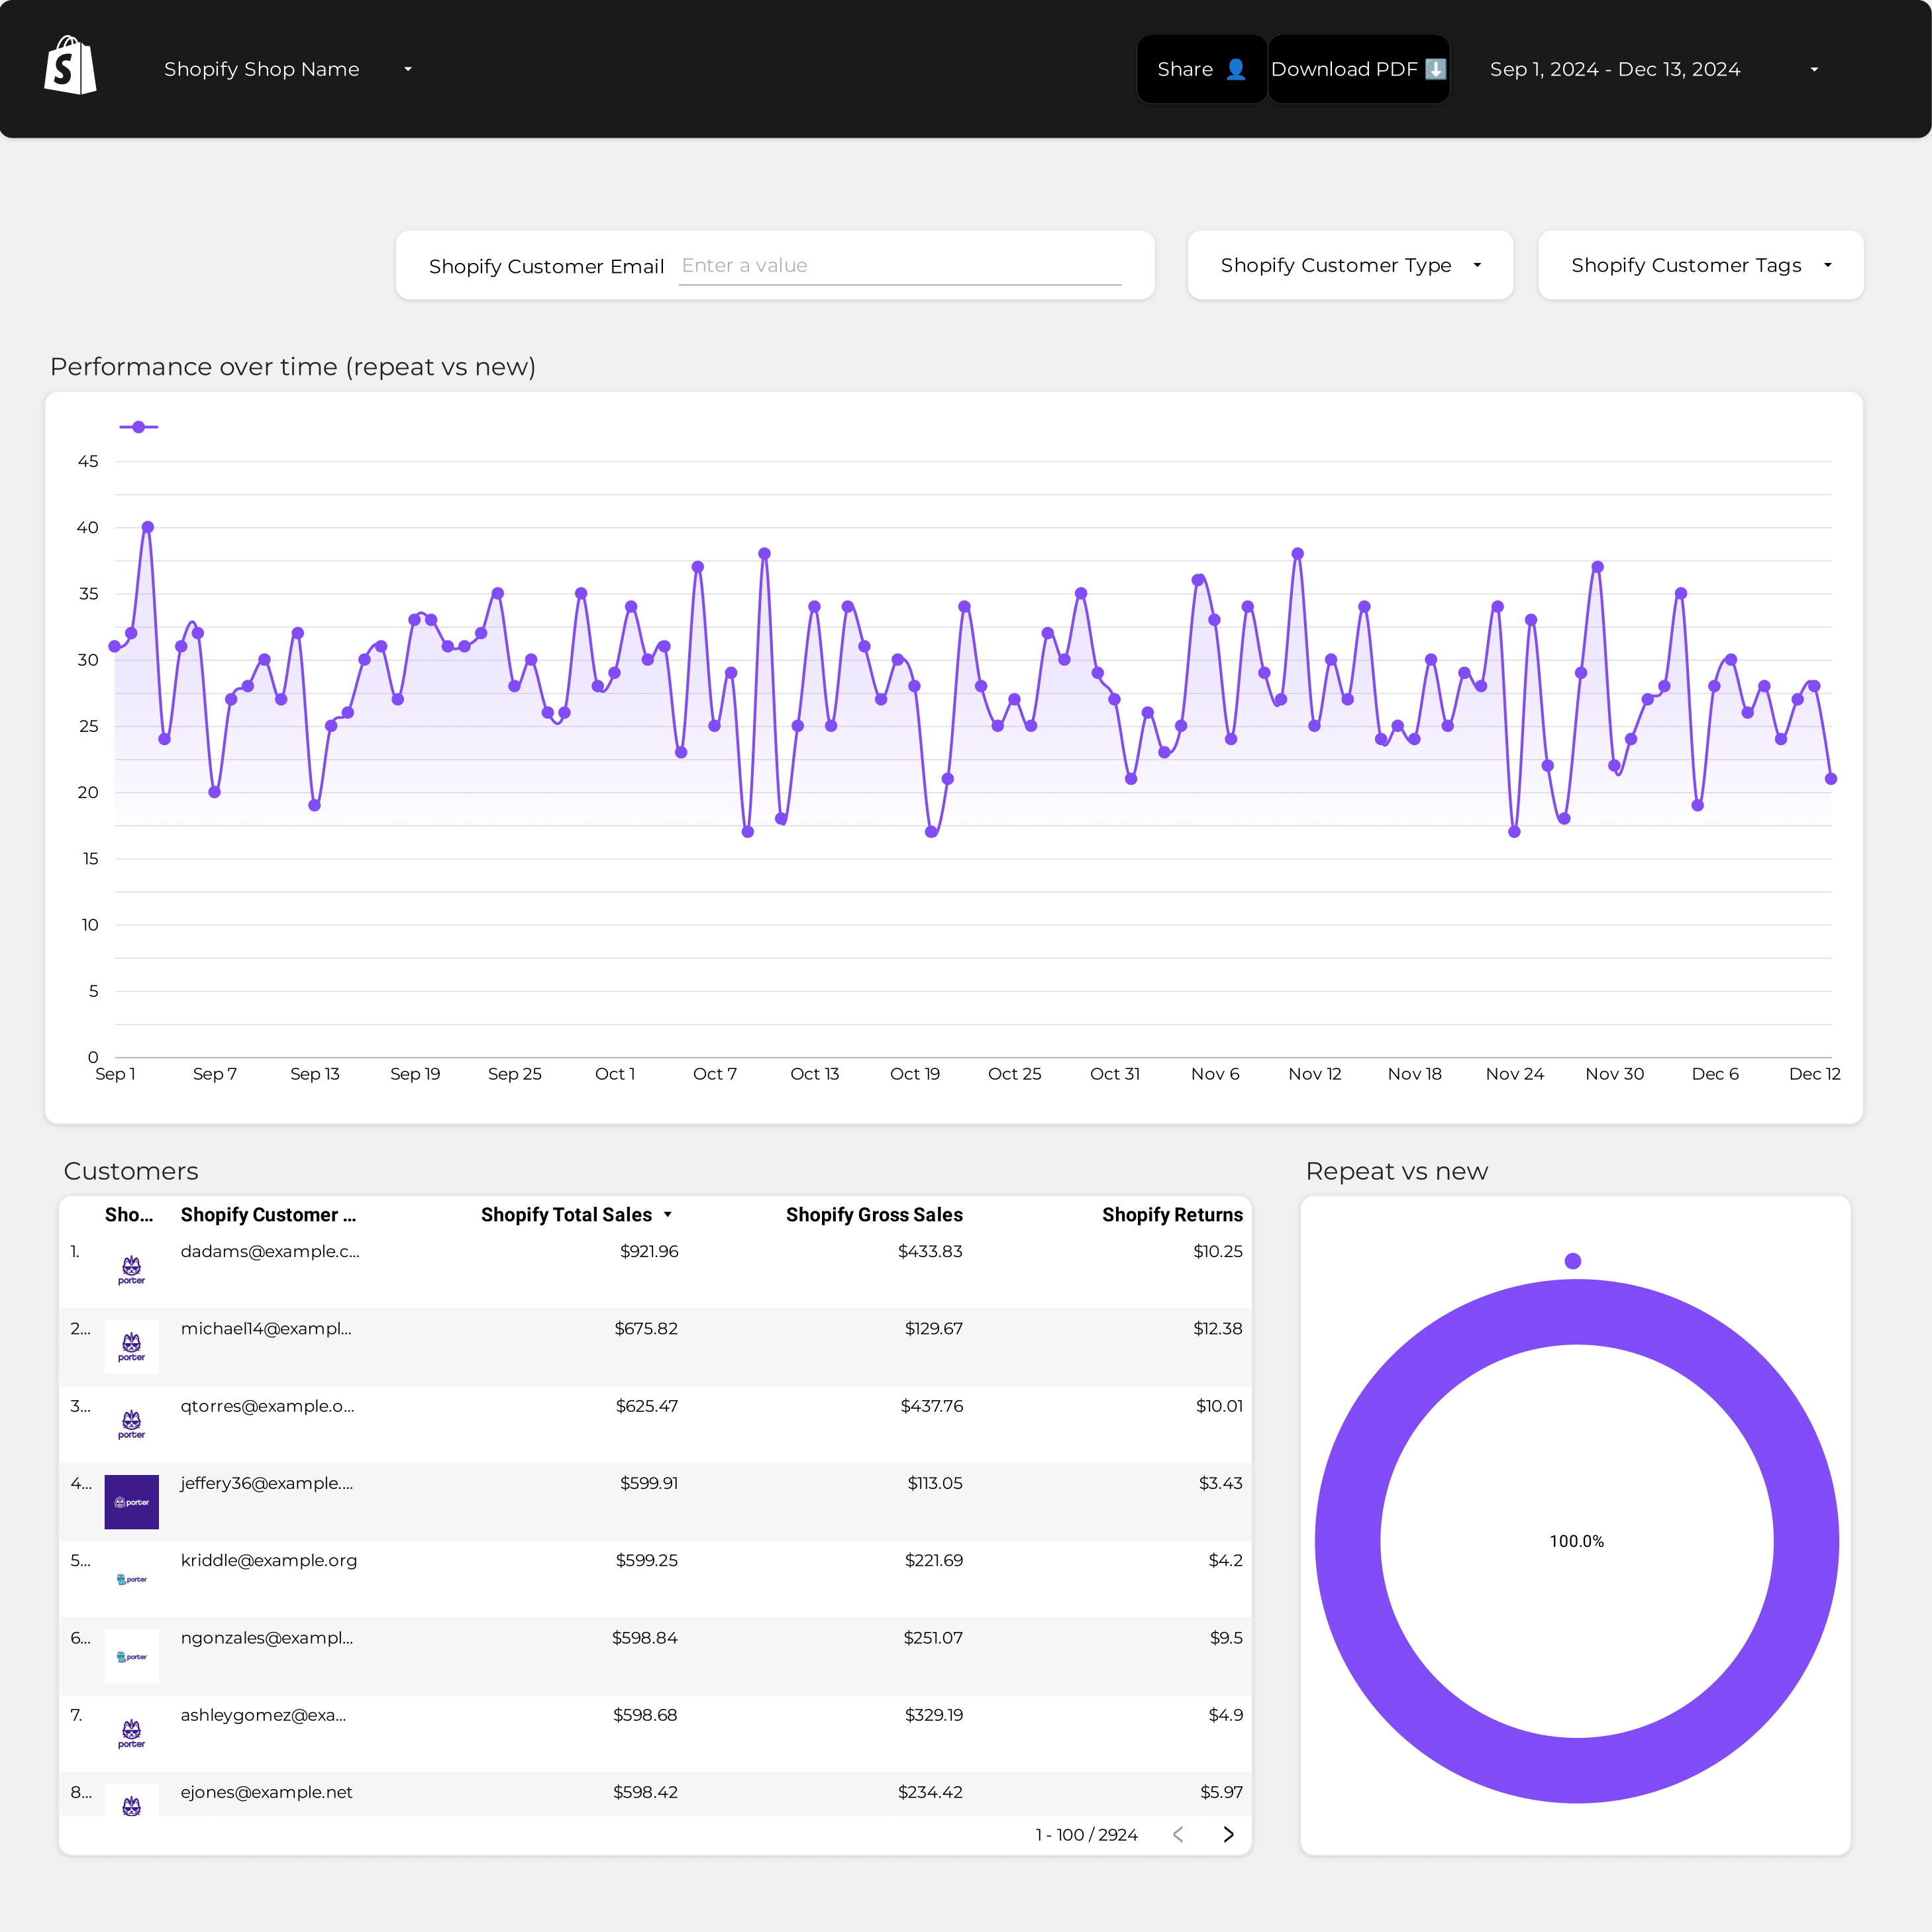
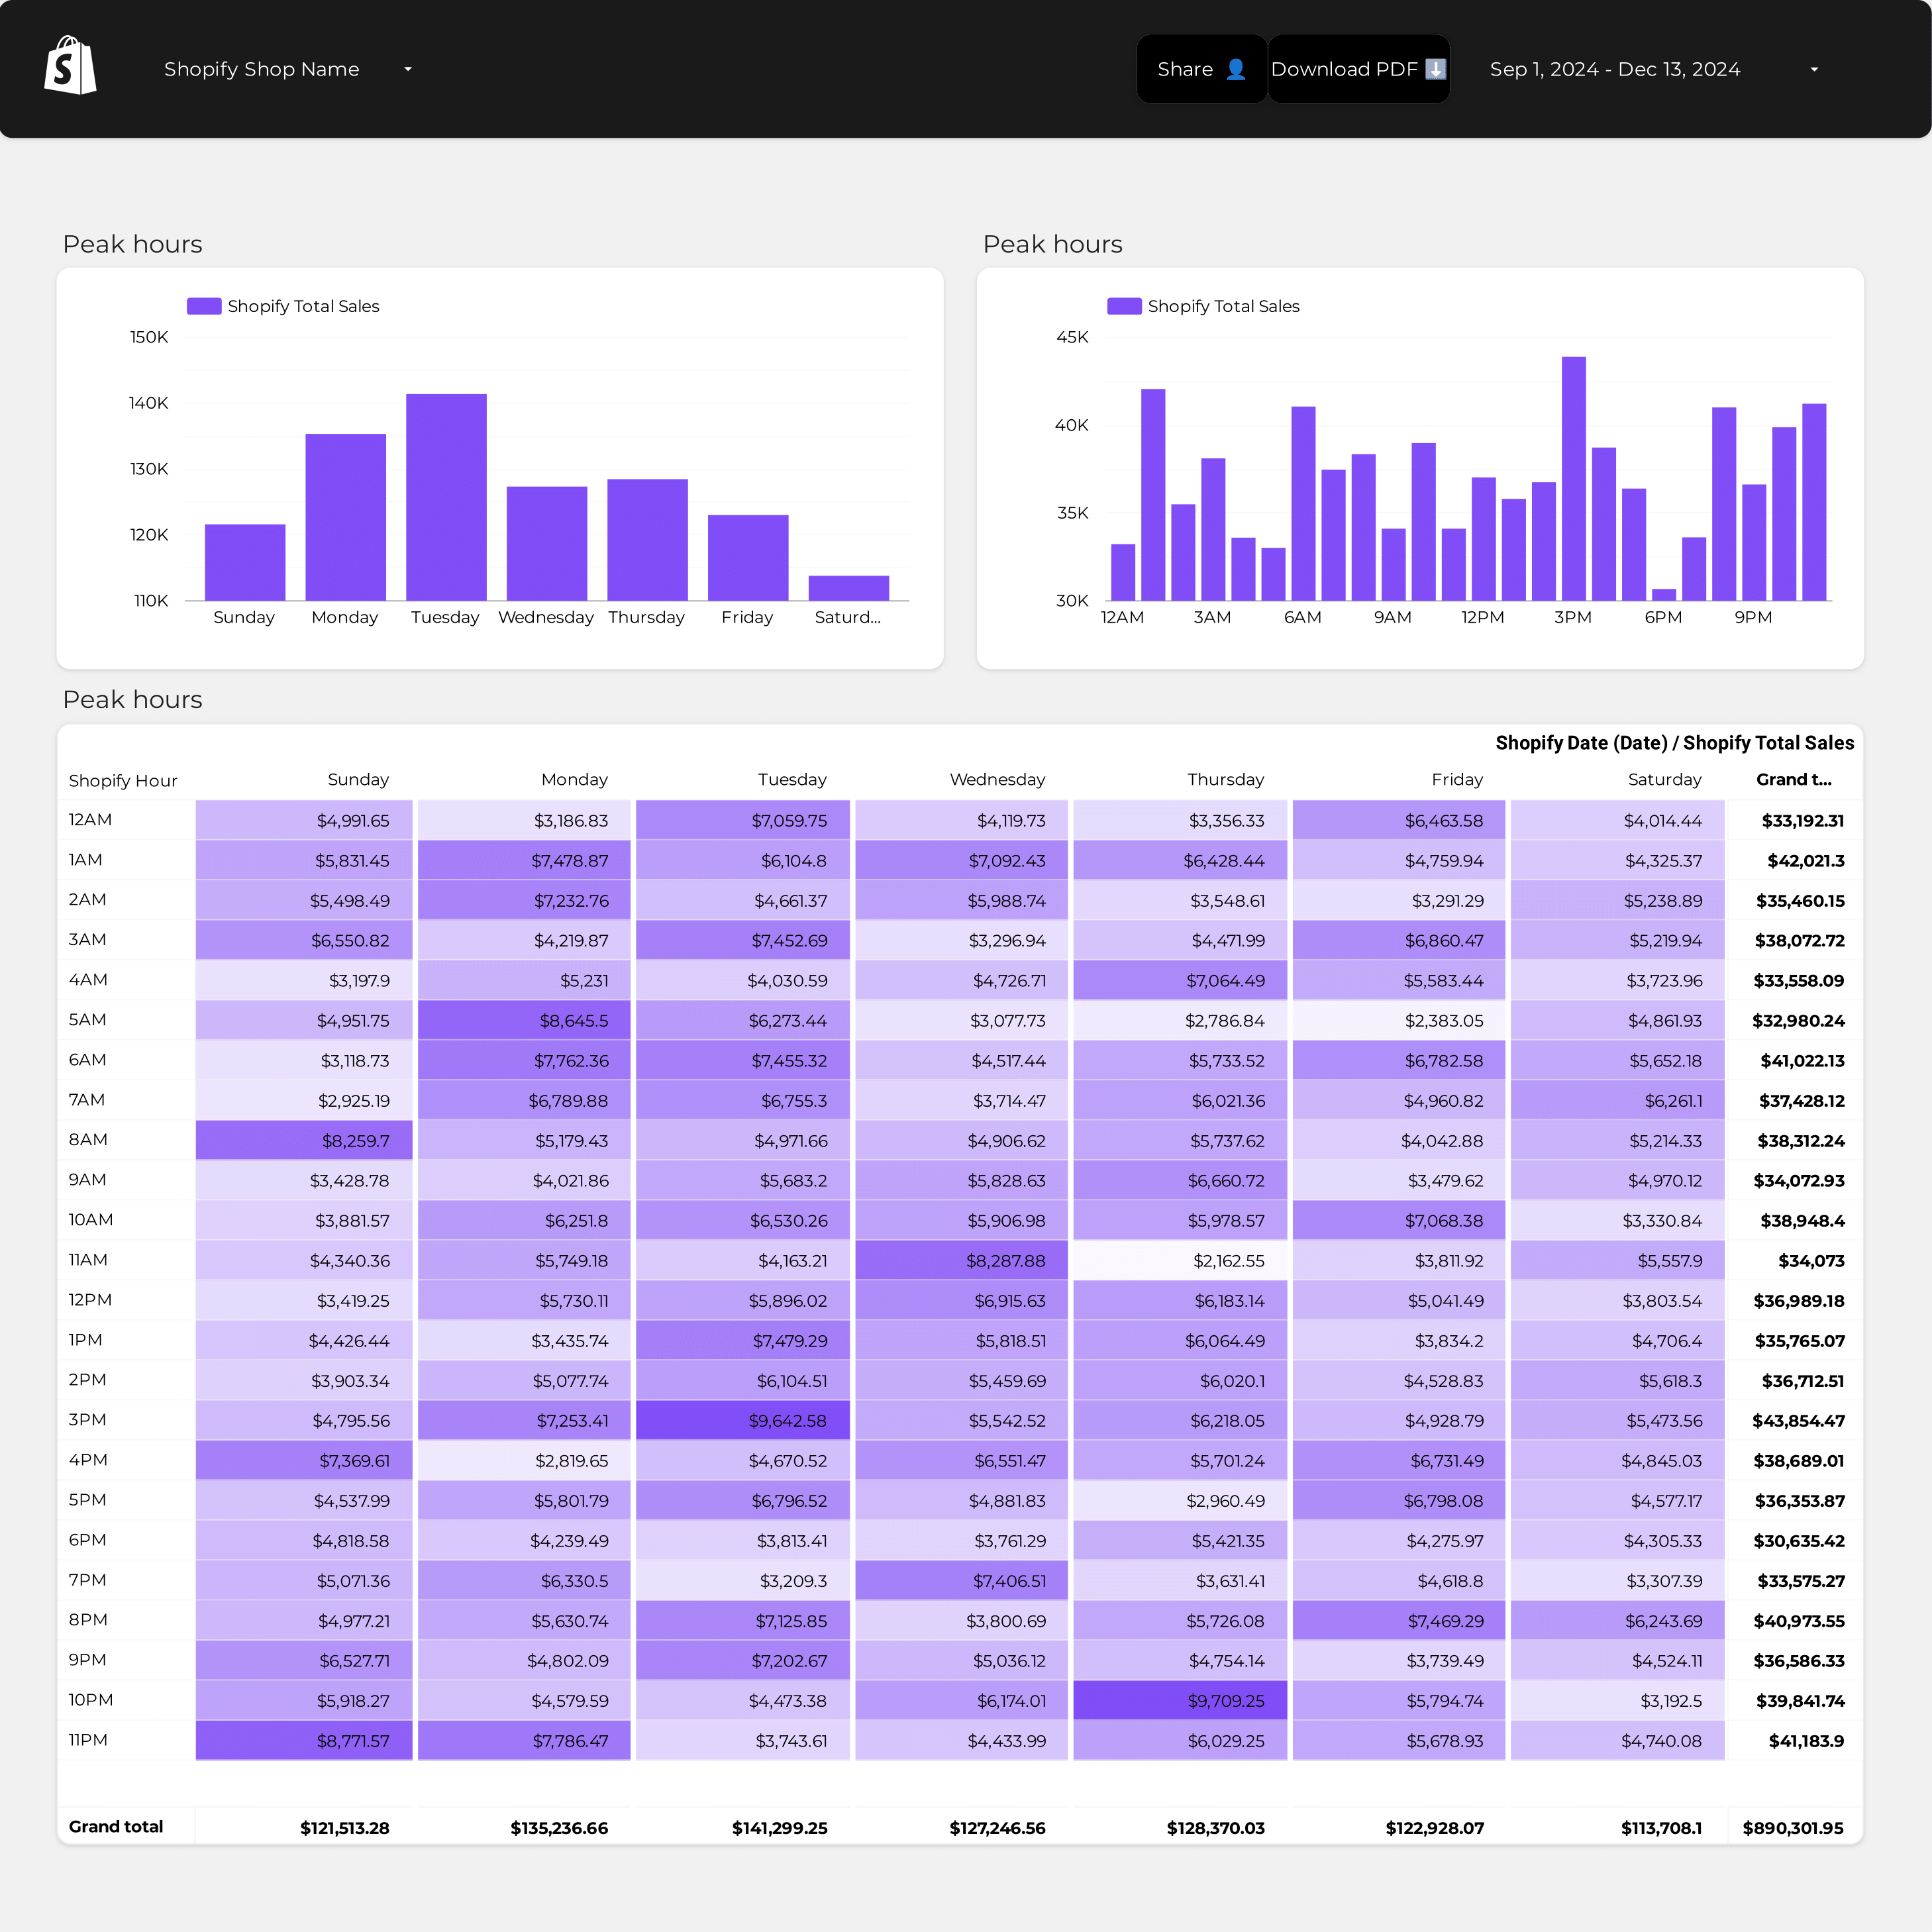
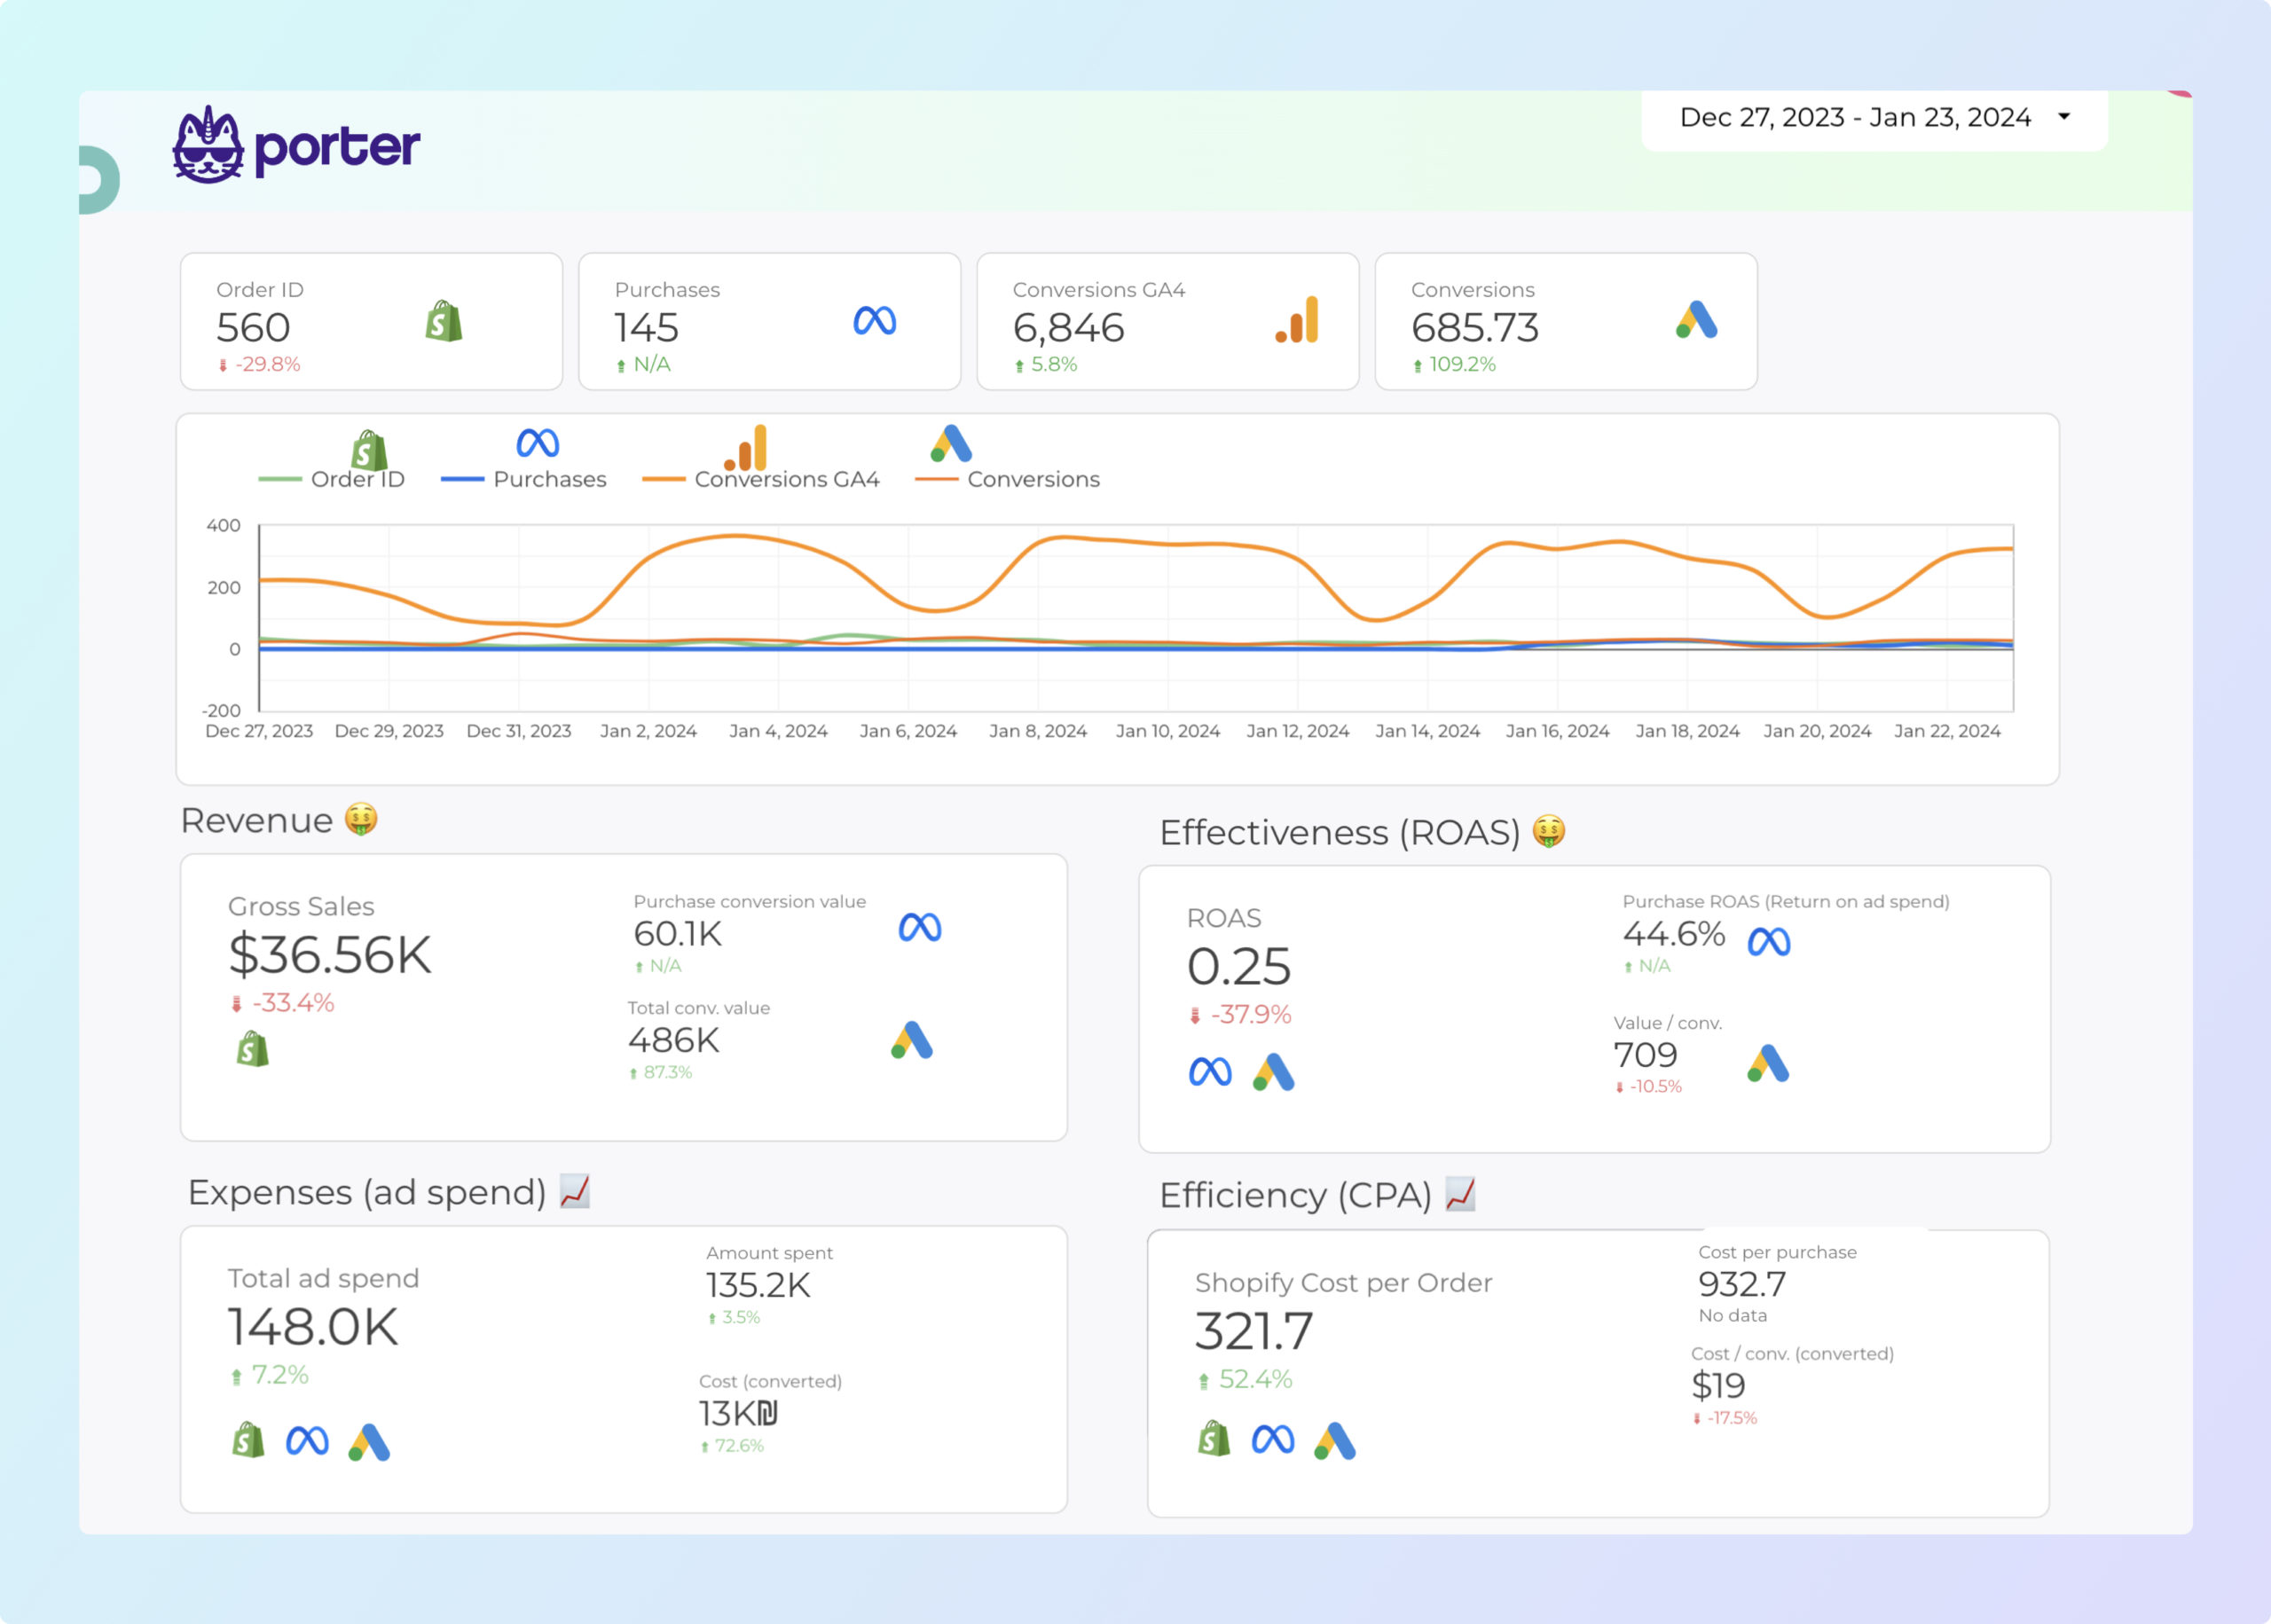
Shopify Report template for Marketing teams and agencies
Analyze key metrics like revenue, average order value, and conversion rate with this Shopify report template. Track cost per acquisition and return on ad spend. Segment by audience, messaging, and channels. Ideal for e-commerce marketing teams to unify insights and optimize strategies. Perfect for monitoring Shopify store performance across various timeframes.
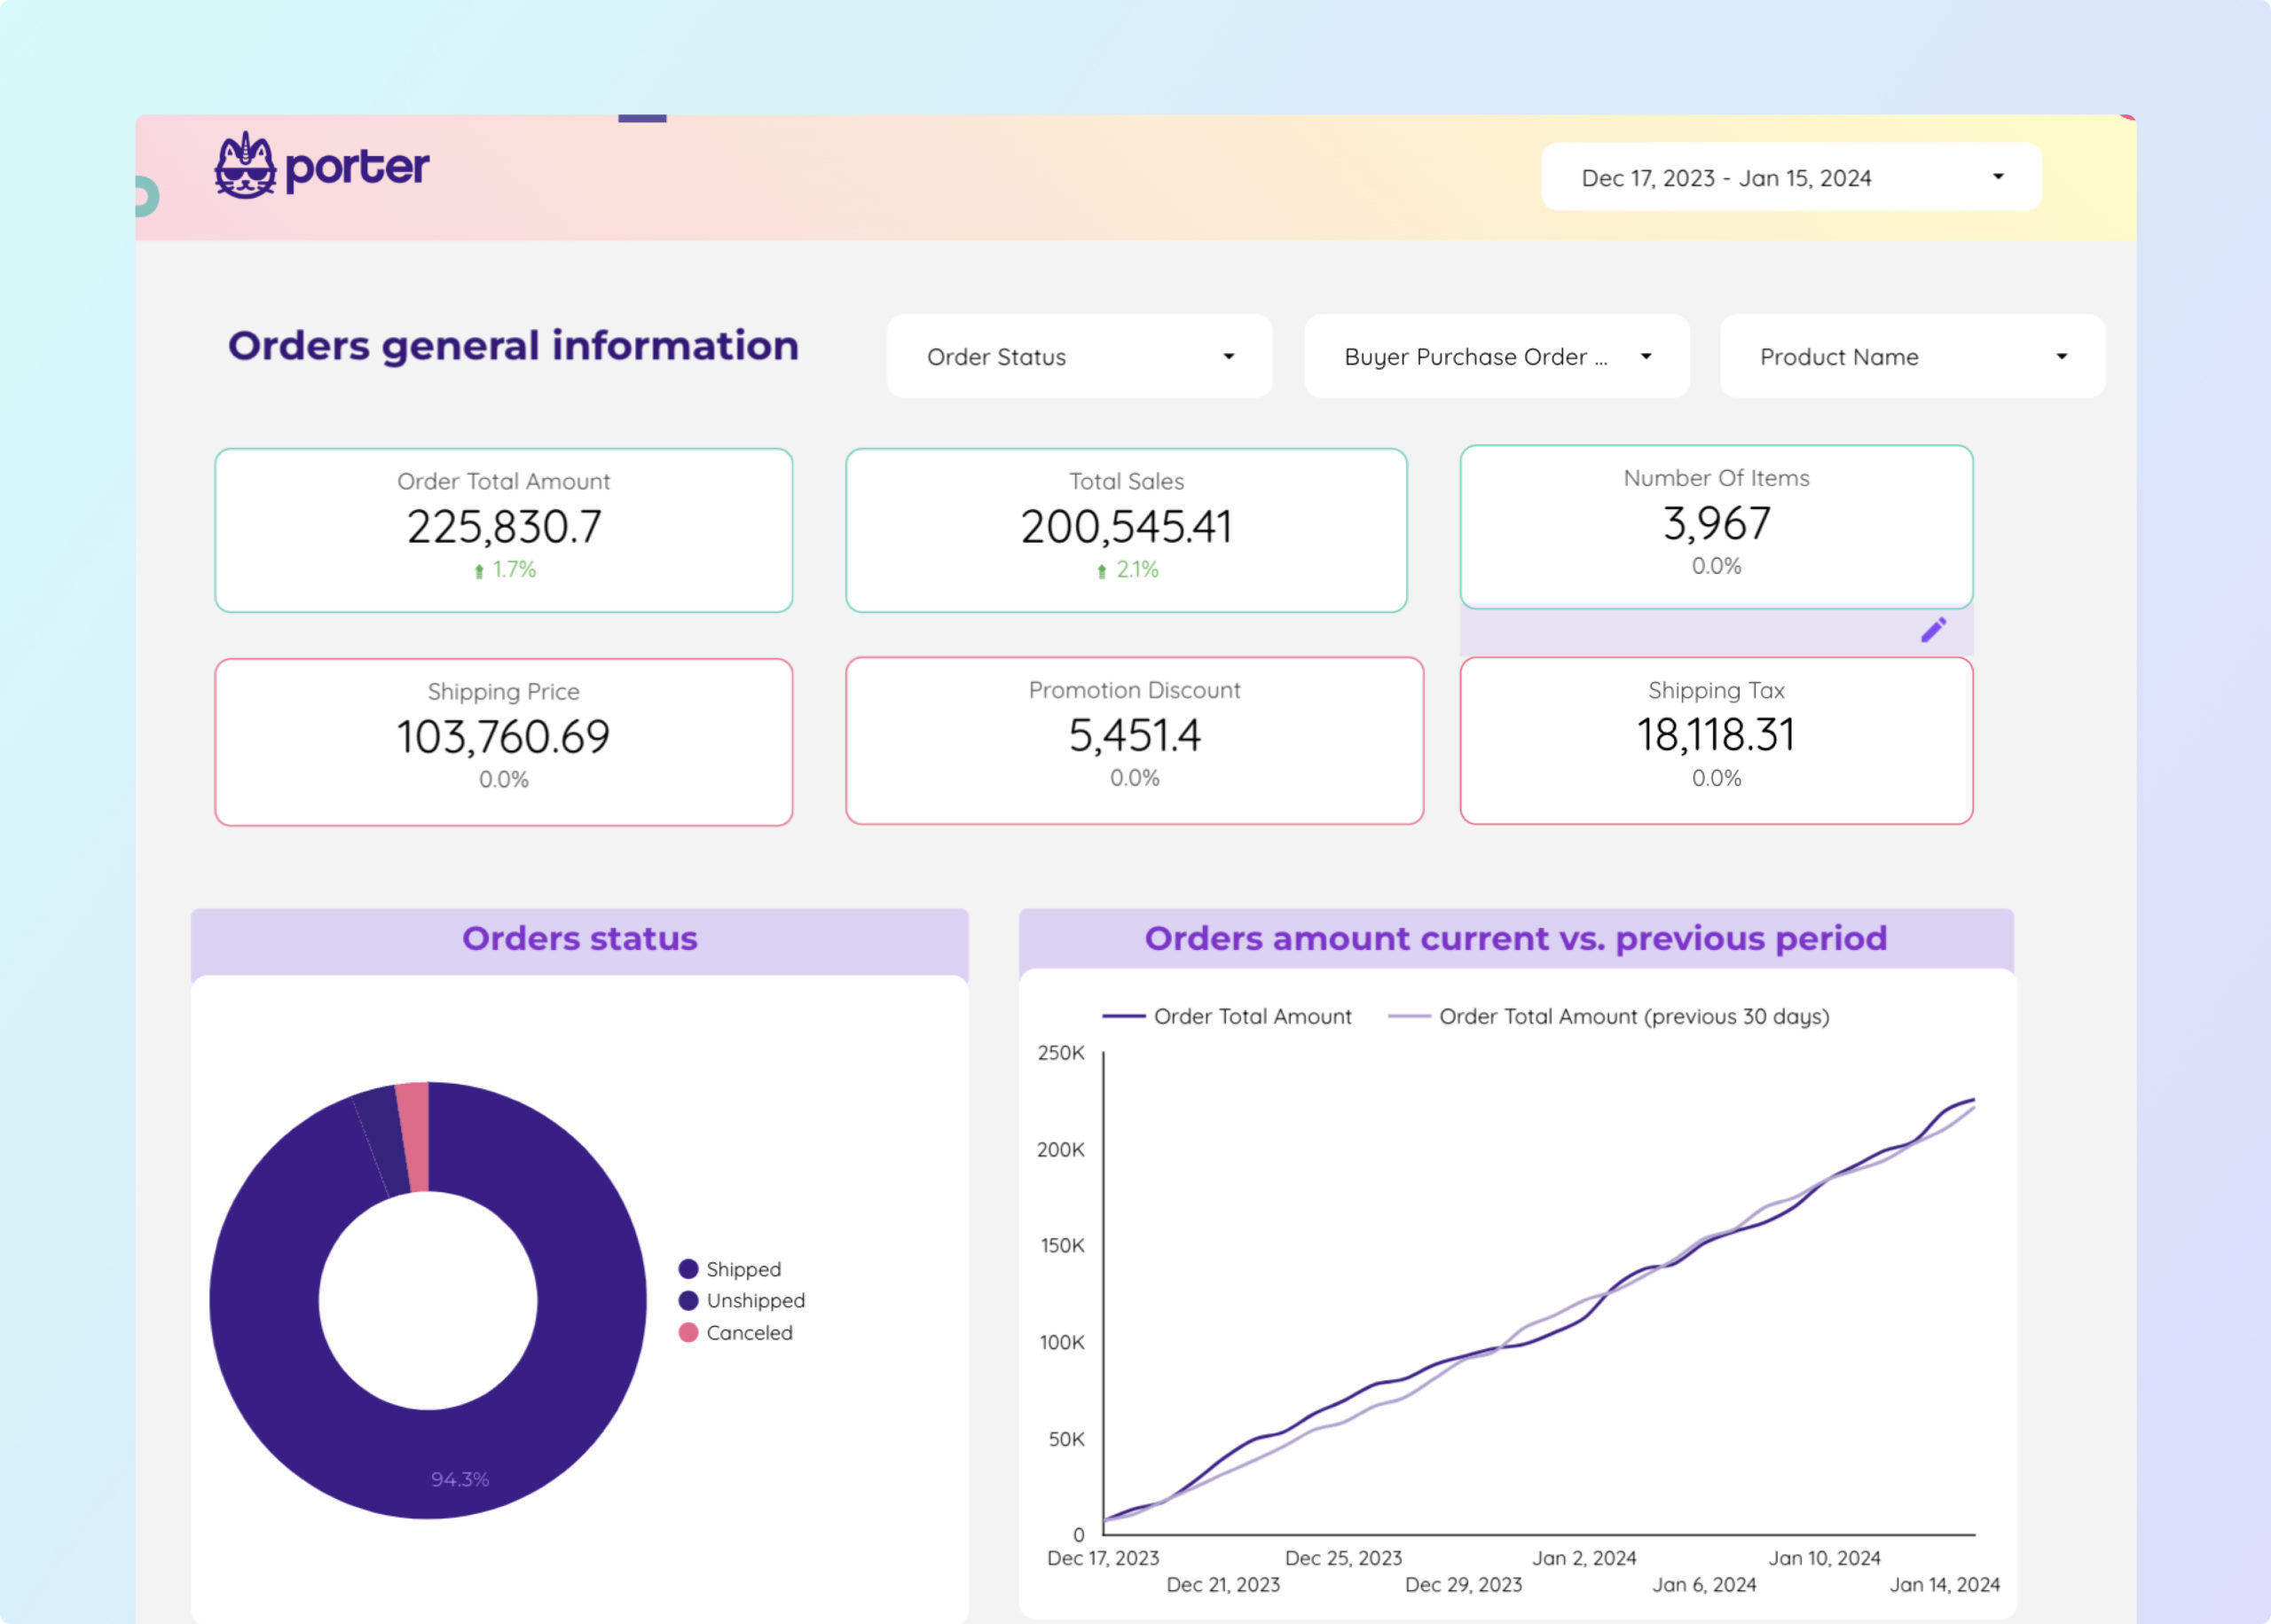
Sales Report template for Marketing teams and agencies
Optimize your strategy with this Sales report template. Track metrics like conversion rate, cost per conversion, and CTR. Analyze geographical, time, and demographic breakdowns. Ideal for E-commerce and B2B marketing teams to measure performance and achieve goals effectively.
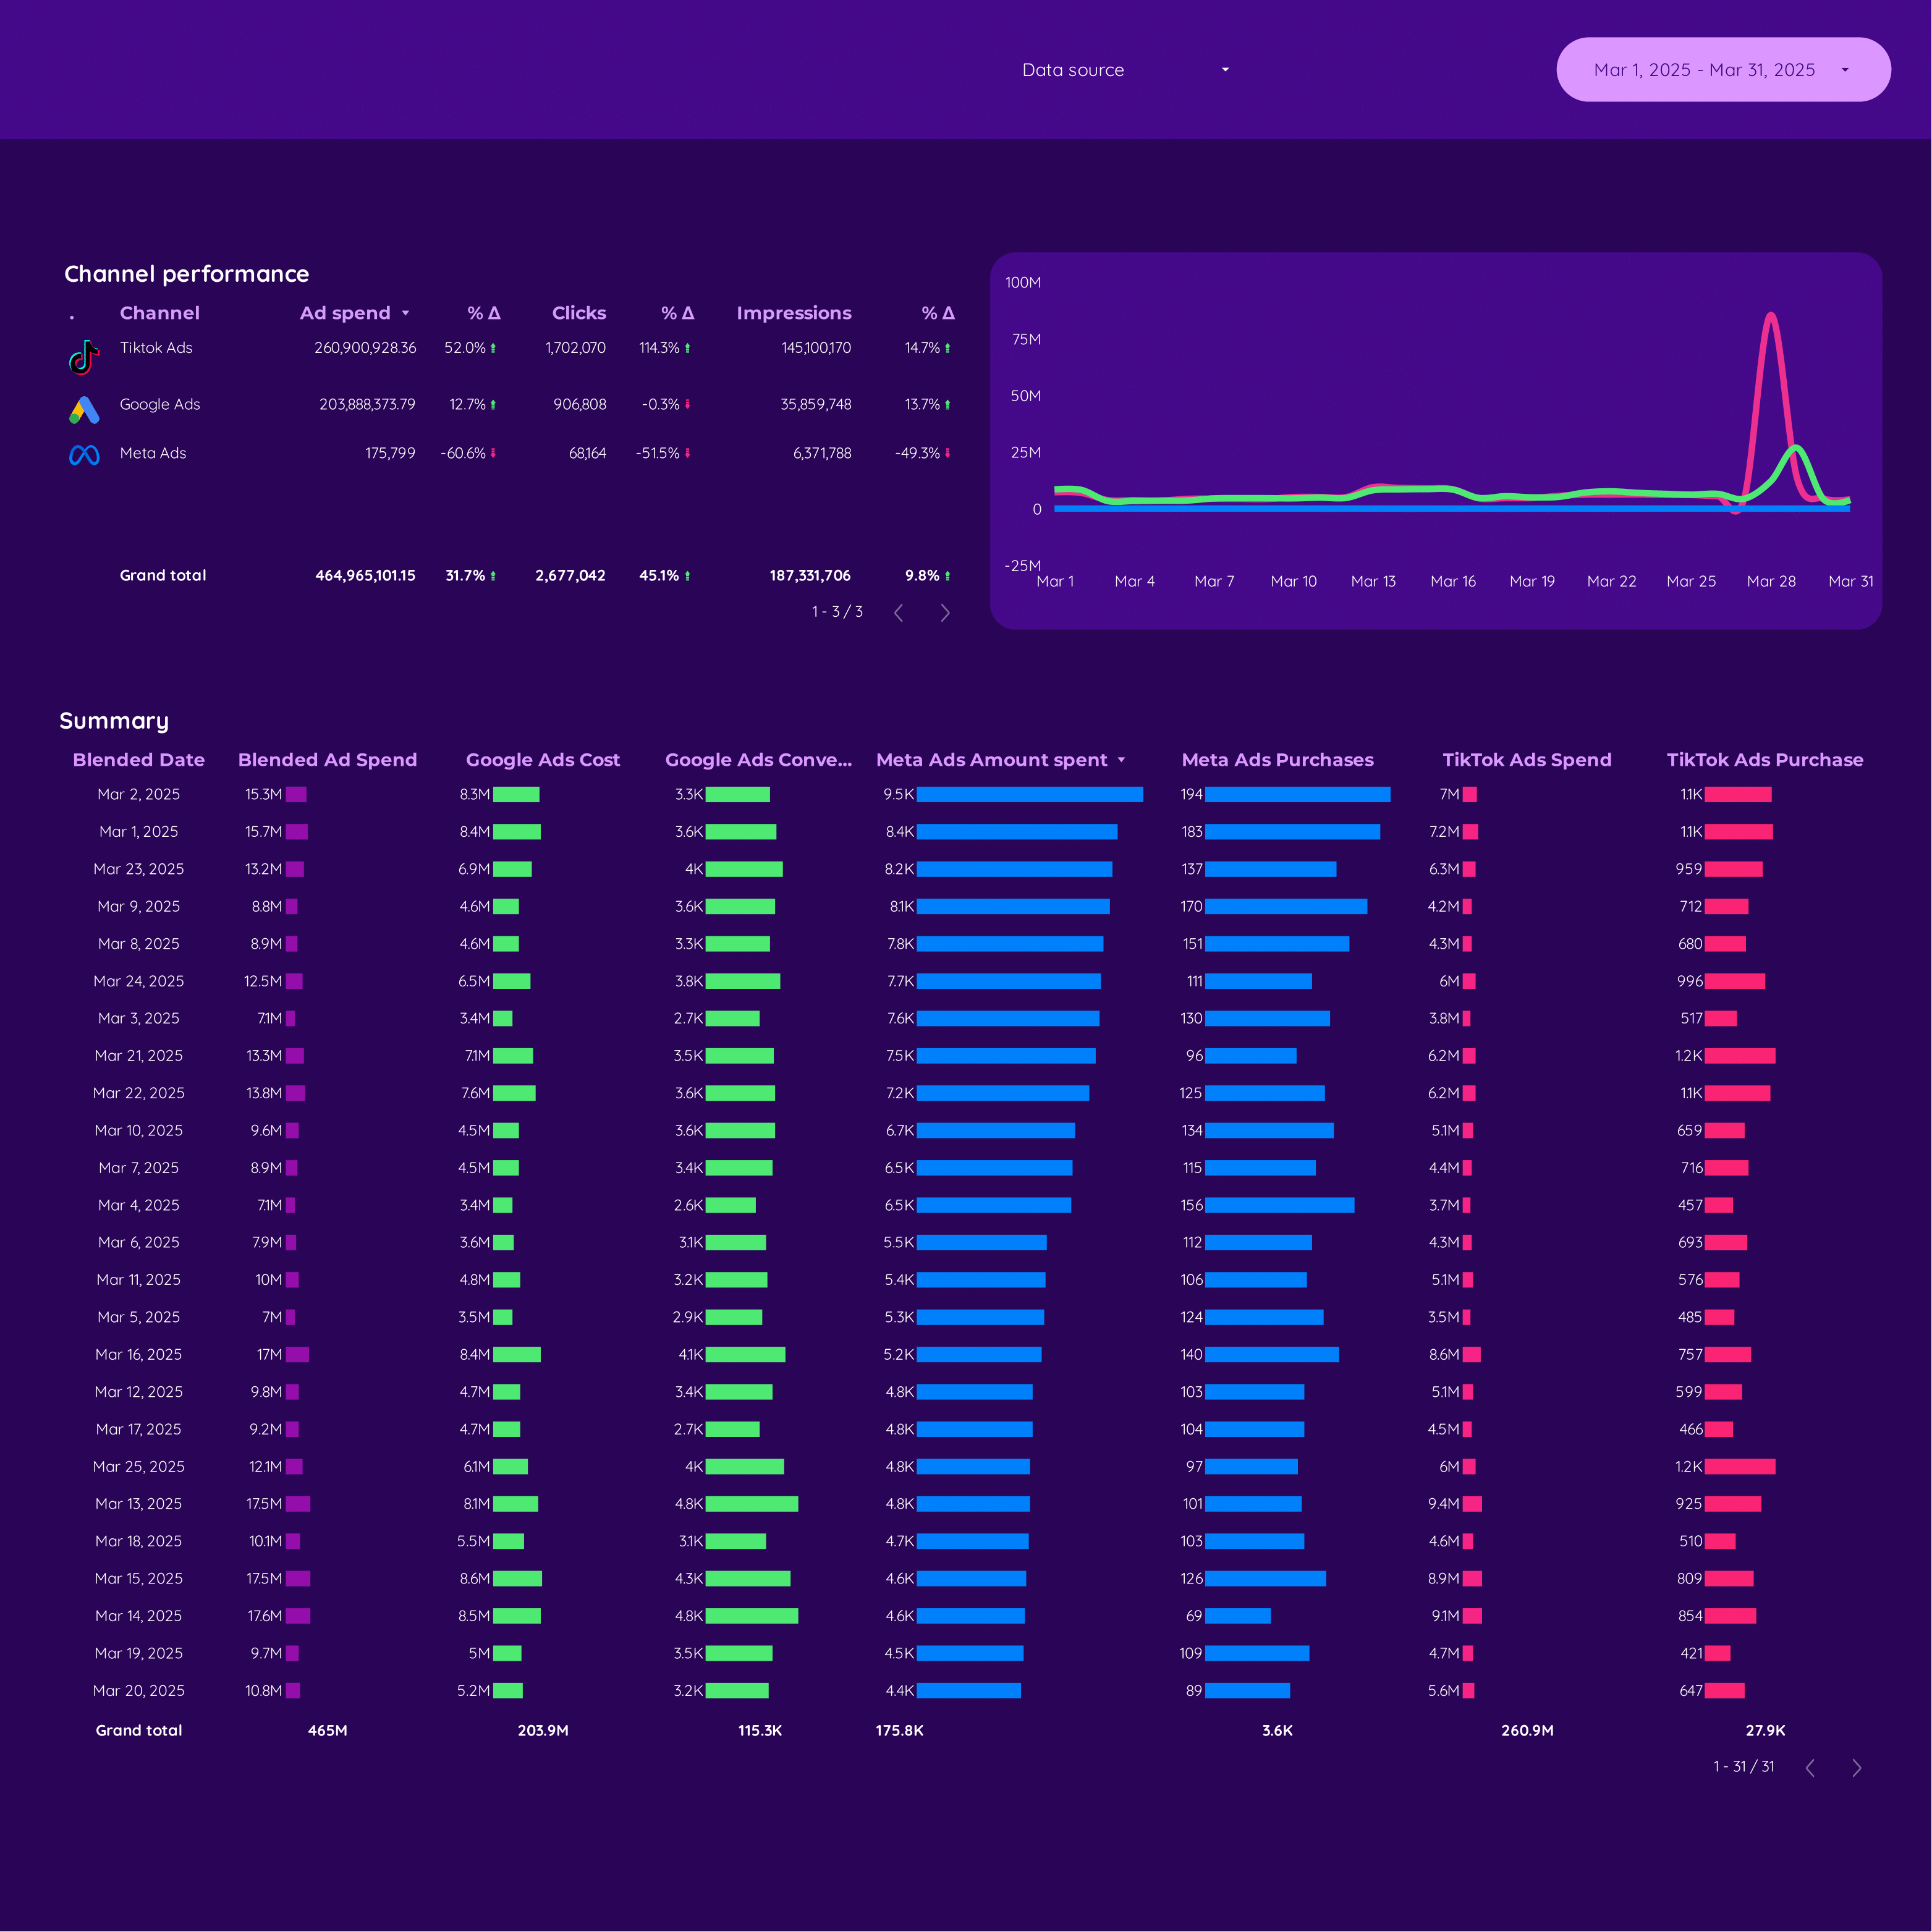
Paid media E-commerce Report template for Marketing teams and agencies
Track metrics like cost per conversion, ROAS, and CTR with the Paid media E-commerce report template. Analyze data from Google Analytics 4, Shopify, Google Ads, and Facebook Ads. Segment by audience, ad placement, and time. Perfect for marketing teams to measure performance and refine strategies.
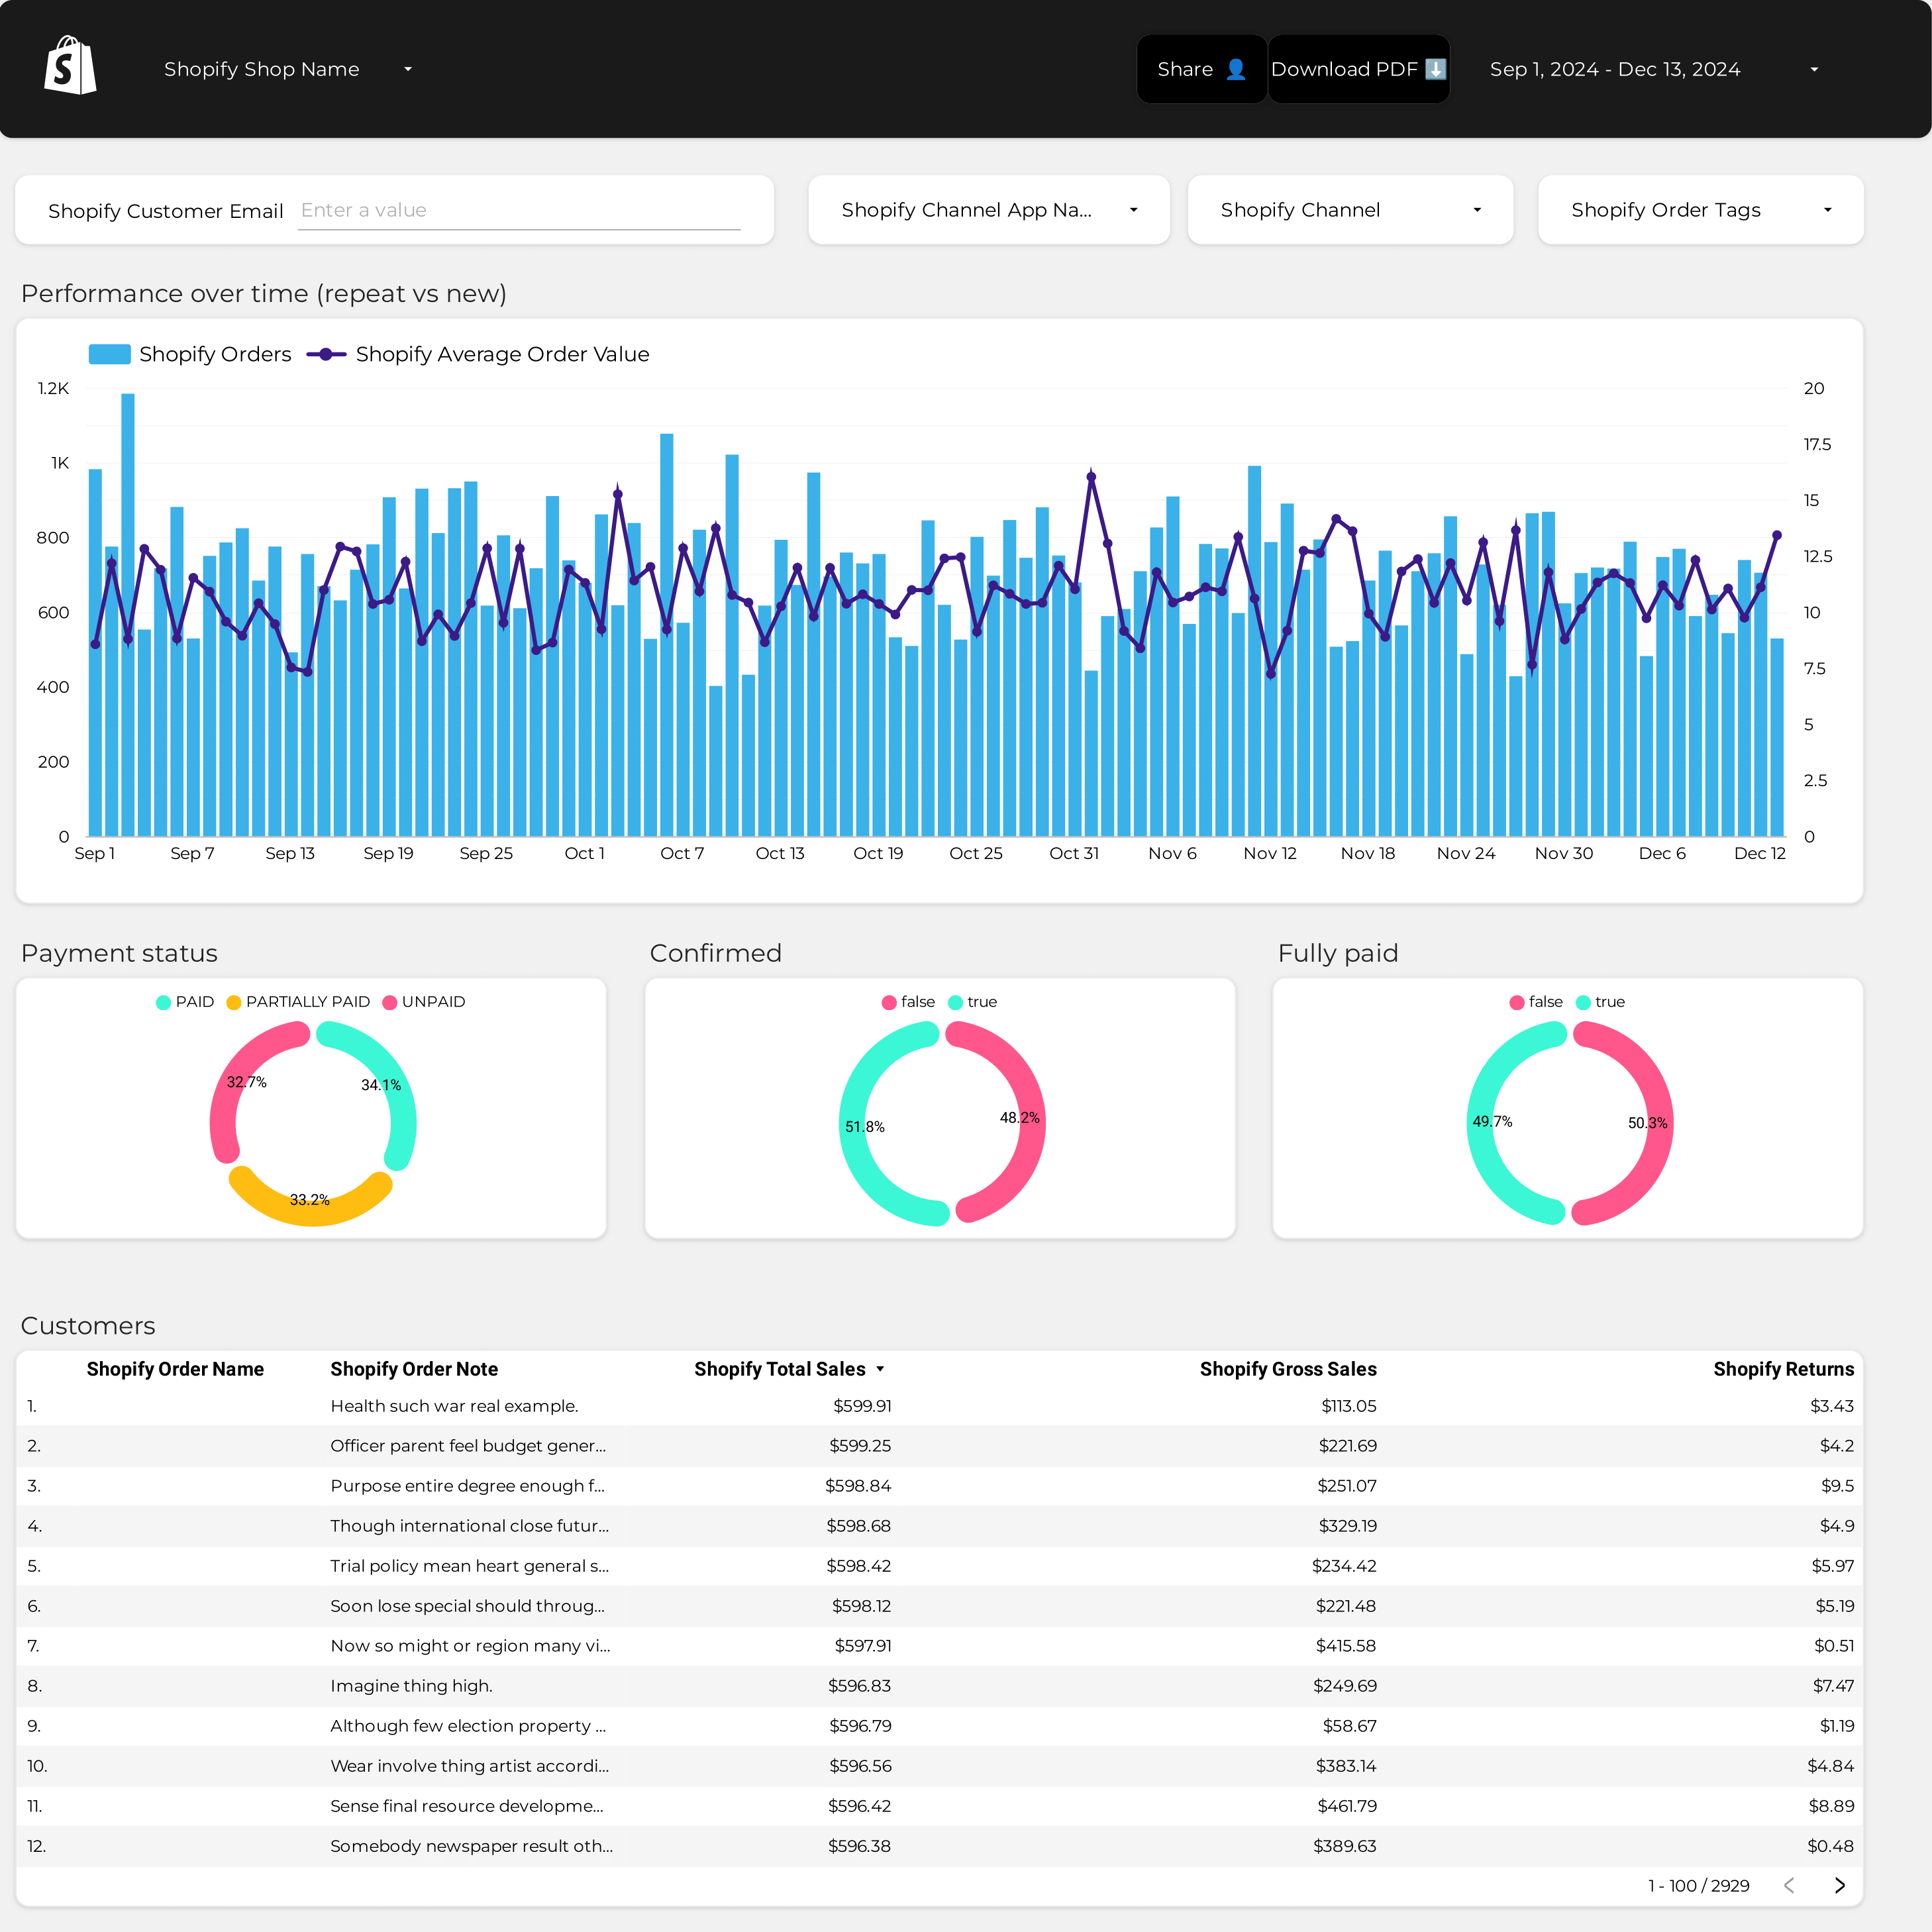
E-commerce Report template for Marketing teams and agencies
Optimize your strategy with this E-commerce report template. Track metrics like conversion rate, average order value, and CPA. Analyze dimensions by audience, channel, and time. Integrate data from E-commerce, Paid Media, and SEO. Ideal for marketing teams to measure performance and achieve goals effectively.
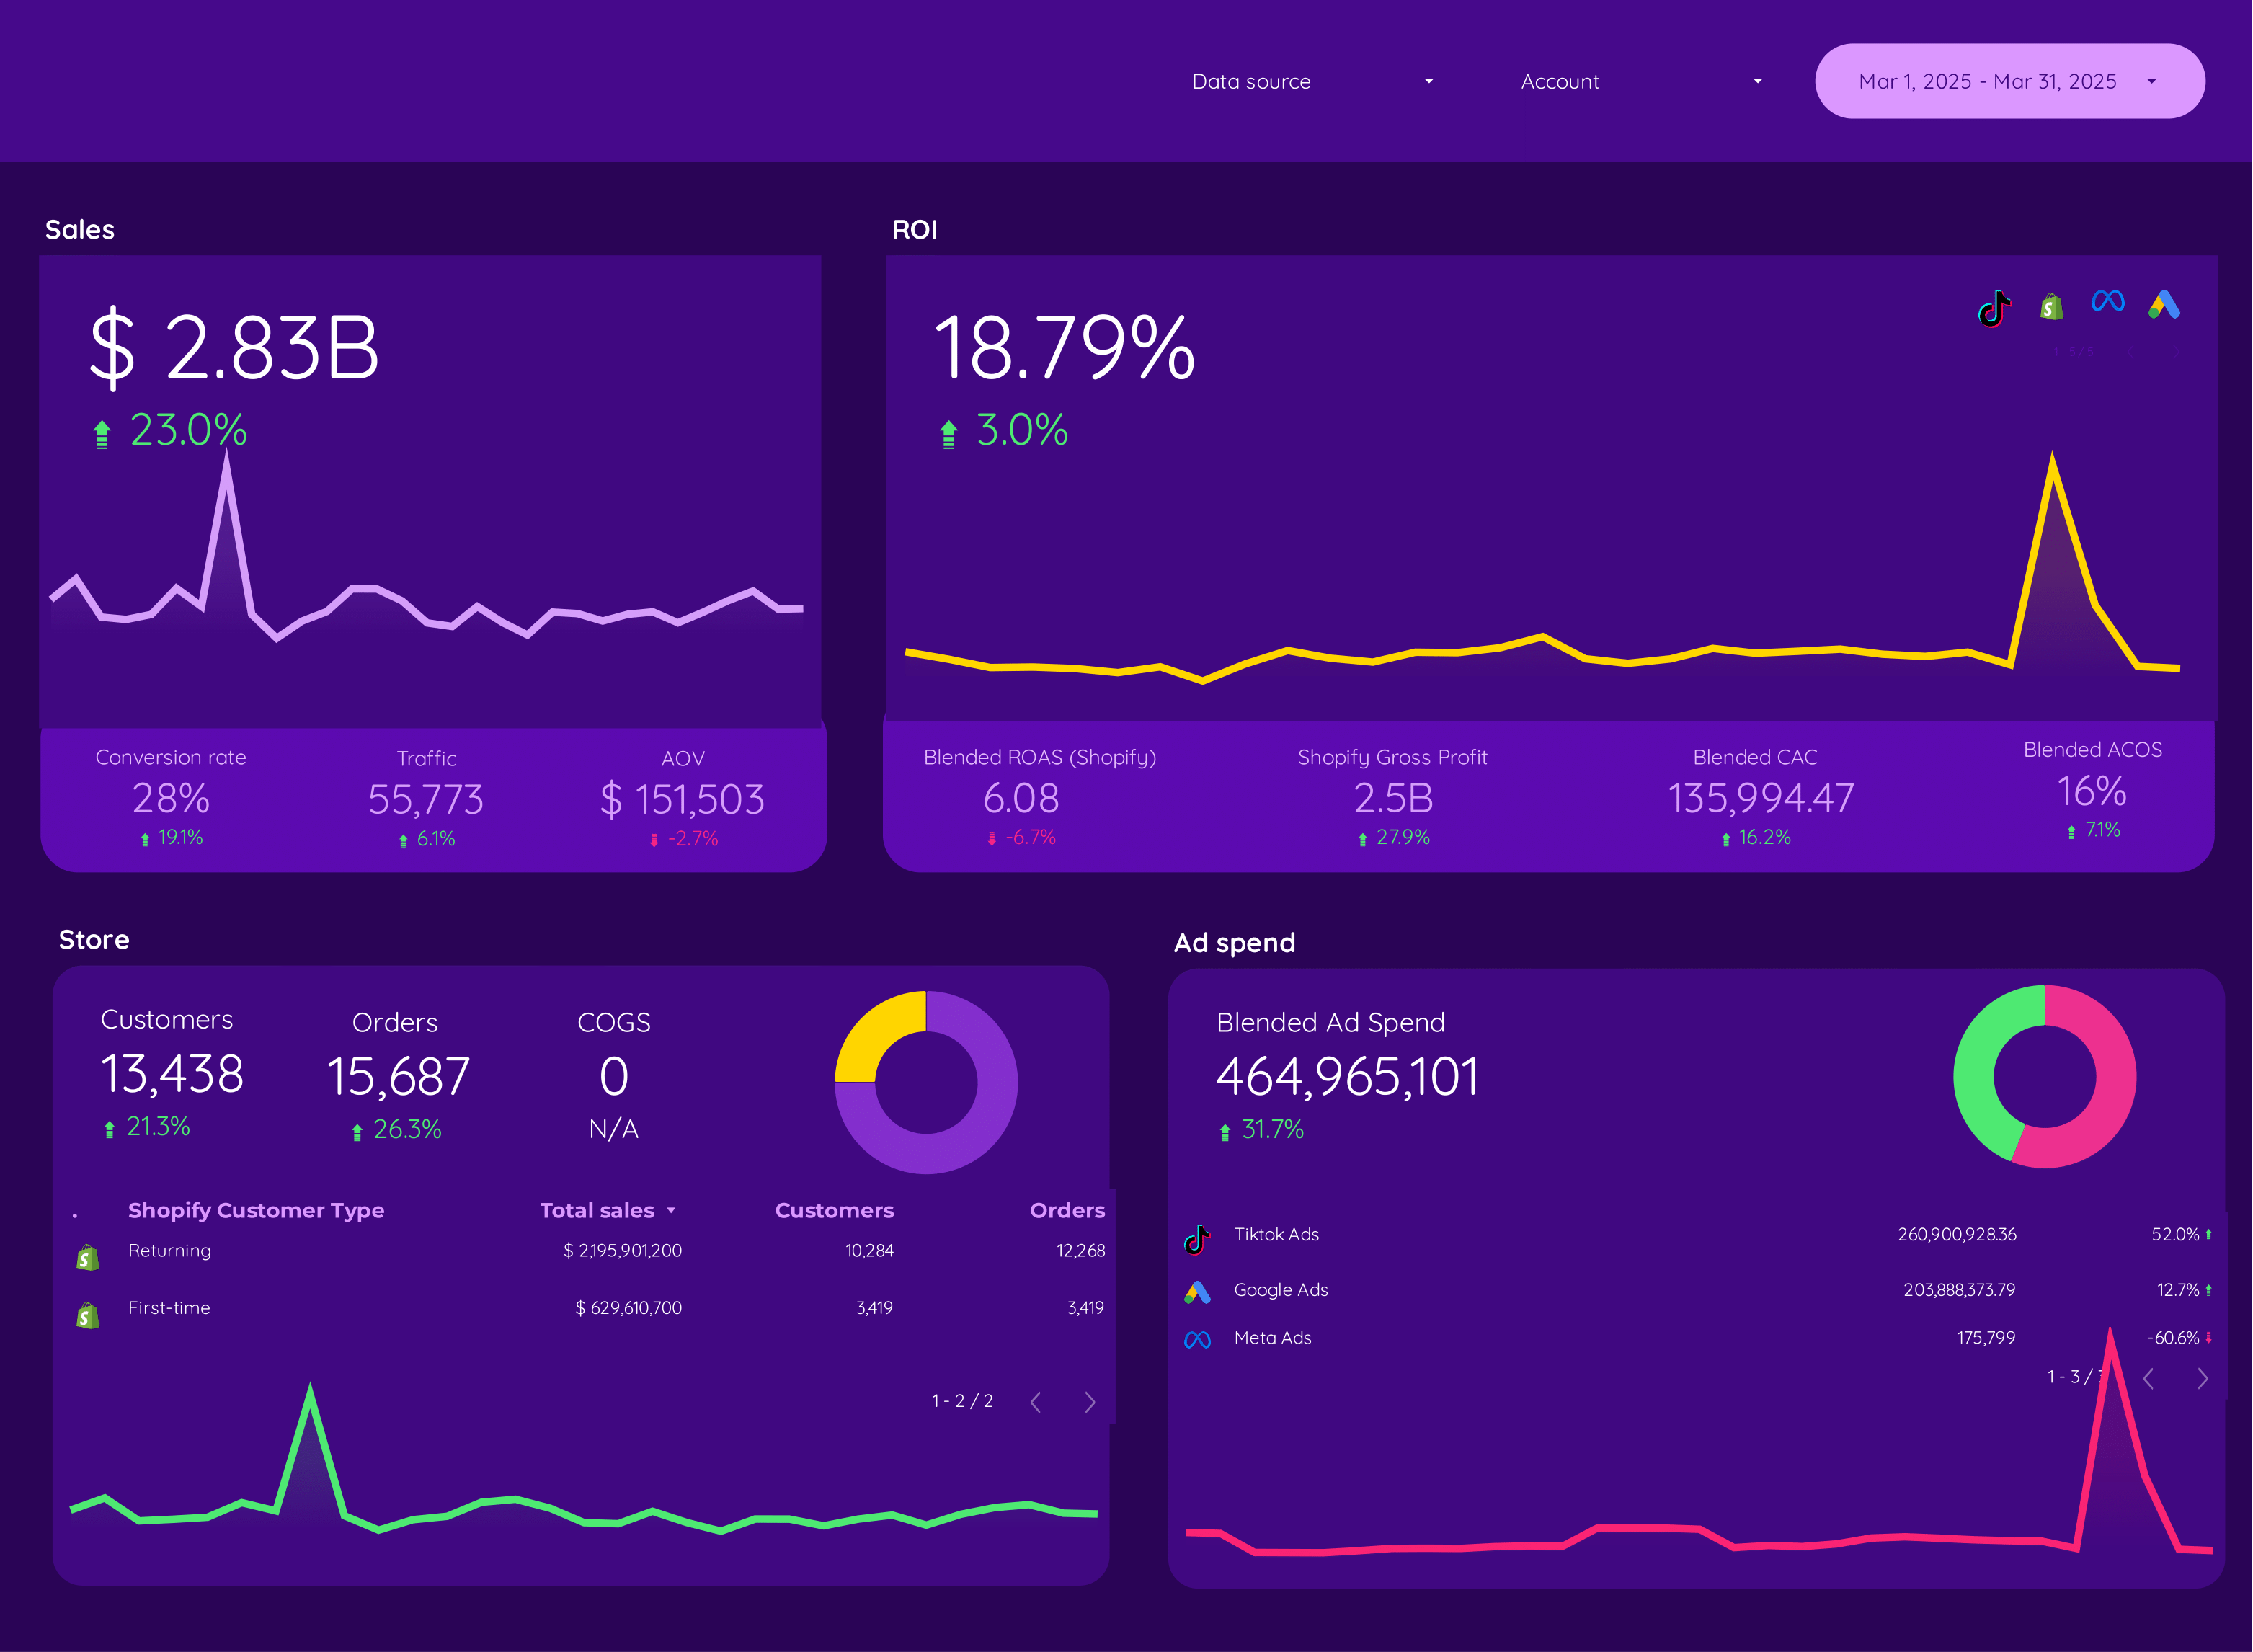
DTC Report template for Marketing teams and agencies
Optimize your strategy with this DTC report template. Track revenue, conversion rates, and cost per acquisition. Blend data from E-commerce, Google Analytics 4, Shopify, Google Ads, and Facebook Ads. Segment by demographics, behavior, and time. Perfect for marketing teams to measure key metrics and enhance E-commerce performance.
Dropshipping Report template for Marketing teams and agencies
Optimize your marketing strategy with this Dropshipping report template. Measure conversion rates, average order value, and customer lifetime value. Segment by demographics, interests, and time. Consolidate data from E-commerce, Google Analytics 4, Shopify, Google Ads, and Facebook Ads. Perfect for tracking key metrics and enhancing performance in the competitive e-commerce landscape.
AOV Report template for Marketing teams and agencies
Analyze key metrics with the AOV report template. Measure conversion rates, average order value, and CPC. Integrate data from E-commerce, Google Analytics 4, Shopify, Google Ads, and Facebook Ads. Segment by audience, campaign, and time. Perfect for marketing teams to track performance and refine strategies.
Amazon Seller Central Report template for Marketing teams and agencies
Analyze key metrics with this Amazon Seller Central report template. Track GMV, AOV, and CPA. Segment by demographics, ad format, and time. Perfect for e-commerce marketing teams to consolidate data from Amazon Seller Central. Optimize performance and refine strategies for targeted audiences. Measure success across platforms efficiently.