What is a social media competitors dashboard?
A social media competitors dashboard is an interface tool that consolidates data from multiple sources (e.g., Facebook, Instagram, Twitter) to track and display key performance indicators (KPIs) (e.g., engagement rate, follower growth, share of voice), enabling teams and agencies to monitor competitors' social media performance and create presentations for clients and executives.
Social media competitors dashboards are typically built using flexible tools like Google Looker Studio, Power BI, Google Sheets, or platform-specific solutions to enable high customization and integration of multiple data sources.
What to include in a social media competitors dashboard?
An actionable social media competitors dashboard balances context and specificity based on the audience (executives, managers, and analysts) and their use cases.
Executive social media competitors dashboards
Executive dashboards for CMOs, CEOs, and clients show the competitive landscape's impact. Reviewed weekly, monthly, or quarterly, they include:
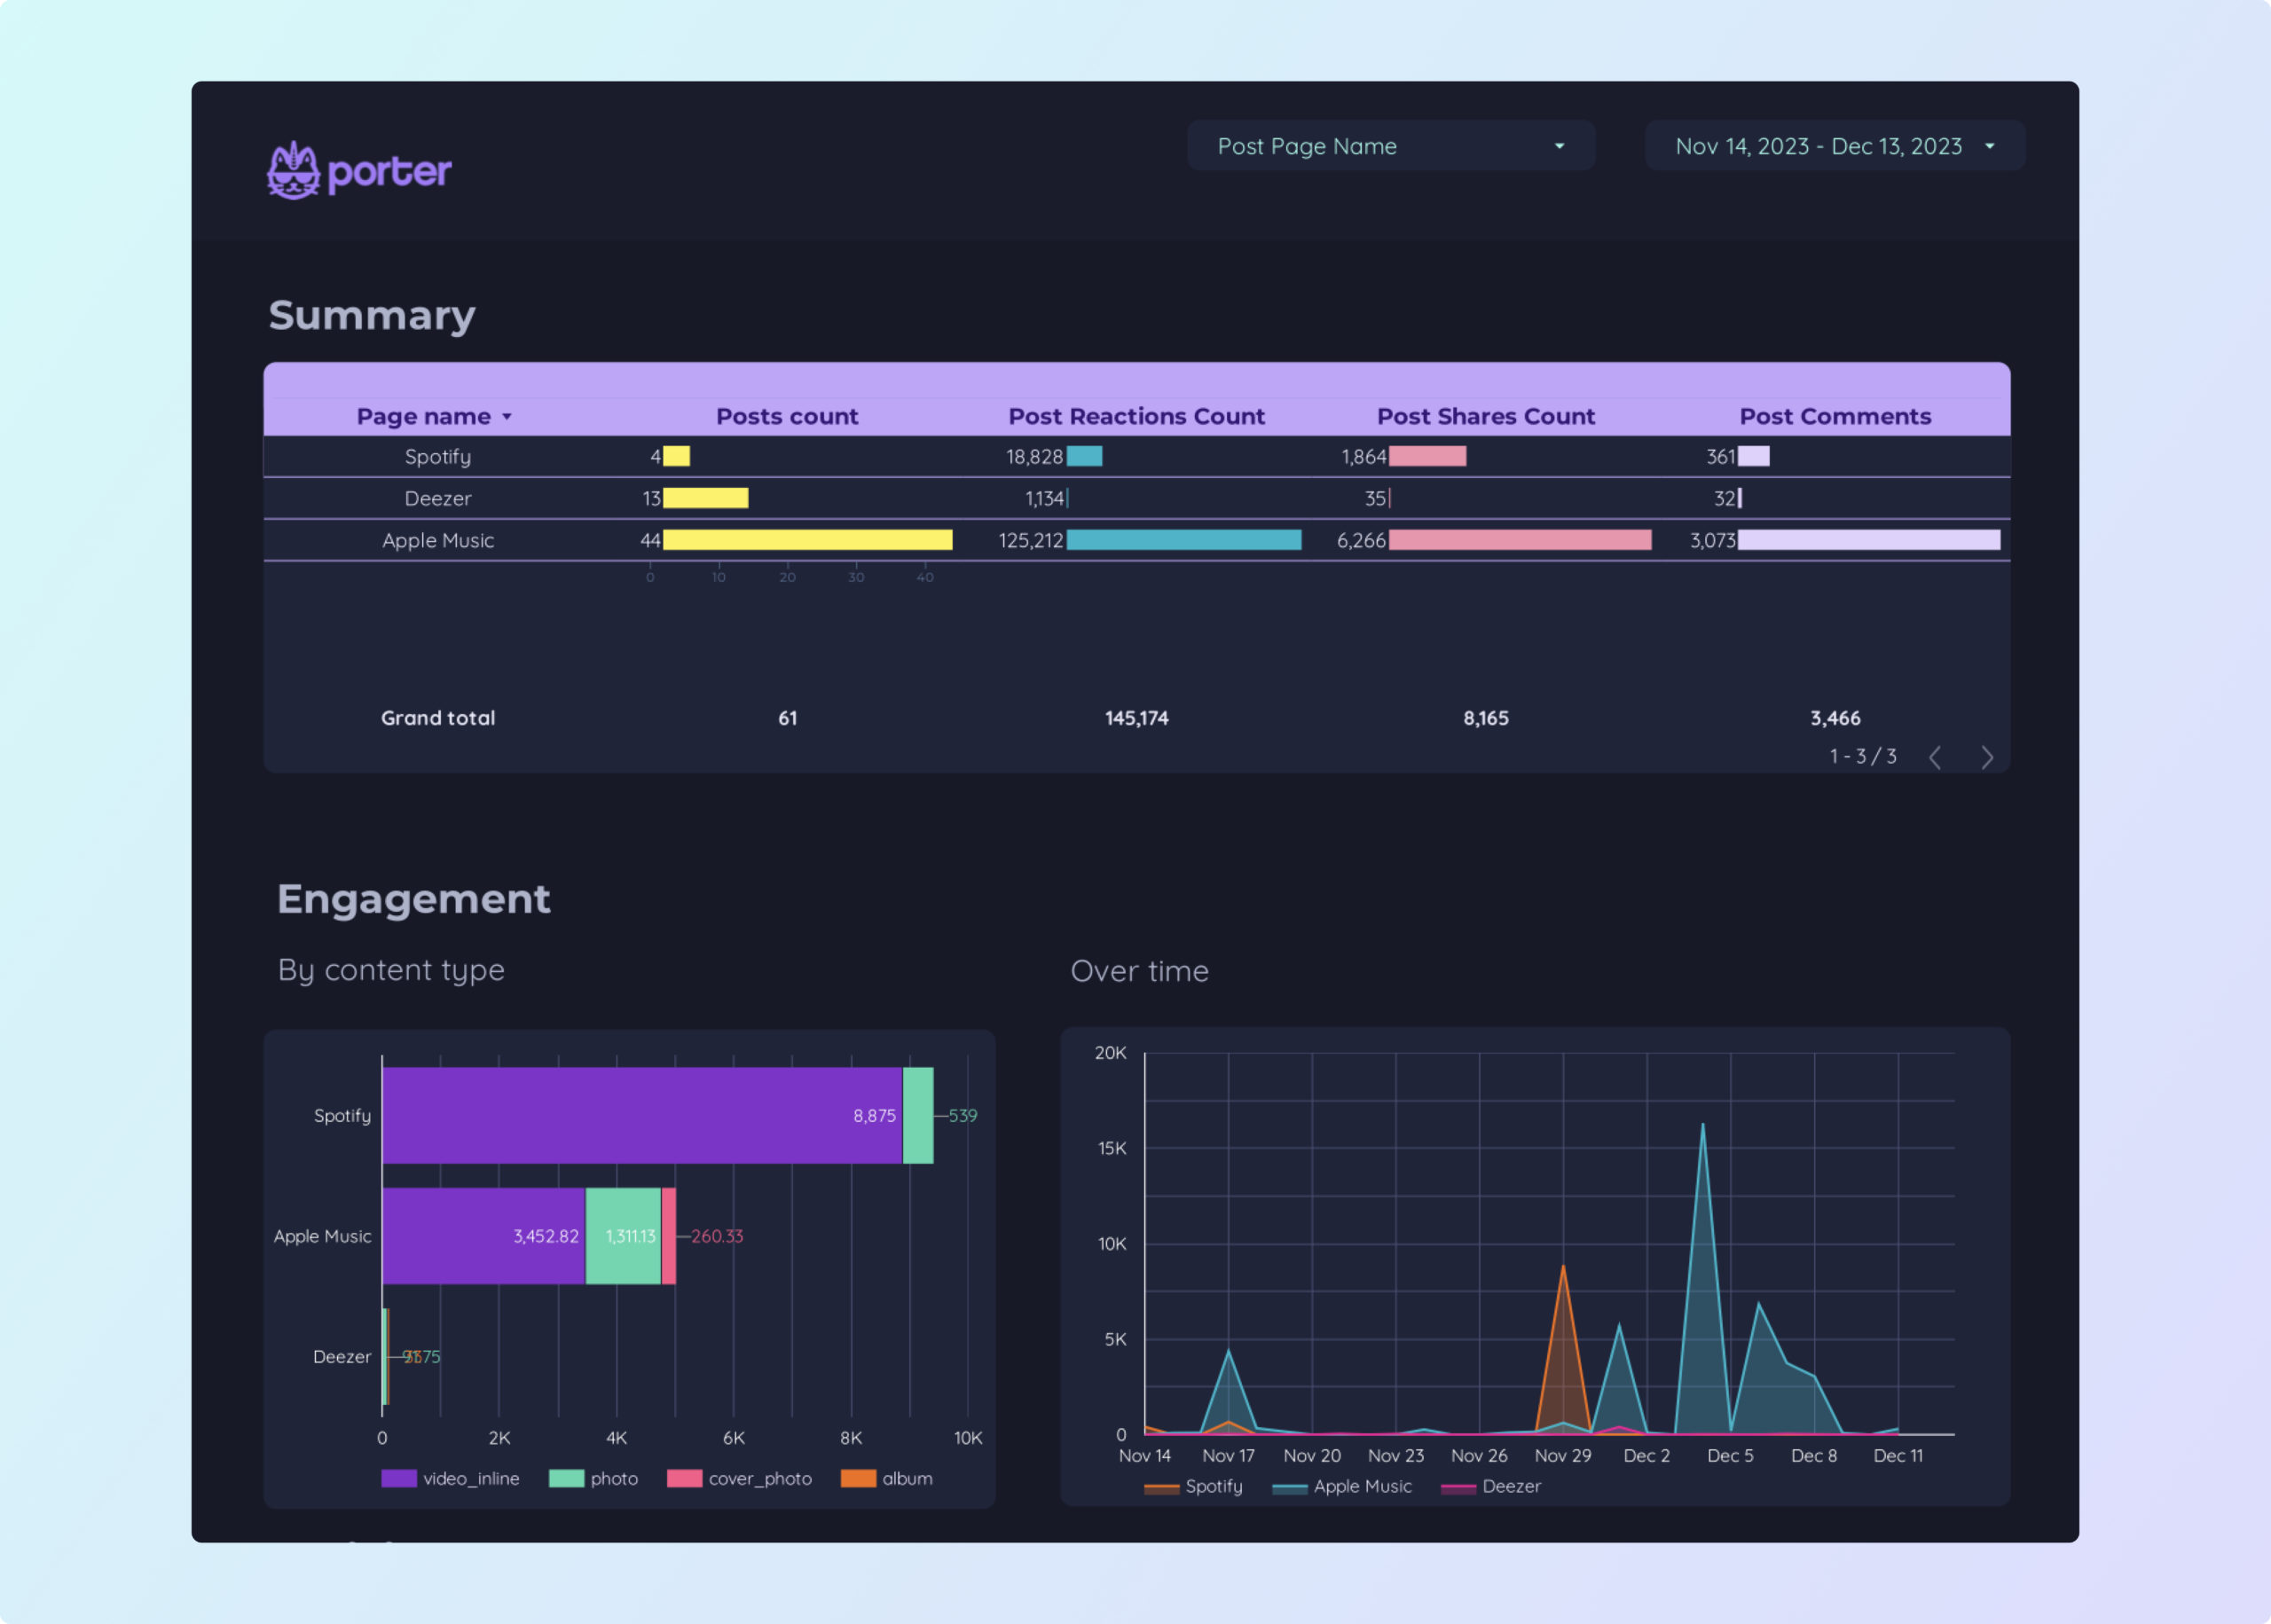
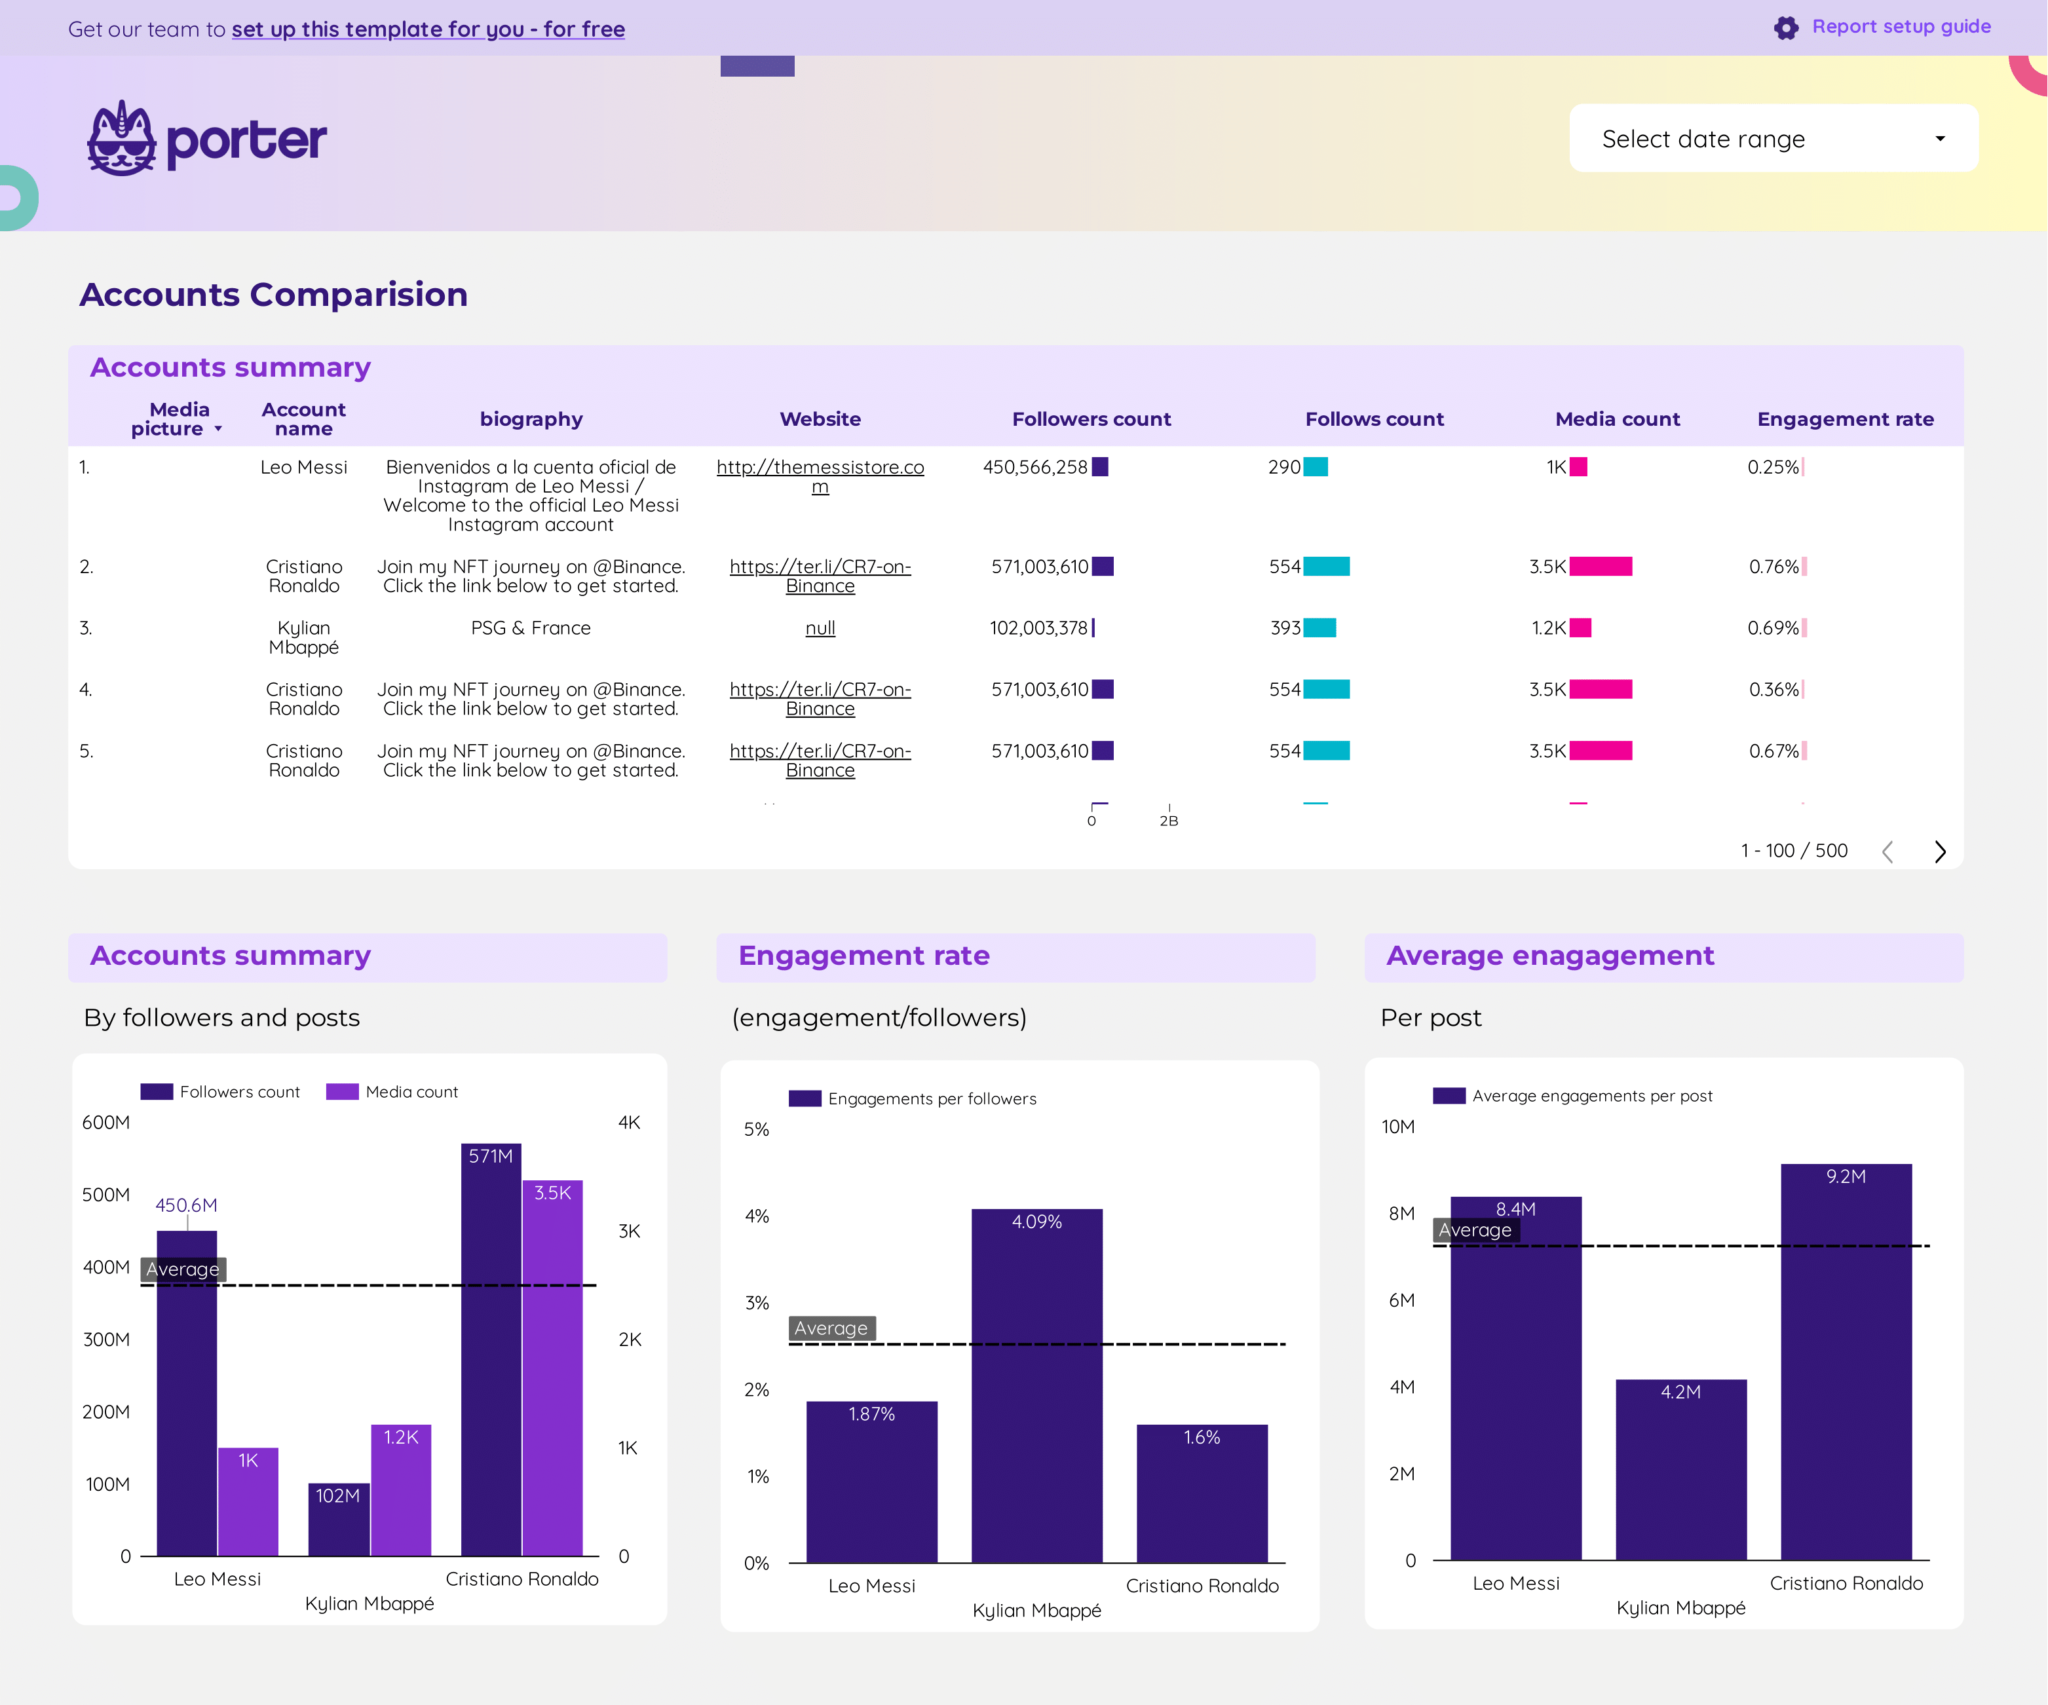
- Competitor performance analysis: by platform, using metrics like engagement rate and follower growth.
- Share of voice analysis: comparing brand mentions and visibility against competitors.
- Sentiment analysis: understanding public perception of competitors.
- Add text for additional context to translate metrics for non-technical audiences. Present in slide decks and simplified Looker Studio reports.
Social media manager dashboards
Manager dashboards have cross-platform views with drill-downs to see performance by competitor, region, and content type. They help align teams, define tactics, and include:
- Cross-platform reporting: overall competitor performance across social media platforms.
- Trend tracking: compare current trends vs competitors.
- Content strategy analysis for identifying successful content types and topics.
- Audience engagement analysis for understanding competitor audience interactions.
Operational Social Media Dashboards
Operational dashboards for analysts and social media managers have granular, customizable KPIs to solve technical issues. Monitored hourly, daily, or weekly, they cover:
- Engagement: likes, comments, shares, engagement rate.
- Follower metrics: growth, demographics, interests.
- Content performance: top-performing posts, hashtags, and topics.
- Sentiment: positive, negative, neutral mentions.
Operational social media dashboards are highly customized, built in flexible tools like Google Sheets or Looker Studio to enable data cleaning, blending, annotations, and integrating multiple sources.
How to build a social media competitors dashboard?
To build a social media competitors dashboard, connect your data sources, choose a template on Looker Studio or Sheets, build your queries by selecting metrics and dimensions, choose charts to visualize your data, customize the dashboard, design and share via link, PDF or email.
Here’s the breakdown:
Connect data sources
Define and connect the data sources to bring to your dashboard. Common sources are Facebook, Instagram, Twitter for social media performance, and social listening tools for sentiment analysis.
To connect your data sources, go to portermetrics.com, choose the data sources to bring to your dashboard.
You can follow these tutorials on connecting your data:
Choose a template
Choose from dozens of social media competitors dashboard templates in Google Sheets or Looker Studio, designed for use cases like engagement monitoring, follower growth tracking, and sentiment analysis.
Learn to copy Looker Studio templates.
While templates are the starting point. Make them specific for your business or agency. Map your specific metrics, especially custom engagement metrics, competitor analysis data, and all the fields and metrics that you define as "engagement" and "reach".
Depending on your reporting tool—Google Sheets or Google Looker Studio, pick any of the dozens of templates created by our team and customers to solve your social media reporting use cases, such as engagement monitoring, follower growth tracking, and sentiment analysis.
Select metrics, dimensions, and charts
Once your dashboard template is downloaded, you may 1)modify it or 2) create a blank page to build it from scratch. Whatever the case, setting up a query always follows these steps:
- Select the data source and the account connected to it
- Choose metrics (e.g. Engagement rate, follower growth, mentions, etc.).
- Choose breakdowns to segment your data (e.g. by date, platform, content type, etc.)
You can follow these tutorials on adding data to your dashboards
Design
To make your social media competitors dashboards truly white-label you can add logos, colors, fonts, and styling to mirror your brand.
Follow these tutorials to design your social media dashboards:
Share
Share your social media dashboards via links, PDF, schedule emails, and control permissions.
KPIs to include in a social media competitors dashboard?
Social media competitors dashboards should include a mix of visibility, engagement, sentiment, and share of voice metrics and KPIs to fully understand the performance of competitors' social media strategies. They include:
Social media KPIs measure the competitive landscape across platforms:
- Visibility metrics: impressions, reach, follower count
- Engagement metrics: likes, comments, shares, engagement rate
- Sentiment metrics: positive, negative, neutral mentions
Efficiency KPIs compare your social media outputs to the cost, including:
- Visibility: CPM (Cost per Mille)
- Engagement: CPC (Cost per Click)
- Conversion: CPA (Cost per Acquisition), CPP (Cost per Purchase)
Effectiveness KPIs compare the input with the output from one stage to another
- Visibility: Frequency
- Engagement: CTR, engagement rate
- Conversion: Conversion rate
To analyze these social media KPIs, segment them by:
- Platform: Facebook, Instagram, Twitter
- Time: Hourly, daily, weekly, monthly
- Content: type, topic, hashtag
- Audience: geo, demographics, interests, behavior