Data Studio (now Looker Studio) is a free tool from Google that allows you to create beautiful dashboards using data from various sources.
The dashboard feature lets you create interactive dashboards that allow you to share information with your team or clients easily. You can also use this tool to create custom dashboards for your eCommerce business.
In this article, we’ll highlight some important metrics to track in your eCommerce business and some top Google Data Studio dashboard examples for eCommerce businesses that can help you get started with your reporting tasks.

Important Metrics to Track in Your eCommerce Businesses
Access to valuable and actionable data is essential to improve your eCommerce store’s performance.
But, with so many metrics available to track, it may take a lot of work to choose the ones that will help you make better decisions that’ll positively impact your business.
However, we’ve compiled a list of some of the most important metrics to track in your eCommerce business:
1. Transactions and orders
These two metrics are crucial to your eCommerce business and will answer questions like how many orders or transactions does your eCommerce store process in a day, a week, a month, or a specified time frame?
2. Sales volume and trends
Sales volume refers to the number of units sold by your business during a particular period. Unlike total sales, the sales volume metric offers insight into the number of products sold rather than monetary gain.
It allows you to track marketing campaigns’ performance, evaluate sales representatives’ efforts, and pick the best places for physical stores.
According to Investopedia, a trend is the overall direction of a market or an asset’s price. These metrics show how much money has been generated from sales in the current month.
You can also analyze daily trends to compare with your sales goals and take action to reach them.
3. Conversion to customers
Conversion to customers measures how successful your sales effort moves contacts down the funnel to paying customers.
If this number increases over time, you can assume that your contacts are generally high quality and fit your product and that your sales strategy is proving effective.
4. Amount per transaction
Amount per transaction (or cost per transaction) is the average cost of a single transaction. This is calculated by dividing the total cost of all transactions by the total number of transactions.
This metric will help track each customer’s average dollar amount on a sale. For instance, if you had 100 transactions and your total cost was $1,500, your amount (or cost) per transaction would be $15.
5. Best-selling products
Best-selling products are top-rated, and many of them have been sold. This metric will highlight your most popular products in terms of volume and revenue in a given period.
Google Data Studio Dashboard Examples
As an eCommerce business, you probably deal with mountains of data daily. You must be able to quickly and intuitively access and make sense of this data.
Having the right data visualizations in your dashboard could make or break your reporting efforts. The following are some top data studio dashboard examples:
1. PPC Dashboard
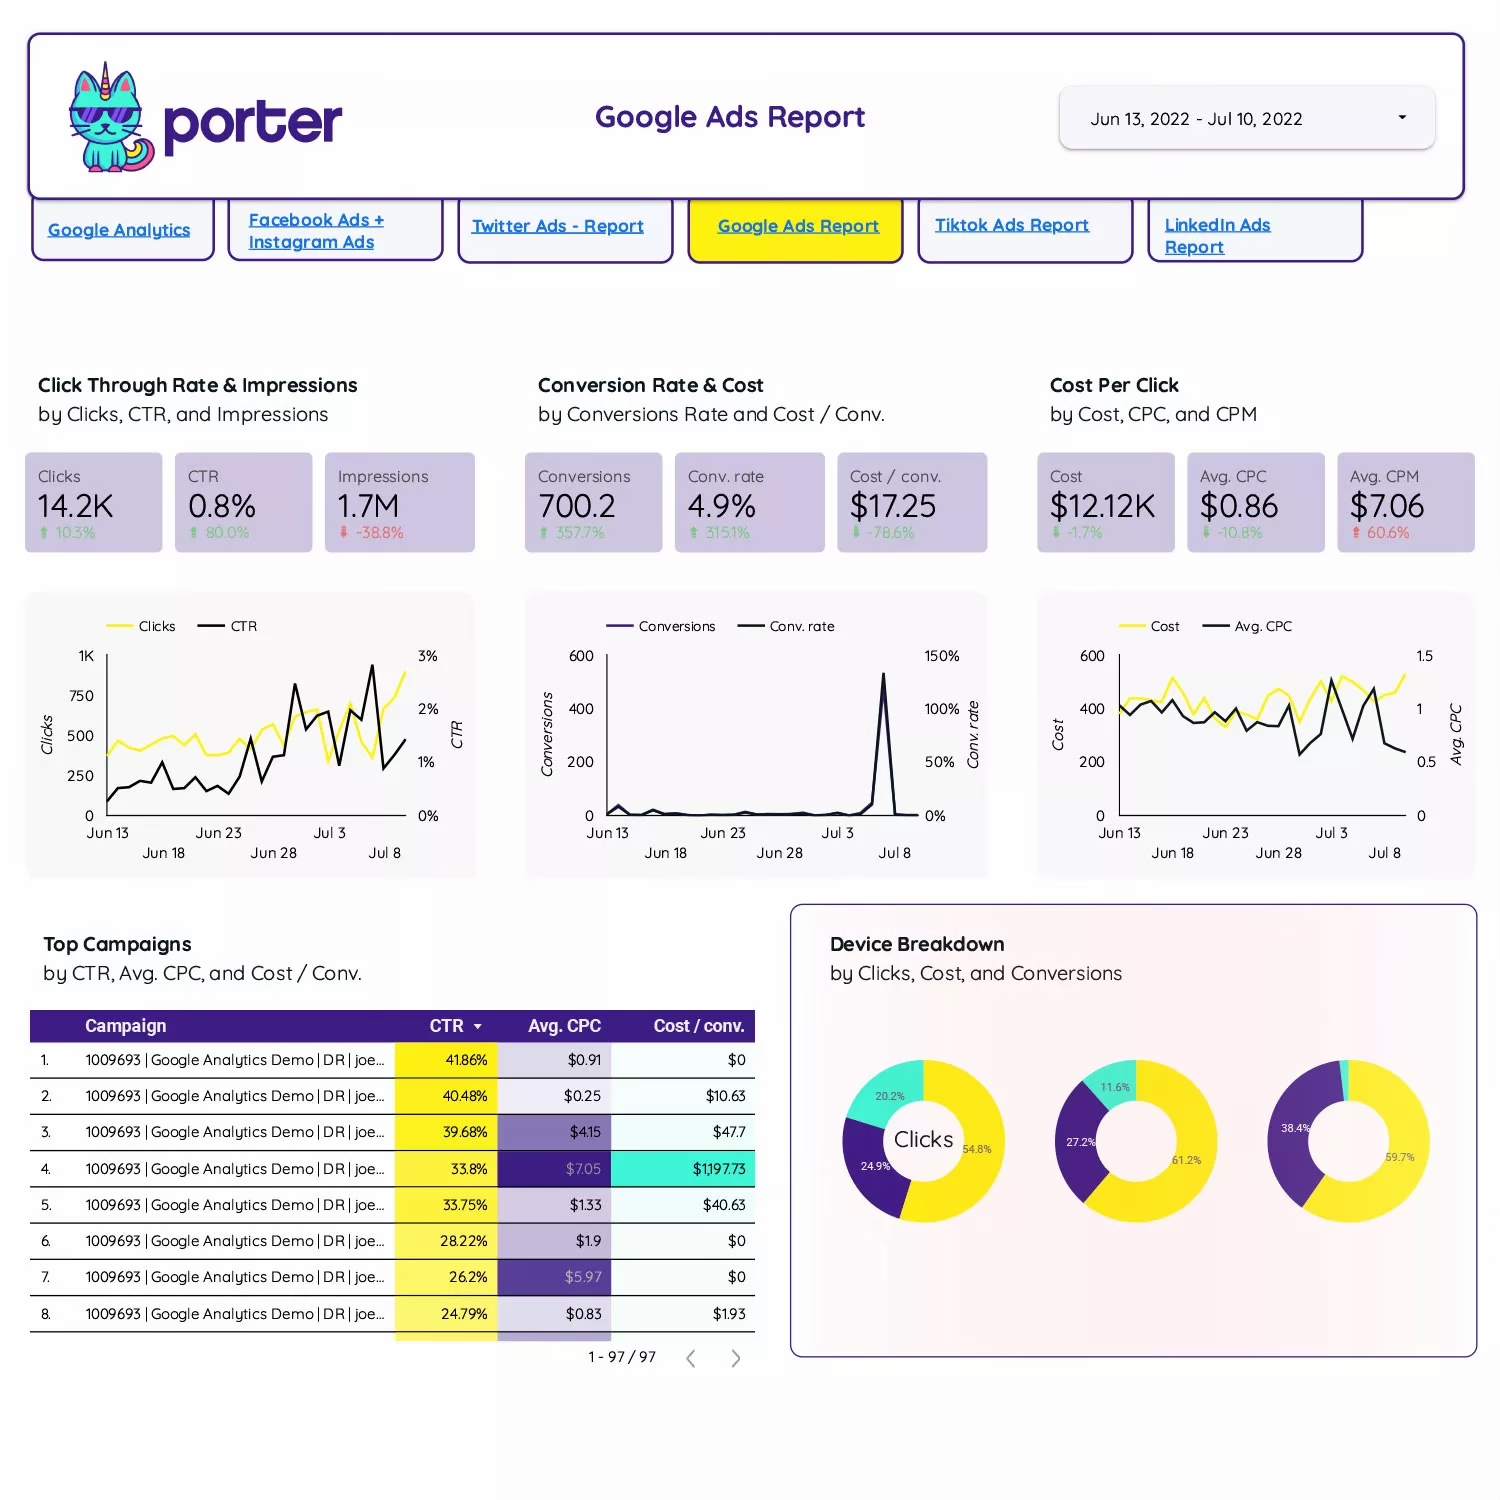

Developed by Porter Metrics | Get Dashboard
This integrated dashboard pulls your data from paid media platforms such as Facebook, Google Ads, Tiktok Ads, and Twitter ads.
With this dashboard, you can track your website traffic performance and start distributing your PPC budgets more efficiently.
If you’re new to PPC reporting, check out this article on How to Create a PPC Dashboard on Google Data Studio, and you can also check for other PPC reporting templates and dashboards on the PPC Report Template page.
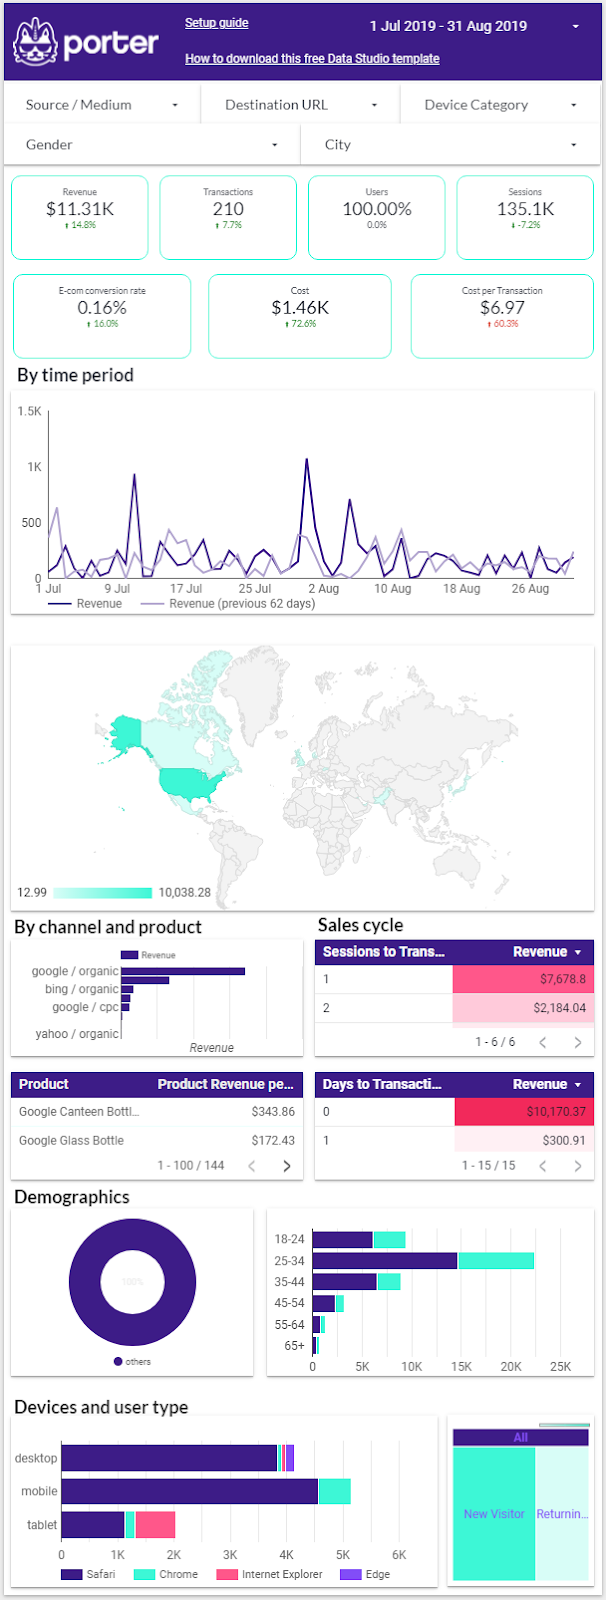
2. The Aro Digital eCommerce Dashboard
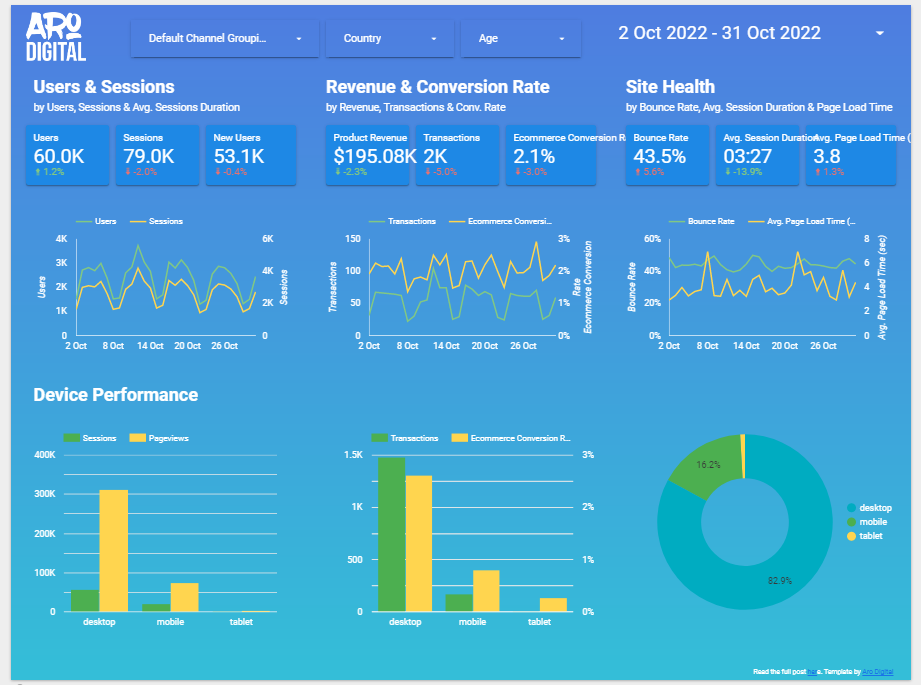
Developed By: Aro Digital | Get Dashboard
Although the Aro Digital template is more general, it contains a wealth of information on eCommerce transactions.
The template is connected to four data sources: Google Ads, Search Console, Facebook Ads, and GA (Google Analytics). It’s excellent for clearly understanding your eCommerce site’s most important traffic sources.
The template has a good selection of KPIs and is well-designed. As a result, you can segment your data based on a particular location, channel, or demographic.
The template has 4 pages and covers the most critical search marketing components that an eCommerce website manager wants to see.
3. eCommerce Product Performance Dashboard

Developed by Porter Metrics | Get Dashboard
Right here, for free and on one Shopify Google Data Studio template, we offer you the opportunity to see a lot more than customers who frequently purchase from your store.
On this template, you’ll find insights you need to grow your revenue and outsmart your competitors to gain new insights to become a thought leader and a giant in your space.
You should also check out some other eCommerce report templates and dashboards that’ll help communicate data insights effectively to your team or customers.
4. eCommerce KPI Dashboard
Developed by Porter Metrics | Get Dashboard
With this FREE template, you have everything: your Google Analytics Data and your Facebook Ads performance. Now you can track your most important Business KPIs in one place [Inspired in an actual use case].
Understand your e-commerce results by connecting your Google Analytics to Google Data Studio to visualize your business results easily.
5. Website Speed Dashboard

Developed by Porter Metrics | Get Dashboard
Our free report template will be your favourite tool to test your website speed. Track your website speed performance at a granular level with Google Analytics. Break down data by page, country, devices, and browser.
6. Product Sales and Revenue Dashboard
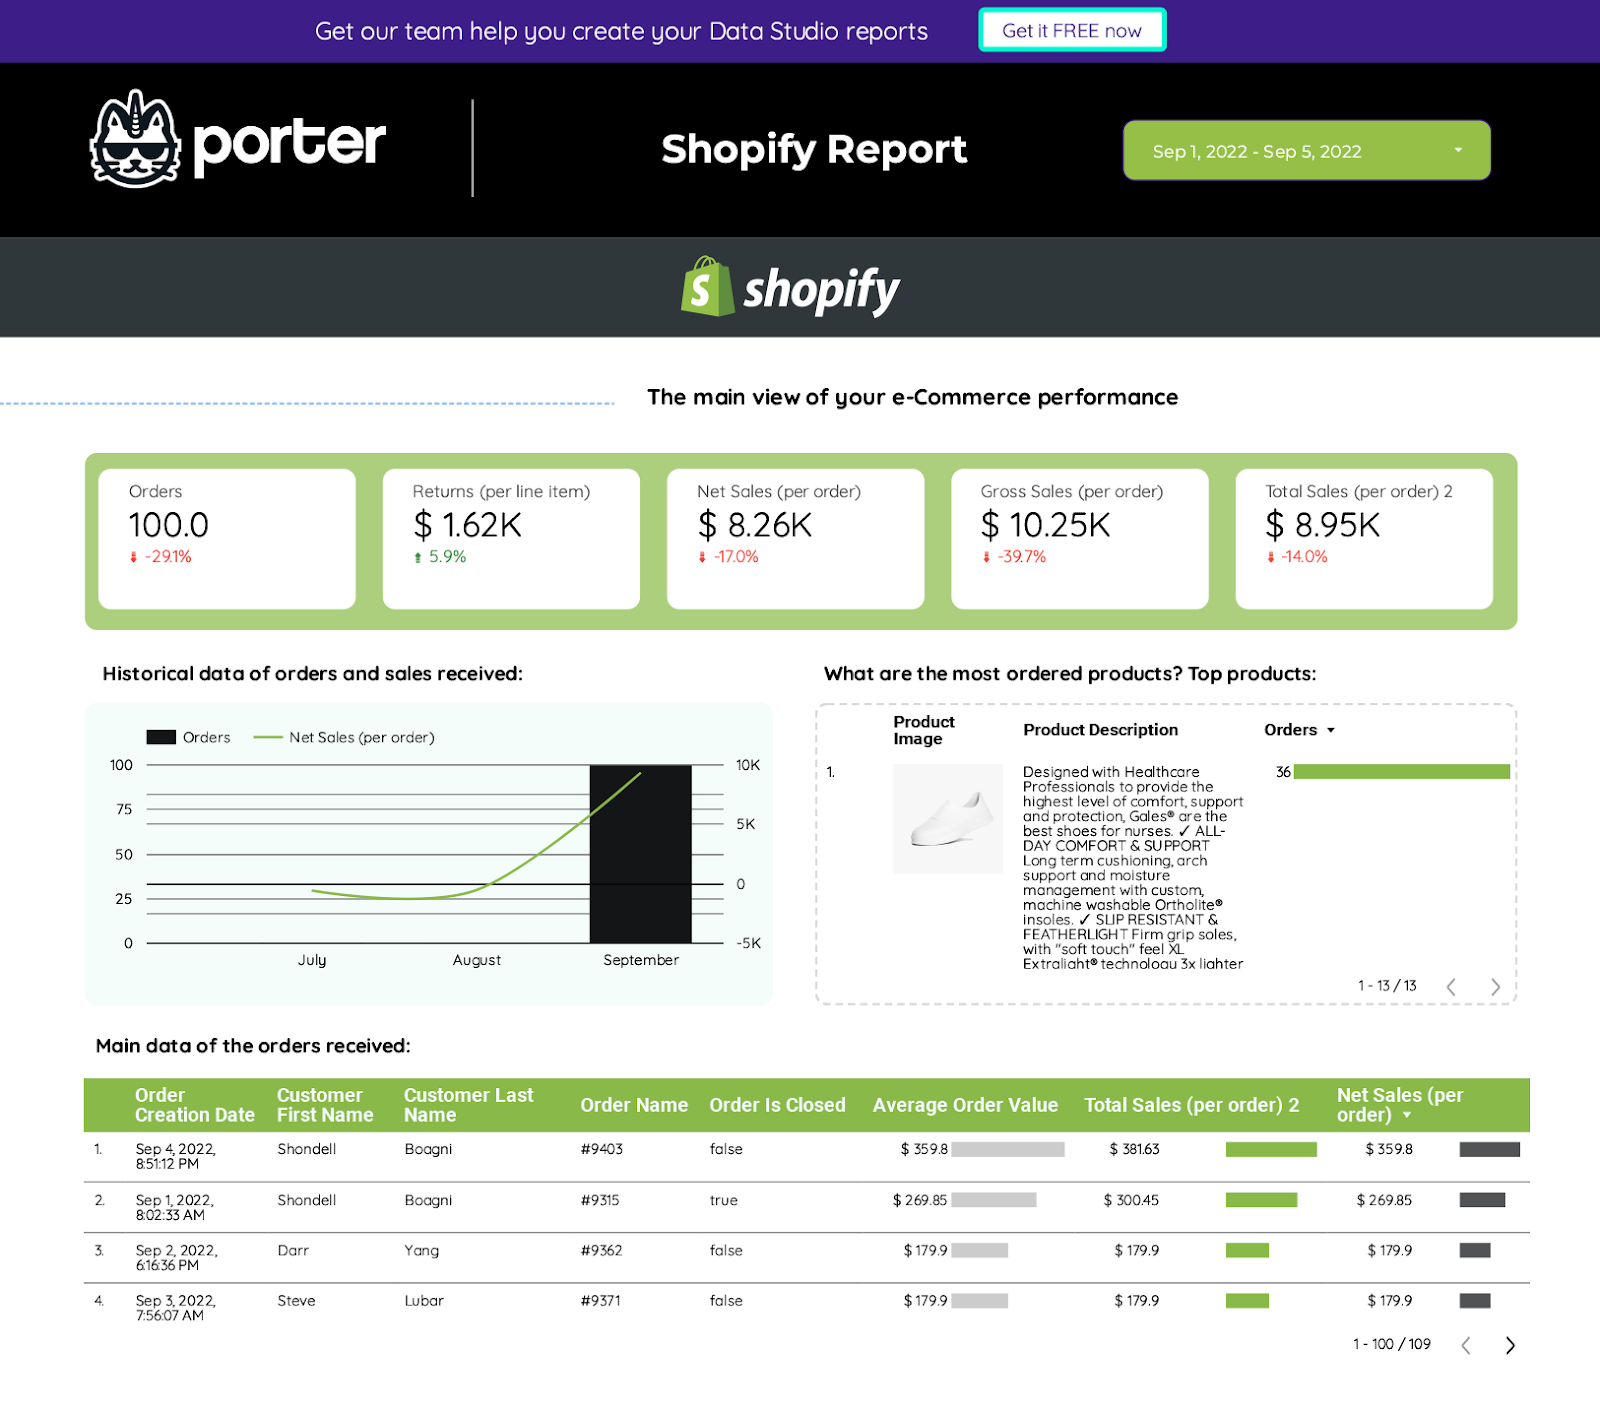
Developed by Porter Metrics | Get Dashboard
This dashboard allows for tracking the sales produced by e-commerce, knowing which products have the highest sales, which are the sources of traffic to the website, and all the details of the orders.
Metrics such as sales, total orders, total orders per product, total sales, cost of sales, net sales, total completed sales, order status, etc are included in the 5-paged report.
7. Website Engagement and Loyalty Dashboard

Developed by Databox | Get Dashboard
Use this free dashboard template to measure the overall engagement of your website visitors. G
et insights into how visitors interact with your most important pages by monitoring pages per session, bounce rate, exits by page, average time on page, and more.
If you don’t use Google Analytics, you can pull data from any of Databox’s 70+ one-click, native integrations or spreadsheets, databases, and other APIs.
By connecting your Google Analytics account, you’ll learn the following:
- Pages that have the highest bounce rate on your website.
- Pages visitors exit your website from the most.
- Channels that drive the most engaged visitors to your website.
- Engagement rate of new or returning visitors.
8. Google CRUX Dashboard
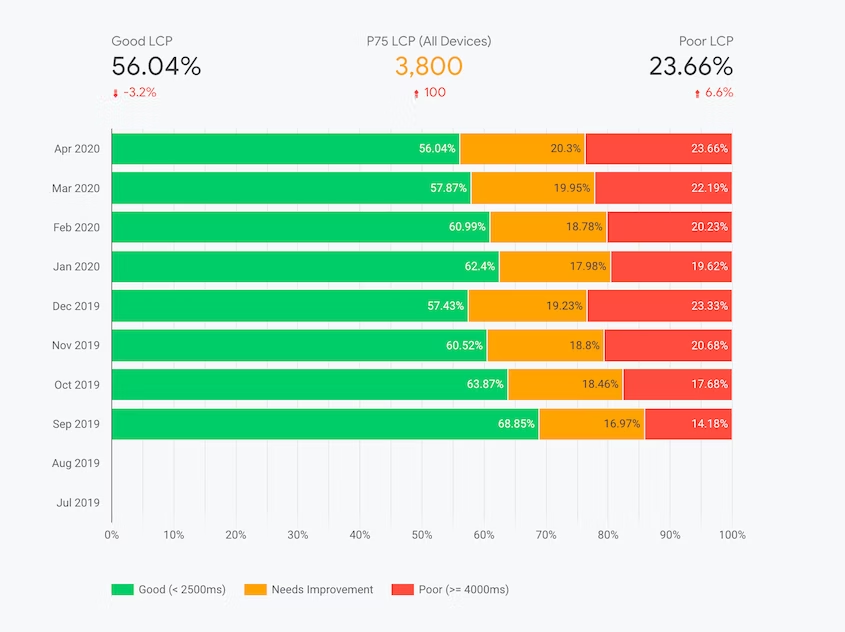
The CrUX Dashboard is built with a Data Studio feature called Community Connectors. This is a pre-established link between the raw CrUX data on BigQuery and the visualizations of Data Studio.
It eliminates the need for users to write queries or generate charts. Everything is built for you; you need to provide an origin, and the tool will generate a custom dashboard.
Learn how to create a CRUX Dashboard
9. The eCommerce Speed Dashboard

Developed by Databox | Get Dashboard
Use this free dashboard template to identify broken pages and opportunities for optimization.
If you don’t use Google Analytics, you can pull data from any of Databox’s 70+ one-click, native integrations or spreadsheets, databases, and other APIs.
By connecting your Google Analytics account, you’ll learn the following:
- Your page load time, and how it impacts your bounce rate?
- Your page load speed on all devices.
10. Google Merchandise Store Report

Developed by Looker Studio | Get Dashboard
Google developed the Google Merchandise Store Report. You need an eCommerce store integrated with Google Analytics to use this template.
Every essential dimension and metric is covered in this dashboard, including sessions, product add-to-cart rates, revenue, and cart-to-detail rates on a global and per-product or per-medium level.
The data can be filtered by user type, source/medium, country, and device category. The dashboard’s ability to display general trends and product-specific data makes it outstanding.
Google has done a fantastic job of giving you the ability to focus on product-specific information while also including top-level information all in one view.
11. The Merchandise Store Website Performance Report

Developed by Data Runs Deep | Get Dashboard
This one-page eCommerce dashboard is similar to others, but it is much more detailed now. The template is divided into five sections: Performance, Conversions, Audience, Acquisition, and Behaviour.
The dashboard provides a lot of details. But upon closer inspection, it turns out to be a compelling dashboard. It is incredible how much information can fit on such a small screen.
The dashboard answers questions such as:
- What is my current performance, and how has it changed compared to the previous period?
- Where do visitors come from, and how do they behave?
You can filter the dashboard on the date, user type, and device category. This is a great way to analyze the data because you can quickly get used to viewing it as if it were only for new visitors.
This dashboard is ideal for eCommerce businesses that want to monitor their performance so that they can act immediately and figure out what’s happening if something seems off, like sales.
12. The Enhanced eCommerce Dashboard

Developed by Bymarketers | Get Dashboard
The Enhanced eCommerce template is tailored for businesses that have enabled enhanced eCommerce tracking on GA (Google Analytics).
If you manage an eCommerce website and want to see detailed data organized better than in Google Analytics, this report is for you.
Sharing the dashboard with other employees will encourage conversations about sales and revenue. The template displays revenue, purchases, and revenue per purchase year over year.
The template also displays information on product views and cart additions. The dashboard’s custom filters let you filter data based on the date, the Analytics profile, the source, the country, and the user type.
The dashboard aims to answer critical questions such as:
- How much revenue am I generating?
- How many people are converting, and how does the conversion vary by landing page and source/medium?
- What are the demographics of customers?
- Which products do customers buy the most?
13. The Sales and Shopping Behavior Dashboard

Developed by Looker Studio | Get Dashboard
Using this template, you can visualize shopping behaviour data from Google Analytics reports. The dashboard displays the percentage of users who eventually make a purchase after moving through your sales funnel.
It shows all sessions, sessions with product views, sessions with add to cart, sessions with checkout, and sessions with revenue!
Experts in conversion optimization who want to boost revenue and conversion rates while maintaining traffic levels should use this dashboard.
This dashboard is also recommended for businesses that want to increase the number of customers moving through each stage of the funnel as much as possible.
Conclusion
The sales and shopping behaviour dashboard conclude our list of top Google Data Studio dashboard examples for eCommerce businesses.
Now, you have access to various dashboards to help you, your team, and your clients better understand your eCommerce data. The next step is to choose a dashboard, make a copy, connect your data source, and customize it to your needs.
We recommend you check out one of our tutorials on how to create an eCommerce report if this is the first eCommerce dashboard you’ll be creating.
If you have experience creating eCommerce, you should also check out the tutorial to learn more about the latest best practices.
You can schedule a free setup with our team if you need help creating your report and dashboard.
Frequently Asked Questions
What is an E-Commerce dashboard?
An e-commerce dashboard is a user interface that shows some metrics and key performance indicators (KPIs) about an e-commerce company’s sales, revenue, products, and clients.
What should be on an eCommerce dashboard?
An eCommerce dashboard should be designed to communicate Key Performance Indicators (KPIs) over time. Users should be able to identify issues and opportunities quickly.
A dashboard should use colours and design elements to draw attention to the meaning behind the numbers and to describe whether they are good or bad.
How do I create an eCommerce dashboard in Google Analytics?
To create an eCommerce dashboard in Google Analytics, follow these steps:
- Create a new dashboard.
- Add widgets to your dashboard.
- Add additional widgets to your dashboard.
- Integrate revenue data with the dashboard.
Check out an article by ThinkShop by Bolt for a detailed overview of How to Set up Google Analytics for eCommerce.