Sometimes we don’t have all the tools we need to perform our duties as paid search managers. Even specific things like Google Ads pacing can be much more complex than they need to be.
This is because you cannot directly enter your budget or conversion targets into the platform.
And the majority of third-party tools and customized DIY pacing sheets meant to address this issue are just ineffective for paid search managers.
They are either too simple to offer insights or too cluttered to understand quickly.
This article will show you how to create your automatic pacing dashboards using google ads, google data studio, and google sheets for free, as well as what qualities an excellent pacing dashboard must have to support your profession.
Anatomy Of A Perfect Pacing Dashboard
Running an advertising campaign is like trying to finish a Barkley marathon. If you ignore your speed, you won’t be able to accomplish your advertising objectives.
You don’t sprint from the start line; you pace yourself accordingly to finish the marathon advertising. Pacing is an effective but neglected strategy for monitoring the effectiveness of advertising.
Pacing can help you identify advertising issues before standard reporting and dashboards and address them before they become catastrophic.
Many advertisers, unlike marathon runners, neglect to keep track of their pace while their campaigns are running. So, until it’s too late, they are unaware of their advertising performance.
Not until they cross the campaign’s “finish line” do they realize they fell short of their advertising goals. It doesn’t have to be this way.
Advertisers can learn a lot from marathon runners when tracking progress toward objectives. The top competitors keep a close eye on their pace the whole race.
You should conduct yourself like this while managing your advertising campaigns, especially if you want to increase their effectiveness.
So, in this section, we will show you what should be involved in creating the perfect pacing dashboard.
KPI Relationships Section
You need to understand the relationship between hopes and reality fully. What should happen (which are your goals and targets) and what is happening (live/current actuals).
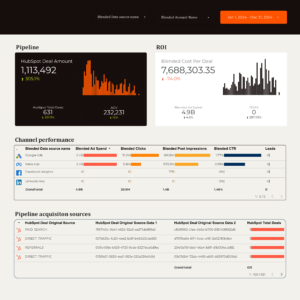
The dashboard leads with KPIs for spend and return. I know exactly what the month’s goal is, real-time performance, and how we’re pacing.
Comparing MTD goal progress with the month’s completion lets me know whether it’s time to observe or time to act.
Seeing your KPIs in multiple formats (raw numbers, ratios, percentages) makes it easier to understand pacing and data relationships without mentally dividing large numbers.
By the way, MTD means “month-to-date,” and it refers to the time frame that spans from the beginning of the current month to the current date. For example, the MTD for October 26 is 1st of October to the 25 of October.
“month-to-date” is used to track the results of an action that occurred between a date and the start of the current month.
Below are charts and scores used to accentuate this section and the KPI relationship for an effective pacing dashboard.
Charts And Scorecards Used:
- Month progress: This shows the current date, percentage of the month completed, and the remaining time left.
- KPI goal scorecards: This is a Revenue (or conversion) goal and monthly budget.
- KPI Pacing Widget: This will represent a single-cell table that uses pacing to return a statement.
- MTD target scorecards: This scorecard will show MTD target value, MTD target completion status, and total monthly goal.
- Gauge with range: Performance of KPIs to date with visualization of progress.

- MTD scorecards: The difference between goal performance and actual performance. It makes it easier to see if you are moving towards your goals or far from them.
N.B: Scorecards, Timeseries chart, and Guage with range can be found once you click “ add a chart.”
Daily Progress And Course Correction
You would want to see how you’ve been doing (your average daily performance) and how you have been performing daily ( which is the recent daily performance).
By doing this, you can track your progress and quickly and easily note if you are on track or if you need to modify some things to get back on track.
Below are charts and scores for an effective pacing dashboard to accentuate this section and the daily progress.
Charts And Scorecards Used:
- Daily pacing target: This is your target divided by the number of days in the month.
- Performance scorecards: Three performance scorecards. One for Today, one for yesterday, and one that shows the average.

- Time series chart: The performance overall concerning pacing goal.
If you like seeing the specifics of previous daily performance every time you check in on pacing, you should add this section to your report.
Historical Performance Section

These historical charts provide information on trends and context for real-time analysis and tracking performance. They can analyze your past efforts with Ad goals and their effectiveness. A quote sums up this section perfectly.

Below are some charts and scores for an effective pacing dashboard to accentuate this section.
Charts Used:
- Time series chart: KPI showing the last 30 days.
- Time series chart: KPI showing the last 12 months.

Budget Pacing Dashboard Requirements
A pacing dashboard should give you easy and quick access to critical data that drives strategic decisions and action. So here are five essential requirements every pacing dashboard should have.
1. KPI snapshots and relationships.
KPIs are values that determine how successfully a project or corporation reaches its goals. In other words, KPIs give businesses a way to assess how various areas of their operations are doing regarding their strategic objectives.
Fundamentally speaking, KPIs offer vital performance-based data that helps a company and its stakeholders determine whether or not it is on track and then take appropriate action.
You should be able to know what’s happening, how they are related, what’s the cause and effect of the events, and the metrics to help with that.
Your KPIs should have a clear, loving relationship between what is happening (actual) and what should happen(goals).
2. Show daily progress.
You should know what daily pace goals the account is reaching consistently to meet the monthly KPIs and monthly pace goals to meet annual KPIs. Are you meeting your daily KPIs? What adjustments still need to be made?
Even the daily budget pacing works by evenly distributing the ad spend amount throughout a predetermined time period, which can be the whole day or only a portion of the day.
The campaign’s spending is updated multiple times per hour to determine whether it is on course to stay under its daily budget.
Remember that little drops of rainfall make an ocean.
3. Provide context.
You want to see how this month’s performance is stacked against more recent and long-term patterns regarding goals, impressions, conversions, and any pattern or data you want to analyze.
It’s important to decide the focus of the analysis.
4. Automated.
Everything should be running smoothly like an excellent oil-cogged machine with little input from your end. Unless your monthly revenue changes or something drastic occurs, you shouldn’t precisely touch or update anything.
Several options can be employed singly or in combination, depending on the complexity/frequency of your needs and your budget.
Setting up Automated Rules to send emails to you when your campaigns, ad groups, and keywords match specific criteria is the quickest (and most economical) way to spot Google Ads performance abnormalities.
Google Ads can email you an alert, halt or enable statutes, modify bids and budgets, and many other things when these components succeed or comply with your rules.
Rules can be easily applied to several accounts, stacked on top of one another, and scheduled automatically.
Creating an audit report to find performance issues if Google Ads and Google Data Studio are connected is also possible.
Like Automated Rules, you should decide what requirements your ad campaign parts must meet to succeed.
5. Accessible and shareable.
It should be shareable and accessible by anyone (trusted parties) from anywhere in the world (even if they are on vacation on a remote island)

People should be able to access the report without login (unless needed) and automatically download whatever attachment and report efficiently.
How To Create a Google Ads Pacing Dashboard Using The Google Data Studio Template
Now that we have an idea of what makes a good pacing dashboard, it’s time to turn the theory into practice and reality on the google data studio platform.
To begin, we need the means to aggregate and visualize the digital data from two separate data sources to automate the pacing dashboard fully:
Data Sources
- Account Performance Data (Google Ads): We can access historical trends, real-time spending, and conversion data once we connect to any google ads account. This will provide us with performance data.

- Internal Goals and Targets (Google Sheets): We can fill out the month-to-date and daily pacing targets by entering KPI goals in google sheets.

To easily add data, click on “add data,” which can be found anywhere in the dashboard.
- Blended Data (Google Data Studio): Next, we use Data Studio to merge our data from both Google Ads and Google Sheets with its metrics into a single blended data source. To blend data, click “resources” followed by “manage blend data.”

Then click on “add a blend,” and a window opens, and you can add more data sources to it.

Click “join another table,” and it will pop up asking you to put in your data source. So, now we have data from both google ads and google sheets.

Customize And Update Your Dashboard
Next is to customize and update your dashboard as you go. Pick widgets, charts, colors, and basically, anything from google data studio that helps visualize your data and report.
There are free templates for a google ad pacing dashboard to be created.
Conclusion
It’s not about running ads; it’s about running effective ads. You gain insights that can help you become a more strategic paid search marketer who adds value and makes better decisions when you have immediate access to your Ads’ performance goals and live stats.
With the help of our Google Ads pacing dashboard, you’ll be able to fulfil all your pacing wishes and help your clients or yourself make smarter management choices.
Plus, we have 80+ report templates that make it easier to create a Google Ad Pacing report at no cost whatsoever.
Frequently Asked Questions
How is budget pacing determined?
Budget pacing is determined by a simple calculation of % of budget spent / % of the time elapsed. You are on track regarding your monthly spending budget if the ratio is close to 1. If it is greater than 1, you are overspending.
How do I calculate the % of the time elapsed for budget pacing?
The formula for it is Days elapsed/Total days in budget.
How do I calculate the % of the budget spent for budget pacing?
The formula for it is Days cost/budget.
What does pacing in PPC mean?
Budget pacing is the act of monitoring and optimizing various aspects of your digital advertising campaigns to control the rate at which the campaigns spend money.
The purpose of pacing is to reach a target budget and performance goals by the end of the budgeting cycle.
Are there free Google Ads Pacing templates to use?
Yes, there are. Portermetrics offer free Google Ad pacing templates you can use, so you don’t have to build from scratch.
What are the most critical metrics for Google Ad Pacing?
- Budget for the month.
- Cost of what you’ve spent so far.
- Days spent; showing the number of days that have passed.