Free TikTok Ads report template for Google Looker Studio
Pull all the metrics directly from the TikTok Ads API. This means you can use as many dimensions or metrics as you need to report your campaign’s performance.
Connect +19 marketing data sources to visualize your marketing data!
Export your marketing data to Google Sheets in seconds.
Get your free Looker Studio Report within 48 hours
Earn a 20% recurrent commission for every referral
Get exclusive templates worth +$800 [customers only]
See what we're building. Upvote integrations
Check all the templates and choose one based on your use case
Copy a template that combines multiple data sources
Pull all the metrics directly from the TikTok Ads API. This means you can use as many dimensions or metrics as you need to report your campaign’s performance.
Pull all the metrics directly from the TikTok Ads API. This means you can use as many dimensions or metrics as you need to report your campaign’s performance.
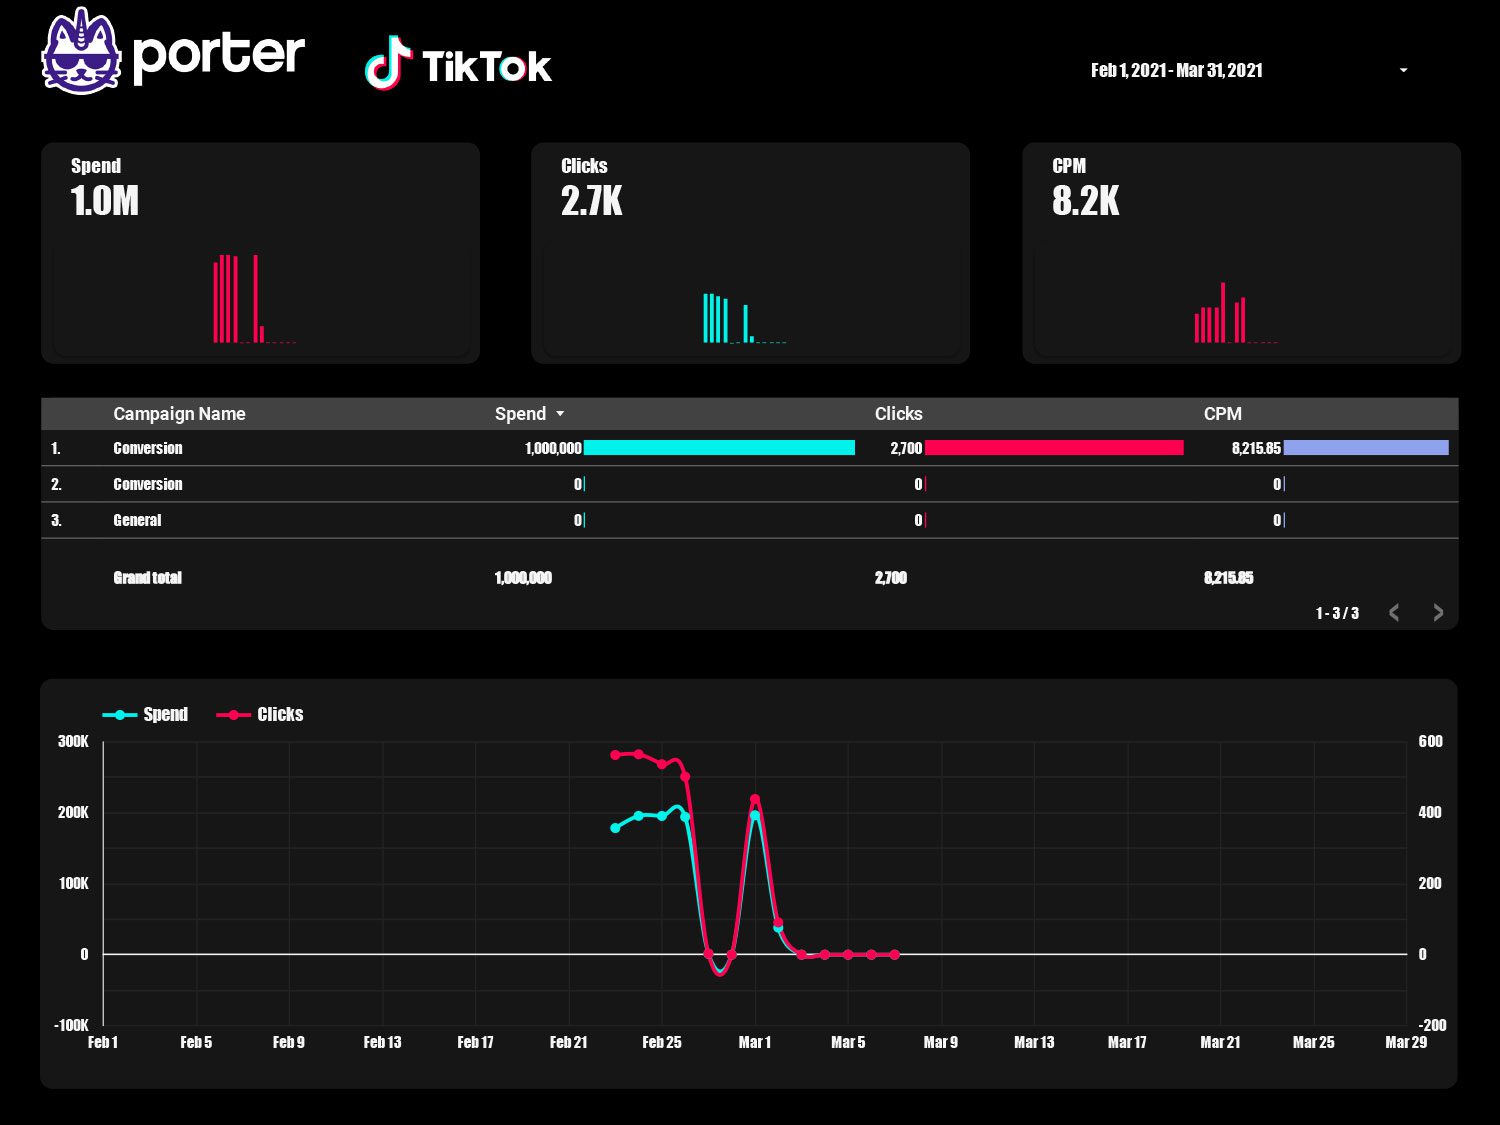
We created a TikTok Ads comprehensive performance dashboard for Google Data Studio. You can navigate pages and select those the right metrics according to your needs.
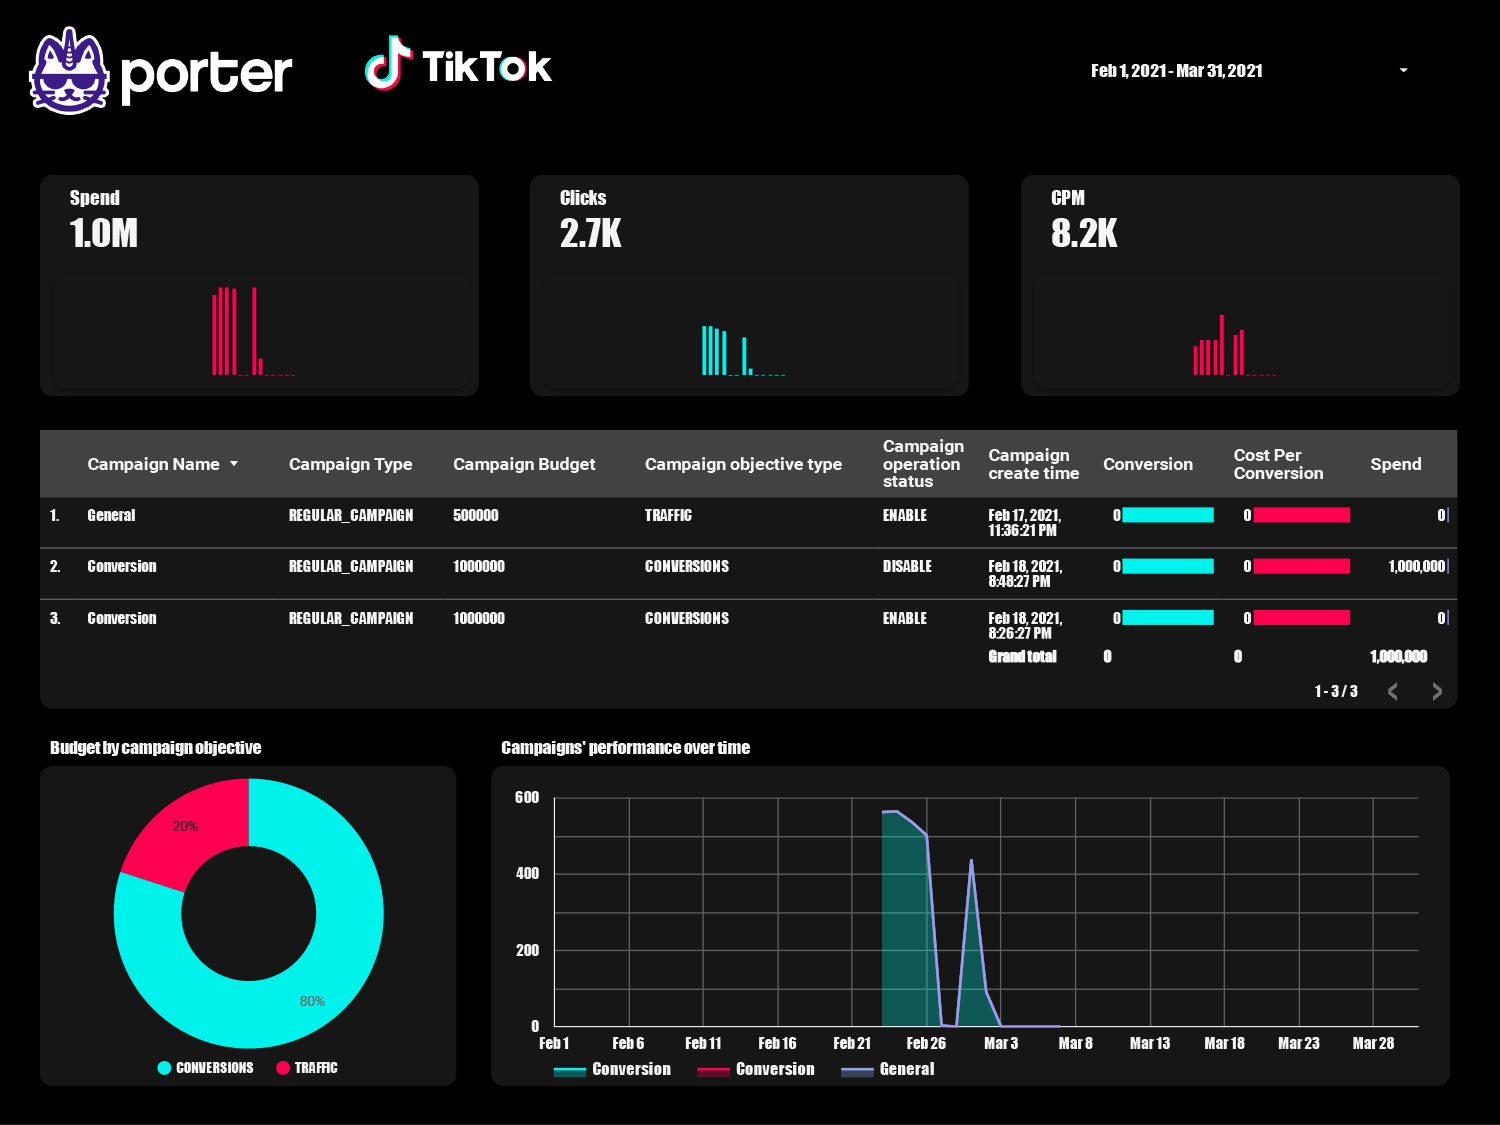
This TikTok Ads report template contains 6 different pages depending on the data level you need to report.
With this template, you will see what your best-performing campaigns are and observe which countries bring in the most revenue.
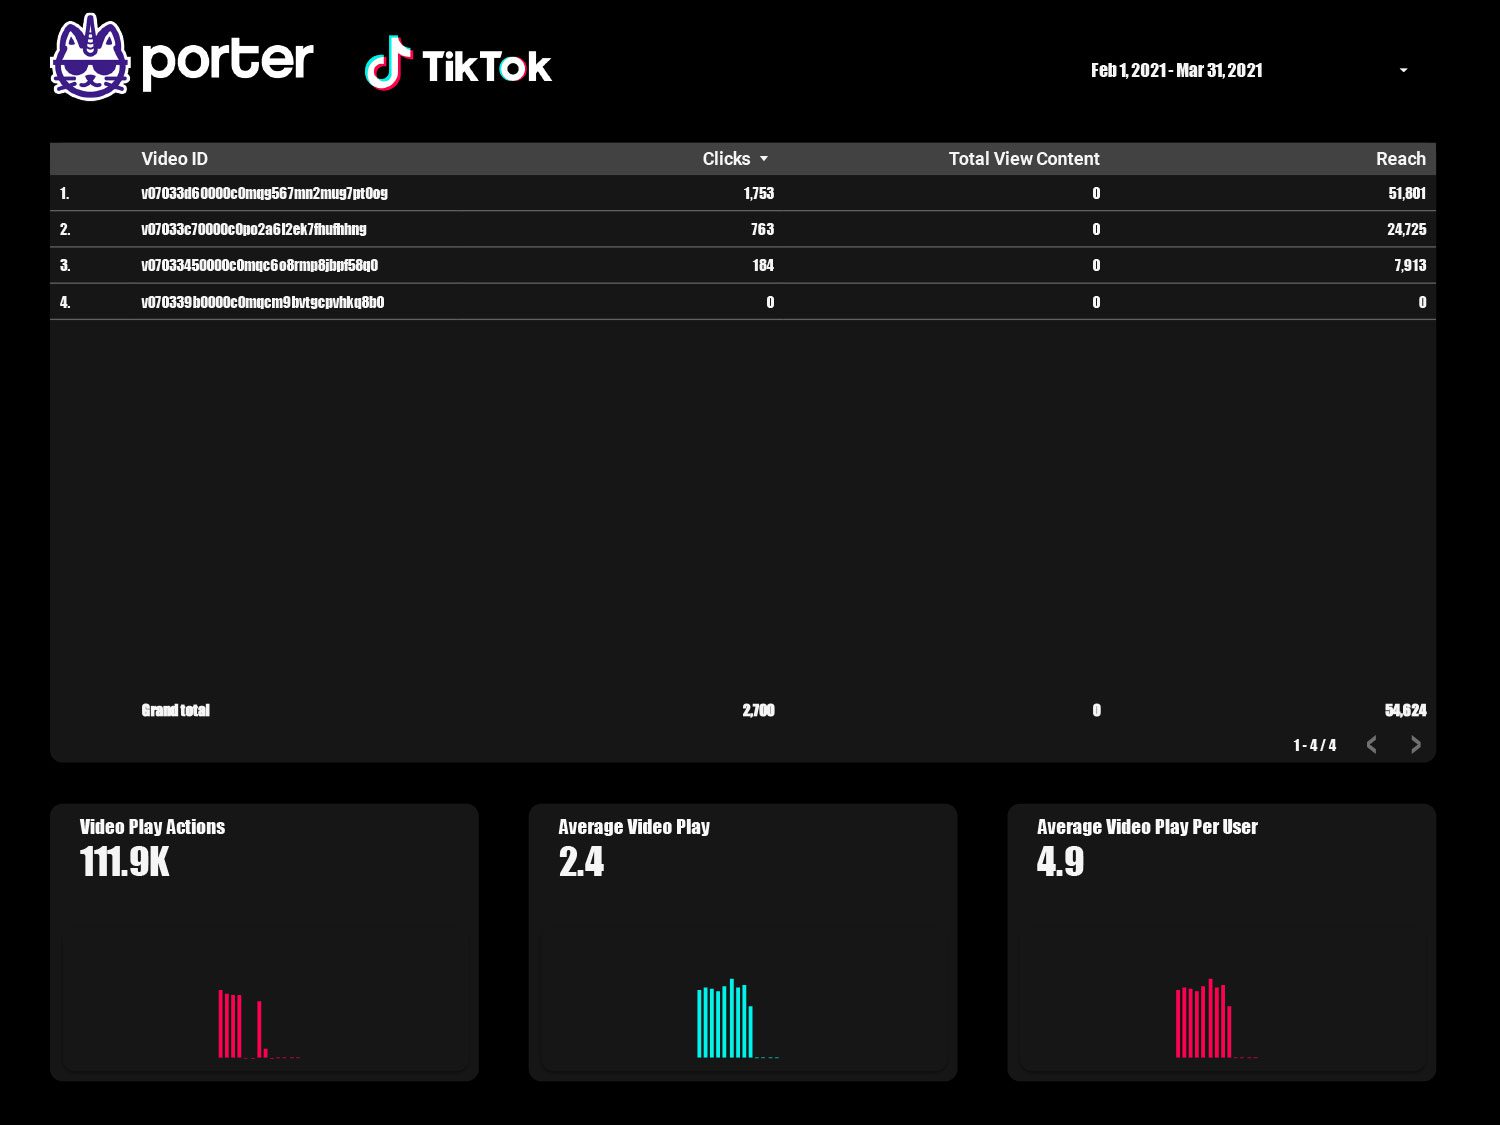
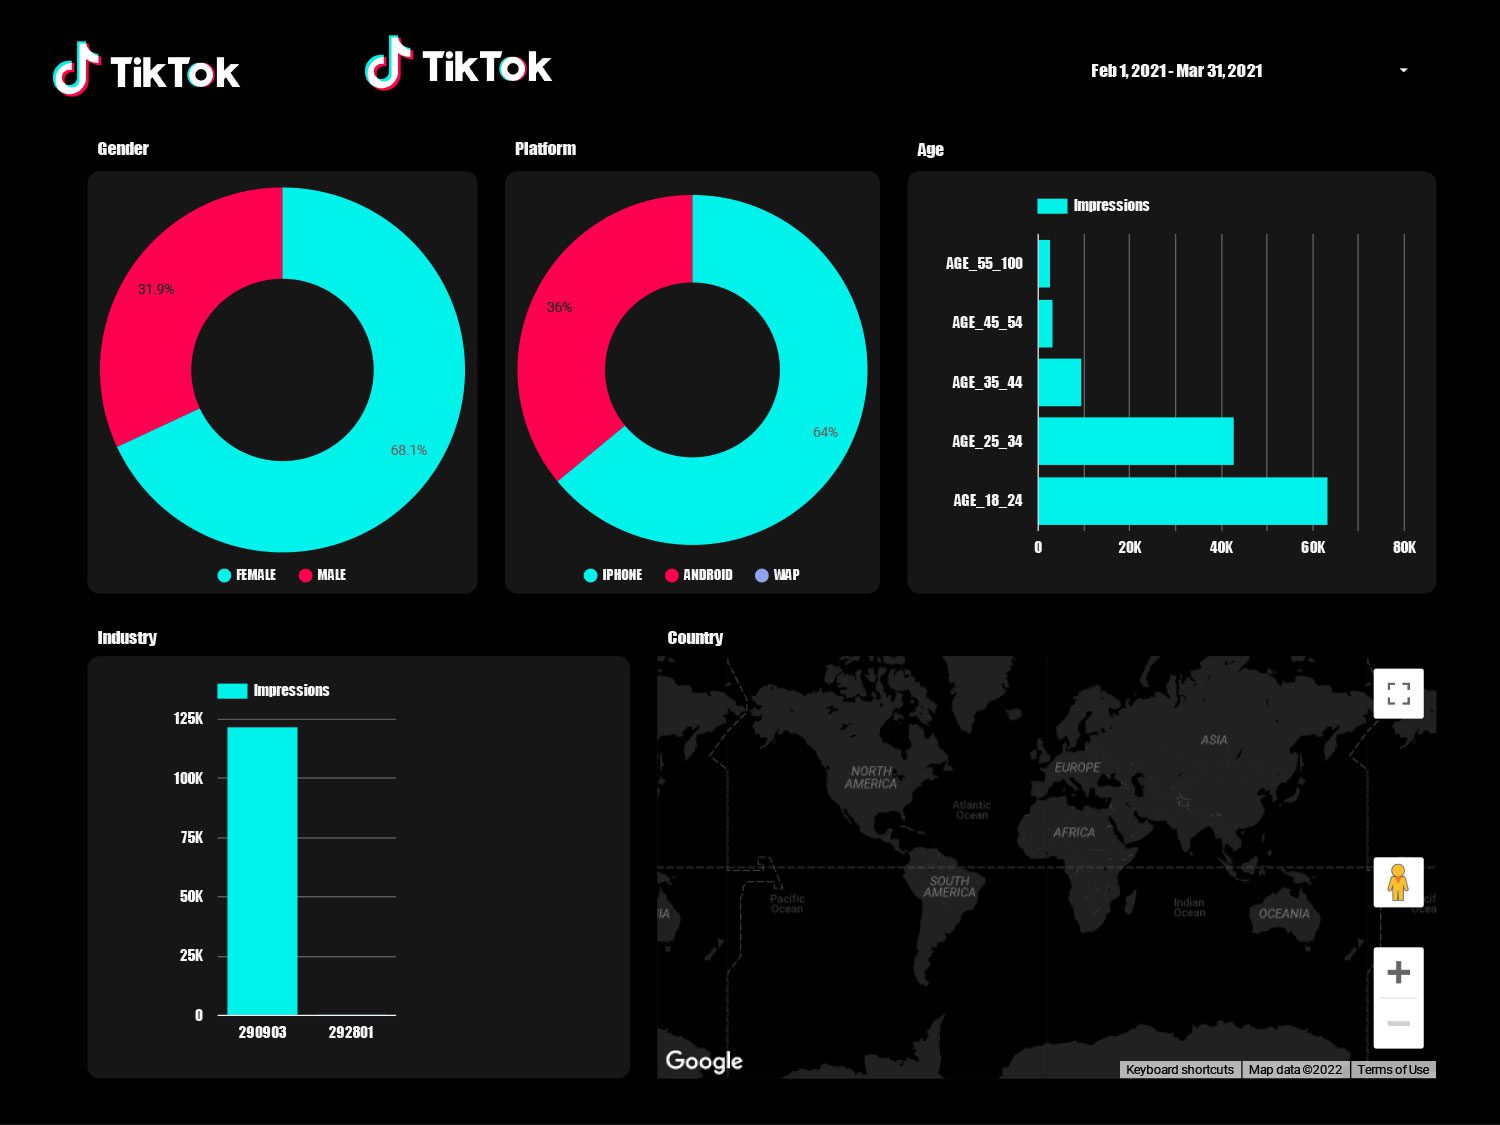
Get multiple charts to visualize:
This report template is really for free, and you can copy it and use it whenever you want. However, you need to pull your data from the Porter Metrics.
Once you have successfully created a copy for this template, you will start a 14-days free trial with us. Also, you will choose a paid plan to upgrade your porter metric account and keep the connector working.
Note: If you don't want to upgrade a plan with Porter, you may keep with the template, but the connectors will stop working, which means your data won't be available in this stunning and comprehensive template.
When you have a custom report template, you can visualize real-time charts and know your performance when you have a custom report template.
Once you have set up your advertising report template, you will follow these steps to analyze your data:
You can customize your report by creating new charts, adding filters and controls, custom formulas, colors, logos, and changing the size of your canvas.
We have created the following video tutorial to show you all these options to customize your SM report template: How to customize a Google Data Studio report.
As we have shown you, Porter Metrics has been created as a non-code platform for marketers and agencies to automate your Data Studio reports in some minutes.
The difference between Porter Metrics and competitors is the non-code and the resources that Porter Metrics offers. You can also review this reporting tools list to know all the solutions available, including Porter Metrics and competitors.
Please make a copy of this funnel report template and use it now to track your campaigns. As we show you, these are the steps:
Remember, if you need help to set up your report or star tour free trial, you can schedule a call, and we will be happy to help you.
Porter is the fastest way to get your marketing metrics and dashboards where you need them


