

The top Funnel.io alternatives in 2026 are Porter Metrics, Supermetrics, Windsor.ai, Dataslayer, Coupler.io, Improvado, and Whatagraph. Marketing teams move away from Funnel.io primarily because of high pricing (starting at $2,250/month billed annually), complex setup that requires data modeling knowledge, and enterprise-oriented features that are overkill for small and mid-size teams. The alternatives listed here cover a range from $15 to $250/month for entry plans.
Quick answer — Best Funnel.io alternatives in 2026
- Porter Metrics — Best overall for marketing teams and agencies (from $15/mo)
- Supermetrics — Largest connector library with 150+ integrations (from $37/mo)
- Windsor.ai — Best free plan with multi-touch attribution (from $23/mo)
- Dataslayer — Budget-friendly ETL with high G2 ratings (from $39/mo)
- Coupler.io — Best for ETL to Google Sheets and spreadsheets (from $32/mo)
- Improvado — Best for large enterprises with big ad budgets (from ~$3,400/mo)
- Whatagraph — Best all-in-one reporting with built-in dashboards (from ~$270/mo)
- Adverity — Best for enterprise data harmonization with 600+ connectors
- Domo — Best all-in-one BI platform with a free tier (from $0/mo)
- TapClicks — Best for multi-location agencies with AI-powered insights
All tools tested hands-on. Pricing verified April 2026. Jump to full comparison →
Disclosure: I’m Juan, founder of Porter Metrics, a Funnel.io alternative with 6+ years in the market. Every claim in this article is based on public data and verifiable facts so you can make an objective comparison.
Why look for a Funnel.io alternative
Marketing teams search for Funnel.io alternatives because of the following issues:
starting at $200/month (billed annually) with no monthly option, and the Business plan jumps to $800/month. Most small and mid-size teams cannot justify this cost for marketing data connectors
configuring connections involves mapping fields to tables, understanding data union logic, and building joins across sources — not a plug-and-play experience for marketers
you must book a demo to start using Funnel.io — there is no free tier and no way to test the product independently before committing to an annual contract
Funnel.io was founded in 2014 in Stockholm, Sweden, and has raised $131M+ in funding from Balderton Capital, Eight Roads Ventures, and Stena Sessan. With ~400 employees and an estimated ~$70M in annual revenue, Funnel is the most well-funded marketing data tool on the market. It uses a data warehouse-first architecture where all marketing data flows through its managed warehouse before reaching destinations.
To be fair, Funnel.io has real strengths: they offer the widest connector coverage (up to 590 connectors on Enterprise), a visual transformation layer for data normalization, and SOC2 + GDPR compliance. The issues that drive teams to alternatives are about price, complexity, and accessibility.
1. Enterprise-tier pricing
Funnel.io recently restructured its pricing. In December 2025, the free plan was removed. In February 2026, a new Starter plan launched at $400/month, then dropped briefly to $200/month in early 2026, then jumped to $2,250/month by April 2026. Here is the current pricing structure:
| What’s included | Starter ($200/mo) | Business ($800/mo) | Enterprise (Custom) |
|---|---|---|---|
| Billing | Annual only | Annual only | Annual only |
| Connectors | 121 (core only) | 579 + custom | 590 + custom + governance |
| Reporting solutions | 3 (Data Studio (formerly Looker Studio), Sheets, Excel) | 6 | 6 |
| Export destinations | Not available | 26 | 27 |
| Data warehouse | Managed (included) | Managed (included) | Managed (included) |
| Advanced measurement | Not available | Add-on | Add-on |
| Self-service signup | No (demo required) | No (demo required) | No (demo required) |
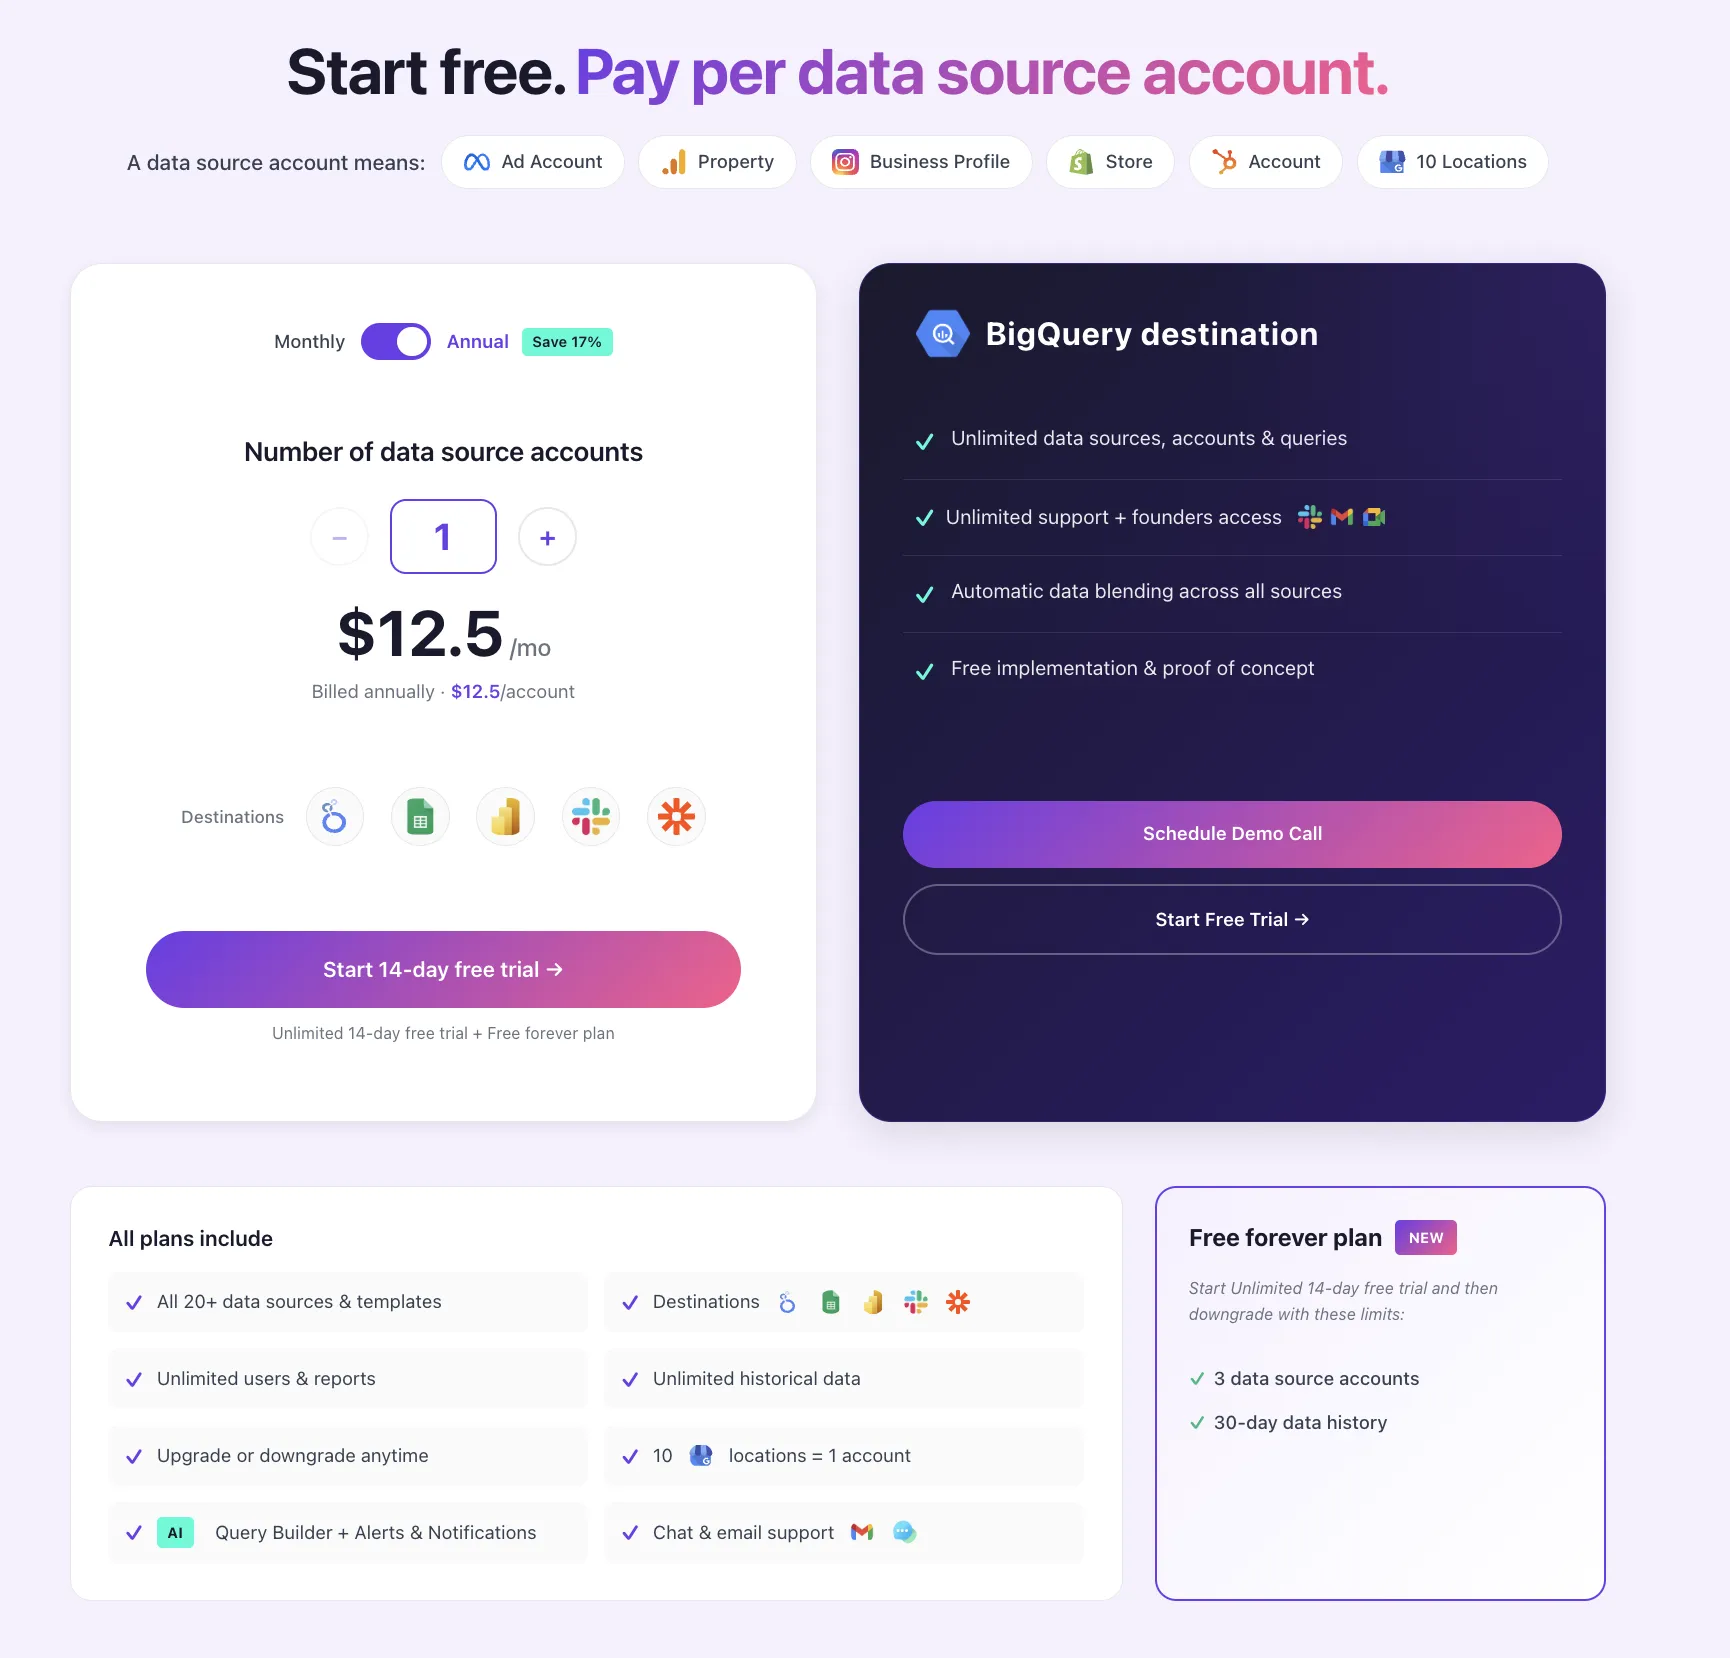
In comparison: Porter Metrics starts at $15/month per account with all destinations, data transformations, storage, and unlimited users included. No demo required, no annual commitment needed.
2. Complex setup process
Funnel.io’s interface is designed for data teams, not marketers. Setting up a data connection involves multiple steps that require technical understanding:
- You must map fields to tables and configure how data from different sources joins together
- Understanding data union logic is required to combine sources correctly
- The transformation layer, while powerful, requires knowledge of field mapping, naming conventions, and data normalization
- There is no template gallery for quick-start reports — everything must be built from scratch
Porter Metrics handles data blending automatically — dates, campaign names, UTM parameters, spend, impressions, clicks, conversions, and revenue are unified across sources without any configuration.
3. Overkill for most marketing teams
Funnel.io is built for enterprise data teams managing complex marketing data infrastructure. For small agencies, freelancers, and in-house marketing teams that simply need to pull data into Data Studio or Google Sheets, Funnel.io introduces unnecessary complexity:
| Consideration | Funnel.io | Porter Metrics |
|---|---|---|
| Minimum cost | $2,250/mo (annual contract = $27,000/year minimum) | $15/mo (no commitment required) |
| Time to first report | Days to weeks (demo + onboarding + field mapping + configuration) | Minutes (connect source, pick template, done) |
| Report templates | No pre-built templates | 50+ Data Studio templates, installable in one click |
| Data blending | Manual field mapping and join configuration | Automatic cross-source blending: dates, campaigns, UTMs, metrics pre-combined |
| Technical skill needed | Data modeling, field mapping, union logic | None — natural language custom metrics via AI |
Funnel.io versus alternatives: quick comparison
Here is a side-by-side overview of how each alternative compares to Funnel.io on the factors that matter most: pricing, connectors, free tier availability, and user ratings.
| Tool | Best for | Starting price | Connectors | Free plan | G2 Rating |
|---|---|---|---|---|---|
 Funnel.io Funnel.io |
Enterprise data normalization and governance | $2,250/mo | 590 | No | 4.5/5 |
 Porter Metrics Top Pick Porter Metrics Top Pick |
Marketing teams and agencies on Data Studio, Sheets, or BigQuery | $15/mo | 25+ | Yes | 4.4/5 |
 Supermetrics Supermetrics |
High-volume ETL to warehouses and spreadsheets | $37/mo | 150+ | No | 4.3/5 |
 Windsor.ai Windsor.ai |
Multi-touch attribution on a budget | $23/mo | 325+ | Yes | 4.5/5 |
 Dataslayer Dataslayer |
Budget ETL with high user satisfaction | $39/mo | 51 | Yes | 4.8/5 |
 Coupler.io Coupler.io |
ETL workflows to Google Sheets and spreadsheets | $32/mo | 400+ | Yes | 4.9/5 |
 Improvado Improvado |
Large enterprises with complex marketing data | ~$3,400/mo | 500+ | No | 4.5/5 |
 Whatagraph Whatagraph |
All-in-one reporting with built-in dashboards | ~$270/mo | 62 | Yes | 4.5/5 |
 Adverity Adverity |
Enterprise marketing data harmonization | Custom | 600+ | No | 4.5/5 |
 Domo Domo |
All-in-one BI platform with embedded analytics | $0 (free) | 1,000+ | Yes | 4.3/5 |
 TapClicks TapClicks |
AI-powered marketing intelligence for agencies | Custom | 250+ | No | 4.2/5 |
G2 ratings as of March 2026. Pricing is monthly, billed monthly unless noted. Annual billing saves 15–20% on most tools.
Pricing comparison
Free forever plans
Several alternatives to Funnel.io offer permanent free tiers beyond trial periods. Funnel.io does not offer a free plan. Here is how the free options compare:
| Platform | Connectors | Accounts | Users | Destinations | Key Limitation |
|---|---|---|---|---|---|
| Porter Metrics |
Any | 3 | Unlimited | All | 30-day data history |
| Windsor.ai |
1 source | 1 | 1 | All | 5M MAR · 1 data source |
| Dataslayer |
Any | 1 | 1 | 1 | Manual daily refresh · 1 user |
| Coupler.io |
Any | 1 | 1 | 1 | No auto-refresh · 100 rows/run · 1 active data flow |
| Whatagraph |
Selected | 5 | Unlimited | Reports only (no BigQuery/Data Studio) | Essential integrations only · No white-label |
Funnel.io removed its free plan in December 2025. No free tier is currently available.
All plans and pricing models
Each tool uses a different pricing model. This table shows the entry, mid, and top plan as published on each tool’s pricing page. Prices are monthly (billed monthly) unless noted.
| Tool | Pricing model | Entry | Mid | Top / Enterprise | Free plan | Trial |
|---|---|---|---|---|---|---|
| Funnel.io |
Per connector tier. Annual contracts | $200/mo Starter: 121 connectors |
$800/mo Business: 579 connectors |
Custom Enterprise: 590 connectors, dedicated support |
No | Demo only |
| Porter Metrics |
Per data source account. All destinations, users, and features included | $15/mo 1 account, all destinations, all features |
$40/mo 5 accounts, all destinations |
Custom BigQuery, unlimited sources |
Yes | 14 days |
| Supermetrics |
Per destination + per source + per account + per user | $37/mo Starter: 3 sources, 1 dest, weekly refresh |
$199/mo Growth: 7 sources, 1 dest, daily refresh |
$499/mo+ Pro/Enterprise: 10+ sources, BigQuery, custom metrics |
No | 14 days |
| Windsor.ai |
Per data sources + accounts + destination tasks | $23/mo Basic: 3 sources, 75 accounts, 5 dest. tasks |
$118/mo Standard: 7 sources, 75 accounts |
$299/mo Plus: 10 sources, 200 accounts |
Yes | 30 days |
| Dataslayer |
Per source + per account + per destination | $39/mo Starter: 3 sources, 3 accounts, 1 dest |
$139/mo Advanced: 7 sources, 50 accounts |
$419/mo Pro: 10 sources, 100 accounts |
Yes | 15 days |
| Coupler.io |
Per account. Workflow-based ETL | $32/mo Personal: 3 accounts, 1 dest, daily |
$132/mo Professional: 15 accounts, 3 dests |
$259/mo Team: 50 accounts, unlimited dests |
Yes | 7 days |
| Improvado |
Per data volume (rows/year). Annual contracts only | ~$3,400/mo* Growth: 200M rows/yr, 2x daily |
~$5,000+/mo* Advanced: 600M rows/yr, 4x daily |
Custom Enterprise: 1B rows/yr, dedicated CSM |
No | Demo only |
| Whatagraph |
Per source credits. Integrations tiered by plan | ~$270/mo Start: 20 credits, Essential integrations |
~$675/mo Boost: 60 credits, Advanced integrations |
Custom Max: 100+ credits, Premium integrations |
Yes | No |
Prices as of March 2026. Billed monthly unless noted. Annual billing typically saves 15-20%. *Improvado prices estimated from proposals; actual prices vary by contract.
Integrations: Connectors and destinations
| Tool | Connectors | Destinations |
|---|---|---|
| Funnel.io |
590 | 28 |
| Porter Metrics |
25+ | 4 |
| Supermetrics |
150+ | 19 |
| Windsor.ai |
325+ | 15+ |
| Dataslayer |
51 | 13 |
| Coupler.io |
400+ | ~20 |
| Improvado |
500+ | 15+ |
| Whatagraph |
62 | Own platform + 5 |
Connector counts are based on each tool’s official integrations page.
Features to look for
Beyond connectors and destinations, these capabilities set marketing data tools apart. Most platforms offer some version of these, but depth and plan availability differ significantly.
Data blending
Combining data from multiple sources into a single view. For example, merging Meta Ads spend with Shopify revenue to calculate ROAS, or combining Google Ads and LinkedIn Ads to see total ad spend by campaign.
Data transformations
Custom metrics, calculated fields, renamed dimensions, and formulas applied to your data before it reaches the destination. Examples: creating a “Cost per Lead” metric from spend divided by conversions.
Built-in storage
Some APIs return large datasets that need a data warehouse. Tools with built-in storage handle this automatically. Tools without it require you to set up your own BigQuery or Snowflake instance.
Alerts and notifications
Automated messages when something changes: a campaign overspends, traffic drops, or a data sync fails. Delivered via email, Slack, or in-app.
AI features
Natural language queries, AI-generated summaries, anomaly detection, and forecast modeling. These are becoming standard, though the depth varies across tools.
API access
A programmatic way to pull or push data from the tool itself. With AI coding tools, any marketer can now connect a tool’s API to their own workflows without a developer.
The 10 best Funnel.io alternatives in 2026
Porter Metrics
Cross-Channel Marketing Reports & AI Automation

Porter Metrics is a no-code marketing reporting platform that measures performance tied to bottom-line revenue and profit across all channels, products, clients, and campaigns. It connects ad platforms (Meta Ads, Google Ads, TikTok Ads, LinkedIn Ads, Microsoft Ads), social media, SEO tools, CRMs (HubSpot, Klaviyo, ActiveCampaign), and e-commerce (Shopify, Amazon) to destinations like Data Studio, Google Sheets, Power BI, and BigQuery.
Unlike Funnel.io where you need to map fields, configure joins, and understand data union logic, Porter Metrics delivers ready-to-use data that works immediately. All plans include unlimited users, no additional usage fees, and 50+ Data Studio templates installable in one click.
- All destinations included on every plan (Data Studio, Sheets, Power BI, BigQuery, Slack, Zapier) — no destination-based upselling like Funnel.io
- Automatic data blending across sources: dates, campaign names, UTM parameters, spend, impressions, clicks, conversions, and revenue are unified automatically. No field mapping required
- Best HubSpot and Shopify ETL on this list: Porter automatically manages backfills and stores data in a built-in BigQuery warehouse, so reports are fast and reliable from the start
- AI Workflow Builder for alerts, notifications, chat with data, and task automation directly on connected platforms via Slack and Zapier
- Custom metrics and dimensions using natural language (AI-powered), written directly to your BigQuery table
- Largest gallery of Data Studio templates in the market, with multi-source combinable templates installable in one click
- All Meta Ads conversion attribution windows in a single connection
- Used by 1,500+ marketing teams in 60+ countries
- Fewest connectors on this list (~25 vs. 590 on Funnel.io). If you need data from a platform Porter does not cover, you would need to use Google Sheets as a workaround or connect via BigQuery
- Fewer destinations than most competitors. Porter supports Data Studio, Google Sheets, Power BI, and BigQuery. No Tableau, no Snowflake, no Redshift
- Built exclusively for marketers (social media, PPC, e-commerce, CRM). Not a general-purpose data pipeline
- No SQL editor. Everything is managed through natural language, visual interface, and AI
- Not SOC2 Type 2 certified yet. Porter offers NDAs and client-owned BigQuery as alternatives
Porter Metrics Pricing (source: portermetrics.com/pricing, verified April 2026)
Pay per data source account. All destinations included. Price per account decreases as you add more.
Supermetrics
Market-Leading Data Connector
Supermetrics is the market leader in marketing data connectors. With 150+ connectors and 19 destinations, it provides the largest connector library among dedicated marketing data tools after Funnel.io and Improvado. Supermetrics supports multiple destinations including Data Studio, Google Sheets, BigQuery, Snowflake, Power BI, and Excel. Pricing starts much lower than Funnel.io, though it scales up quickly with add-ons for destinations, sources, and accounts.
See our full Supermetrics alternatives review
- 150+ connectors, the largest library among marketing-specific ETL tools after Funnel.io
- Self-service signup with a 14-day free trial — no demo call required (unlike Funnel.io)
- Lower entry price: $37/mo vs. Funnel.io’s $2,250/mo minimum
- Supports multiple destinations including BigQuery, Snowflake, Power BI, Excel, and Monday.com
- Complex per-destination pricing: each plan includes only 1 destination, and adding more costs $37–$187/mo each
- Storage and data warehouse destinations only available on the Enterprise plan
- Data transformations (custom metrics, custom dimensions) are not included on any self-service plan
- Customer support is slow: email or chat only, with response times from days to weeks according to G2 reviews
- No free plan available
Supermetrics Pricing (source: supermetrics.com/pricing, verified April 2026)
Pricing depends on destination, data sources, accounts, and users. Each plan includes 1 destination. Annual billing saves ~20%.
Windsor.ai
Multi-Touch Attribution + Data Connectors
Windsor.ai combines marketing data connectors with multi-touch attribution modeling. Founded in 2017 in Zurich, Switzerland, and acquired by team.blue in January 2026, Windsor offers competitive pricing starting at $23/mo with a generous free plan (1 source, 1 account, 5M MAR). It provides 325+ connectors and supports most major destinations. At roughly 10% of Funnel.io’s entry price, Windsor.ai is a strong budget option for teams that need many connectors. See our full Windsor.ai alternatives comparison.
- Free forever plan with 1 data source and 5M monthly attributed records
- 325+ connectors at a fraction of Funnel.io’s cost ($23/mo vs. $200/mo)
- Built-in multi-touch attribution modeling — unique among connector tools
- Supports all major destinations: Data Studio, Sheets, BigQuery, Snowflake, Redshift, Power BI
- SOC2 + HIPAA compliant
- Connector instability: users report broken fields, silent sync failures, and inconsistent data under heavy BigQuery usage
- Too technical for marketers: requires choosing schemas, selecting fields, and mapping them to destinations manually
- Limited data backfill: scheduling only allows 60 days or 6 months of historical data to BigQuery
- Raw data output requires SQL knowledge to clean and structure
- Basic plan limited to 5 destination tasks (each table synced = 1 task)
Windsor.ai Pricing (source: windsor.ai/pricing, verified April 2026)
Pricing based on data sources, accounts, and destination tasks. Free plan available with limitations.
Dataslayer
Budget-Friendly Marketing ETL
Dataslayer is a budget-friendly marketing data connector founded in 2020 in Madrid. It scores an impressive 4.8/5 on G2 (295 reviews, 88% five-star), making it the highest-rated tool on this list. Its pricing structure mirrors Supermetrics but at a lower price point. For teams leaving Funnel.io due to high costs, Dataslayer offers significant savings while covering the most common marketing data sources. See our full Dataslayer alternatives comparison.
- Highest G2 rating on this list: 4.8/5 with 295 reviews (88% five-star)
- Significantly cheaper than Funnel.io: $39/mo vs. $200/mo for entry plans
- Free plan available for testing
- Marketing Mix Modeling (Morpheus) for large advertisers
- Only 51 connectors vs. 590 on Funnel.io — may not cover all your data sources
- No built-in storage: relies entirely on direct API calls
- Data blending and AI features only available from the Advanced plan ($139/mo)
- Enterprise destinations (BigQuery, Snowflake) have strict row limits on lower plans
- Only 1 core destination per plan, additional destinations require add-ons
Dataslayer Pricing (source: dataslayer.ai/new-pricing, verified April 2026)
Pricing mirrors Supermetrics: per data source, per account, per destination. Annual billing saves ~20%.
Coupler.io
ETL-First, Spreadsheet-Focused
Coupler.io is an ETL-focused platform that specializes in moving data to spreadsheets. With 400+ connectors and destinations including Google Sheets, Excel, BigQuery, Data Studio, and Power BI, it covers a broad range of data sources. Its workflow-based approach lets you set up scheduling and transformations. For teams switching from Funnel.io who primarily need data in Google Sheets, Coupler.io is a strong alternative at a fraction of the cost. See our full Coupler.io alternatives comparison.
- 400+ connectors — broad coverage for both marketing and non-marketing data sources
- Free plan available with 100 rows per run
- Self-service signup — no demo required (unlike Funnel.io)
- Workflow-based ETL with scheduling and built-in transformations
- Highest G2 rating among broad ETL tools: 4.9/5
- Spreadsheet-first design means it may not be ideal for teams that need marketing-specific data models
- Free plan is extremely limited: 100 rows per run, no auto-refresh, 1 active data flow
- Data arrives as raw tables: users must build their own joins and data combinations
- No built-in report templates or marketing dashboards
- No built-in data blending — you must configure data combinations manually
Coupler.io Pricing (source: coupler.io/pricing, verified April 2026)
Workflow-based pricing per account. Annual billing saves ~25%.
Improvado
Enterprise Marketing Analytics
Improvado is an enterprise marketing analytics platform with 500+ connectors and a marketing-specific data model (MCDM) that normalizes terminology across platforms. Like Funnel.io, it targets large organizations with annual contracts and custom pricing. With SOC2, HIPAA, and GDPR compliance, Improvado competes directly with Funnel.io for enterprise budgets. The key difference is Improvado’s AI-powered analyst (Improvado AI Agent) that lets non-technical users query data in natural language. See our full Improvado alternatives comparison.
- 500+ connectors with unlimited accounts included — no per-connector upselling
- Marketing Common Data Model (MCDM) normalizes metrics across platforms automatically
- AI Agent for natural language data queries and automated insights
- SOC2, HIPAA, and GDPR compliant — meets strict enterprise security requirements
- Dedicated Customer Success Manager on all plans
- Most expensive option: estimated ~$3,400/mo minimum, annual contracts only
- No self-service: demo required, no free trial, no free plan
- Complex onboarding process that can take weeks
- Row-based pricing: 200M rows/year on Growth, which can be consumed quickly with high-volume accounts
- Enterprise-only focus makes it inaccessible for small teams and agencies
Improvado Pricing (estimated from proposals, March 2026)
Per data volume (rows/year). Annual contracts only. Unlimited connectors and accounts included.
Whatagraph
Visual Reporting Platform
Whatagraph is an all-in-one marketing reporting platform with built-in dashboards, white-label reports, and data transfer to BigQuery and Google Sheets. It is a fundamentally different product from Funnel.io: while Funnel.io is an ETL platform that feeds data to external visualization tools, Whatagraph is a reporting tool that includes its own dashboard builder. For teams that want beautiful marketing reports without setting up Data Studio or Tableau, Whatagraph provides a self-contained solution. See our full Whatagraph alternatives comparison.
- Free forever plan with 5 source credits and access to Essential integrations
- Built-in visual report builder with white-label options — no need for external BI tools
- Automated report scheduling and email delivery to clients
- Data transfer to BigQuery, Google Sheets, and Data Studio on paid plans
- Drag-and-drop interface designed for non-technical marketers
- Expensive paid plans: Start plan at ~$270/mo is comparable to Funnel.io’s Starter
- Only 62 connectors vs. 590 on Funnel.io — significantly fewer data source options
- Not a pure ETL tool: primarily a reporting platform with some data transfer capabilities
- Advanced integrations (like TikTok Ads, Pinterest) require the Boost plan (~$675/mo)
- Limited customization compared to Data Studio or Tableau for advanced visualizations
Whatagraph Pricing (source: whatagraph.com/pricing, verified April 2026)
Per source credits (1 credit = 1 connected account). Integrations tiered by plan.
Adverity
Enterprise Marketing Data Harmonization
Adverity is an enterprise-grade marketing data platform that connects 600+ data sources and automates data harmonization, governance, and enrichment. It is designed for large marketing organizations that need to centralize data from dozens of platforms into a single, governed data model. Adverity emphasizes AI-powered insights and automated workflows with enterprise compliance (SOC2, GDPR).
Unlike Funnel.io, Adverity focuses more on data quality and governance rather than raw data movement. It includes built-in anomaly detection, automated data quality checks, and AI agents that surface insights without manual query building. However, like Funnel.io, it targets enterprise budgets and requires a demo to get pricing.
- 600+ connectors covering marketing, sales, e-commerce, and finance data sources
- Advanced data harmonization: automatic field mapping, deduplication, and data quality scoring
- AI-powered anomaly detection and automated insights — surfaces performance changes before you ask
- Enterprise-grade security: SOC2 Type 2, GDPR compliant, SAML SSO, and role-based access controls
- Flexible data destinations including BigQuery, Snowflake, Redshift, Azure, and any SQL database
- No public pricing — requires a demo call and custom quote, similar to Funnel.io’s Enterprise tier
- No free plan or self-service signup. You cannot test the product without going through sales
- Steep learning curve: the platform is powerful but complex, requiring onboarding and training
- Overkill for small teams or agencies — designed for enterprise marketing operations with 50+ data sources
- No native dashboard or reporting UI — you need a separate BI tool (Data Studio, Tableau, Power BI) to visualize data
Adverity Pricing (source: adverity.com, verified April 2026)
Custom pricing only. Adverity does not publish pricing on its website. All plans require a demo call.
Domo
All-in-One BI & Data Platform
Domo is a cloud-based BI platform that combines data integration, visualization, and AI-powered analytics into a single tool. With 1,000+ pre-built connectors, it offers the largest connector library on this list. Unlike Funnel.io which only handles data movement, Domo includes dashboards, alerts, AI agents, and embedded analytics out of the box.
Domo’s biggest advantage over Funnel.io is its free tier and self-service model. You can sign up, connect data, and build dashboards without talking to sales. However, Domo is a general-purpose BI tool, not a marketing-specific platform — so it lacks the marketing-specific data transformations that Funnel.io provides (campaign normalization, ad spend unification, etc.).
- 1,000+ connectors — the largest library on this list, covering marketing, sales, finance, HR, and operations
- Free plan available with full platform access, unlimited users, and onboarding support
- Built-in dashboards and visualizations — no separate BI tool required (unlike Funnel.io, Adverity, or Supermetrics)
- AI-powered agents that answer questions about your data in natural language
- Self-service signup with 30-day free trial — no demo call required
- Supports embedded analytics: build customer-facing dashboards within your own product
- Not marketing-specific: no built-in campaign normalization, UTM unification, or ad spend blending like Funnel.io or Porter Metrics
- Paid pricing is opaque — custom quotes only, and enterprise plans can be very expensive
- Complex platform with a steep learning curve — many features that marketing teams will never use
- Does not export to Data Studio or Google Sheets natively — dashboards live inside Domo’s own ecosystem
- Free plan limitations may push you to paid tiers quickly as data volumes grow
Domo Pricing (source: domo.com/pricing, verified April 2026)
Pay-as-you-go model. Free tier available. Paid plans based on usage (data rows, queries, users).
TapClicks
AI-Powered Marketing Intelligence
TapClicks is a marketing intelligence platform built for agencies, brands, and franchises. It combines data unification, automated reporting, and AI-powered insights into a single platform. TapClicks’ claim to fame is its 10,000+ connectors via its TapData marketplace, which includes direct API integrations, Google Sheets imports, and custom file uploads.
Compared to Funnel.io, TapClicks is more focused on reporting and client delivery than raw data pipelines. It includes built-in report builders, automated PowerPoint generation (SmartSlides), and white-label client portals. For agencies that need to deliver polished reports to clients, TapClicks covers the full workflow from data to presentation — something Funnel.io does not do.
- Massive connector library (10,000+ via TapData) covering virtually every marketing and advertising platform
- Built-in automated reporting with SmartSlides (auto-generated PowerPoint reports with AI insights)
- White-label client portals and mobile apps for agency client delivery
- AI-powered insights and goals/pacing with predictive analytics
- All-in-one platform: data warehousing, dashboards, reporting, and order management in a single tool
- No public pricing — all plans require contacting sales for a custom quote
- No free plan or self-service trial available
- Complex platform with 4 tiers (SmartStory, SmartReports, SmartAnalytics, SmartSuite) that can be confusing to navigate
- Does not export to Data Studio, Google Sheets, or BigQuery natively — reporting lives inside TapClicks
- Primarily US-focused: most users and case studies are from North American agencies
TapClicks Pricing (source: tapclicks.com/pricing, verified April 2026)
Custom pricing across 4 tiers. All plans require contacting sales.
Frequently asked questions
Domo ($0, free plan), Porter Metrics ($15/mo), Windsor.ai ($23/mo), Coupler.io ($32/mo), Supermetrics ($37/mo), and Dataslayer ($39/mo) all start well below Funnel.io’s $2,250/mo minimum. Porter Metrics, Windsor.ai, Dataslayer, Coupler.io, and Whatagraph also offer free forever plans.
For Data Studio, keep the same report template and replace data source connections. Field names may differ, so remap fields. For BigQuery pipelines, table structures vary between tools, so queries need adapting. For Google Sheets, rebuild formulas in the new tool’s syntax. Porter Metrics handles migration end-to-end at no extra cost.
Porter Metrics (native connectors, 50+ templates, data blending), Supermetrics (150+ connectors, largest library), Dataslayer (affordable, similar model), and Windsor.ai (325+ connectors, free plan). All four offer direct Data Studio integration without needing a data warehouse.
For BigQuery: Porter Metrics (built-in managed storage), Supermetrics (Enterprise plan), and Dataslayer. For Snowflake and Redshift: Supermetrics, Improvado, Windsor.ai, and Adverity. For general-purpose ETL: Fivetran (700+ connectors), Stitch (140+ sources), and Airbyte (open-source option).
Porter Metrics (white-label, agency templates, multi-client monitoring from $15/mo), Whatagraph (built-in white-label reports, automated client delivery), and Dataslayer (budget-friendly ETL for PPC agencies). For enterprise agencies with large budgets: Improvado offers dedicated account management and SOC2 compliance.
No. Funnel.io removed its free plan in December 2025. The cheapest option is the Starter plan at $2,250/month (billed annually), and you must book a demo to start. Alternatives with free plans include Porter Metrics, Windsor.ai, Dataslayer, Coupler.io, and Whatagraph.
Funnel.io is worth it for enterprise data teams that need 500+ connectors, data governance, SOC2 compliance, and a managed data warehouse. For small/mid marketing teams and agencies, the $200–$800/month cost and complex setup process make it overkill. Tools like Porter Metrics ($15/mo) or Supermetrics ($37/mo) cover the most common marketing use cases at a fraction of the cost.