


Some Polar Analytics alternatives include Porter Metrics, Supermetrics, Funnel, Windsor AI, Power My Analytics, Dataslayer, and AgencyAnalytics.
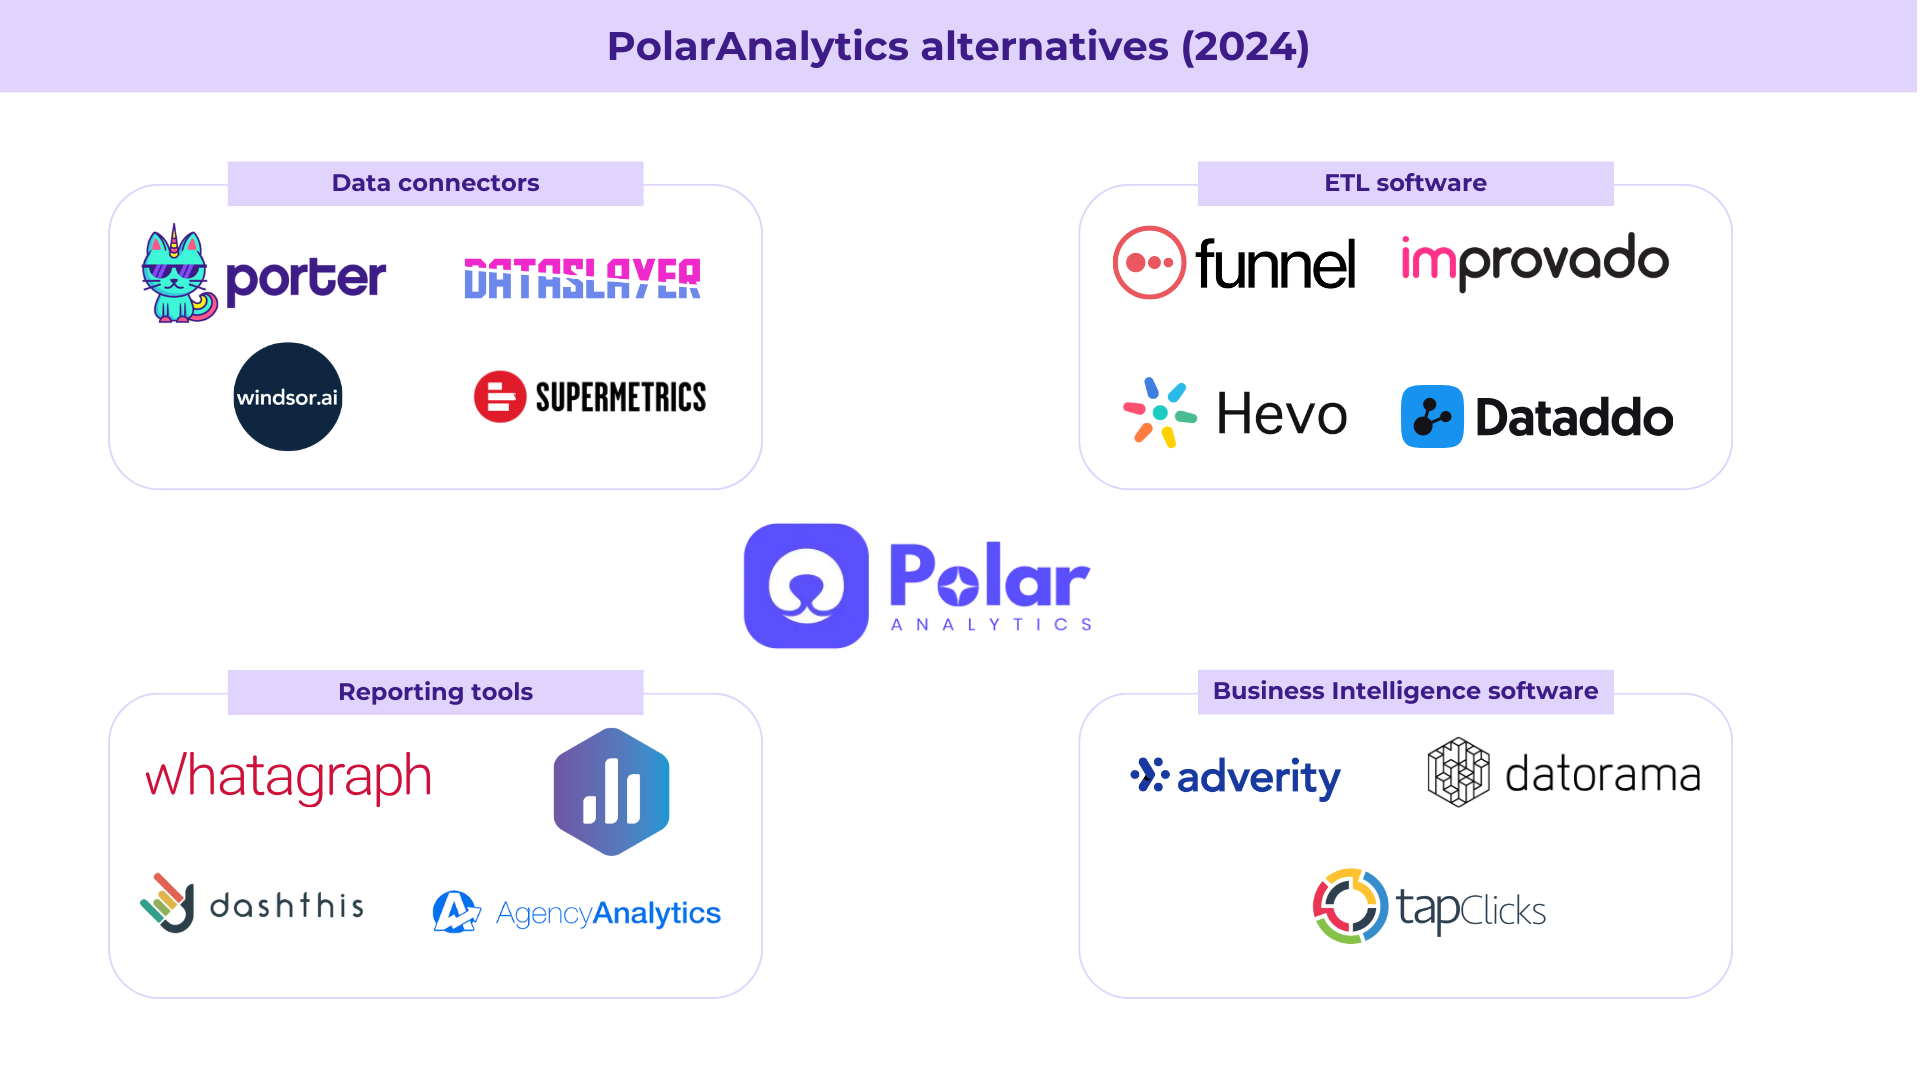
The best Polar Analytics alternatives to try
- Porter Metrics for medium-sized marketing teams and agencies.
- Funnel.io for teams that need ETL and data transformation capabilities.
- Windsor AI if you are looking for a marketing attribution solution.
- Power My Analytics data warehouse and data connectors.
- DataSlayer for affordable and lower usage reporting due to API limits.
- Agency Analytics for marketing agencies needing robust client management.
- Supermetrics for marketing teams and agencies that want advanced analytics capabilities.
Polar Analytics alternatives comparison at a glance
Polar Analytics alternatives feature comparison
| Comparison criteria | Supermetrics | Agency Analytics | Dataslayer | Windsor AI | Power My Analytics | Funnel | Porter Metrics | Polar Analytics |
|---|---|---|---|---|---|---|---|---|
| Data Sources | 200+ | 80+ | 45+ | 200+ | 45 | 500 | 18 | 45 |
| Data sources included in their first plan tier | “Only 4 data sources: Facebook Ads, Google Analytics 4, and Google Ads ⛔️” | All data sources (80+) ✅ | All data sources (45+) ✅ | All data sources (100+) ✅ | All data sources (45+) ✅ | All data sources (230+) ✅ | All data sources included (19+) ✅ | |
| Refresh time frequency | “Hourly, Daily, Weekly ✅” | Daily ✅ | “Daily, with API limits ⛔️” | Daily or hourly ✅ | Daily ✅ | Daily or every 2 hours ✅ | Daily or every 12 hours ✅ | Daily ✅ |
| Refresh time frequency for their first plan tier | Weekly ⛔️ | Daily ✅ | “Daily, with API limits ⛔️” | Daily ✅ | Daily ✅ | Daily ✅ | Daily ✅ | Daily ✅ |
| Report templates | Yes ✅ | Yes ✅ | Yes ✅ | Yes ✅ | Yes ✅ | Yes ✅ | Yes ✅ | Yes ✅ |
| Destinations | 16 | 4 | 13 | 8 | 20+ | 2 | 2 | |
| Starting price | $37/mo | 60/mo | 35/mo | 23/mo | “14,9/mo” | 1100/mo | “14,99/mo” | 300/mo |
| Free trials | Yes✅ | Yes✅ | Yes✅ | Yes✅ | Yes✅ | Yes✅ | Yes✅ | Yes✅ |
| Pricing model | “Based on data sources, user seats, destinations” | Per-client campaign pricing | Usage-based | Based on usage | Based on usage | Usage-based “Flexpoints” | Based on # of accounts connected | Based on order volume |
| Users access | Limited users per plan ⛔️ | Limited users per plan ⛔️ | Limited users per plan ⛔️ | Unlimited users and admins ✅ | Limited users per plan ⛔️ | Limited users per plan ⛔️ | Unlimited users and admins ✅ | Unlimited users and admins ✅ |
| User reviews on G2Crowd | 4.5 | “4,7” | “4,8” | “4,8” | “4,4” | “4,5” | “4,5” | 5 |
| Drawbacks | “Complex pricing, slow/unstable data without paid storage” | Limited data flexibility vs. ETL tools | Unpredictable pricing for high volumes | Some technical skills required | Limited transformation options | “High learning curve, expensive pricing” | Limited integrations compared to competitors | Less flexible than modular tools |
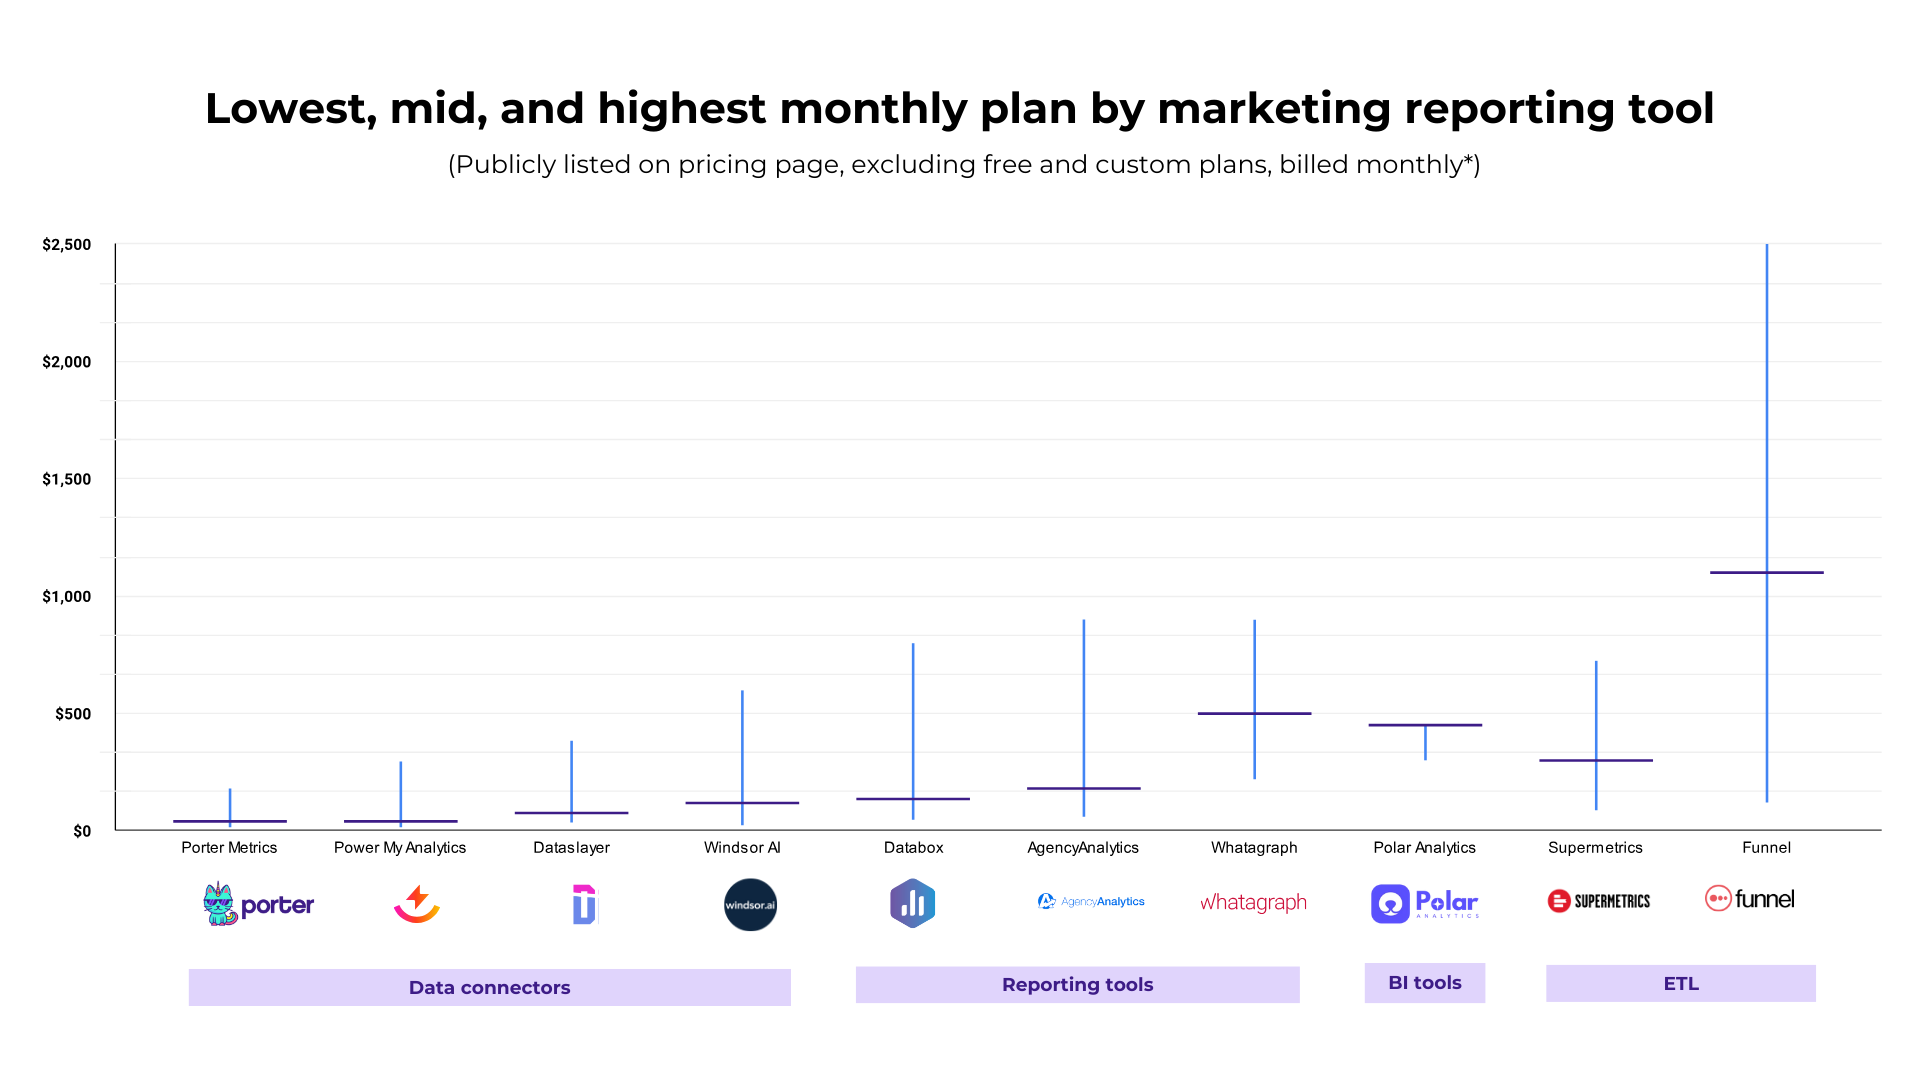
Polar Analytics alternatives pricing comparison
Pricing of Polar Analytics alternatives vary a lot. We’ve compiled their listed monthly plans, but remember, pricing models differ. For example, Porter Metrics bills per connected account, while Polar Analytics bills per tracked order. Most offer trials and some have freemium plans.
TL;DR:
If you’re looking for a budget-friendly Polar Analytics alternative for your marketing team or agency, Porter Metrics, Windsor AI, and Power My Analytics are the best choices for balancing features and budget.
Funnel might seem better in price at first sight, but the reality is that their “flexpoints” pricing system might affect your experience as a user because if you exceed the quotas, your costs will escalate quickly.
And definitely, if you are not looking for advanced e-commerce features, AgencyAnalytics and Dataslayer are more affordable options.
| Provider | Starting Price | Mid Plan | Highest Price | Average Price | Pricing Unit | Service Type | Free Plans |
|---|---|---|---|---|---|---|---|
| Porter Metrics | $15 | $40 | $180 | $78 | Accounts | Self-Service | 14-day free trial |
| Supermetrics | $37 | $299 | $724 | $370 | Data Sources | Self-Service | 14-day free trial |
| Funnel | $120 | $1,100 | $2,500 | $1,240 | Flexpoints | Self-Service | Freemium |
| Windsor AI | $23 | $118 | $598 | $246 | Data Sources | Self-Service | Freemium |
| Power My Analytics | $15 | $40 | $295 | $117 | Data Sources | Self-Service | 14-day free trial |
| Dataslayer | $35 | $76 | $383 | $165 | API Calls | Self-Service | Freemium |
| AgencyAnalytics | $60 | $180 | $900 | $380 | Client Campaigns | Self-Service | 14-day free trial |
| Polar Analytics | $300 | $450 | $450 | $400 | Orders | Sales Call | No |
| Databox | $47 | $135 | $799 | $327 | Data Source Connections | Self-Service | Freemium |
| Whatagraph | $219 | $499 | $899 | $539 | Source Credits | Sales Call | 7-day free trial |
Generally, the cost of marketing data connectors falls between $15/mo and $200/mo, whereas reporting or ETL tools are priced from $300/mo to $2,000/mo.
Consider these aspects to compare pricing:
- Compliance and Security: Pay attention to crucial certifications like SOC 2 Type 2 and features like SSO sign-in.
- Service Type: Tools that involve sales or onboarding calls tend to be costlier (about $300/mo), while self-service tools are usually more affordable.
- Documentation and Resources: Having access to tutorials, templates, and comprehensive documentation can optimize your workflow.
- Support and Training: Assess the availability of support, communication channels (chat, email, phone), and the provision of custom training and reporting services.
- Segment: SMBs often prioritize quick setup, ease of use, and flexible, affordable pricing, while enterprises value compliance and security features.
Criteria to choose a Polar Analytics alternative
Chiefmartec says there are over 200 marketing analytics solutions, and most also offer marketing reporting automation and data management features, so finding actual alternatives to Polar Analytics is tough.
I’ll share my perspective as a marketing analytics tech founder and Polar Analytics competitor. You might expect me to favour Porter, but I dive deep into all reporting tools, considering their features and limitations that only become clear after you use them.
I created a framework to help you evaluate and choose a Polar Analytics alternative and a marketing reporting tool that evaluates:
Features
- Data integrations – assess quality, ease of use, availability, speed, fields, granularity, stability, accuracy, freshness, historical data access, and date range flexibility.
- Data transformation – look for data normalization, blending, filtering, custom metrics, custom dimensions, and rule-based custom values for complex reporting.
- Destinations – consider options like vertical reporting tools, spreadsheets, data visualization platforms, and data warehouses for reporting, visualization, and automation.
Solution types
Understand the strengths of different marketing analytics software categories:
- Built-in analytics
- Data connectors
- Data visualization tools
- Vertical reporting tools
- Tracking solutions
- Business intelligence platforms
- ETL solutions
- Attribution software
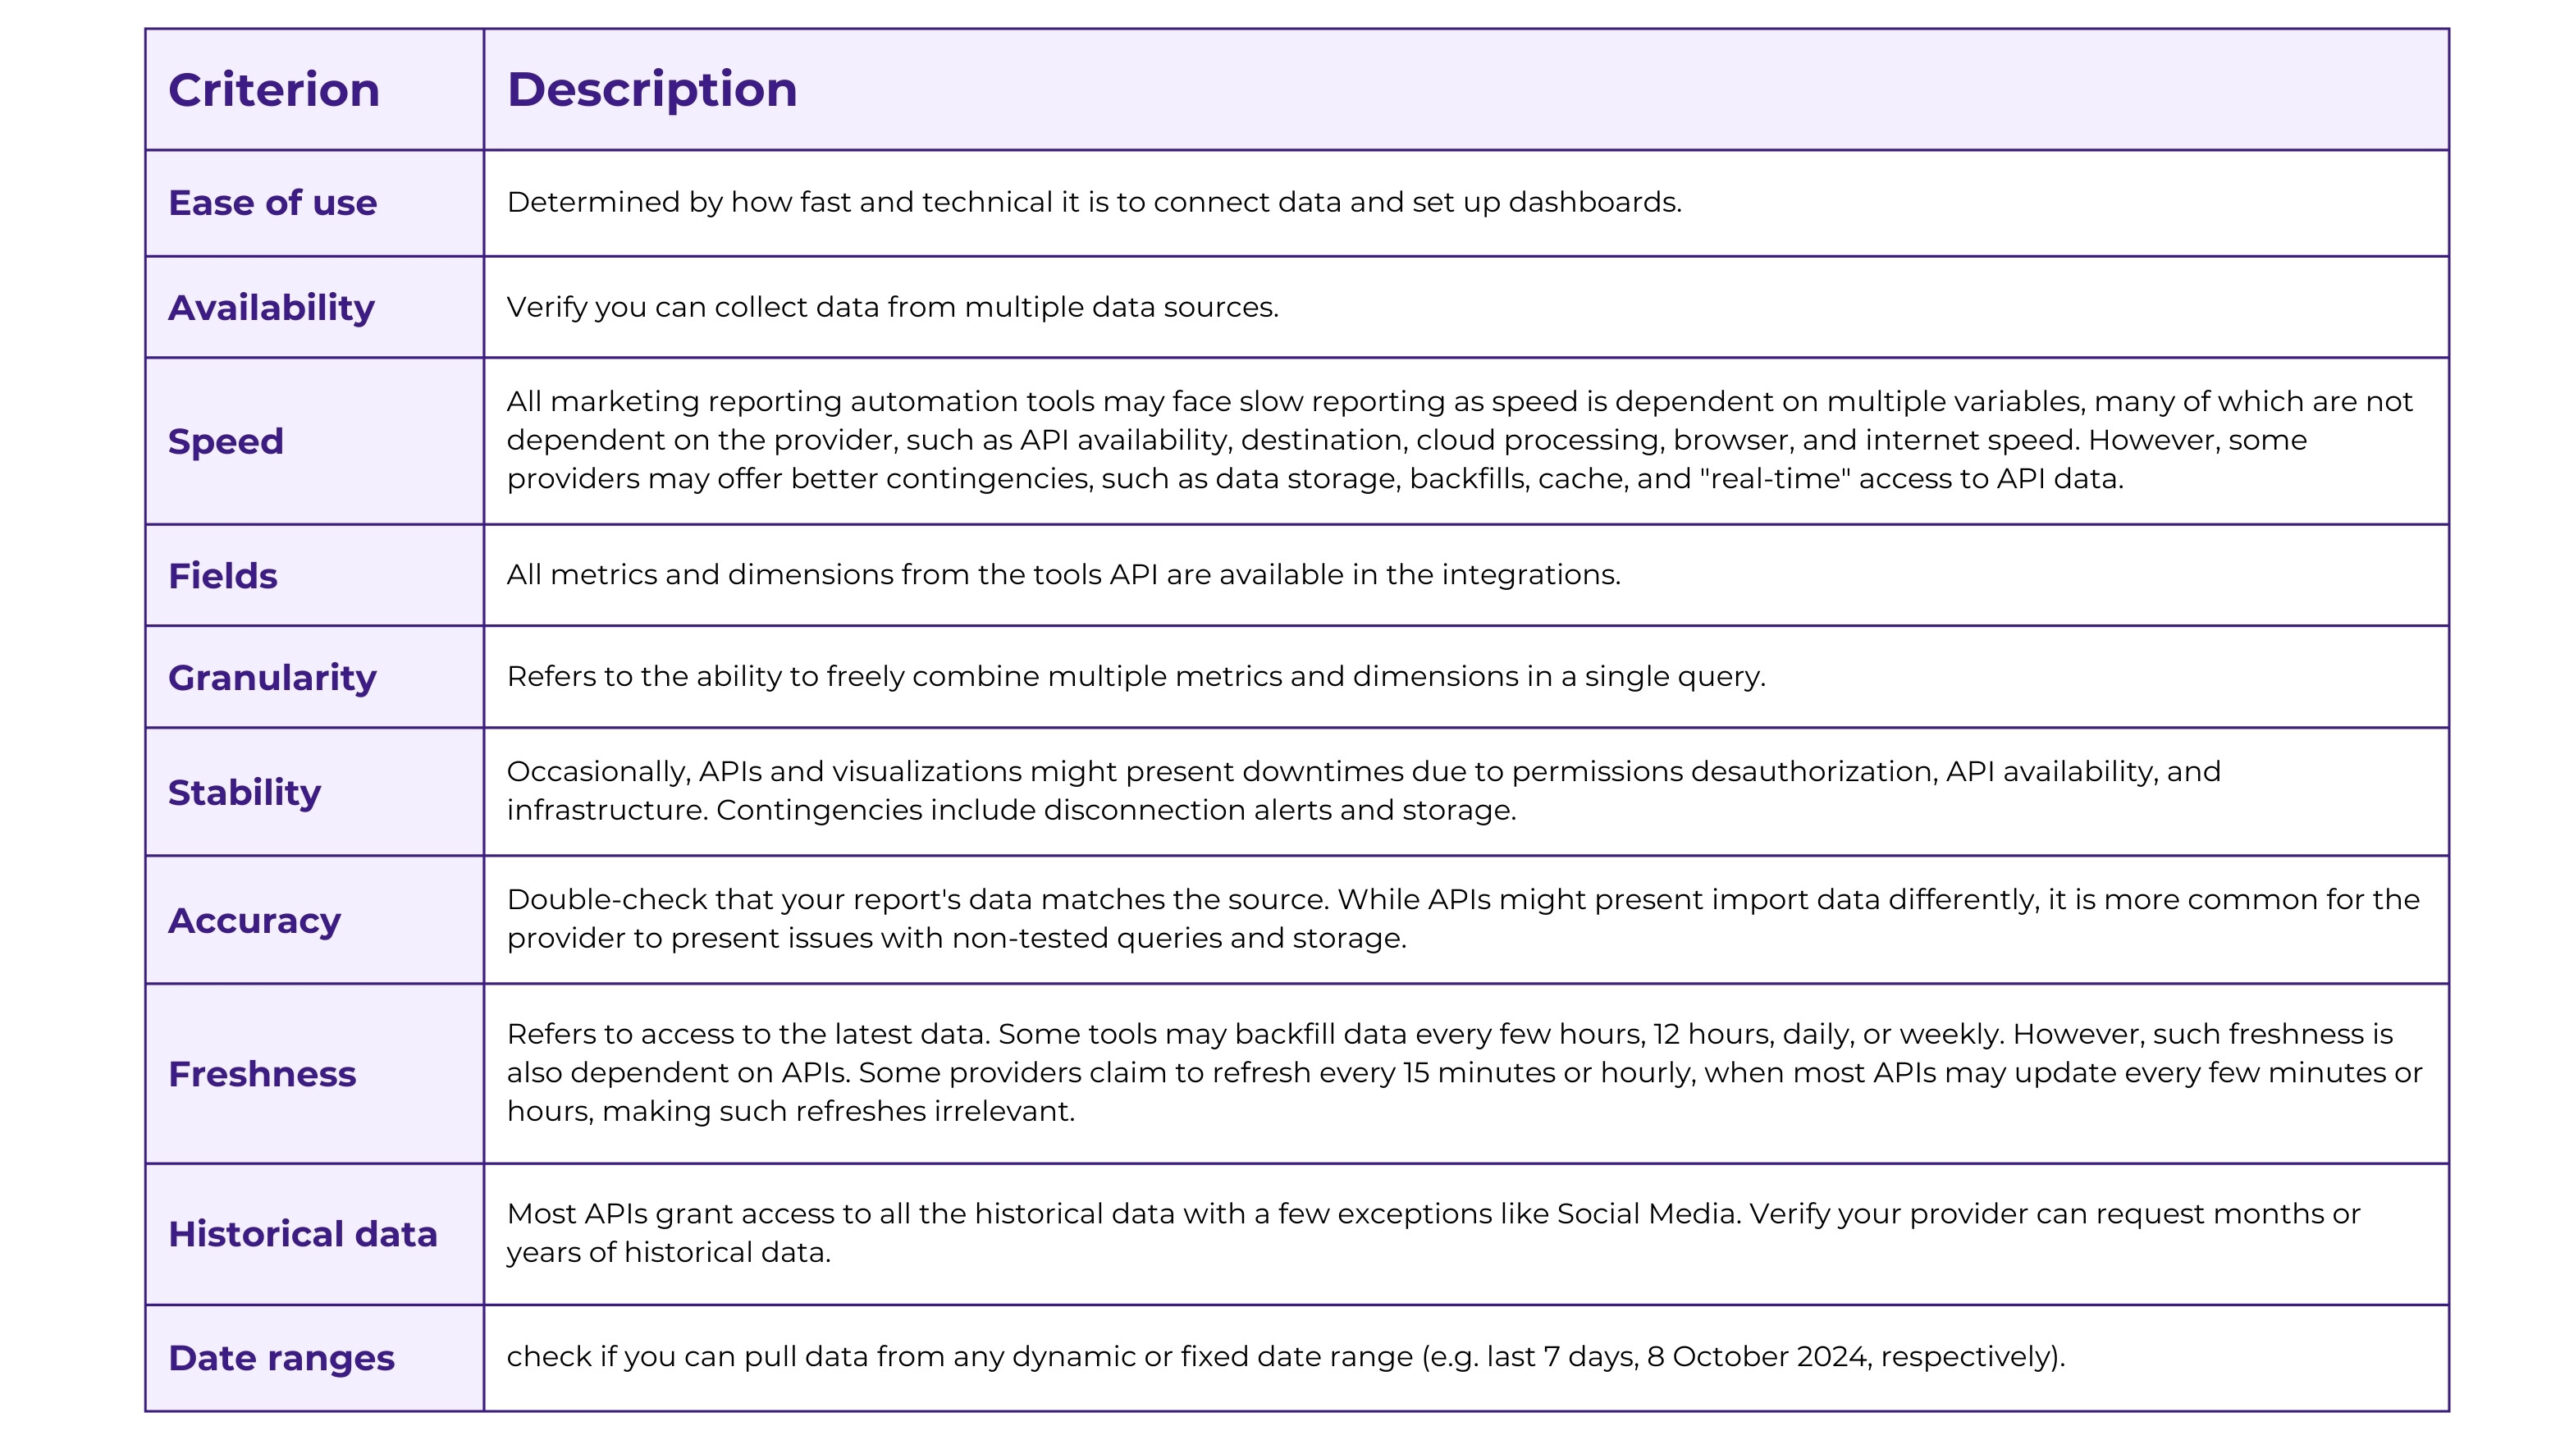
Integrations
When comparing integrations of Polar Analytics alternatives, assess criteria such as ease of use, availability, speed, granularity, field, stability, and accuracy.
Pricing
- Plans and models – compare pricing plans, models, and average costs of different providers.
- Additional factors – consider compliance, security, service type (self-service vs. sales calls), documentation, resources, support, and training beyond just the numbers.
Other considerations
- User management – check the number of users allowed and costs for additional users.
- Drawbacks – be aware of limitations like limited integrations, complex pricing, high learning curves, or lack of flexibility.
- Ease of use – evaluate the learning curve and user-friendliness.
- Templates – look for pre-built templates to quickly test and implement the tool.
Best Polar Analytics alternatives detailed comparison
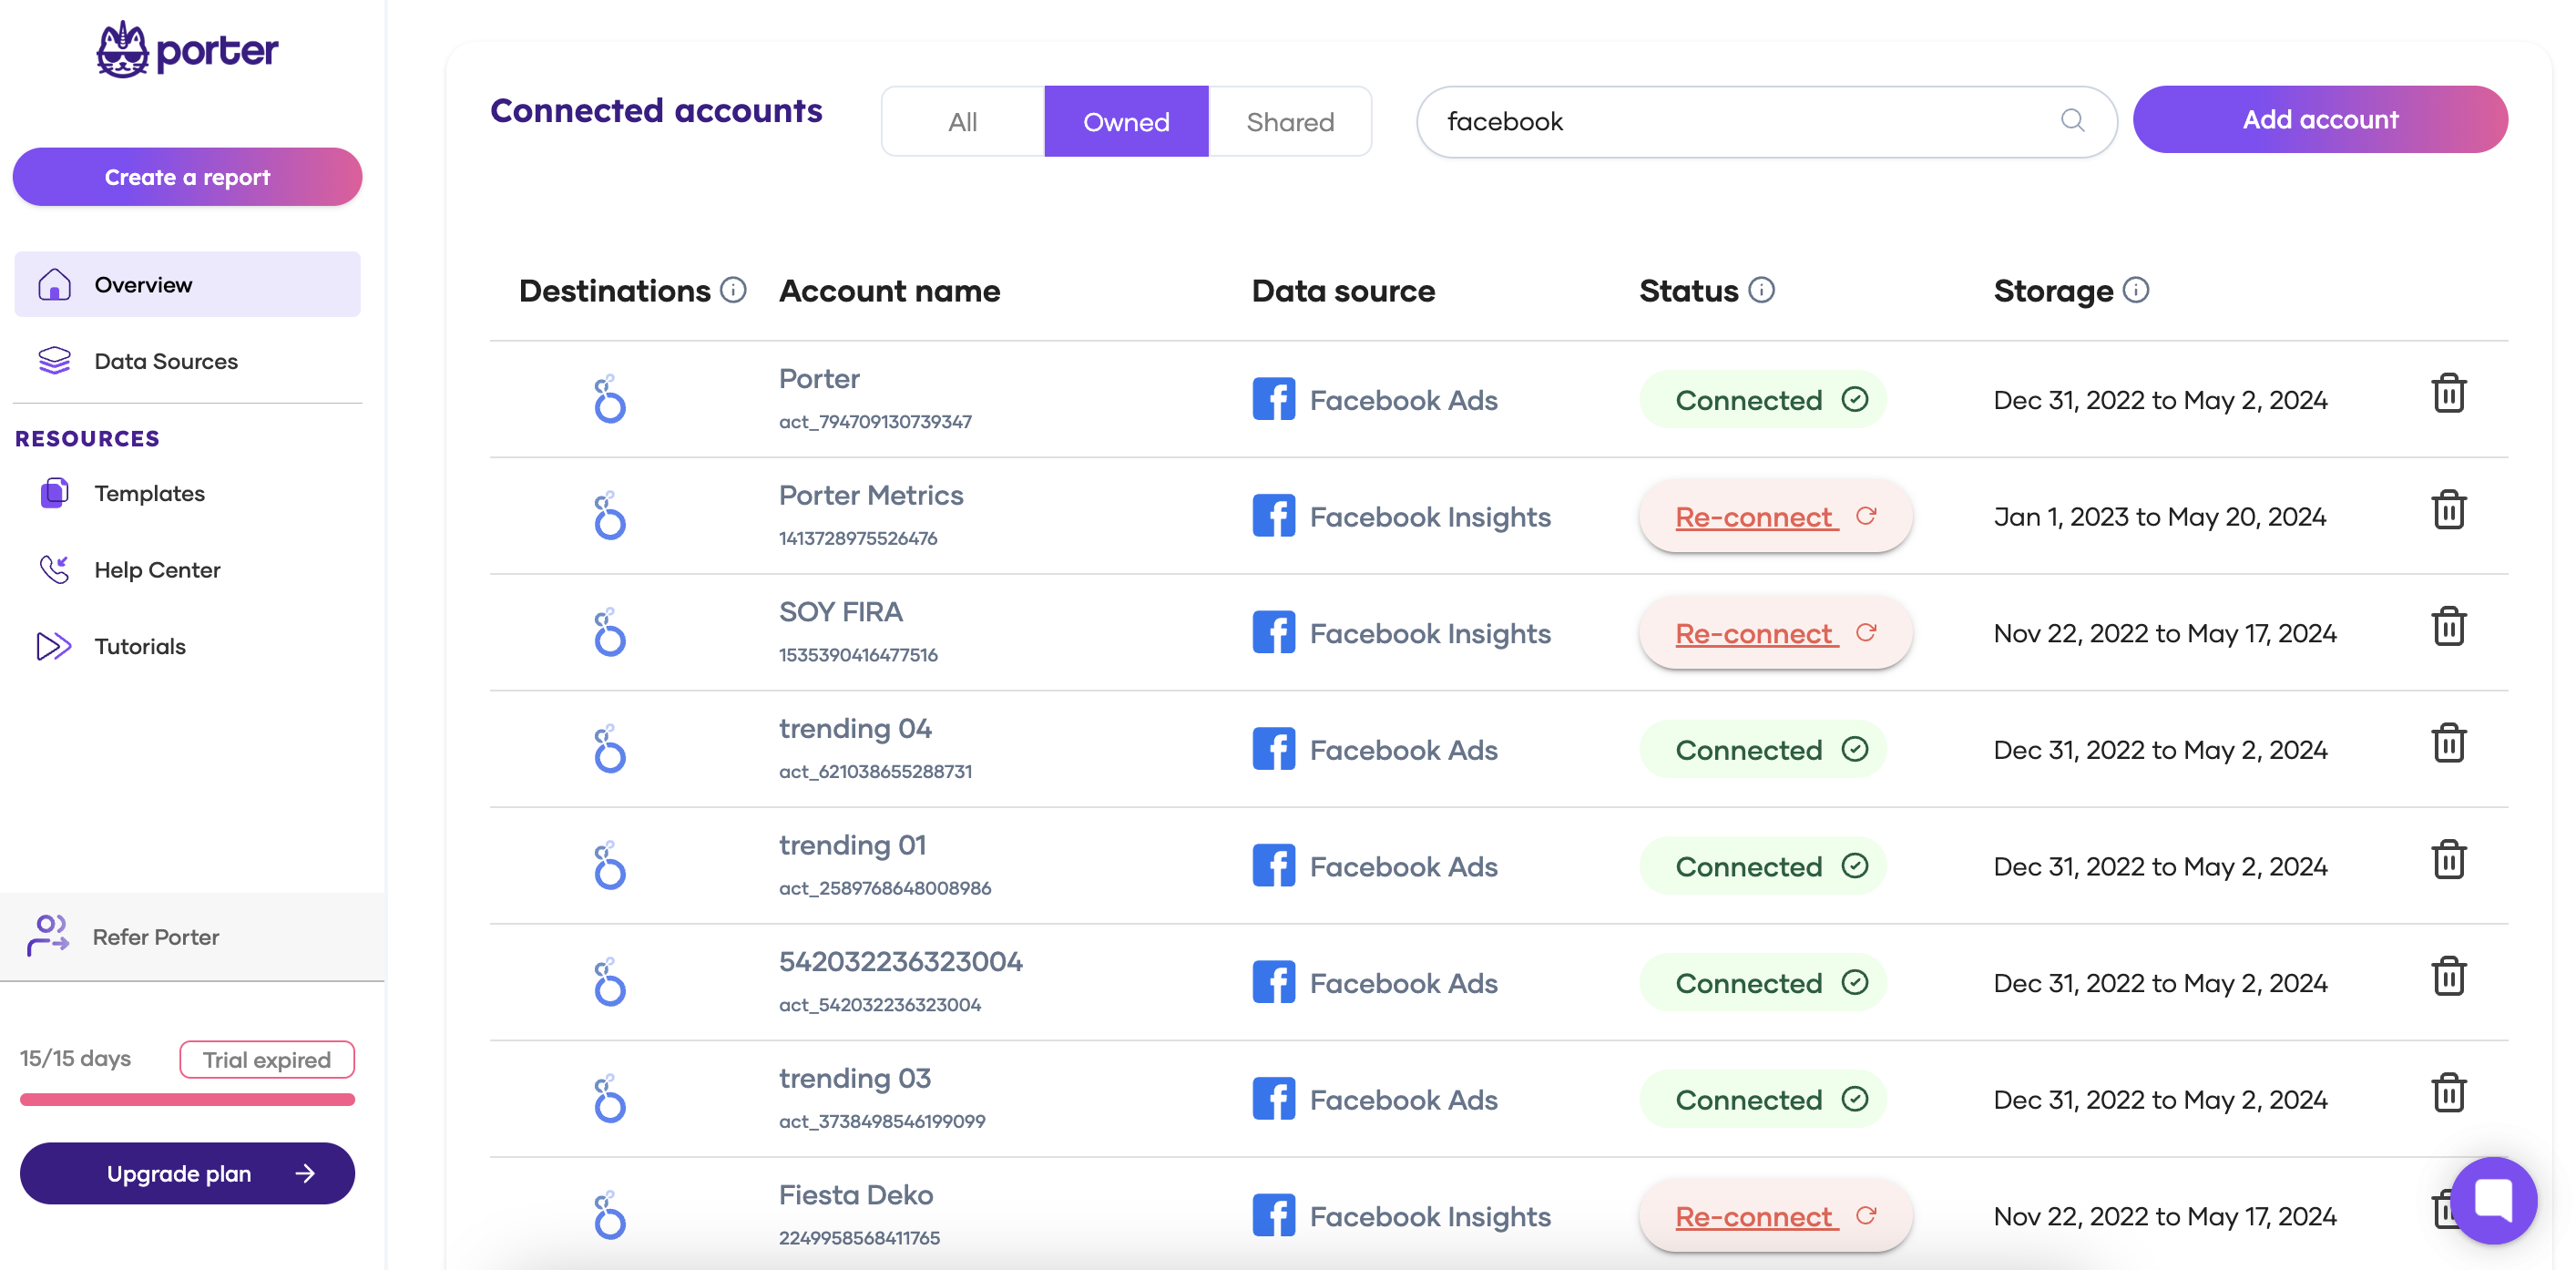
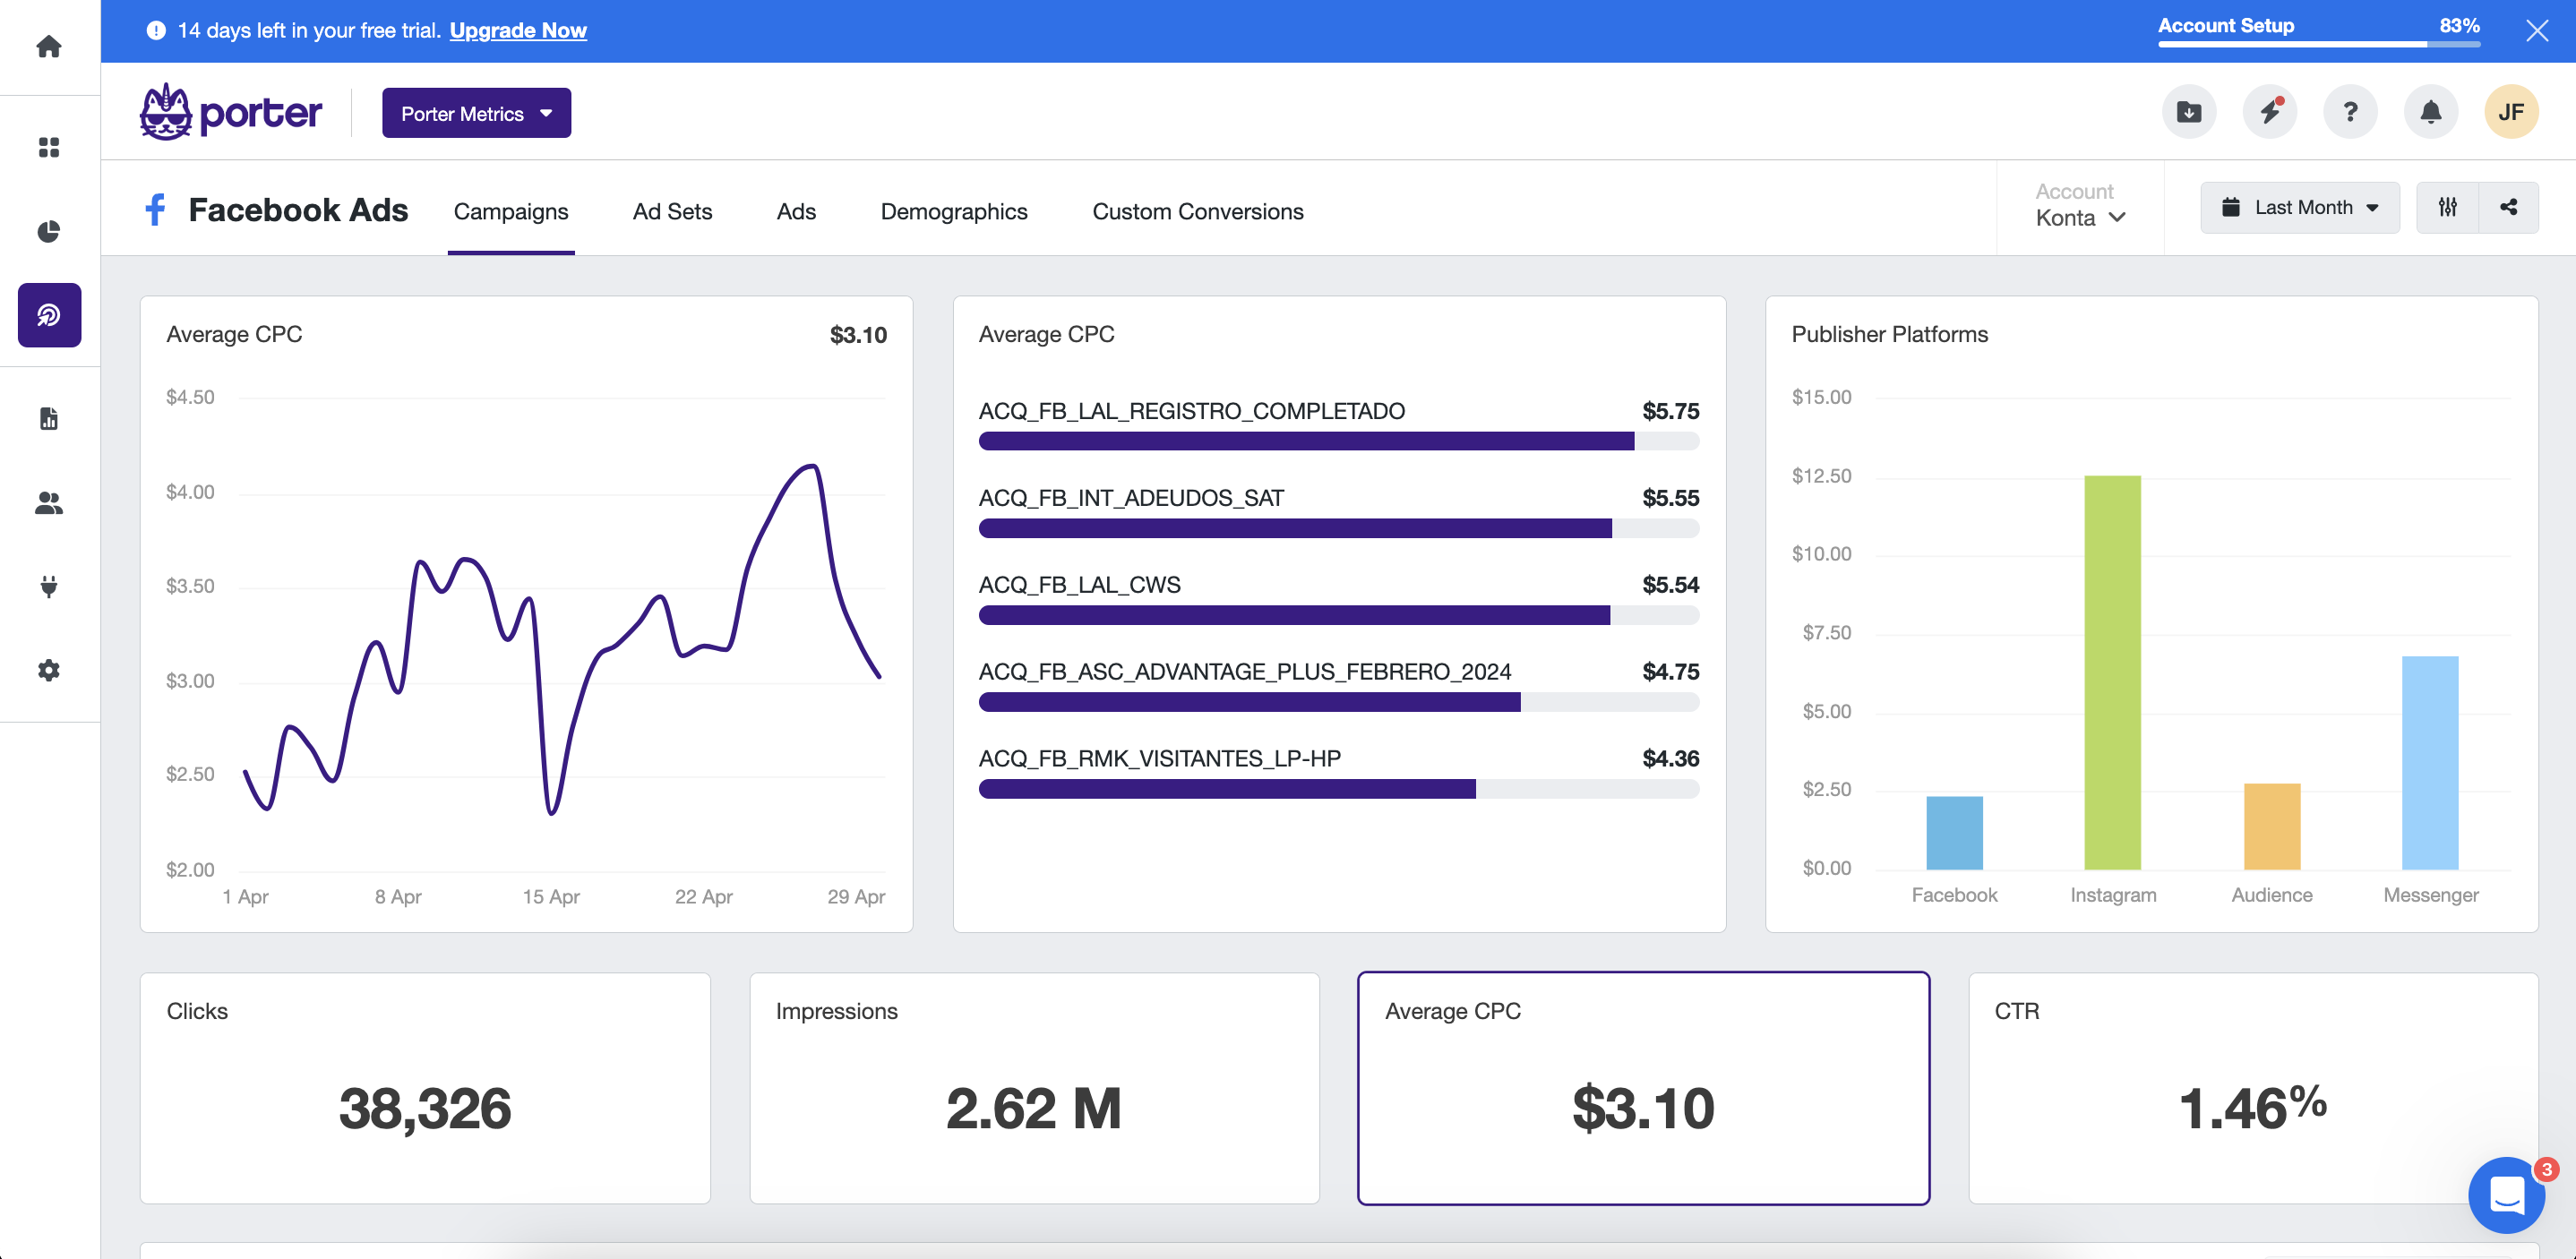
Porter Metrics
Porter Metrics is a no-code marketing reporting tool to measure marketing performance towards bottom-line, revenue and profit metrics with no data warehouses, scripts, or additional tools required, across all your marketing channels, products, clients, and campaigns.It connects to the most popular B2B and e-commerce marketing data for small businesses such as Shopify, HubSpot, GA4, Facebook Ads, and Instagram, to destinations like Data Studio (formerly Looker Studio) and GoogleSheets.
+100 Data Studio templates and +100 Youtube tutorials on marketing reporting. Used by +1,500 marketing teams in 60 countries.
Porter Metrics vs.Polar Analytics detailed comparison
| Comparison criteria | Data Sources | Data sources included in their first plan tier | Refresh time frequency | Refresh time frequency for their first plan tier | Report templates | Destinations | Starting price | Free trials | Pricing model | Users access | User reviews on G2Crowd | Drawbacks |
|---|---|---|---|---|---|---|---|---|---|---|---|---|
| Polar Analytics | 45 | All data sources included (23+) ✅ | Daily ✅ | Daily ✅ | Yes ✅ | 2 | 300/mo | Yes✅ | Based on order volume | Unlimited users and admins ✅ | 5 | Less flexible than modular tools |
| Funnel | 500 | All data sources (230+) ✅ | Daily or every 2 hours ✅ | Daily ✅ | Yes ✅ | 20+ | 1100/mo | Yes✅ | Usage-based “Flexpoints” | Limited users per plan ⛔️ | 4,5 | High learning curve, expensive pricing |
Porter Metrics pricing
Simple, flat pricing based solely on the number of connected accounts across various marketing platforms. Plans range from $14.99/month for 1 account to $180/month for 40 accounts. All plans include unlimited users, data destinations (Data Studio, Sheets), integrations, with no additional usage fees.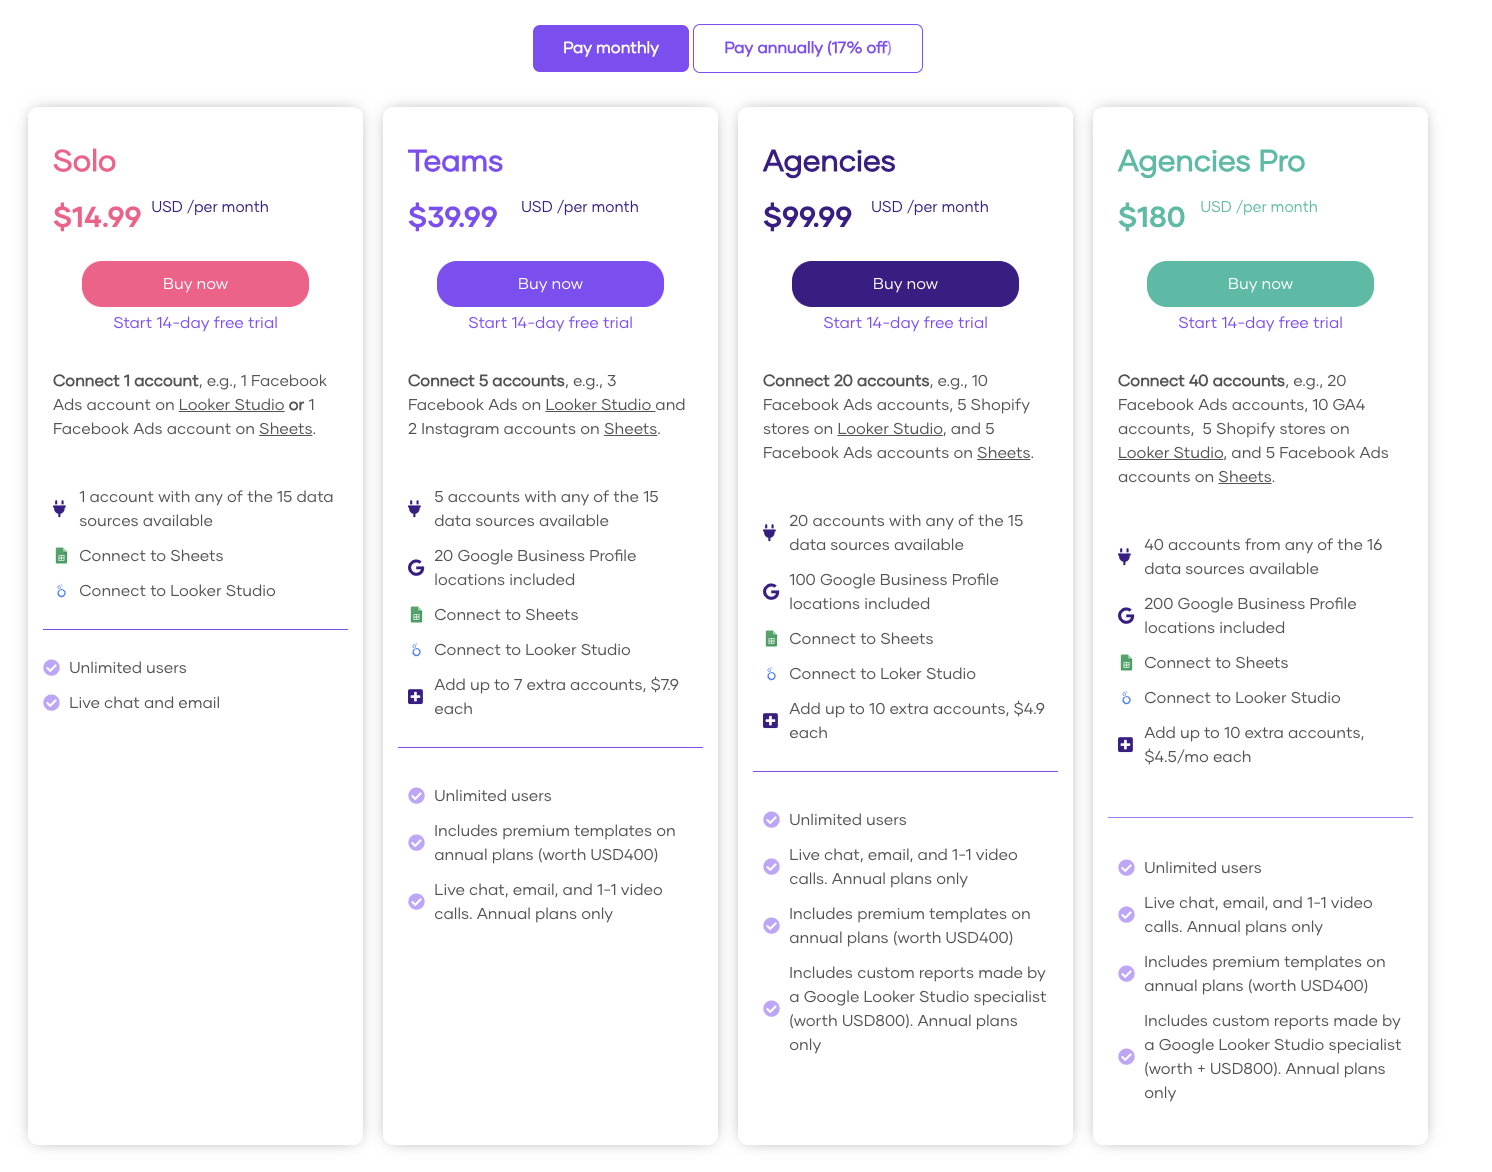
Porter Metrics offers a more affordable and versatile solution with unlimited data sources and users included in all plans, compared to Polar Analytics, which starts at a higher price point and is geared towards larger Shopify-based e-commerce brands. Polar Analytics charges based on tiers of e-commerce GMV, which can become costly as your order volume increases.
Porter Metrics’ extensive integrations, user-friendly approach, customizable templates, and Google Sheets integration make it ideal for a wider range of marketing needs, beyond just e-commerce. The customer success team provides support in English and Spanish via email, chat, and video calls, ensuring a smooth user experience.
Pros of choosing Porter Metrics as a Polar Analytics alternative
- No-code reporting tool connects to 19+ data sources, including Shopify, HubSpot, Facebook Ads, GA4, Instagram
- Self-managed BigQuery data storage for accurate, stable, fast reporting
- 100+ free Data Studio report templates and 100+ YouTube tutorials
- Free 1:1 customer support via chat, email, and calls in English and Spanish
- Simple, flexible pricing based on accounts connected; unlimited users, reports, usage
Cons of choosing Porter Metrics as a Polar Analytics alternative”
The following are reasons to seek Porter Metrics alternatives.
- Fewer connectors (19+) than some alternatives; focuses on SMBs, agencies, e-commerce, lead gen
- No built-in data transformation features; requires Data Studio or Sheets for blending, segmentation, custom fields
- Not suitable for large enterprises requiring sales CRM and database integrations (e.g., Salesforce, Adobe)
- May not be appropriate if finding Data Studio or Sheets too complex for basic reporting needs
Supermetrics
Supermetrics is a data integration and reporting tool for marketing and sales data. With 200+ integrations for e-commerce, B2B, ads, sales data, Supermetrics is an established market leader with 17,000+ customers, tracks 10%+ global ad spend.Supermetrics collects data from sources like CRMs, analytics tools, and ad platforms, then loads it directly into the destinations teams already use – spreadsheets, visualization tools, data warehouses.
Polar Analytics vs.Supermetrics detailed comparison
| Comparison criteria | Data Sources | Data sources included in their first plan tier | Refresh time frequency | Refresh time frequency for their first plan tier | Report templates | Destinations | Starting price | Free trials | Pricing model | Users access | User reviews on G2Crowd | Drawbacks |
|---|---|---|---|---|---|---|---|---|---|---|---|---|
| Polar Analytics | 45 | All data sources included (23+) ✅ | Daily ✅ | Daily ✅ | Yes ✅ | 2 | 300/mo | Yes✅ | Based on order volume | Unlimited users and admins ✅ | 5 | Less flexible than modular tools |
| Supermetrics | 200+ | Only 4 data sources: Facebook Ads, Google Analytics 4, and Google Ads ⛔️ | Hourly, Daily, Weekly ✅ | Weekly ⛔️ | Yes ✅ | 16 | $37/mo | Yes✅ | Based on data sources, user seats, destinations | Limited users per plan ⛔️ | 4.5 | Complex pricing, slow/unstable data without paid storage |
Supermetrics pricing
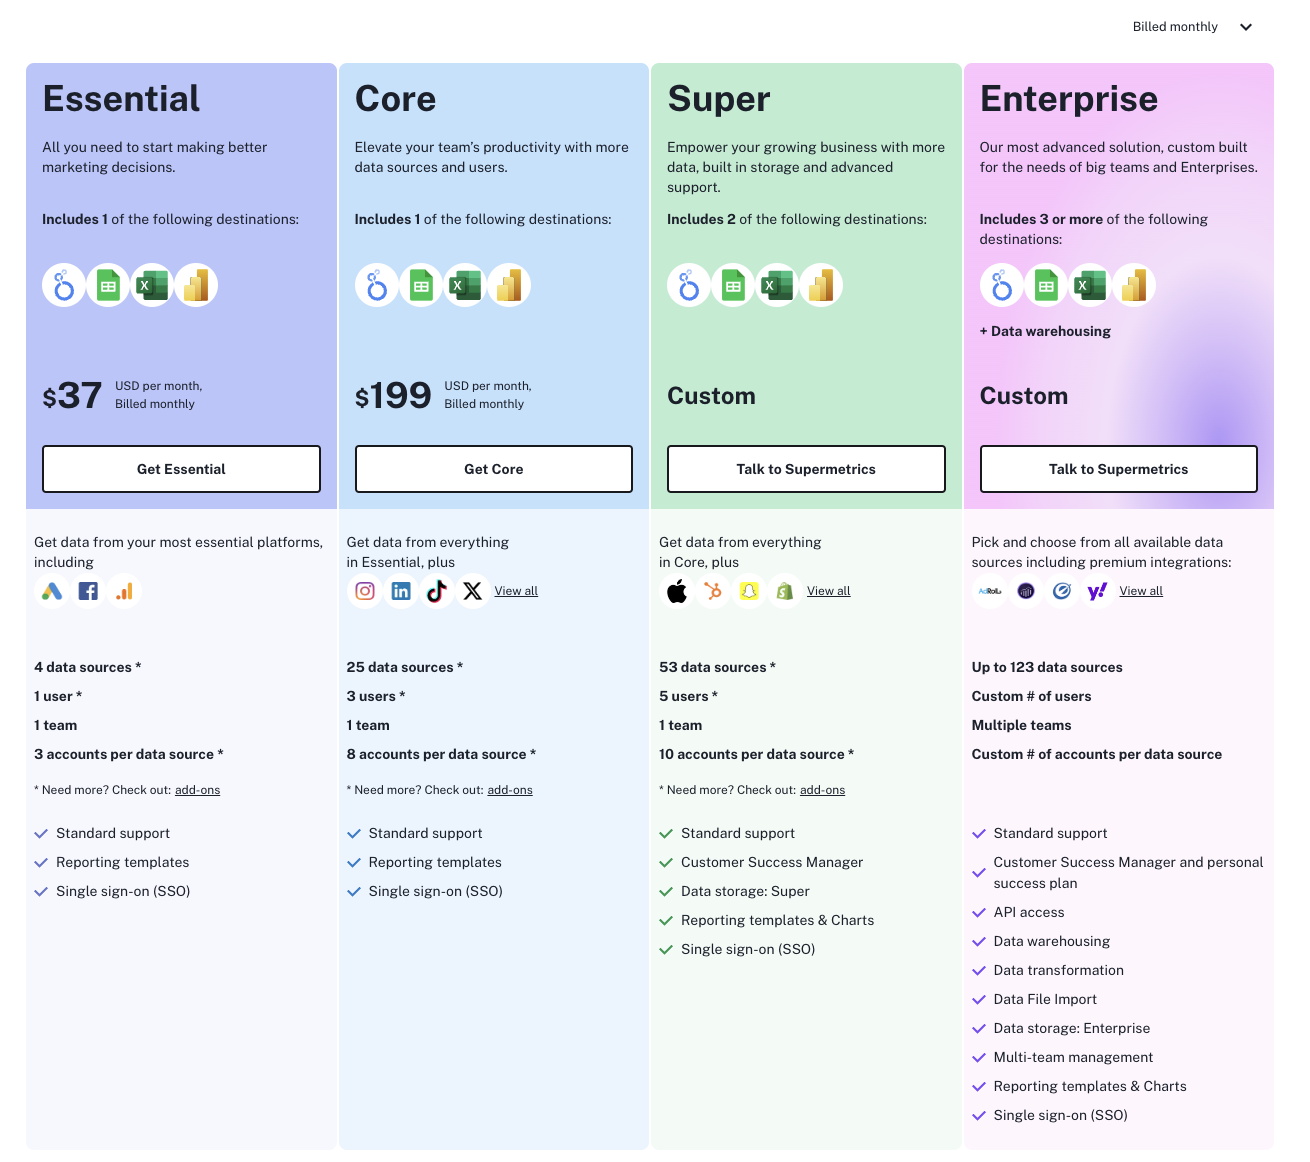
Supermetrics pricing is based on number of integrations, accounts per data source, and destinations. Higher tiers unlock more integrations, while agencies may need custom plans for additional accounts. Pricing varies across destinations, with spreadsheets and Data Studio being more affordable compared to Power BI and data warehouses.Plans range from $37/month for the Essential plan with 1 user and 11 data sources, up to $724/month for the Super plan with 1 user and 82 sources. Enterprise custom pricing is available for unlimited users and 119 sources.
Additional costs include $87-$724 per extra user and $24 per additional data source. All plans include automated data refreshes and connectors.
Who is Supermetrics best for?
Supermetrics offers extensive data connectors, advanced transformation capabilities, and supports various destinations, making it ideal for businesses needing complex data manipulation and comprehensive reporting. Its flexibility and scalability cater to large enterprises.
Polar Analytics, in contrast, specializes in e-commerce analytics with strong attribution capabilities. It integrates well with e-commerce platforms and marketing tools, providing tailored insights and user-friendly dashboards. While it may not have the same breadth of connectors or transformations as Supermetrics, it excels in delivering actionable insights for e-commerce businesses.
Pros of choosing Supermetrics as a Polar Analytics alternative
- 200+ integrations including Salesforce, Shopify, Facebook Ads, Google Analytics
- Data destinations: Google Sheets, Excel, Data Studio, BigQuery, Snowflake
- Data transformation feature, built-in storage, and APIs allow companies to create custom fields to calculate CPAs, run reports faster, and store data in their own databases
- Multilanguage field translation for users
Cons of choosing Supermetrics over Polar Analytics
The following are reasons to look for Supermetrics alternatives.
- Complex, inflexible and expensive pricing based on number of data sources, accounts per data source, users, data sources available only on certain plans, and destination
- Data transformation features, built-in storage, and APIs are only available in enterprise plans
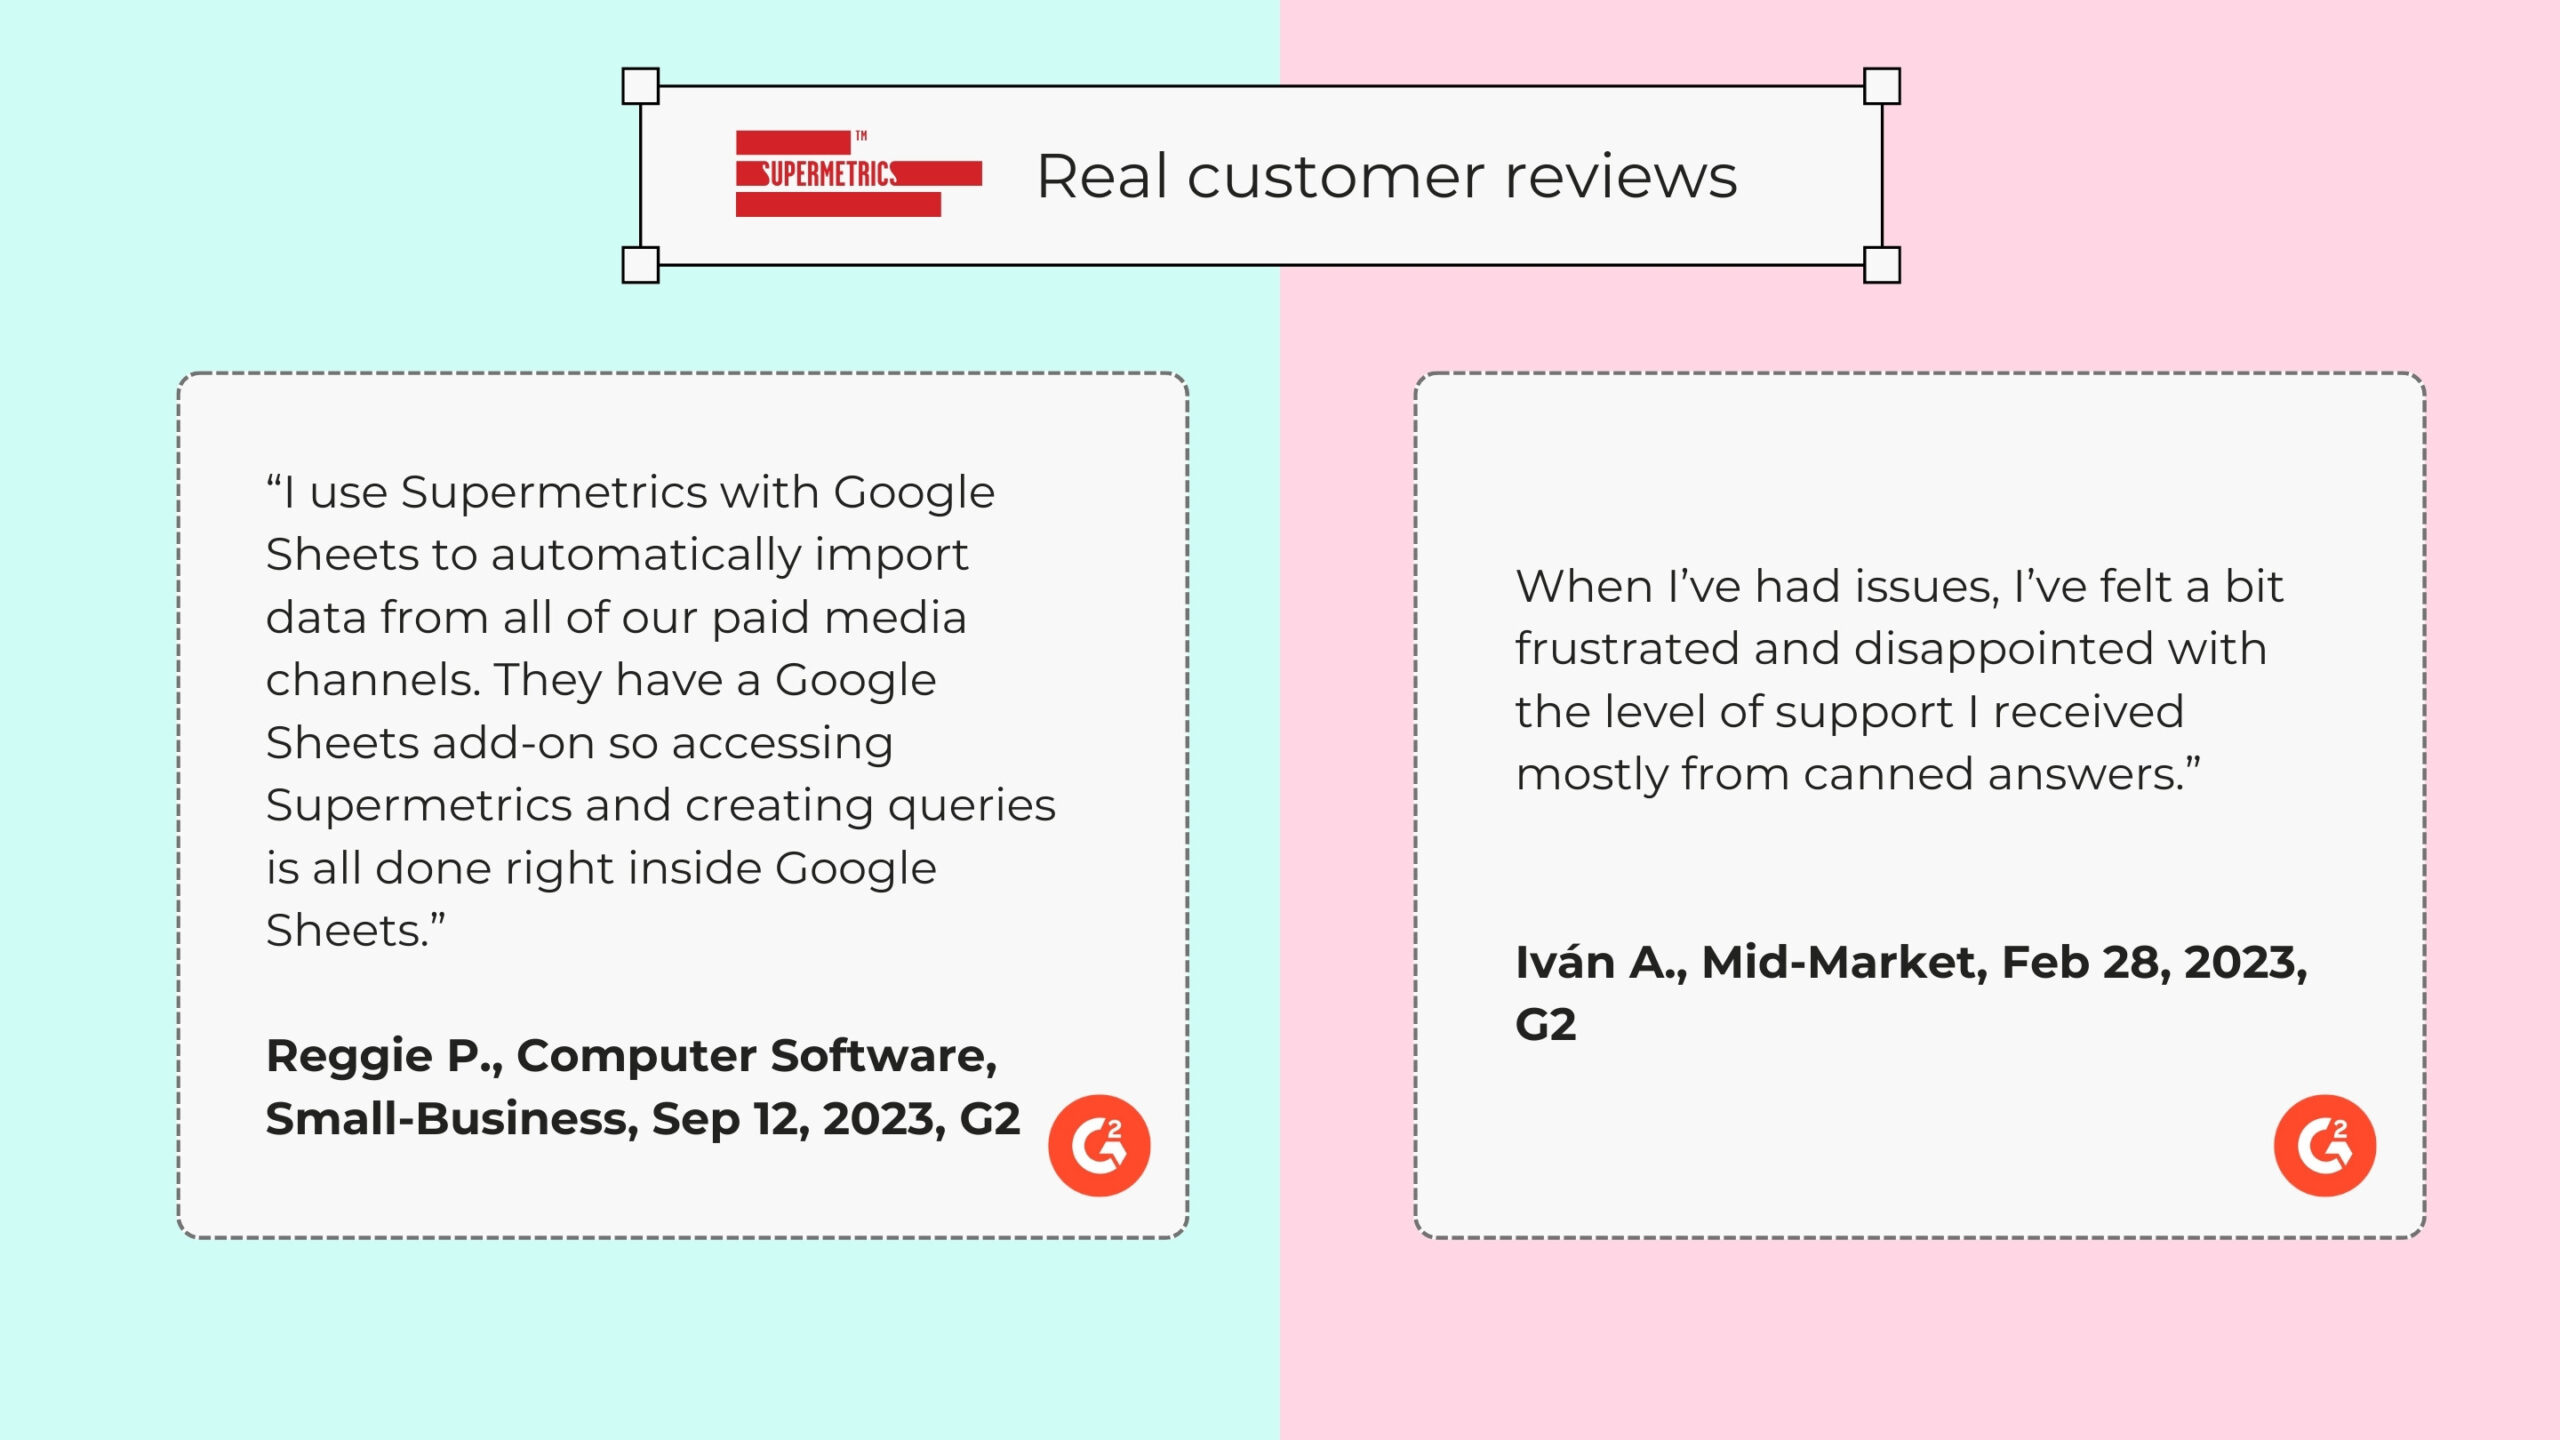
- “Canned answers” and slow, rigid email/chat support reported by users
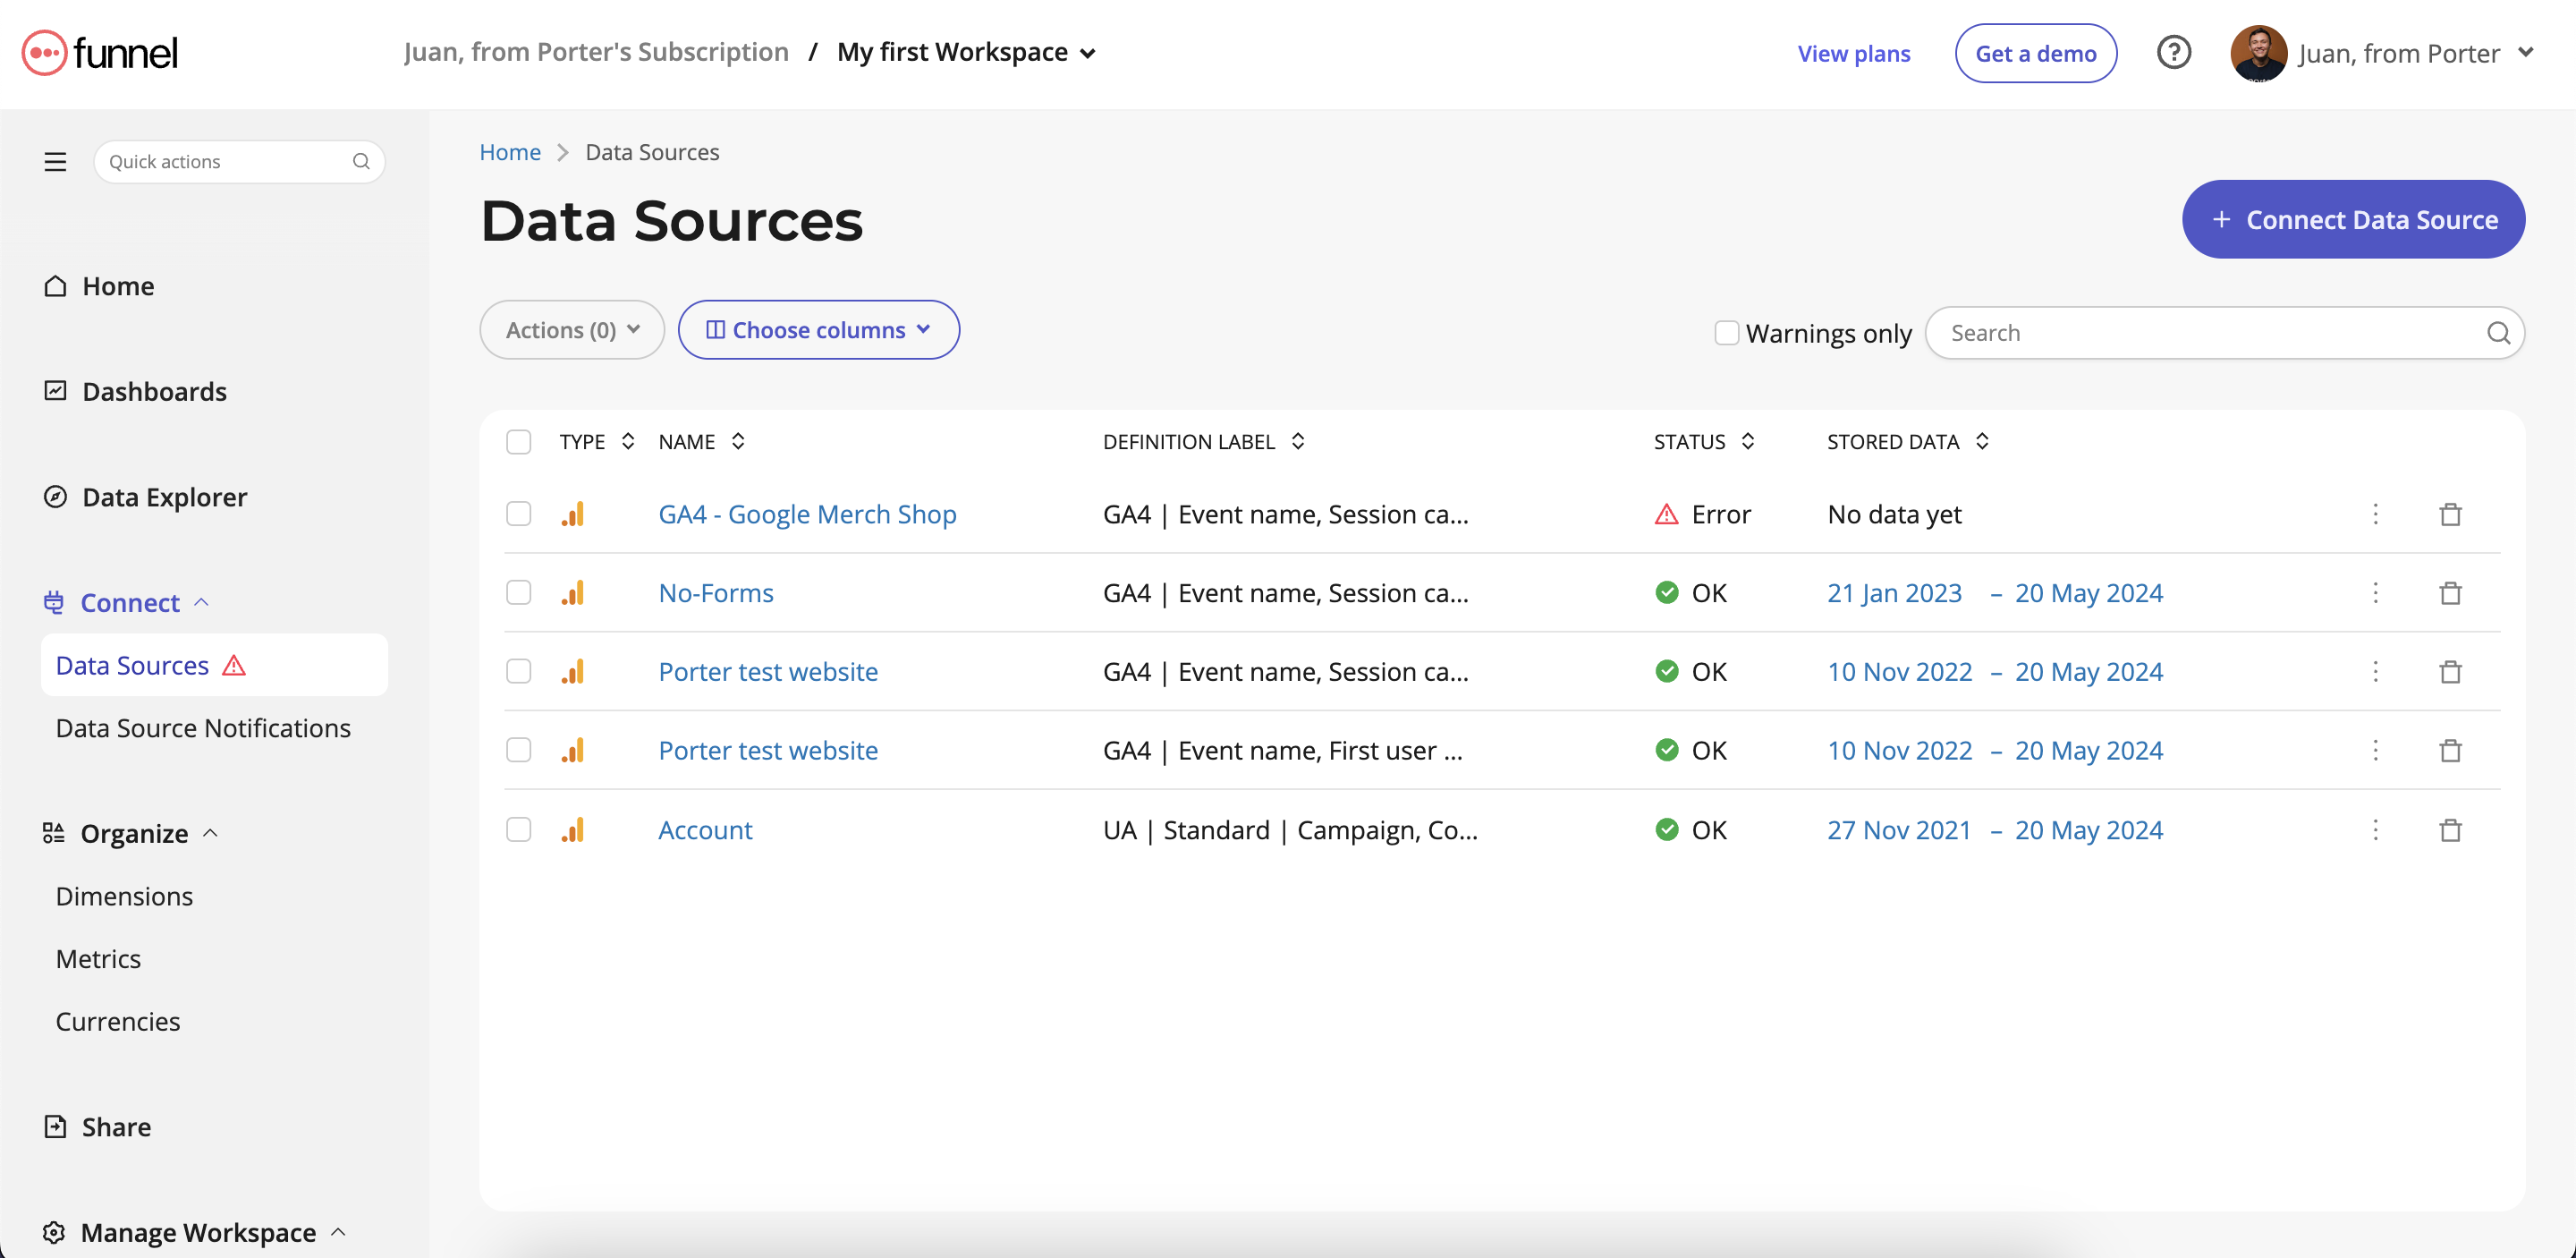
Funnel
Funnel.io is an ETL tool with 500+ marketing and sales integrations, 10+ destinations including data warehouses, visualization tools, spreadsheets. Has ‘managed data warehouse’ model, pre-storing data for speed, stability, potentially affecting data granularity, timeliness.Known for data transformation layer enabling custom metrics, currency conversions, cross-channel normalization, and blending. No-code tool but requires high technical proficiency akin to spreadsheet power users.
Polar Analytics vs. Funnel detailed comparison
| Comparison criteria | Data Sources | Data sources included in their first plan tier | Refresh time frequency | Refresh time frequency for their first plan tier | Report templates | Destinations | Starting price | Free trials | Pricing model | Users access | User reviews on G2Crowd | Drawbacks |
|---|---|---|---|---|---|---|---|---|---|---|---|---|
| Polar Analytics | 45 | All data sources included (23+) ✅ | Daily ✅ | Daily ✅ | Yes ✅ | 2 | 300/mo | Yes✅ | Based on order volume | Unlimited users and admins ✅ | 5 | Less flexible than modular tools |
| Funnel | 500 | All data sources (230+) ✅ | Daily or every 2 hours ✅ | Daily ✅ | Yes ✅ | 20+ | 1100/mo | Yes✅ | Usage-based “Flexpoints” | Limited users per plan ⛔️ | 4,5 | High learning curve, expensive pricing |
Funnel pricing
Utilizes a complex “flexpoints” pricing system calculated based on data sources and destinations. Has a free Starter plan with 350 flexpoints, $1,100/month Business plan with 3,500 flexpoints, and custom Enterprise pricing. Number of flexpoints varies by integration type.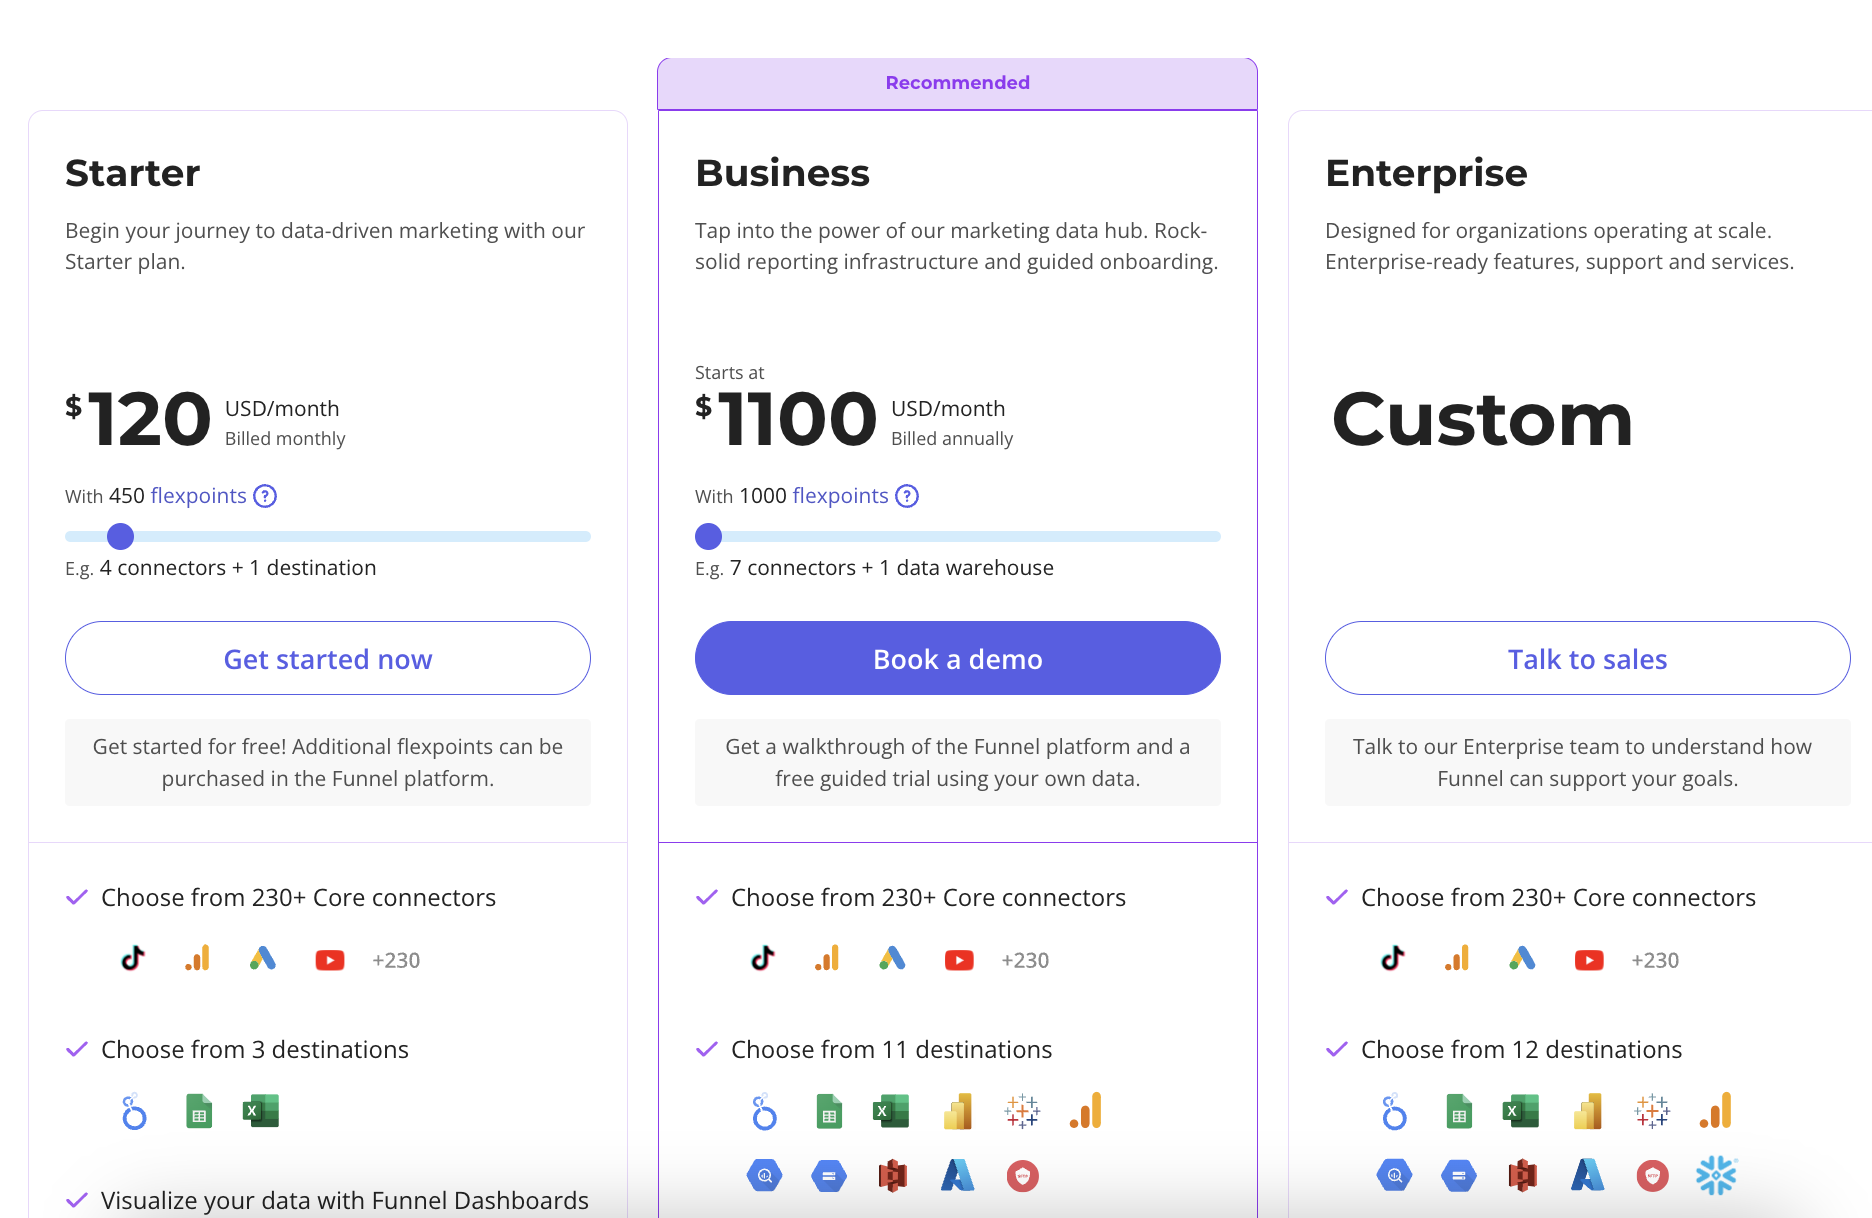
Who is Funnel best for?
Polar Analytics provides a specialized solution for e-commerce businesses, offering no-code analytics and reporting that aggregate data from multiple marketing channels. This allows for detailed analysis of attribution and profitability, which is critical for e-commerce brands.
However, Funnel.io offers more advanced data transformation capabilities, supports a wider range of data sources, and provides built-in data warehousing. It is suitable for technical marketing teams and data analysts who require comprehensive data handling and integration options.
Pros of choosing Funnel as a Polar Analytics alternative
- Integrations include Shopify, HubSpot, Salesforce, Facebook Ads, Google Analytics
- Unifies cross-channel data, conversion windows, and agency markup rules at campaign level
- Faster Data Studio and Google Sheets reports compared to direct connectors
- GDPR and SOC 2 compliance for enterprise marketing data governance
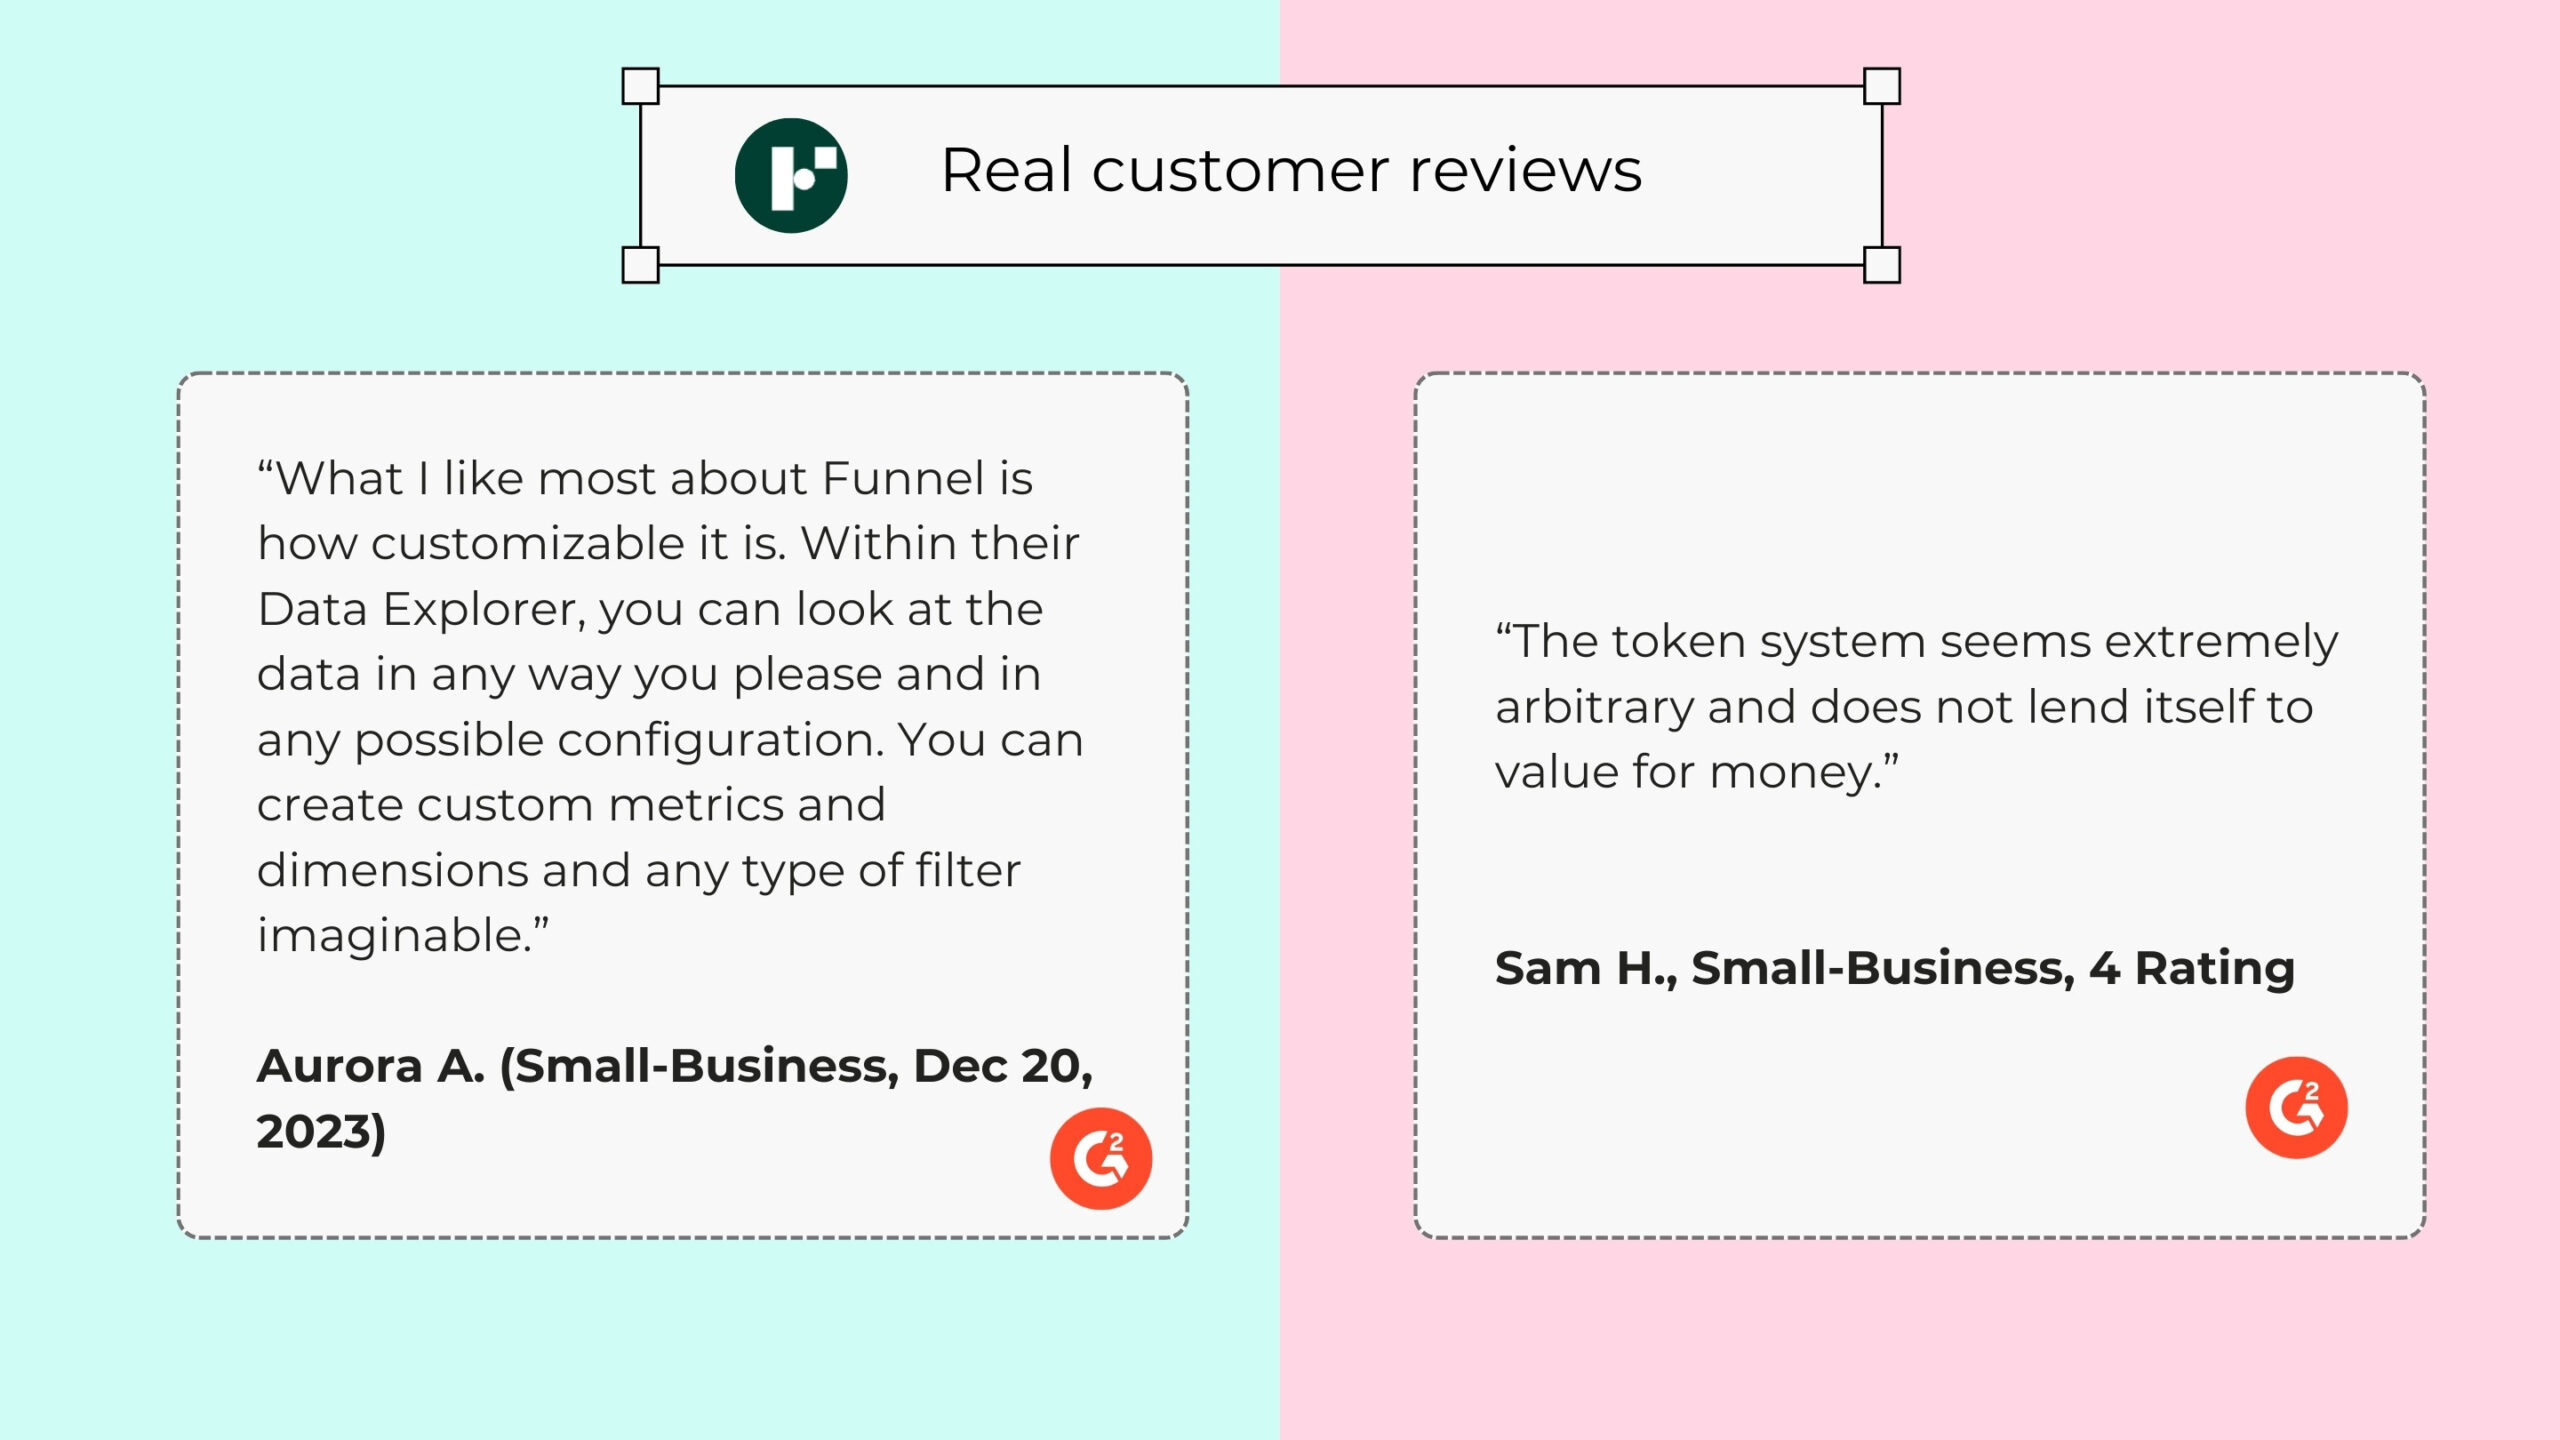
Cons of choosing Funnel over Polar Analytics
The following are reasons to look for Funnel alternatives.
- Monthly cost reaches hundreds to thousands of dollars based on usage, called ‘Flexpoints’
- Built for analysts or technical marketers; requires understanding of APIs, schemas, formulas, transformations for each connector
- Each table/endpoint may require setup, contrasting direct full-connector syncing
- While some data connectors offer “real-time” data from APIs for instant reports, Funnel’s approach may lead to delays of several hours before data becomes available
Windsor AI
Windsor is an ETL tool and marketing attribution software. Since 2019, it has developed over 300 integrations for data collection and data pipelines, built for technical marketers and data analysts.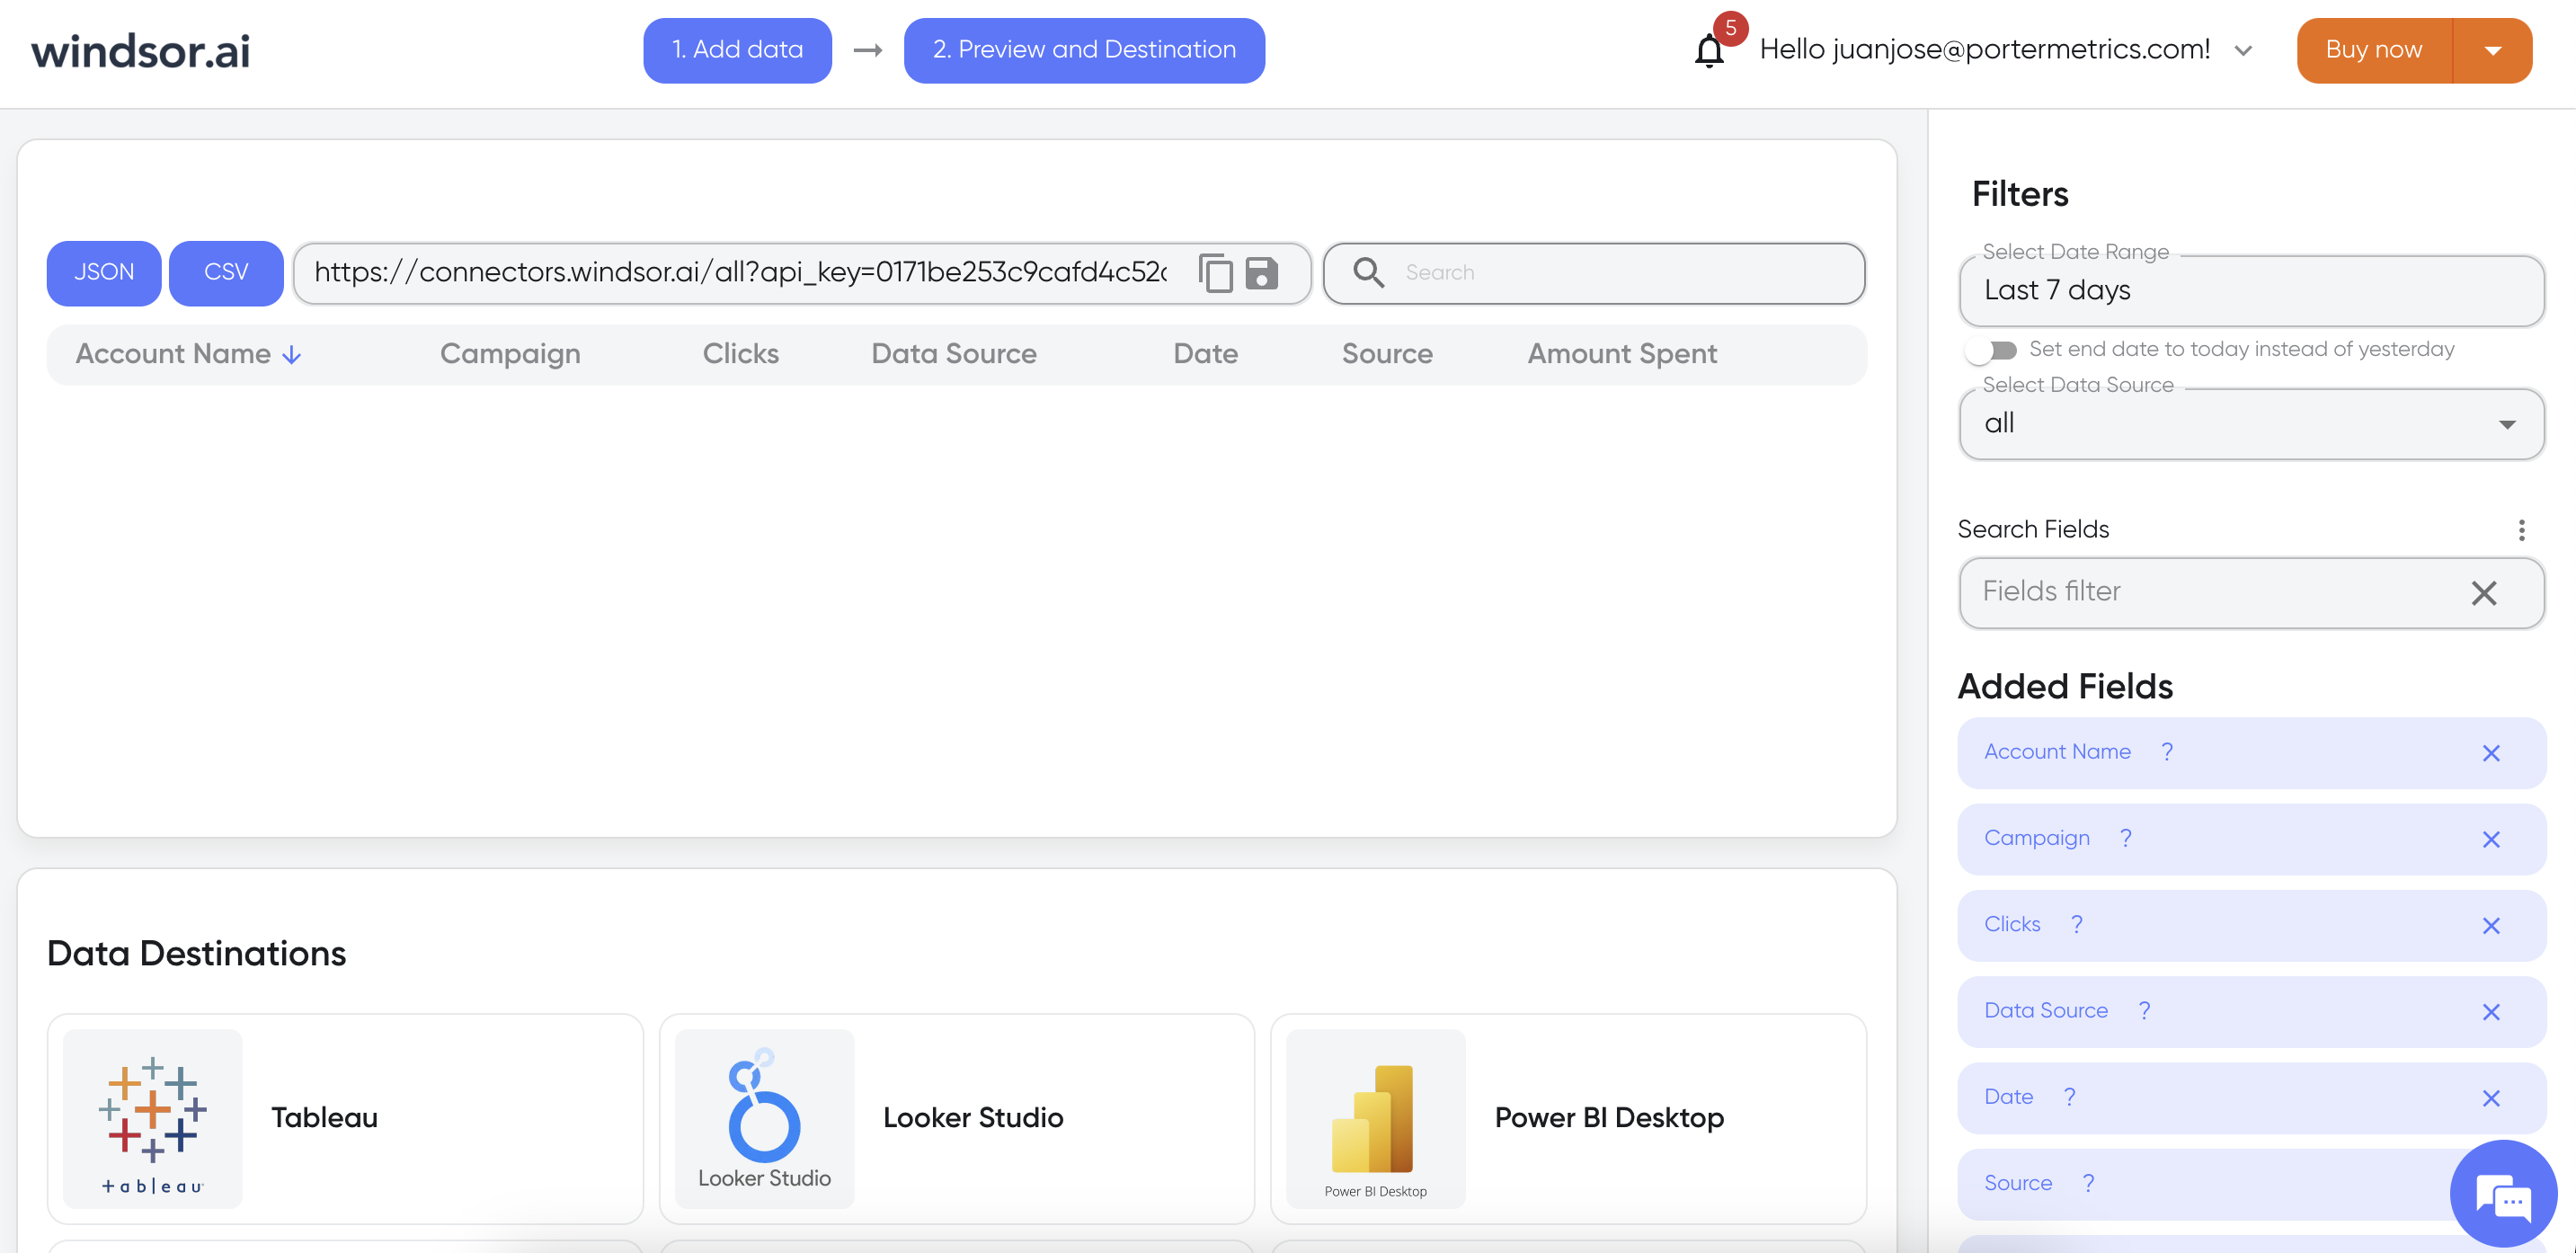
Polar Analytics vs. Windsor AI detailed comparison
| Comparison criteria | Data Sources | Data sources included in their first plan tier | Refresh time frequency | Refresh time frequency for their first plan tier | Report templates | Destinations | Starting price | Free trials | Pricing model | Users access | User reviews on G2Crowd | Drawbacks |
|---|---|---|---|---|---|---|---|---|---|---|---|---|
| Polar Analytics | 45 | All data sources included (23+) ✅ | Daily ✅ | Daily ✅ | Yes ✅ | 2 | 300/mo | Yes✅ | Based on order volume | Unlimited users and admins ✅ | 5 | Less flexible than modular tools |
| Windsor AI | 200+ | All data sources (100+) ✅ | Daily or hourly ✅ | Daily ✅ | Yes ✅ | 13 | 23/mo | Yes✅ | Based on usage | Unlimited users and admins ✅ | 4,8 | Some technical skills required |
Windsor AI pricing
Flexible pricing model ranging from a free plan to $598/month Professional plan. Pricing is determined by the number of data sources (1-14), connected accounts (1-500 accounts), and additional enterprise features like invoicing and SLAs. Unlimited users and destinations included.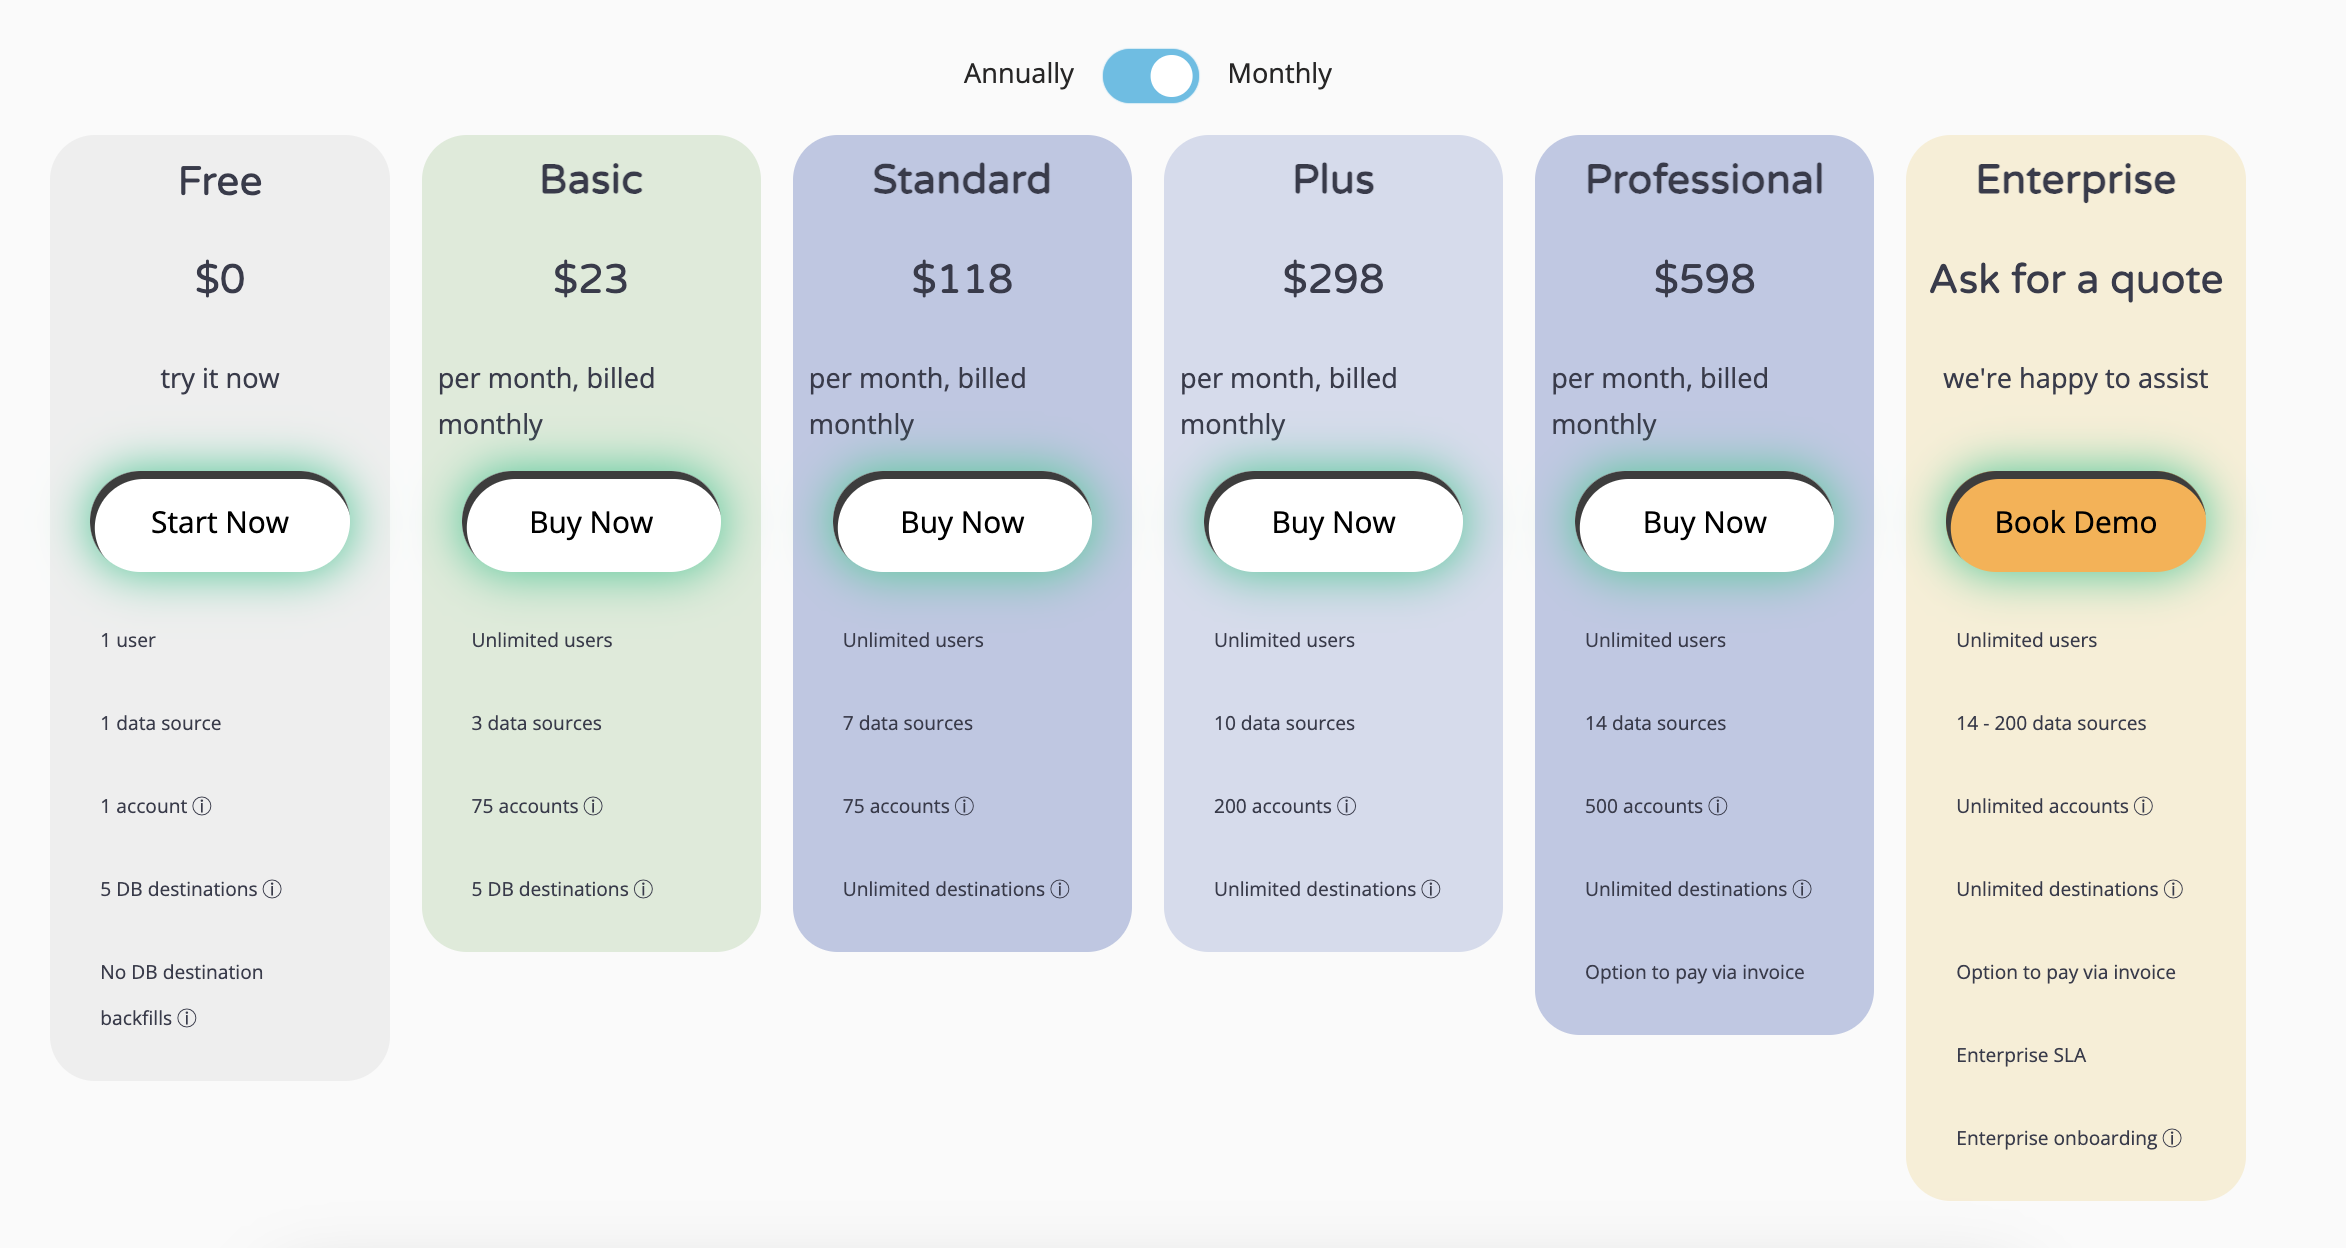
Who is Windsor AI best for?
Windsor.ai focuses on detailed attribution analysis, providing insights into the value and ROAS of every marketing touchpoint. This makes it ideal for e-commerce businesses and other brands looking to optimize their marketing strategies based on thorough attribution data.
However, Polar Analytics is designed for larger Shopify-based ecommerce brands, offering an all-in-one, no-code analytics and reporting solution that aggregates data from multiple marketing channels to calculate attribution and profitability metrics. This specialization is particularly beneficial for e-commerce businesses needing detailed performance analytics.
Pros of choosing Windsor AI as a Polar Analytics alternative
- 200+ Integrations: Google Analytics, Salesforce, HubSpot, Facebook Ads, Shopify
- Affordable, flexible pricing based on the number of data sources, accounts, and destinations connected
- Combines data across platforms for ROAS/CAC reporting by channel, campaign, creative, cohort for optimization
- Users cite fast support and responsiveness from founders to guide implementation
Cons of choosing Windsor AI over Polar Analytics
The following are reasons to look for Windsor AI alternatives.
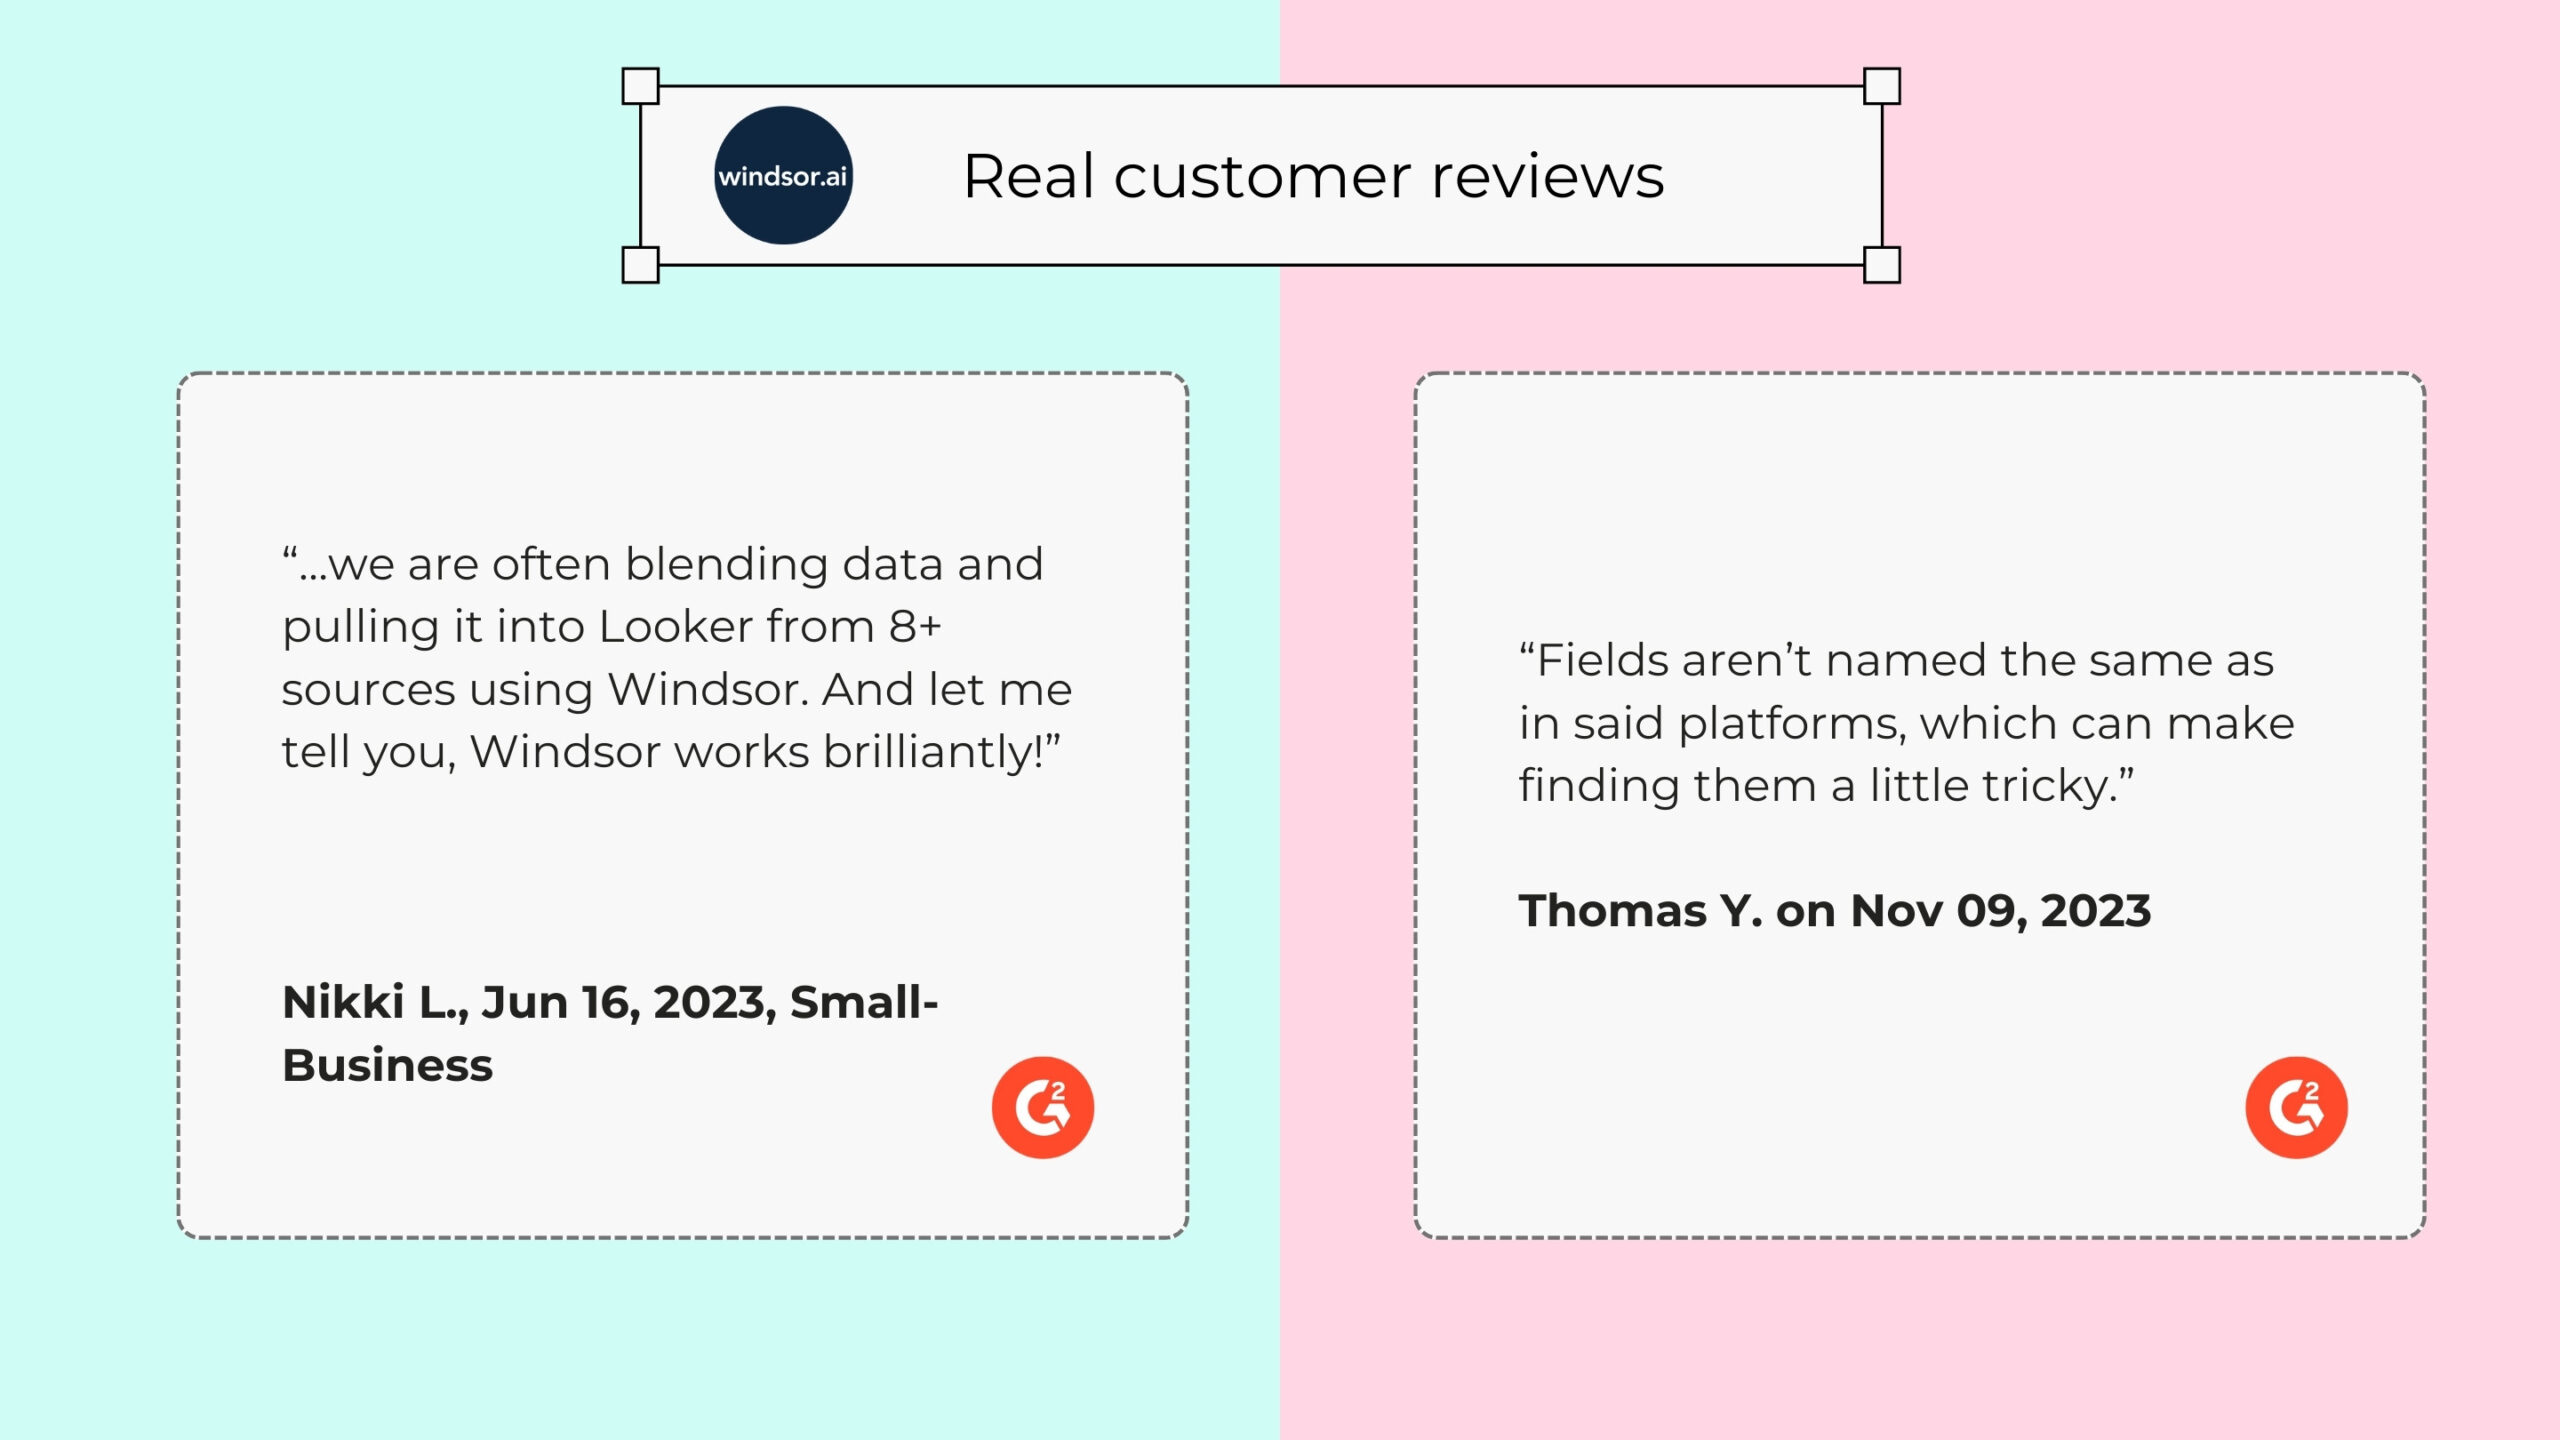
- Metrics differ from native platforms; tricky to find; needs better documentation
- Challenging for marketers expecting plug-and-play; not intuitive for non-technical users expecting Data Studio simplicity
- If you have multiple data sources (5+), their pricing becomes less efficient as they offer multiple accounts from the same data source
Power My Analytics
Power My Analytics is a no-code ETL tool offering direct marketing data source integrations to destinations like Data Studio, Sheets, Analytics, Excel, BigQuery, and its API. At Porter Metrics, we benchmark it favorably for quality, customer satisfaction, and reliability.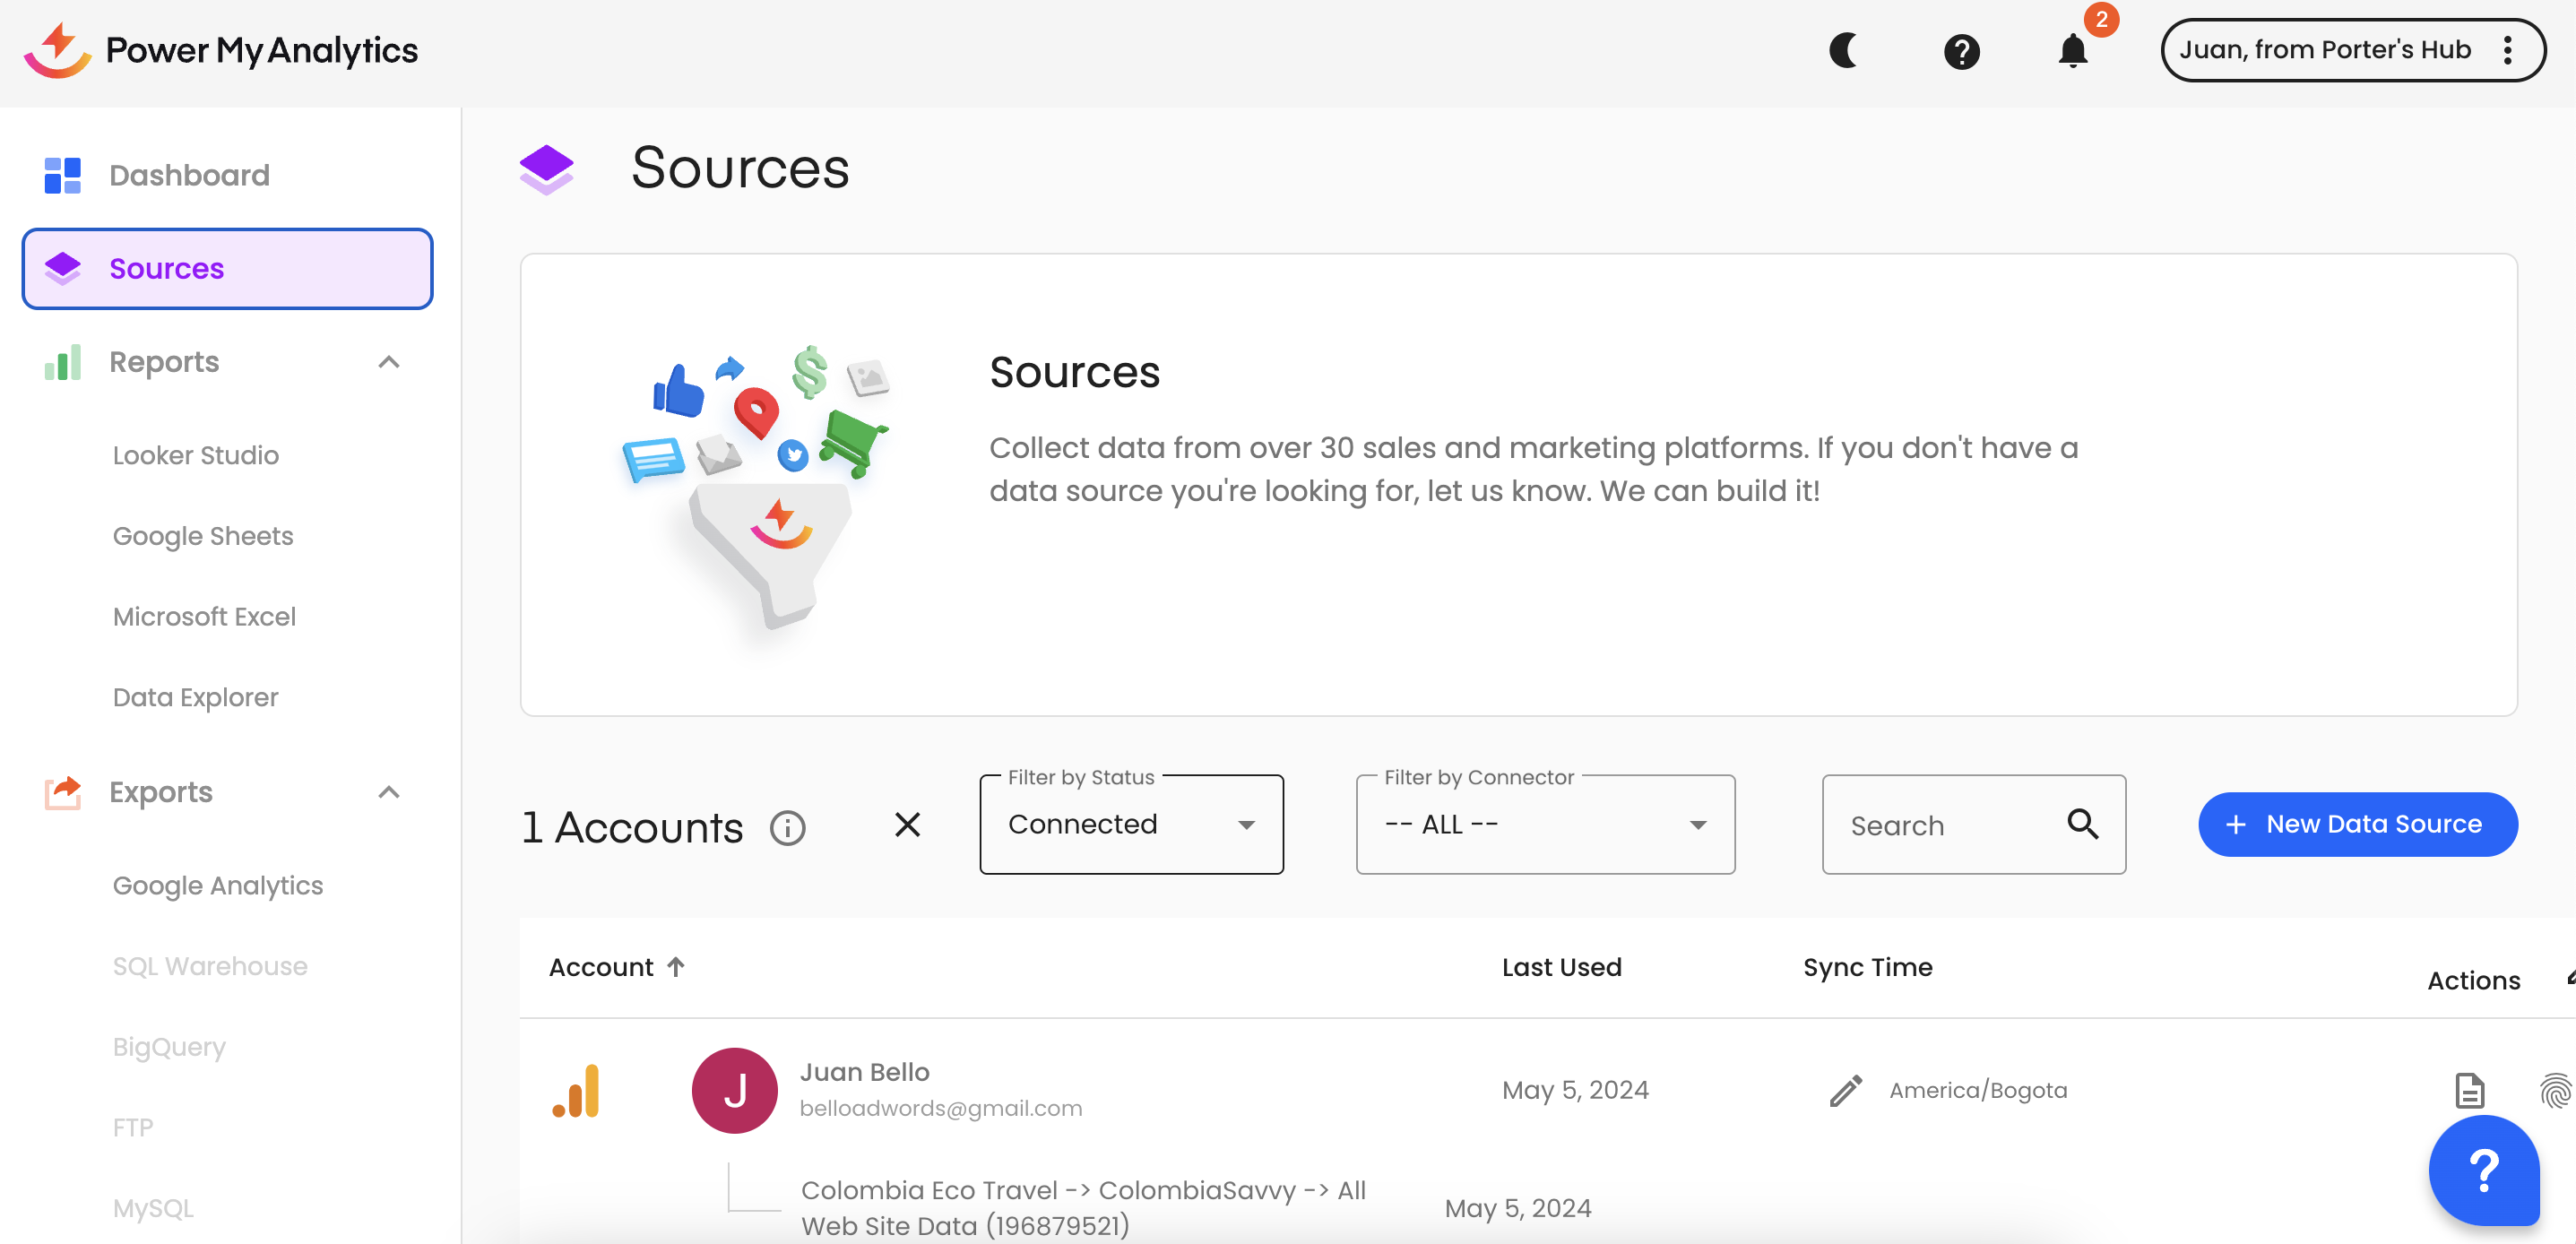
Polar Analytics vs. Power My Analytics detailed comparison
Power My Analytics pricing
Starts at $14.95/month for 1 data source and 1 account. Scales up to $295/month for 40 sources, unlimited accounts per source, data warehousing, and 4+ admin users. Additional fees for Google Sheets ($50/month) and Google Business Profile integration.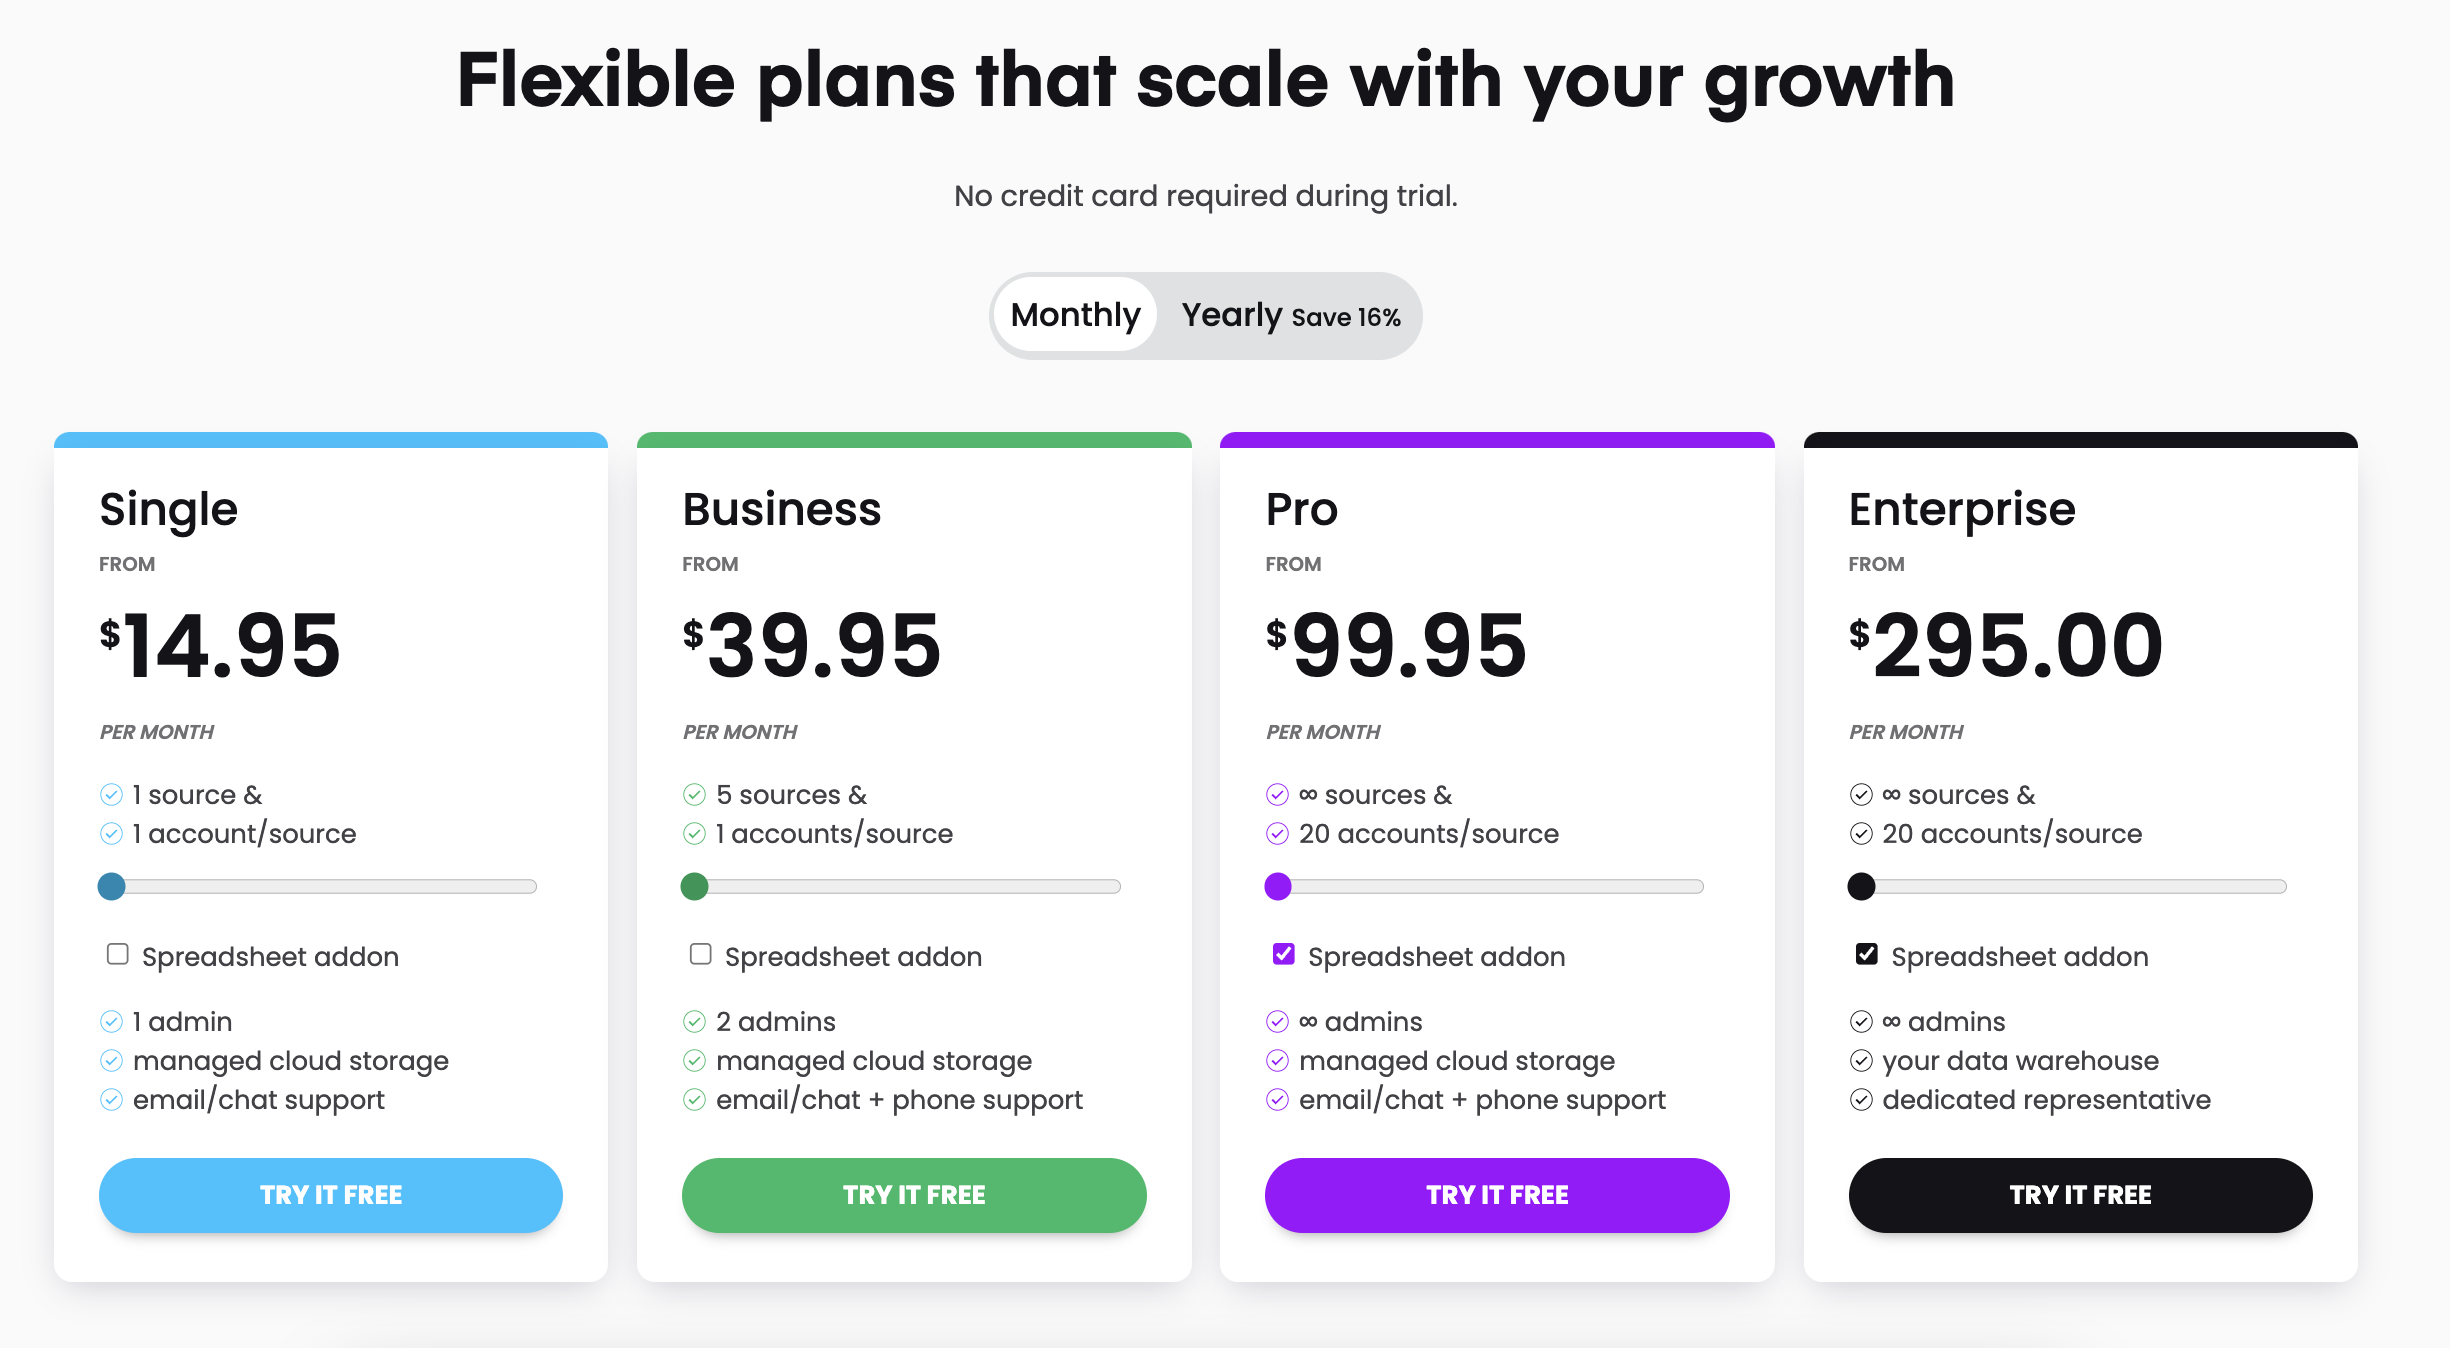
Who is Power My Analytics best for?
Polar Analytics offers a comprehensive analytics and reporting solution designed for e-commerce brands. It aggregates data from multiple marketing channels to provide insights into attribution and profitability, making it ideal for businesses needing a focused solution for marketing performance analysis.
However, Power My Analytics offers a more flexible pricing model based on the number of accounts, data sources, and destinations. It is particularly beneficial for PPC and e-commerce marketers who value ease of use and granular data access, providing a cost-effective solution for teams with a tighter budget or less complex data needs.
Pros of choosing Power My Analytics as a Polar Analytics alternative
- Direct connector to Data Studio, Sheets, Analytics, Excel, BigQuery, API
- Automatic storage: PMA backfills data into a cloud storage for fast, reliable integrations without needing additional warehouse setup
- Great customer support: Fast support, complete documentation, and the possibility to schedule free onboarding sessions
- Usually good performance in terms of report speed
Cons of choosing Power My Analytics over Polar Analytics
The following are reasons to look for Power My Analytics alternatives.
- No built-in data transformation: Users need to send raw data to a destination to blend, clean, or calculate custom fields
- First-time users need help with possible dimensions/metrics and platform limitations
- Technical concepts like combining metrics/dimensions can be challenging for novice marketers
- Integrations don’t include all API fields; combining different data types from the same source can break reports
Dataslayer
Dataslayer is an affordable ETL tool built PPC marketers. It has garnered impressive overall satisfaction scores (4.8/5 on G2). While offering marketing data integrations, its API query manager and BigQuery integrations also serve developers’ needs.
Polar Analytics vs. Dataslayer detailed comparison
| Comparison criteria | Data Sources | Data sources included in their first plan tier | Refresh time frequency | Refresh time frequency for their first plan tier | Report templates | Destinations | Starting price | Free trials | Pricing model | Users access | User reviews on G2Crowd | Drawbacks |
|---|---|---|---|---|---|---|---|---|---|---|---|---|
| Polar Analytics | 45 | All data sources included (23+) ✅ | Daily ✅ | Daily ✅ | Yes ✅ | 2 | 300/mo | Yes✅ | Based on order volume | Unlimited users and admins ✅ | 5 | Less flexible than modular tools |
| DataSlayer | 45+ | All data sources (45+) ✅ | Daily, with API limits ⛔️ | Daily, with API limits ⛔️ | Yes ✅ | 4 | 35/mo | Yes✅ | Usage-based | Limited users per plan ⛔️ | 4,8 | Unpredictable pricing for high volumes |
Dataslayer pricing
Usage-based pricing model per data destination, which can lead to unpredictable costs. For example, Data Studio starts at $35/month while BigQuery is $355/month and up. Free plan with 15 daily API calls. Pricing depends on number of accounts/connectors and API call limits.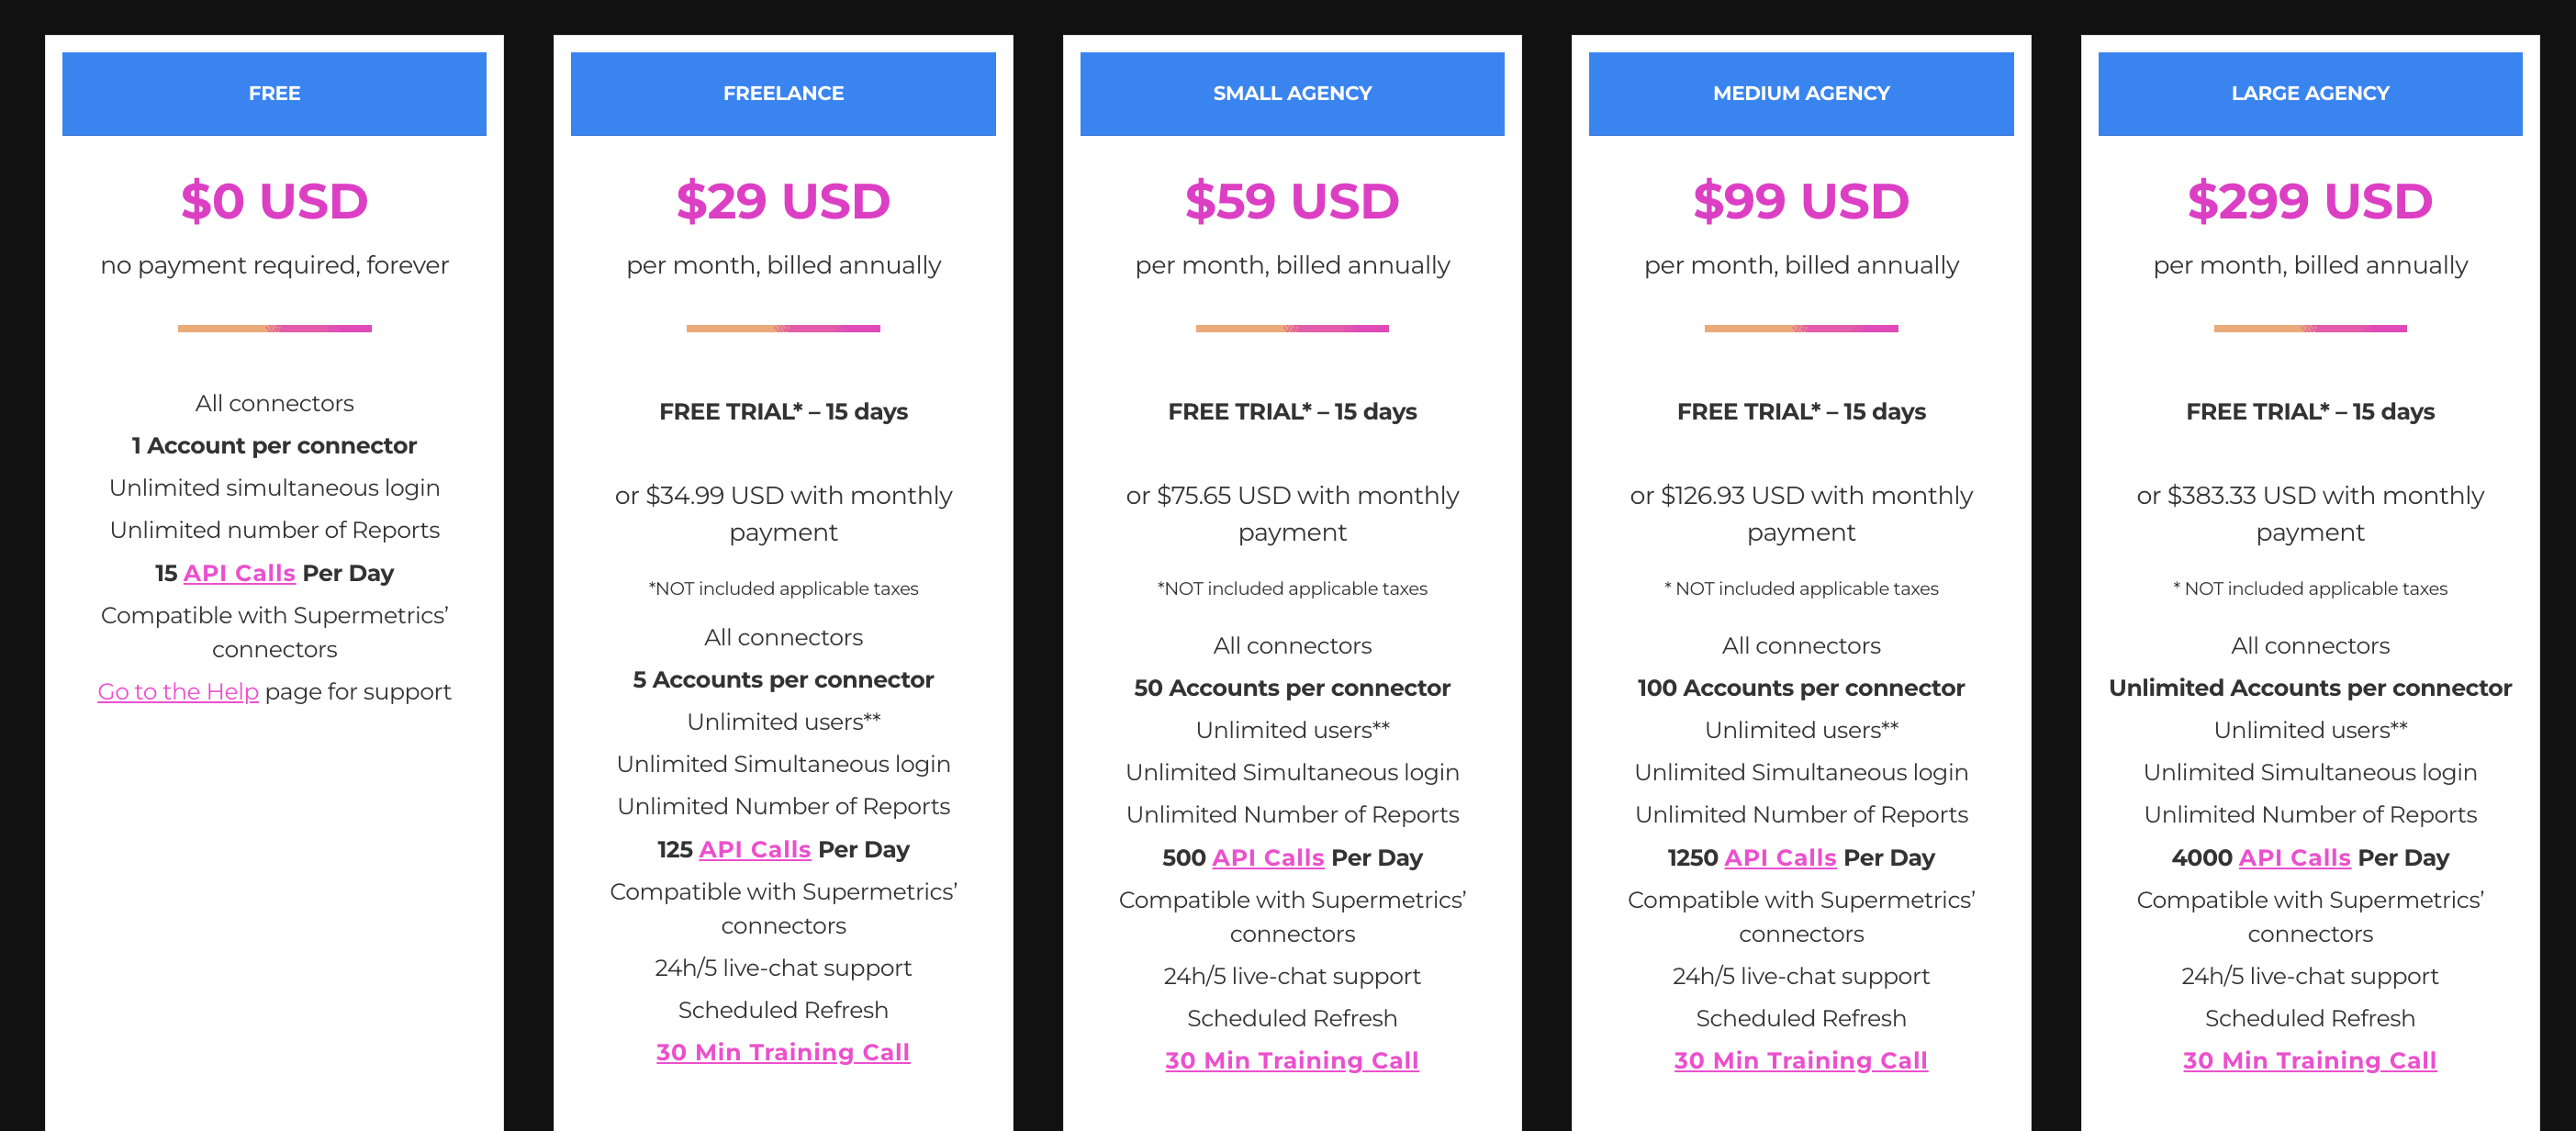
Who is Dataslayer best for?
DataSlayer provides an affordable and flexible reporting tool that integrates seamlessly with Google Sheets, Data Studio, and various BI tools. Its API call-based pricing can be more cost-effective for teams with lower data volumes and those focused on PPC/SEM reporting.
Conversely, Power My Analytics offers a flexible pricing model based on the number of accounts, data sources, and destinations, which can be beneficial for PPC and e-commerce marketers who need granular data access and a cost-effective solution for managing multiple ad accounts.
Pros of choosing Dataslayer as a Polar Analytics alternative
- Affordable data connector designed for PPC use cases and marketers
- Agencies use team member links to client data without individual logins
- Live chat with data experts; responses in minutes; high-touch personal assistance
- Plans from $35/month vs. Supermetrics’ $87/user minimum and extra data costs
Cons of choosing Dataslayer over Polar Analytics
The following are reasons to look for Dataslayer alternatives.
- Lacks built-in storage, relying on API stability which can lead to slow reporting
- Dashboard performance can be compromised due to API limitations, slowing down reporting for clients with numerous active campaigns
- Usage-based pricing can become unpredictable and expensive, potentially surpassing leading providers
- Users report issues with data formatting leading to discrepancies, such as metrics like CTR and conversion rate appearing in percentage format instead of decimal

AgencyAnalytics
Agency Analytics is a reporting and dashboarding tool for marketing agencies, offering unique features like SEO monitoring and client-staff communication management.It’s a good starting point for non-technical agency marketers transitioning from manual reporting, despite potential limitations in flexibility and features compared to data connectors or ETL solutions. Agency Analytics remains superior in ease of use to BI tools like Google Data Studio.
Polar Analytics vs. AgencyAnalytics detailed comparison
| Comparison criteria | Data Sources | Data sources included in their first plan tier | Refresh time frequency | Refresh time frequency for their first plan tier | Report templates | Destinations | Starting price | Free trials | Pricing model | Users access | User reviews on G2Crowd | Drawbacks |
|---|---|---|---|---|---|---|---|---|---|---|---|---|
| Polar Analytics | 45 | All data sources included (23+) ✅ | Daily ✅ | Daily ✅ | Yes ✅ | 2 | 300/mo | Yes✅ | Based on order volume | Unlimited users and admins ✅ | 5 | Less flexible than modular tools |
| Agency Analytics | 80+ | All data sources (80+) ✅ | Daily ✅ | Daily ✅ | Yes ✅ | 2 | 60/mo | Yes✅ | Per-client campaign pricing | Limited users per plan ⛔️ | 4,7 | Limited data flexibility vs. ETL tools |
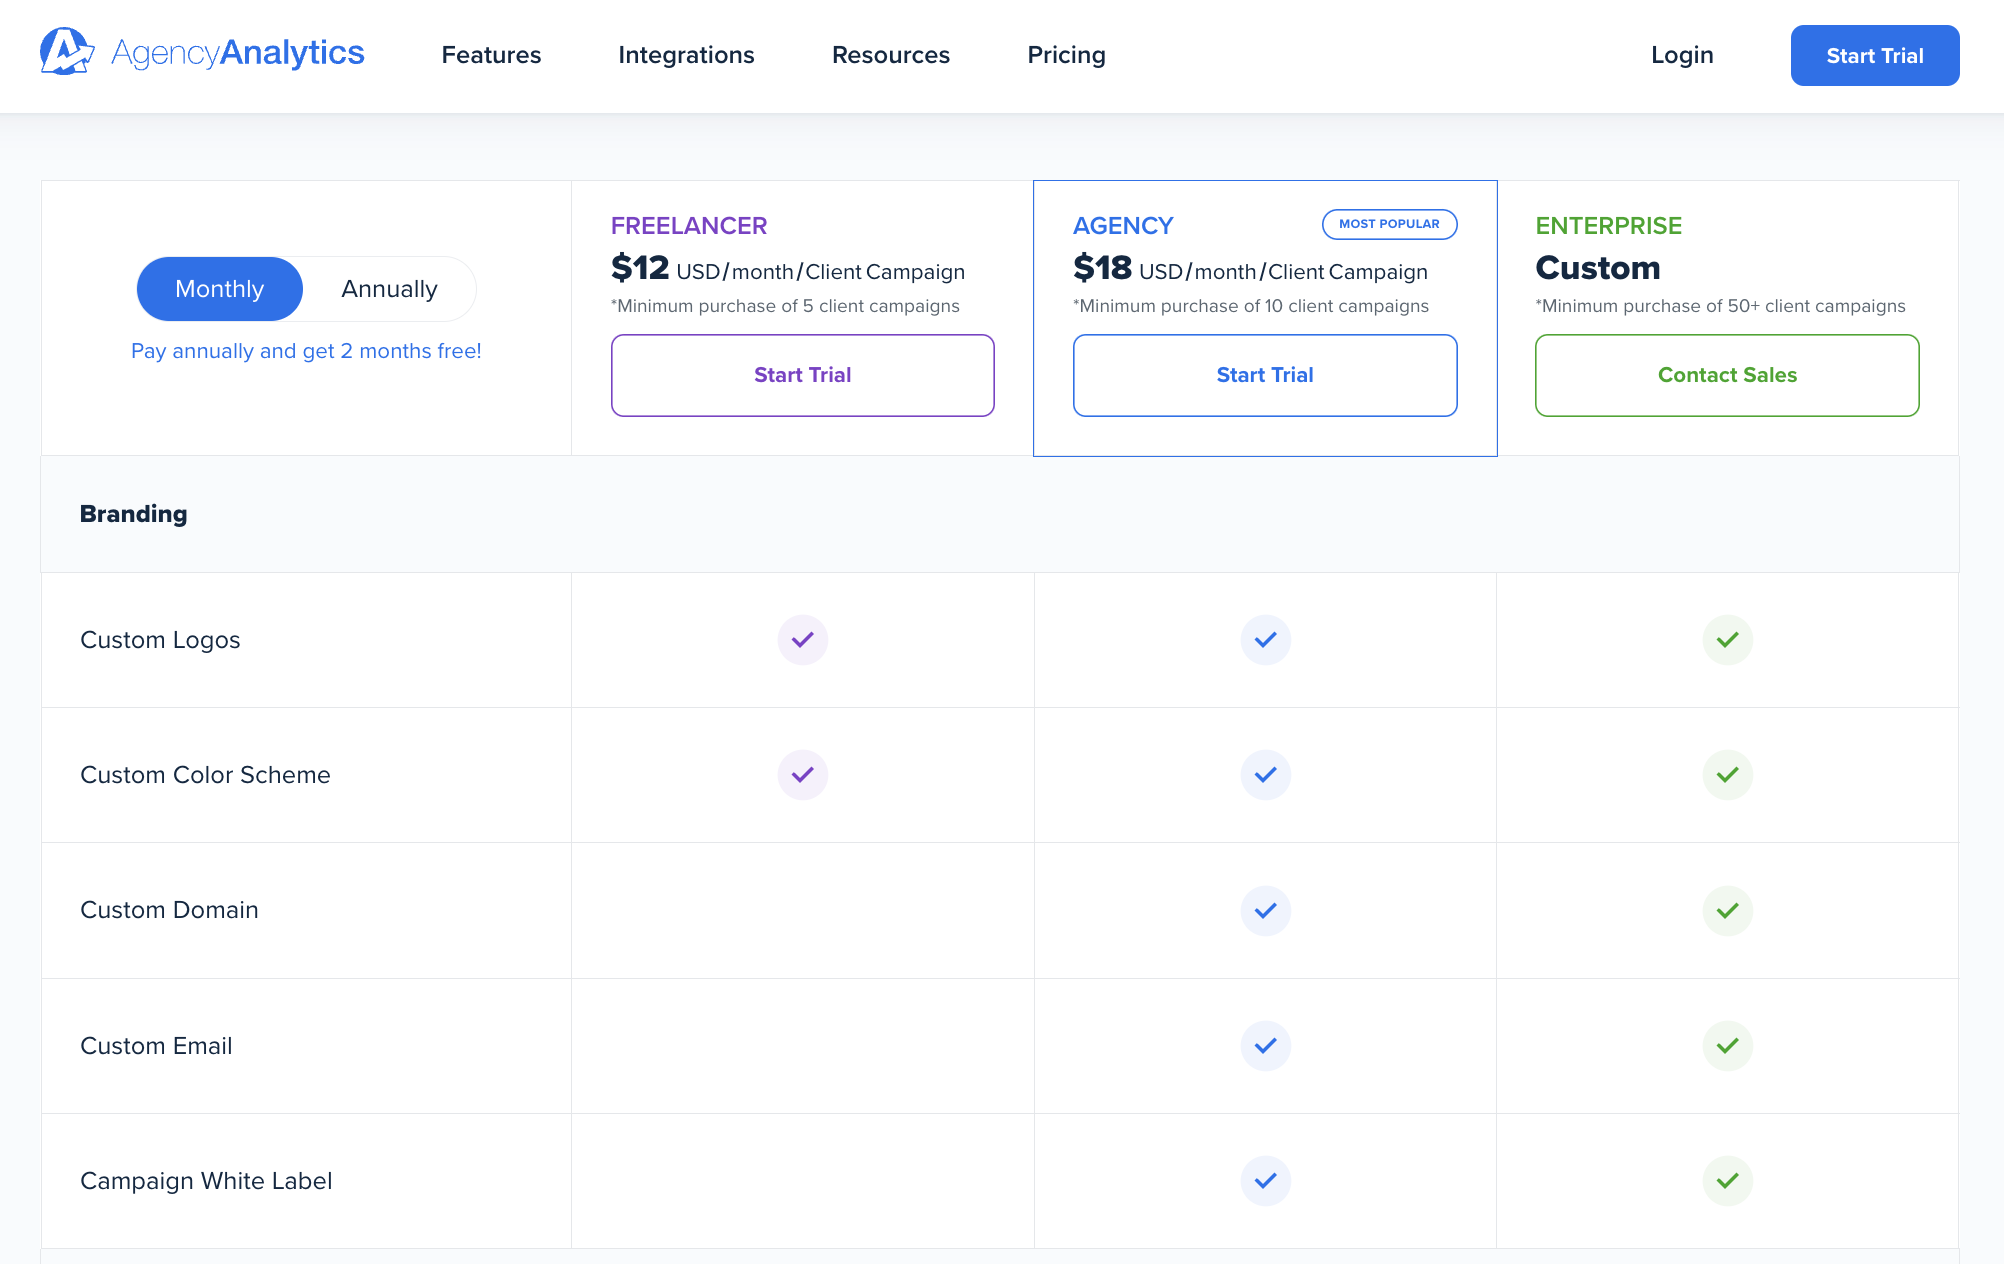
AgencyAnalytics pricing
AgencyAnalytics pricing is based on “client campaigns” which are combinations of connected accounts like websites and ad platforms per client.Plans:
Freelancer: Starts at $60/month for minimum 5 client campaigns at $12 each
Agency: Starts at $180/month for minimum 10 client campaigns at $18 each
Enterprise: Starts around $900/month for minimum 50 client campaigns
Advanced features like white-labeling, custom metrics/dashboards, and agency management tools are included in higher-tier Agency and Enterprise plans.
Who is AgencyAnalytics best for?
Agency Analytics is beneficial for marketing agencies that require a straightforward reporting tool with predefined dashboards and client reporting features. It focuses on ease of use and effective client communication, making it suitable for agencies.
However, Polar Analytics is geared towards larger Shopify-based ecommerce brands and offers an all-in-one, no-code analytics and reporting solution. It automatically aggregates data from multiple marketing channels to calculate attribution and profit-based metrics, which is ideal for e-commerce businesses needing a focused solution for marketing analytics.
Pros of choosing AgencyAnalytics as a Polar Analytics alternative
- Pre-built marketing agency reporting templates and workflows for client reporting
- Faster than assembling comparable views in Data Studio with minimal setup
- Filter Facebook Ads by campaign; blend Google Analytics + CRM data; set markup %
- Fast data access by syncing with API data to cloud storage proactively
Cons of choosing AgencyAnalytics over Polar Analytics
The following are reasons to look for AgencyAnalytics alternatives.
- Can’t combine Facebook Ads metrics by device, demographics, or creatives in the same query
- Doesn’t allow cleaning, tagging, or grouping data with custom dimensions, unlike Data Studio, Sheets with REGEX, or Funnel
- Lacks transformation features like regex to clean URLs or group by site section
- Costs scale fast: charges per “client campaign” combination of connected accounts, unlike per account pricing
Other Polar Analytics alternatives you should consider?
We have tested a lot of marketing reporting tools and white-glove services, here are other alternatives you should consider if you have time to keep exploring:
- Databox for easy-to-build marketing reporting.
- Equals for SaaS companies that want to measure their data in a tool that looks like Sheets.
- VisionLabs if you want custom data pipelines and reporting without using your internal team.
- Datapad if you want reports that look like a Notion report and are easy to build.
- Coefficient if you want an alternative to automate your Google Sheets reporting.
- Awesome Table is a great Google Sheets Supermetrics alternative.
- Swydo is an easy-to-use out of the box marketing reporting tool
Polar Analytics overview
Polar Analytics is a no-code analytics and data integration platform for e-commerce Shopify brands with $2+ million annual revenue.All-in-one approach with custom dashboards, visualizations, integrations, conversion/attribution script, AI chat analysis, alerts, data transformation.
Automatically aggregates and combines channels to calculate CAC, LTV, retention, contribution margins, profits. Drawbacks: plans start $300/mo, not fully self-service, requires setup call.
Reasons to seek Polar Analytics alternatives
Users seek Polar Analytics alternatives for:- More data granularity, visualization, and transformation features from dedicated data connectors.
- Specialized solutions for attribution and server-side tracking/enrichment.
- An unbundled tech stack tailored to your specific needs, rather than an all-in-one solution.
Polar Analytics pricing explained
Polar Analytics starts at $300 / month and they charge based on tiers of the ecommerce GMV (Gross merchandise volume) and also they have different plans with different features.
So you have two variables to increment the amount you pay monthly: GMV increase or better features.
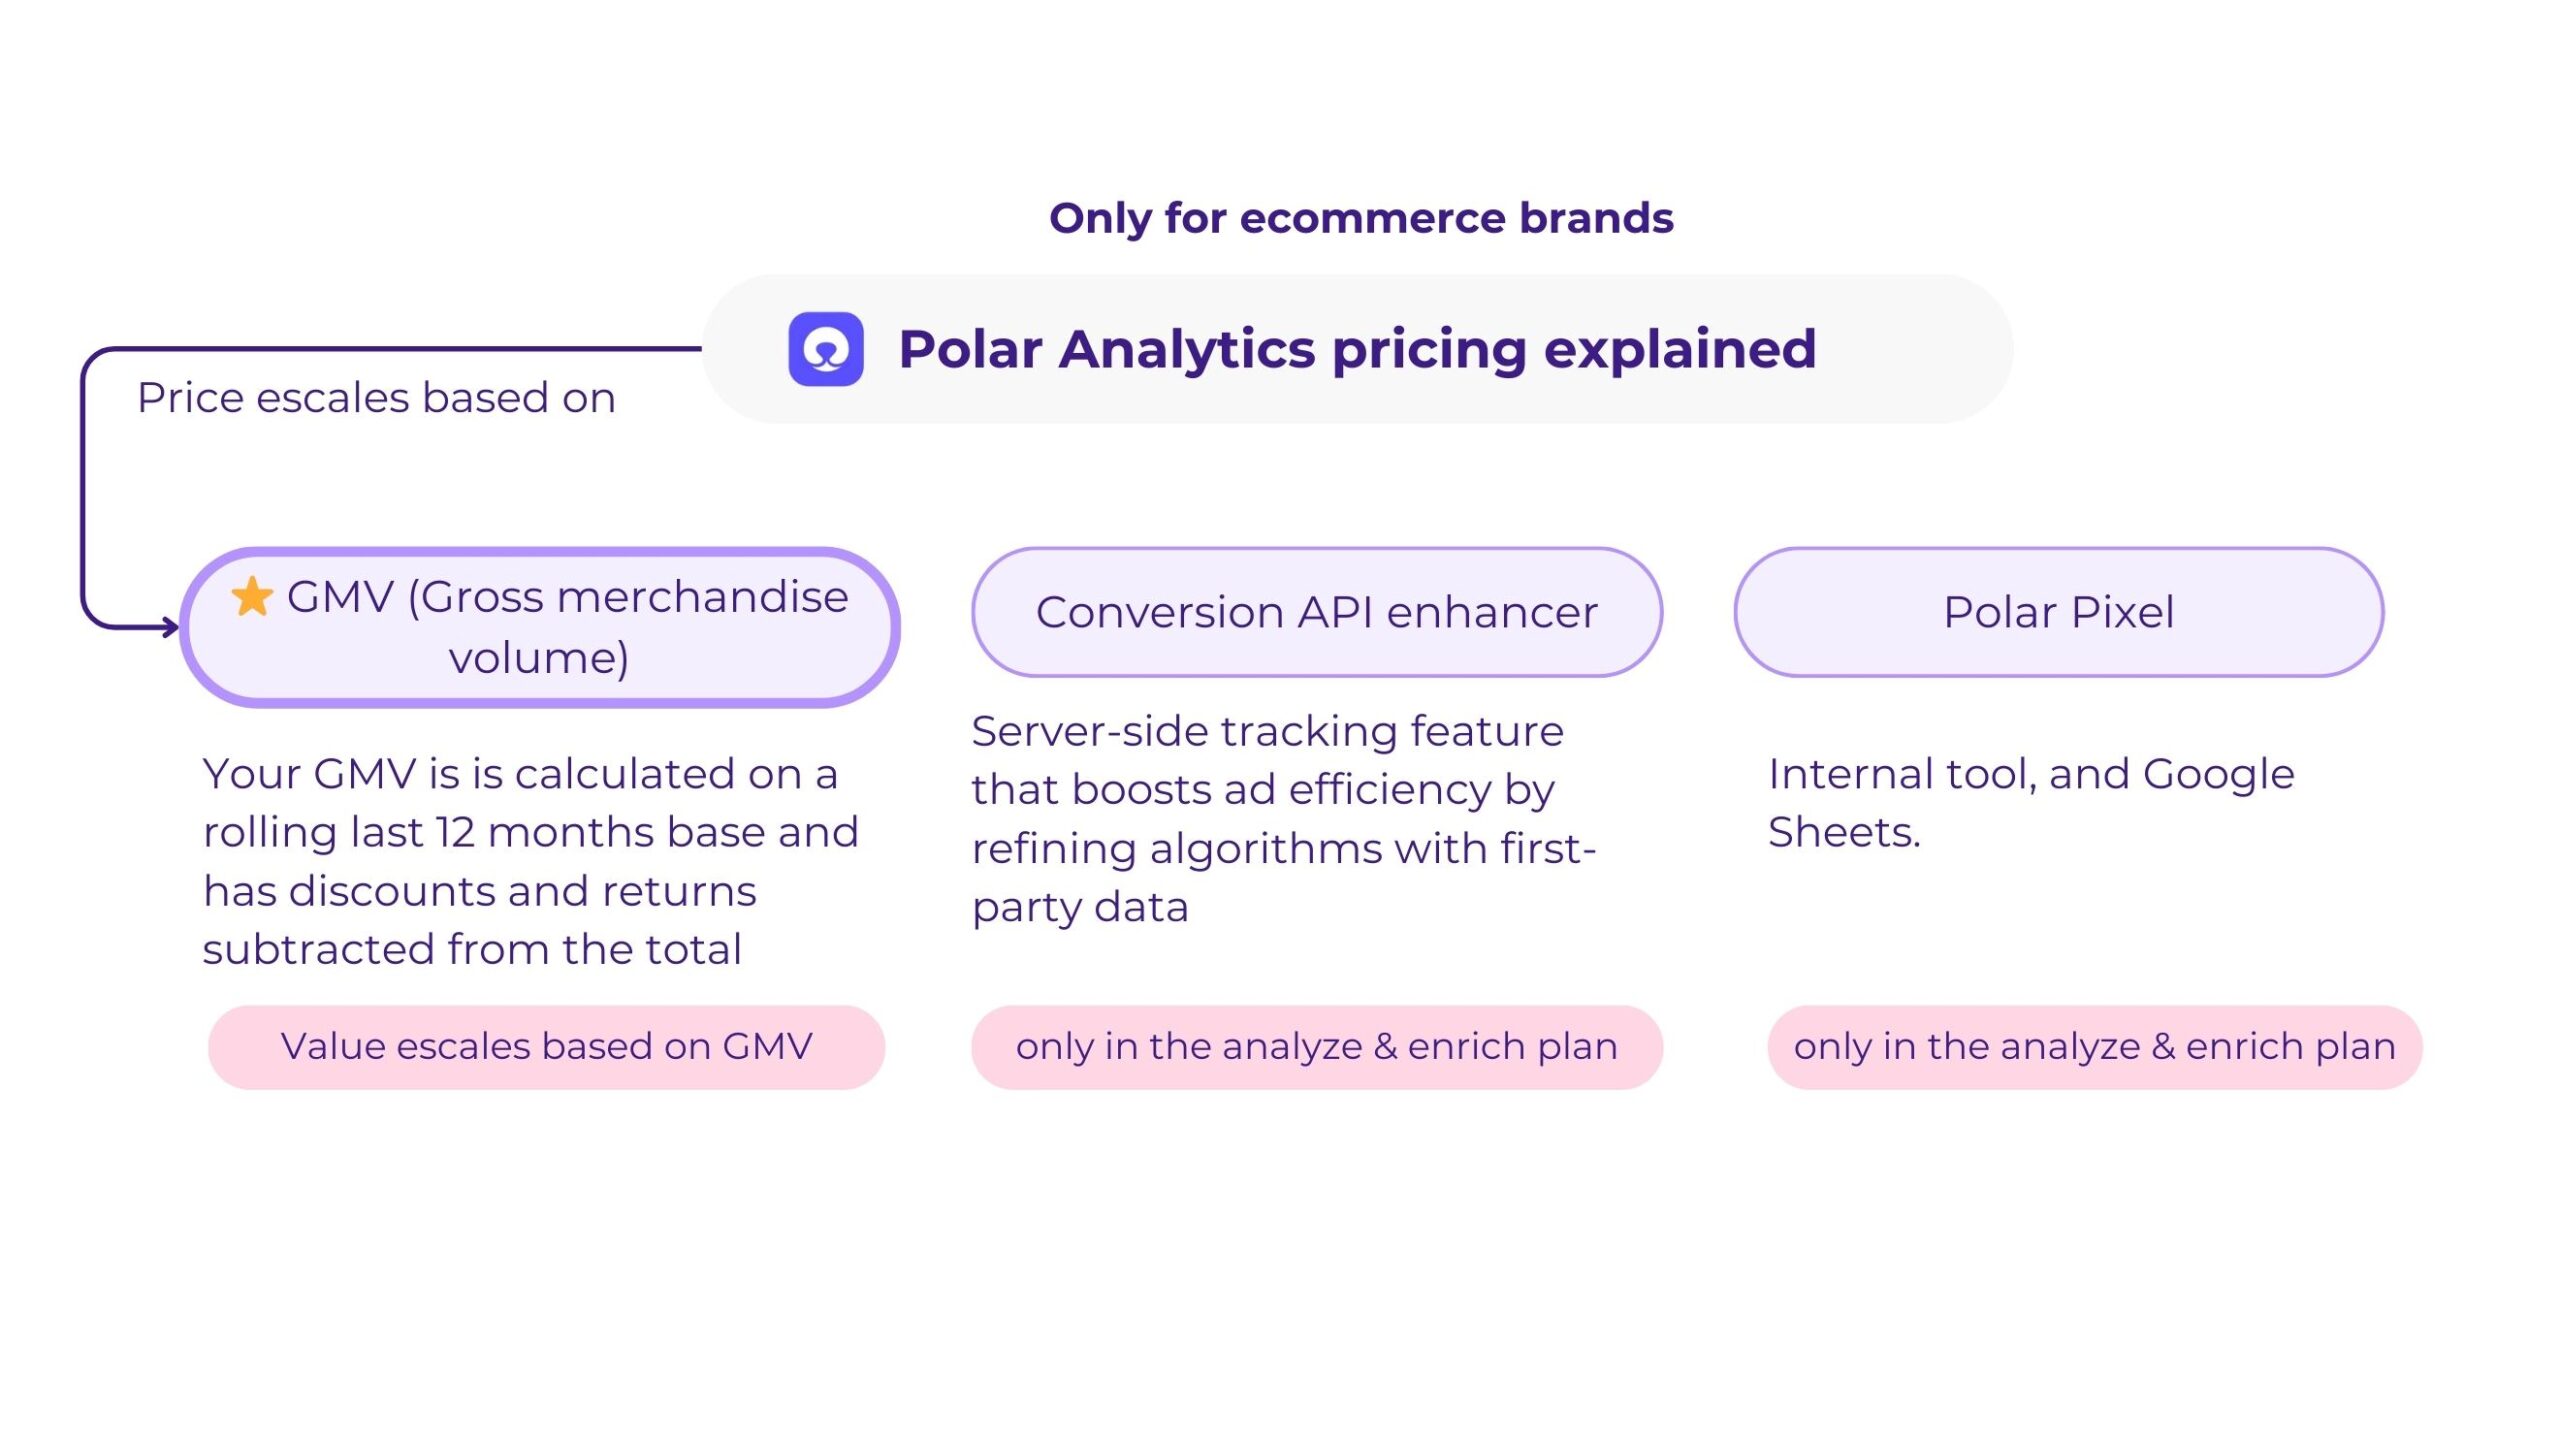
The difference between the Analyze Plan (starts at $300/month) and the Analyze & Enrich plan is that the Analyze plan focuses on analytics, eCommerce, and marketing reporting.
If you want access to features like a Pixel for attribution measurement or a Conversion API enhancer to improve marketing campaigns, you’ll need the Analyze and Enrich plan.
Pricing for both plans scales upward, starting from $1.5M in GMV.
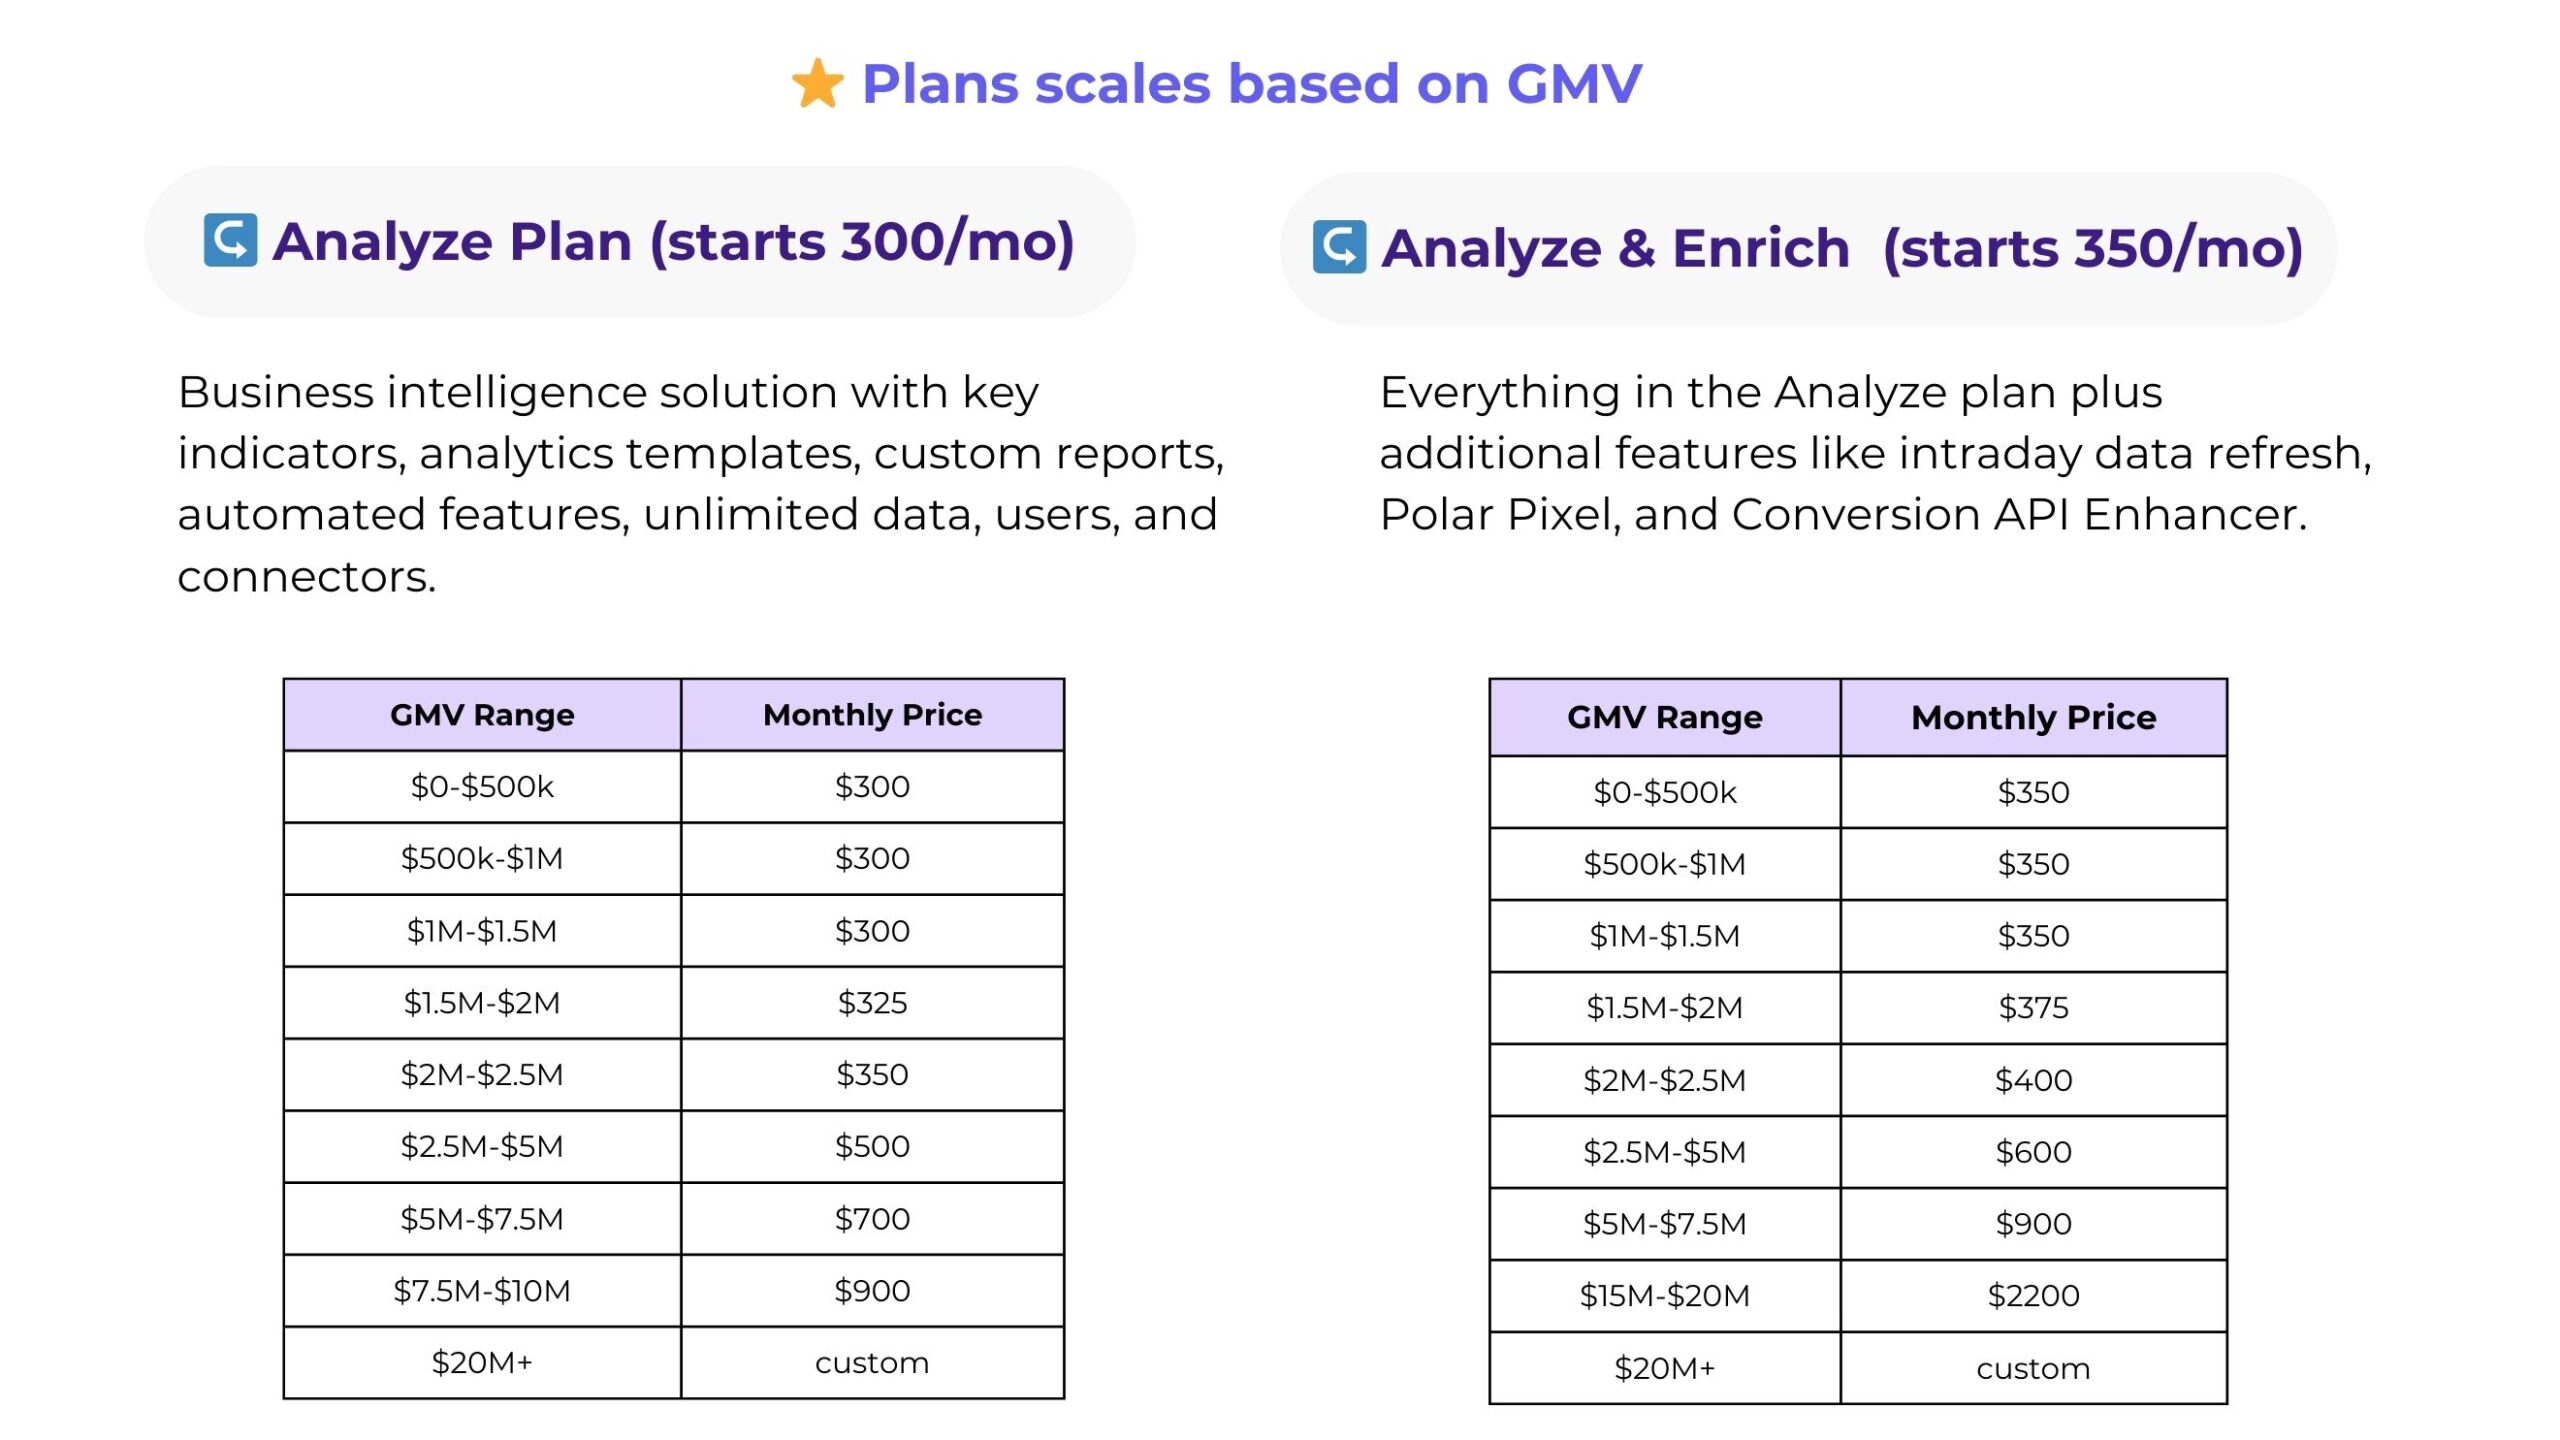
Their pricing is based on plans and transactions. The only way your pricing goes up is if you change your plan or increase your GMV.
If you prefer predictable, lower pricing just for a reporting solution, consider platforms such as Porter Metrics or Supermetrics.
Frequently Asked Questions (FAQs)
Is there a fully free Polar Analytics alternative?
You can use the Google Native connectors that Data Studio offers, such as Google Ads, Google Search Console, and Google Analytics 4.
However, if you want to integrate additional platforms, it’s better to choose another verified third-party provider, such as Porter Metrics or Funnel.io.
There are no truly good free alternatives to Polar Analytics because developing and maintaining a comprehensive marketing data platform with robust API integrations across all major advertising and analytics tools is an extremely costly and complex undertaking:
- Building and maintaining API connections to dozens of marketing data sources requires significant engineering resources to handle varying data models, rate limits, and authentication methods.
- Calculating custom marketing metrics means translating complex formulas across disparate data sources and handling elements like campaign structure and ad creatives.
- Marketing data volumes can be massive even for smaller businesses, necessitating optimized data warehousing capabilities.
- APIs and data sources change constantly, requiring continuous integration updates and maintenance.
- Creating an intuitive UI/UX, rich visualizations, collaboration features and other functionality further adds to development costs.
While simple free marketing data connectors exist, building a truly full-featured free alternative with broad compatibility, customization abilities, and scalability is prohibitively expensive without a sustainable monetization model.
Why do people leave Polar Analytics?
Most Polar Analytics customers leave the platform because of: delayed data retrieval, incomplete metrics and documentation, and occasional slow loading times.
- Delayed data retrieval: Polar Analytics performs daily backfills by default, which can be suitable for weekly or monthly performance monitoring but may not be ideal for day-to-day operational or real-time analytics. This limitation can be problematic for users who need to track data during special events or promotions.
- Incomplete metrics and documentation: Some users have reported that Polar Analytics lacks specific analyses and metrics that marketing teams and agencies may eventually need. The documentation on available fields is also unclear, causing confusion among users about missing metrics.
- Occasional slow loading times: A few users have mentioned experiencing slow loading times when using Polar Analytics, which can be frustrating and hinder productivity.
Is it easy to switch from Polar Analytics to another solution?
Most of the top alternatives make migrating data connections and reports/dashboards from Polar Analytics relatively easy. Many have import wizards and services to assist with the transition process.
For instance, if you move from Polar Analytics to Porter Metrics, we will help you migrate all your reports for free.
Also, you can copy a dozen of templates that will help you change your reports without a lot of effort on your side. For instance, you can check these examples: