A B2B report should include the following elements:
1. Executive Summary: Overview of key findings and insights.
2. Objectives: Clear goals of the report.
3. Data Sources: Mention tools like HubSpot, Google Analytics 4, and advertising platforms (Facebook Ads, Google Ads, LinkedIn Ads).
4. Campaign Performance: Metrics such as impressions, clicks, ad spend, CTR, CPC, conversions, and conversion rate.
5. Lead Generation: Number of leads and their quality.
6. Traffic Analysis: Sessions, bounce rate, and traffic sources (source and medium).
7. SEO Performance: Keyword rankings and organic traffic insights.
8. Audience Insights: Details on target audience and engagement.
9. Recommendations: Actionable insights for improvement.
10. Conclusion: Summary of findings and next steps.
To analyze B2B data effectively, follow these steps:
1. **Data Collection**: Gather data from various sources such as CRM systems like HubSpot, advertising platforms like Facebook Ads, Google Ads, LinkedIn Ads, and analytics tools like Google Analytics 4.
2. **Identify Key Metrics**: Focus on metrics relevant to B2B such as impressions, clicks, ad spend, CTR (Click-Through Rate), CPC (Cost Per Click), conversions, conversion rate, leads, sessions, and bounce rate.
3. **Segment Data**: Organize data by campaign name, date, ad ID, ad name, keyword, ad group, ad set, audience, source, and medium to understand performance across different segments.
4. **Analyze Performance**: Evaluate the effectiveness of each channel and campaign by comparing metrics like CTR, conversion rate, and CPC. Identify which channels and campaigns are driving the most leads and conversions.
5. **Optimize Campaigns**: Use insights from the analysis to optimize ad spend, adjust targeting, and improve ad creatives. Focus on high-performing keywords and audiences.
6. **SEO and PPC Integration**: Analyze the impact of SEO efforts alongside PPC campaigns to ensure a cohesive strategy that maximizes visibility and conversions.
7. **Reporting and Insights**: Create reports to communicate findings and insights to stakeholders. Use visualizations to highlight key trends and performance metrics.
By systematically analyzing these elements, you can refine your B2B marketing strategies to improve ROI and achieve business goals.
To build a B2B dashboard, follow these steps:
1. **Define Objectives**: Identify the key metrics and KPIs that align with your business goals, such as leads, conversions, and ad performance.
2. **Select Tools**: Use tools like HubSpot for CRM data, Google Analytics 4 for website analytics, and platforms like Facebook Ads, Google Ads, and LinkedIn Ads for PPC data.
3. **Data Integration**: Integrate data from these platforms into a centralized dashboard using tools like Google Data Studio or Tableau.
4. **Design Layout**: Organize the dashboard to display key metrics such as impressions, clicks, ad spend, CTR, CPC, conversions, conversion rate, leads, sessions, and bounce rate.
5. **Visualize Data**: Use charts and graphs to visualize data for easy interpretation. Include filters for date ranges, campaigns, and ad sets.
6. **Automate Updates**: Set up automated data refreshes to keep the dashboard up-to-date.
7. **Test and Iterate**: Test the dashboard with stakeholders, gather feedback, and make necessary adjustments for clarity and usability.
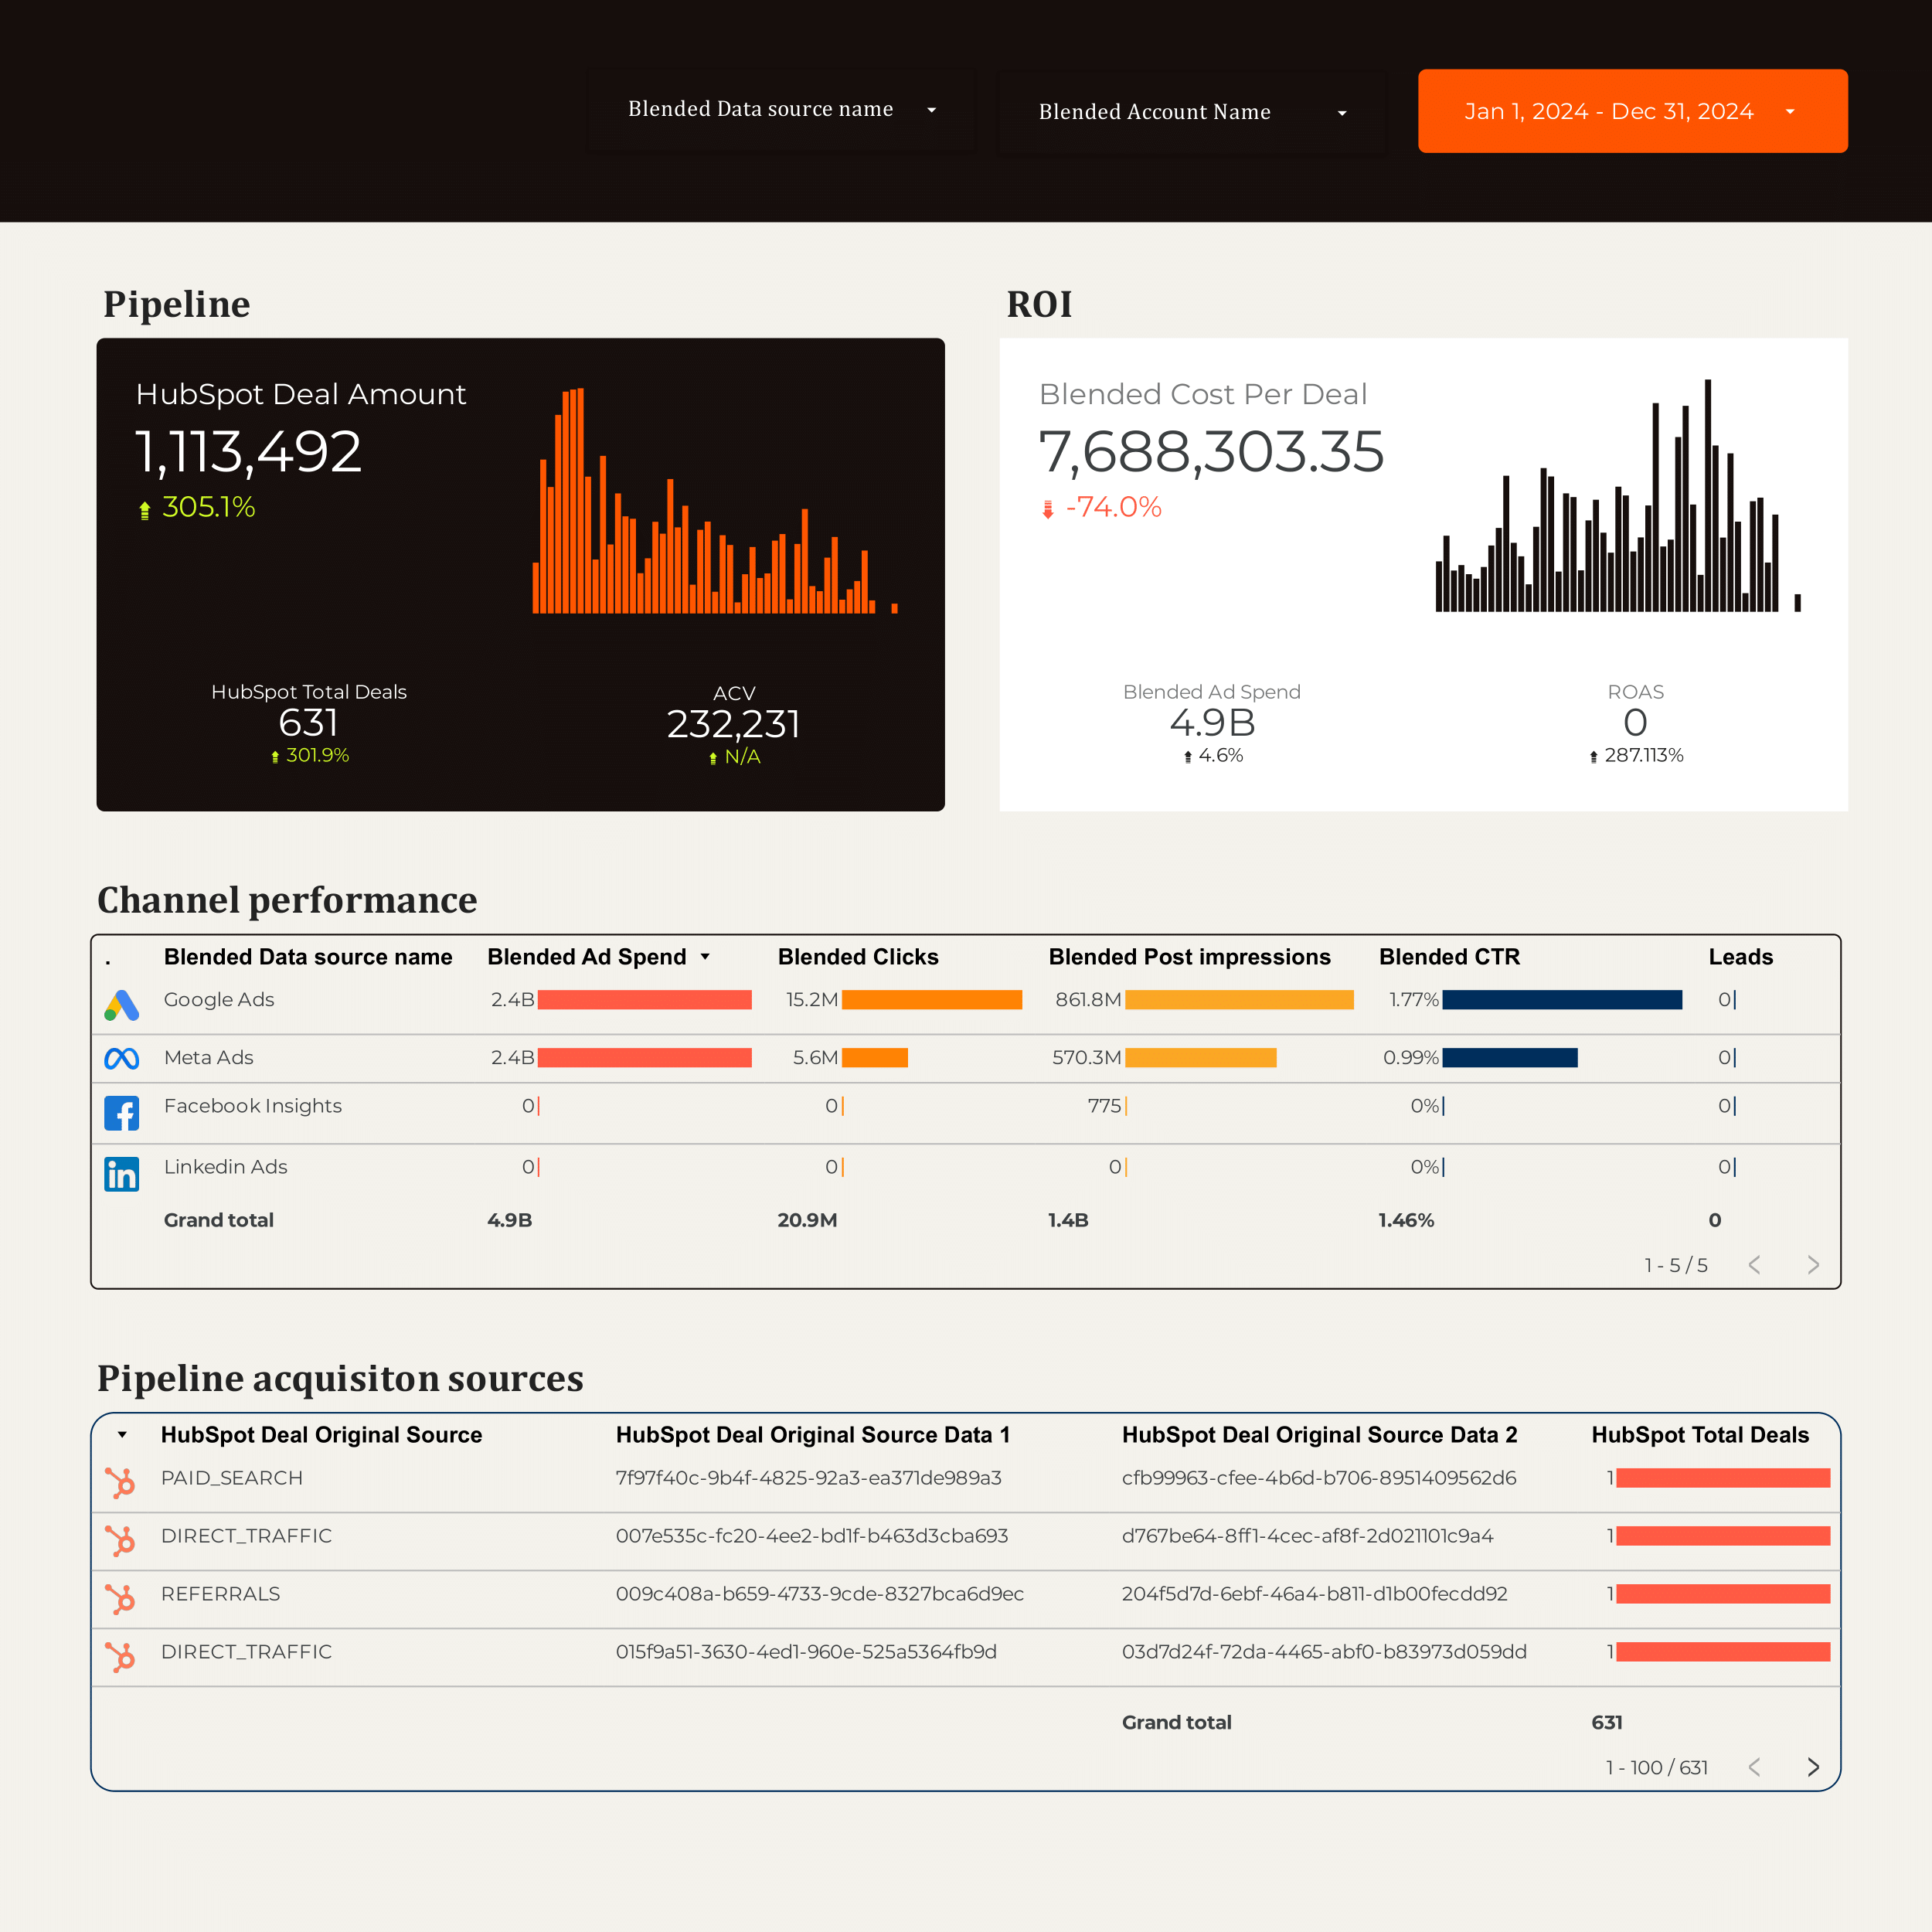
A B2B dashboard is a tool used by businesses to track and analyze key performance indicators (KPIs) related to their business-to-business operations. It integrates data from various sources such as CRM systems like HubSpot, advertising platforms like Facebook Ads, Google Ads, and LinkedIn Ads, and analytics tools like Google Analytics 4. The dashboard provides insights into metrics such as impressions, clicks, ad spend, conversion rates, leads, sessions, and more, helping businesses optimize their marketing strategies and improve their overall performance.
I don’t know if you can download the template in PDF format.
 HubSpot
 Facebook Ads
 Google Ads
 LinkedIn Ads
 Google Analytics 4
 Impressions

