Twitter Analytics report template for Google Looker Studio
Home Twitter Analytics Twitter Analytics report template for Google Looker Studio Automate your your Twitter reports on Google Looker Studio to track followers, tweets, impressions,
Home Twitter Analytics Twitter Analytics report template for Google Looker Studio Automate your your Twitter reports on Google Looker Studio to track followers, tweets, impressions,
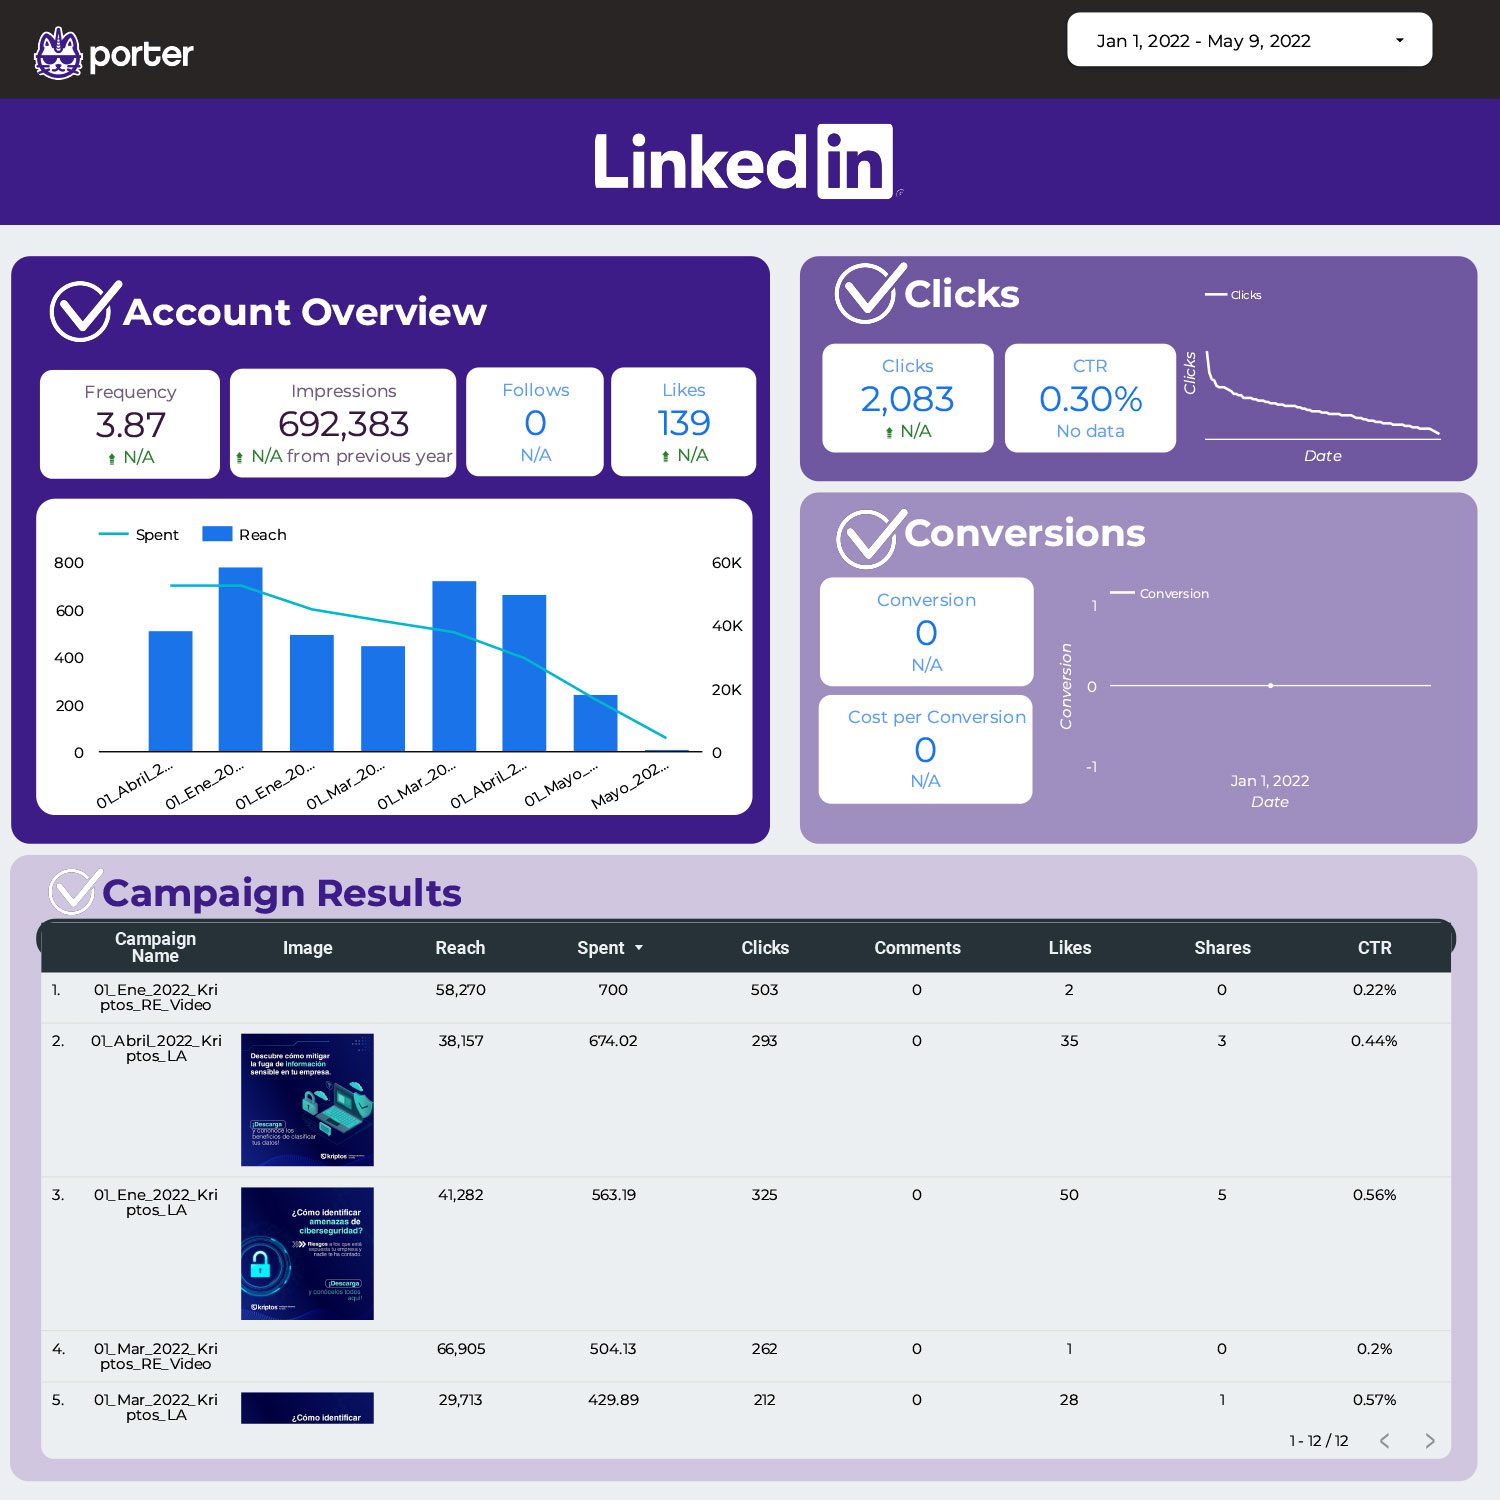
With more than 200 fields automate your LinkdIn Ads report, track your most important KPIs, compare different periods and break down your campaigns as you want.
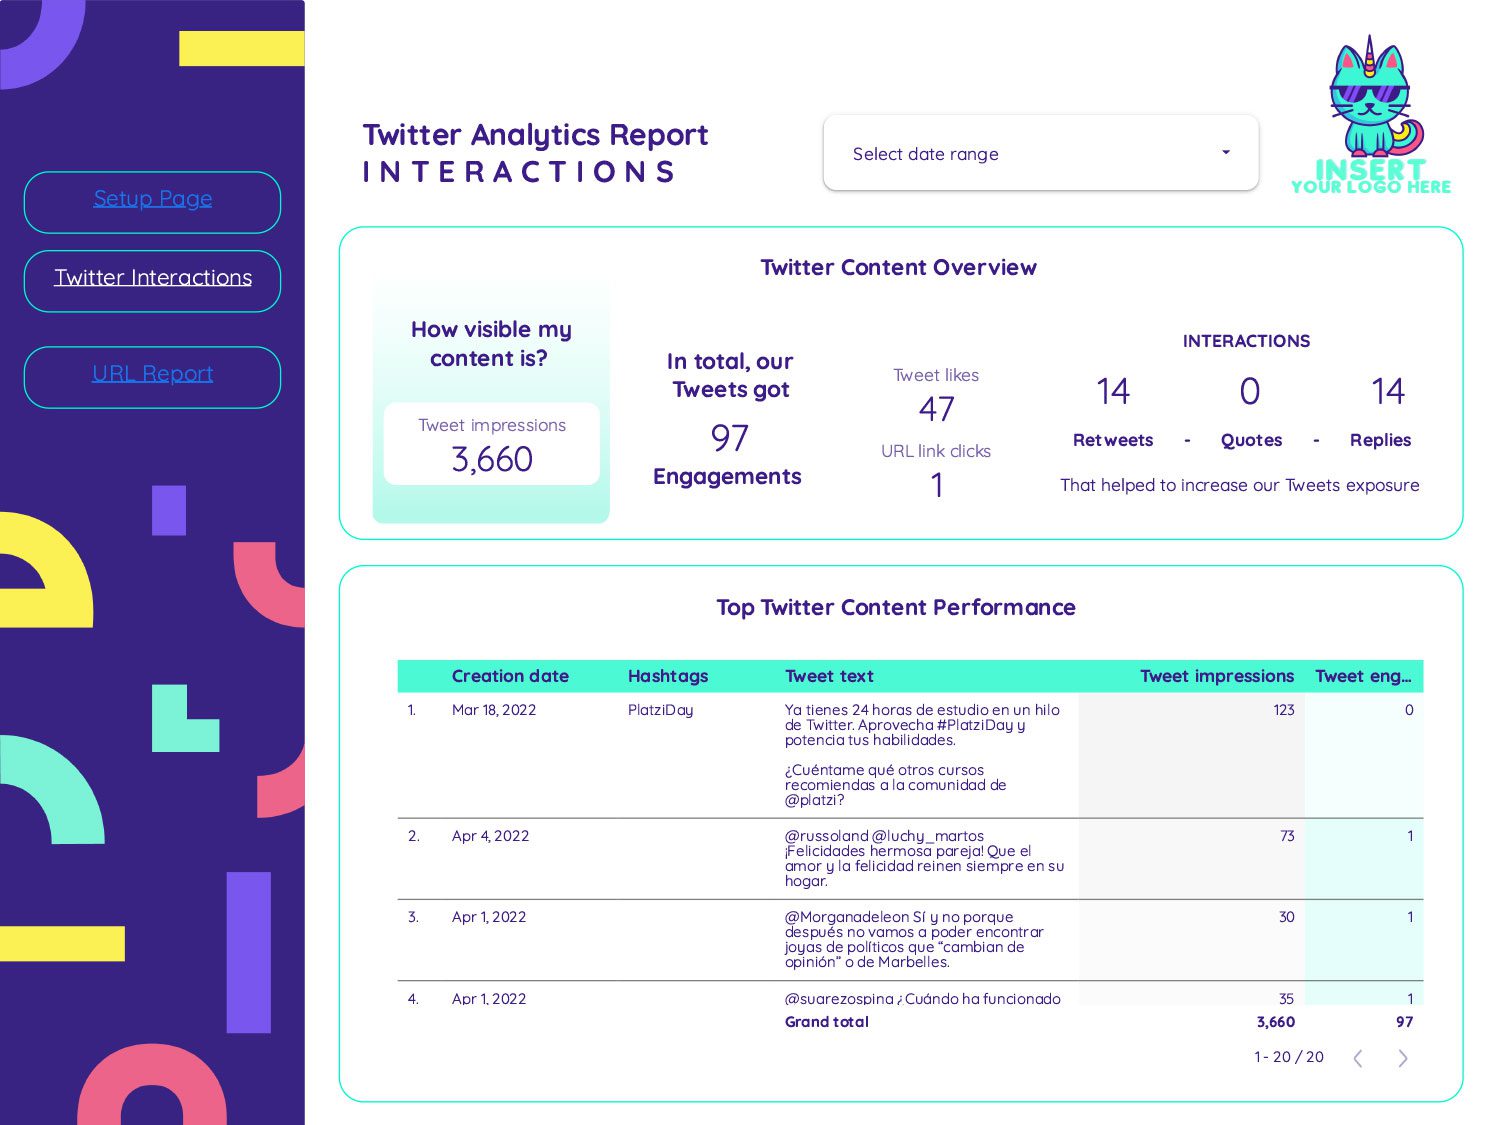
We created a free Twitter analytics report template to help you analyze and better understand your account. Simply connect your Twitter account to Google Data Studio, and the template will do the rest!
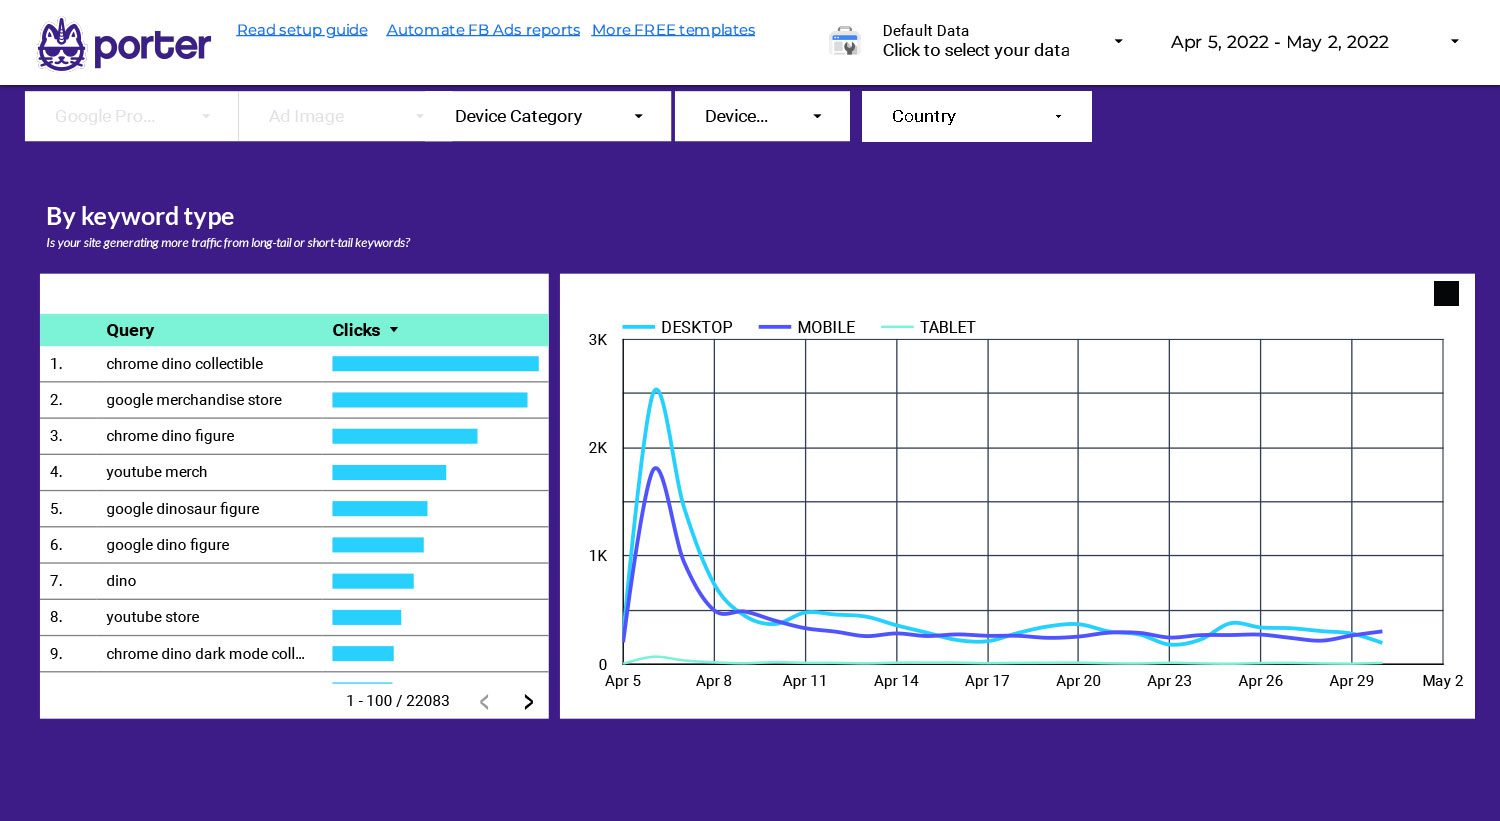
Identify SEO quick wins and ranking opportunities; spot keyword cannibalization; figure out if you’re ranking with short-tail or long-tail keywords. Free template. In just a few clicks.
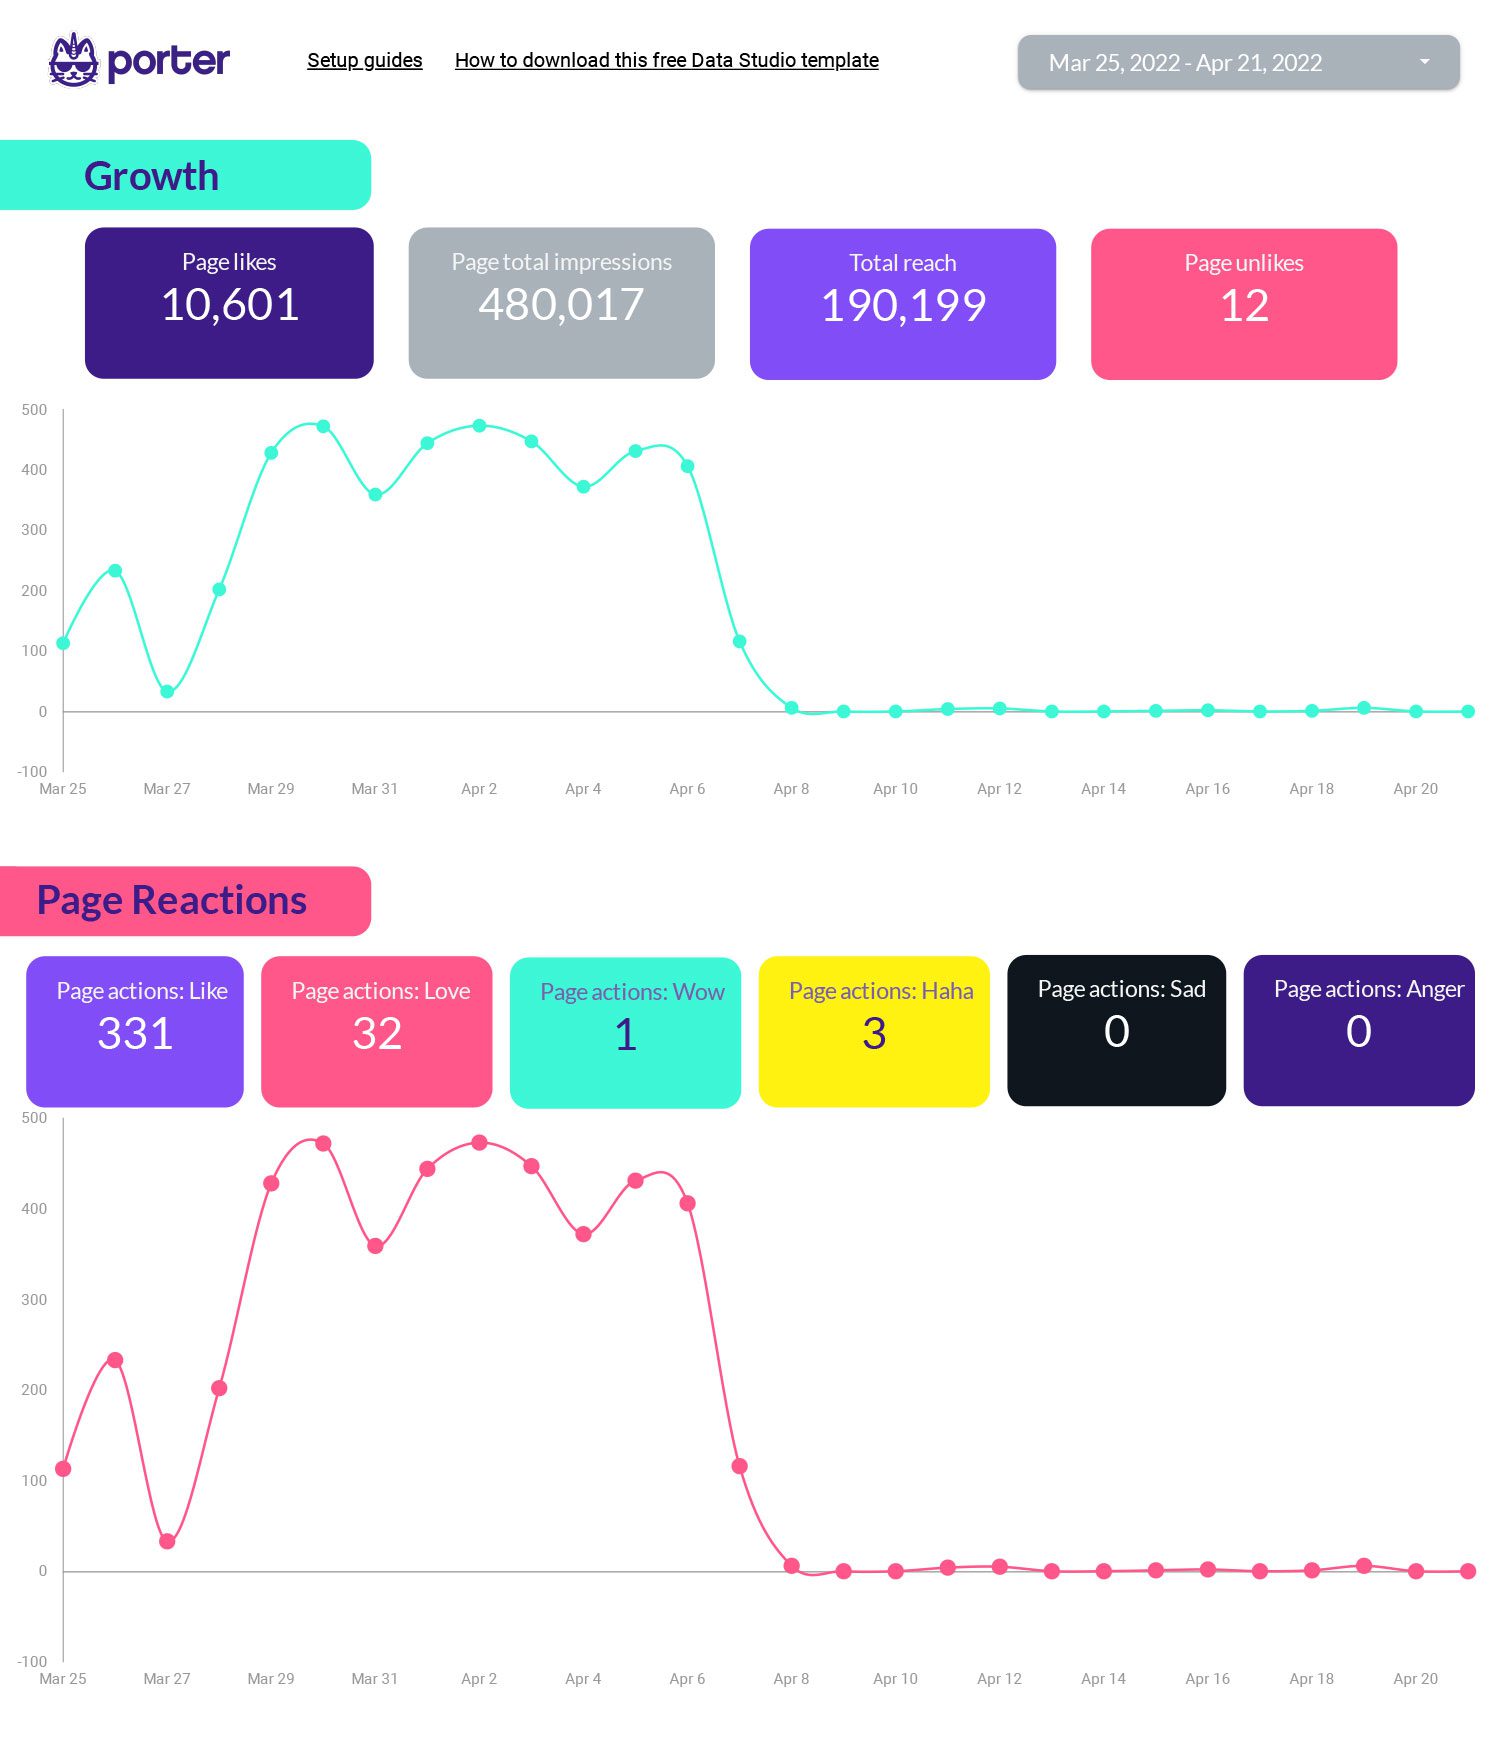
Track your organic efforts on Facebook Insights with this Google Data Studio Template. In just one page track: growth, page likes and reactions and page impressions.
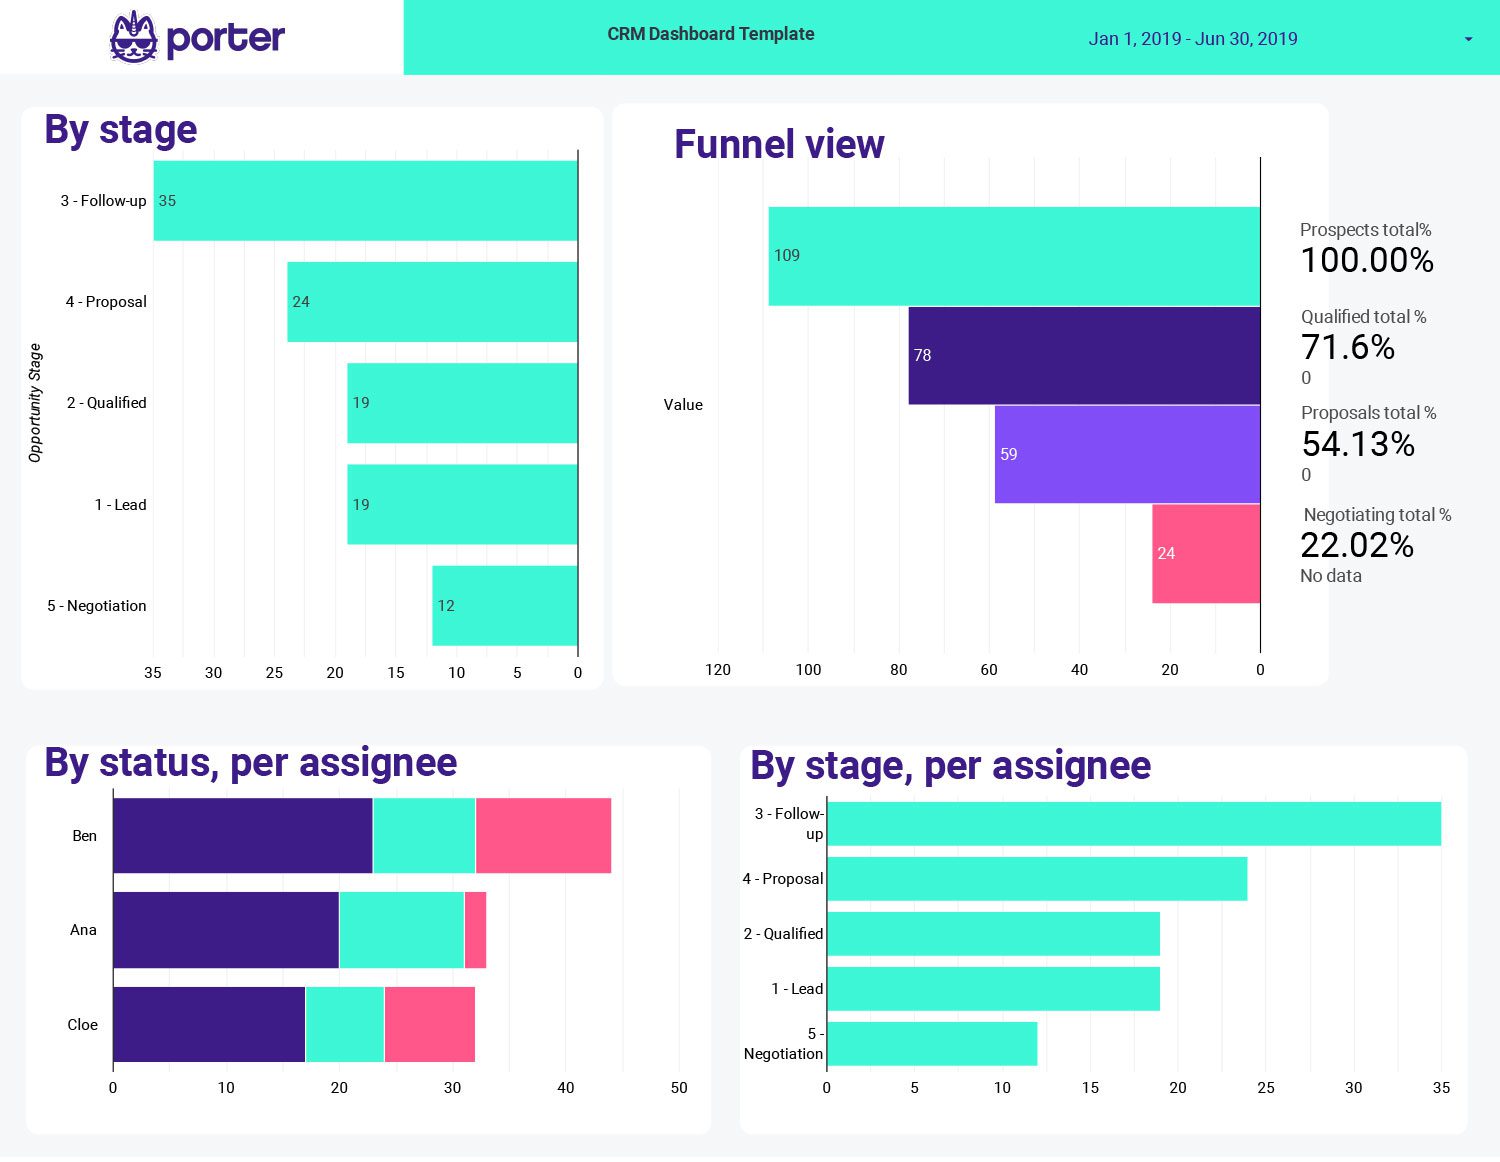
Visualize your sales pipeline and customers data in a single view with our free Google Data Studio templates.
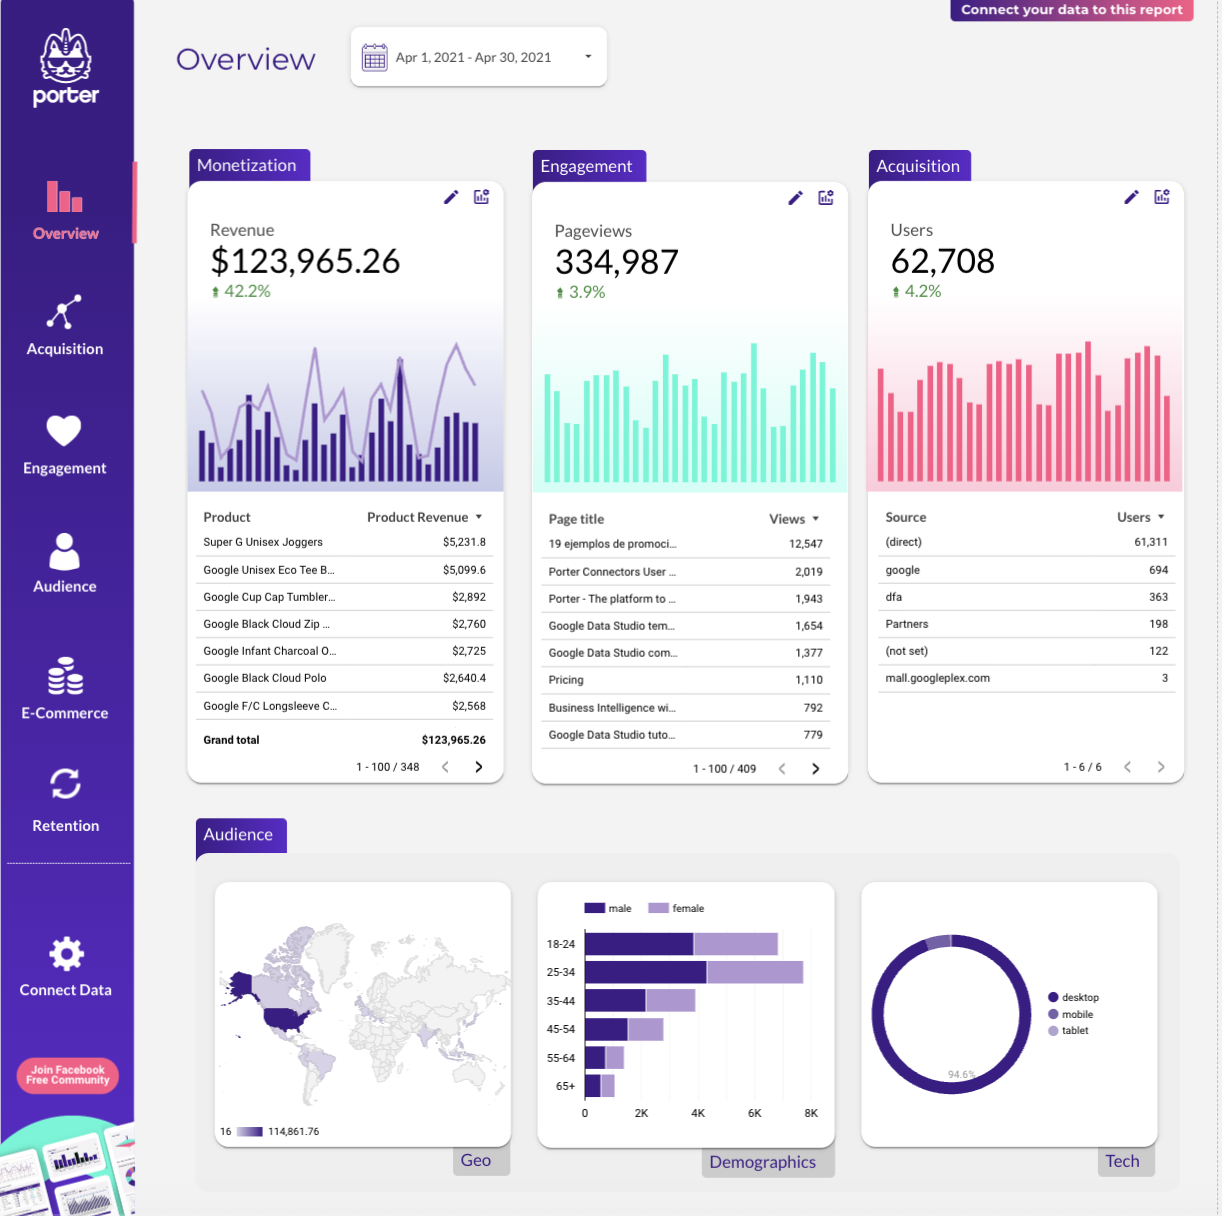
Understand how are you acquiring users, engaging, and monetizing your e-commerce with this Data Studio template. Compare your monthly results and understand your user demographics.
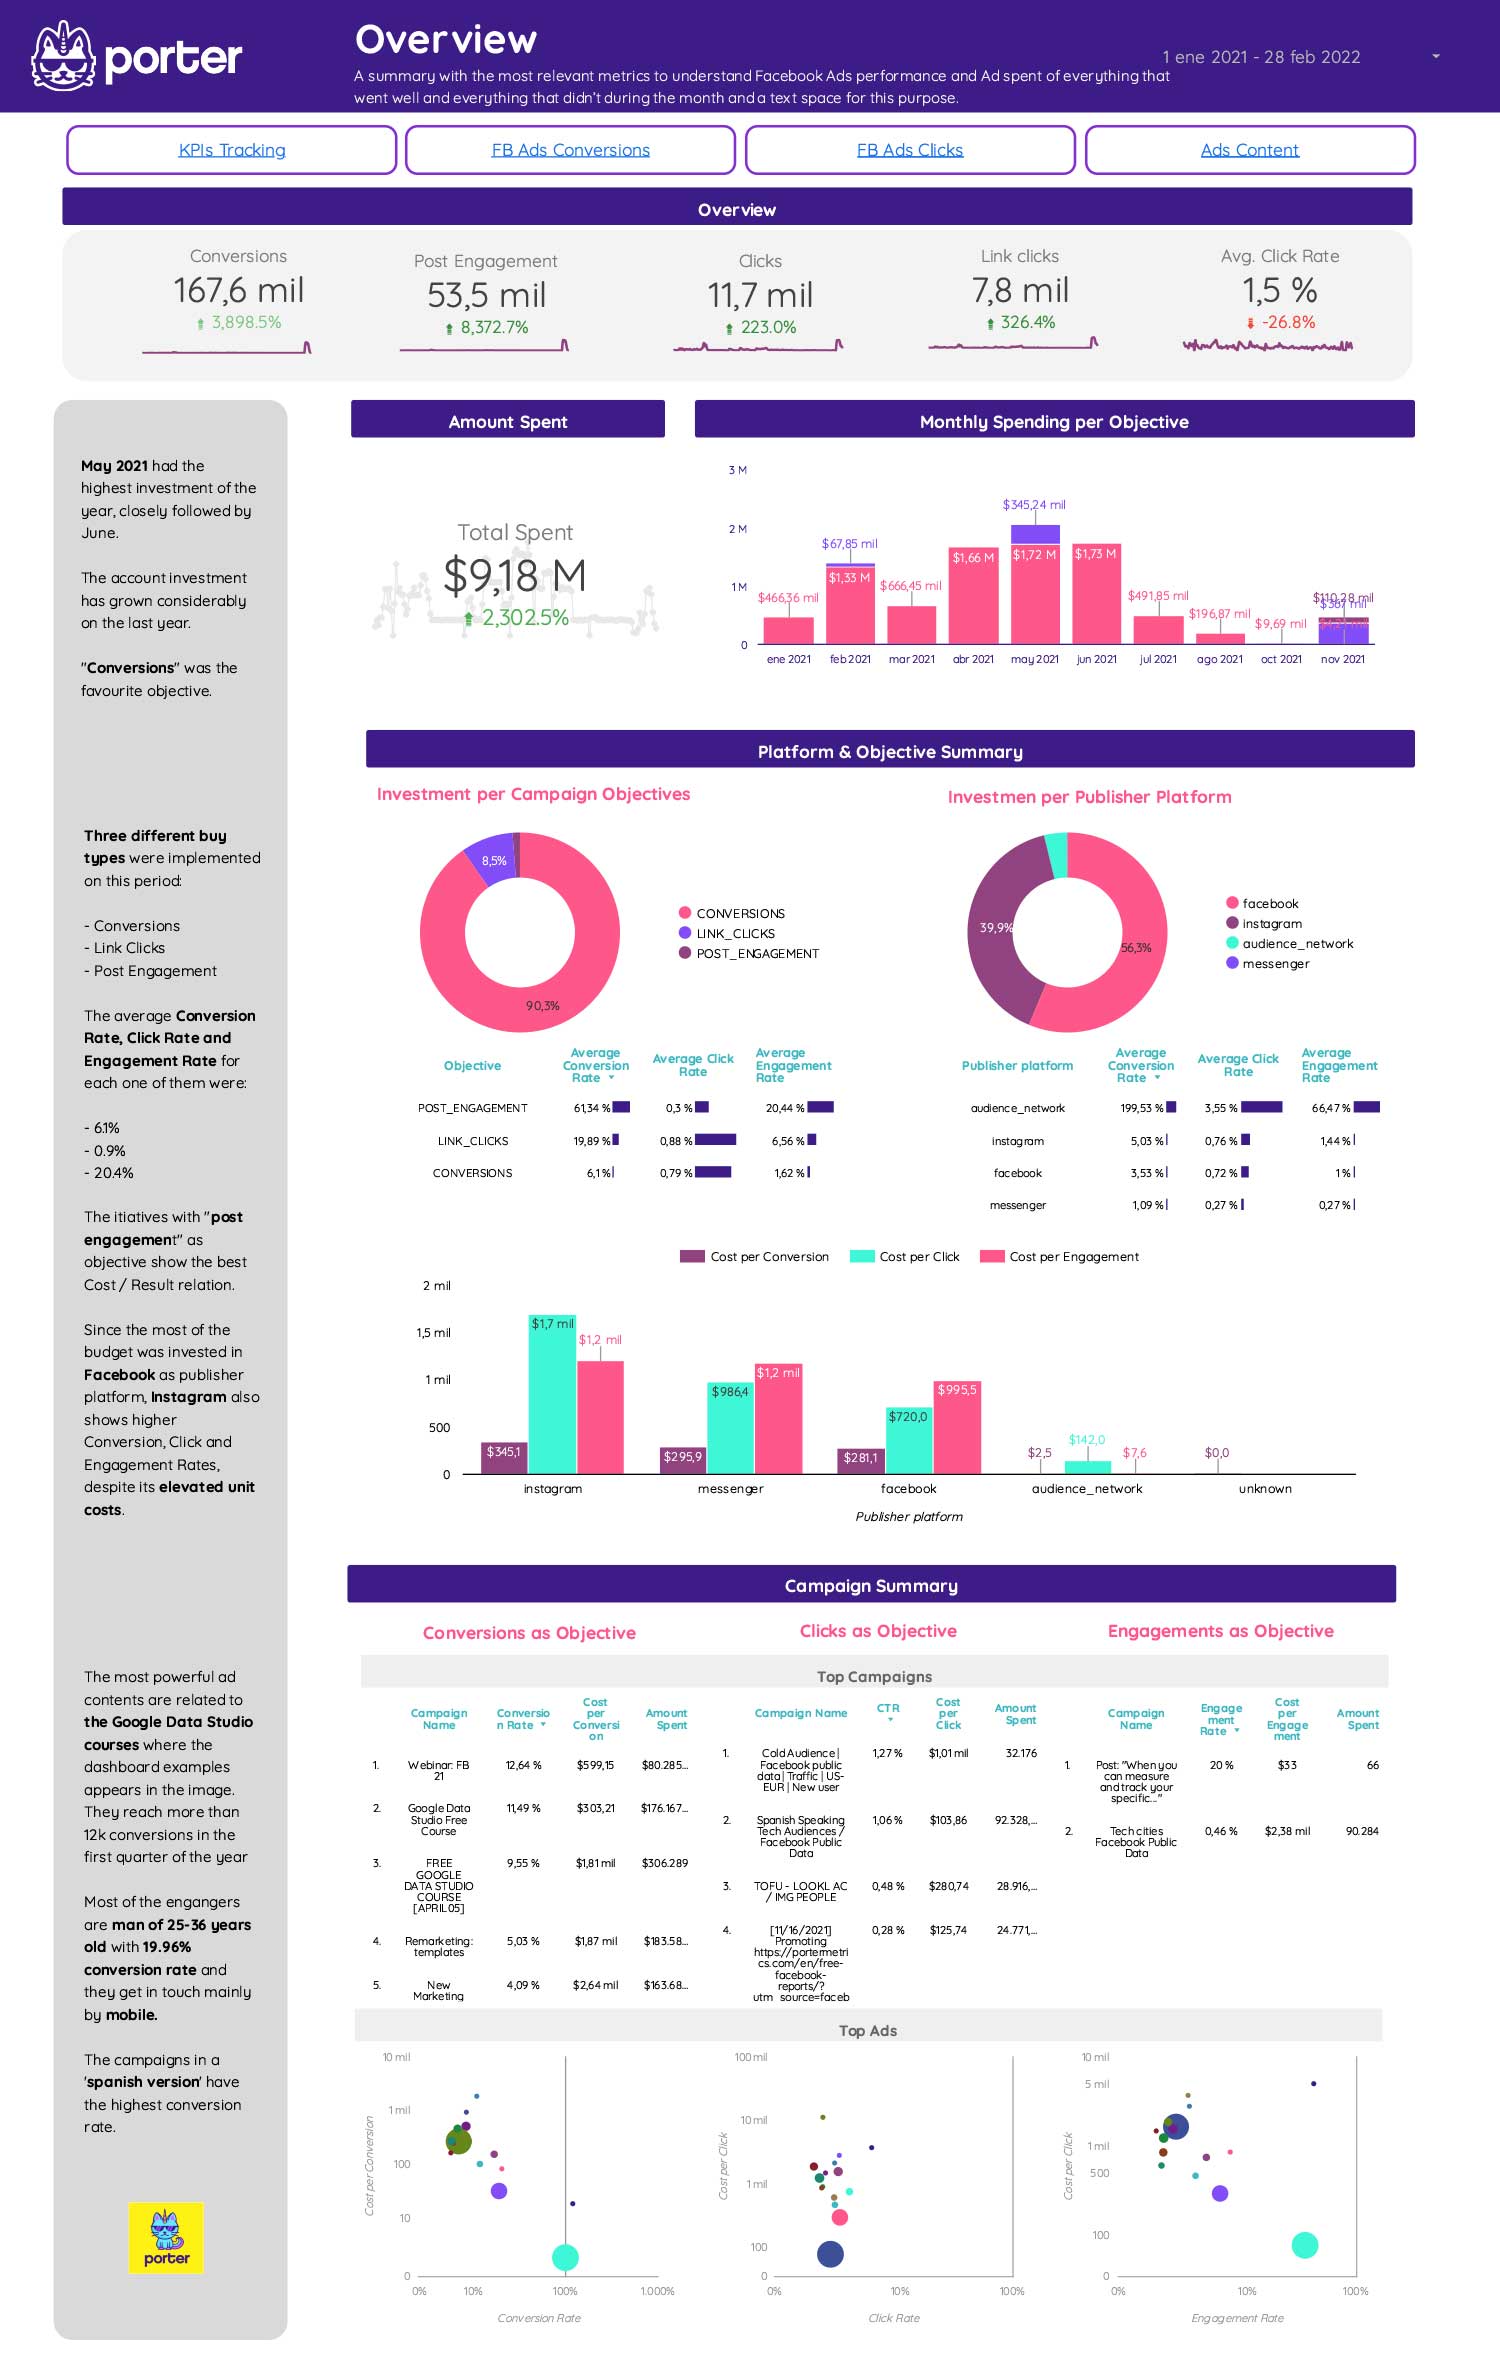
Use this Facebook Ads report template to display your key metrics in an interactive dashboard, monitor your Facebook Ads campaigns, track your performance, and share the results with your team or clients.
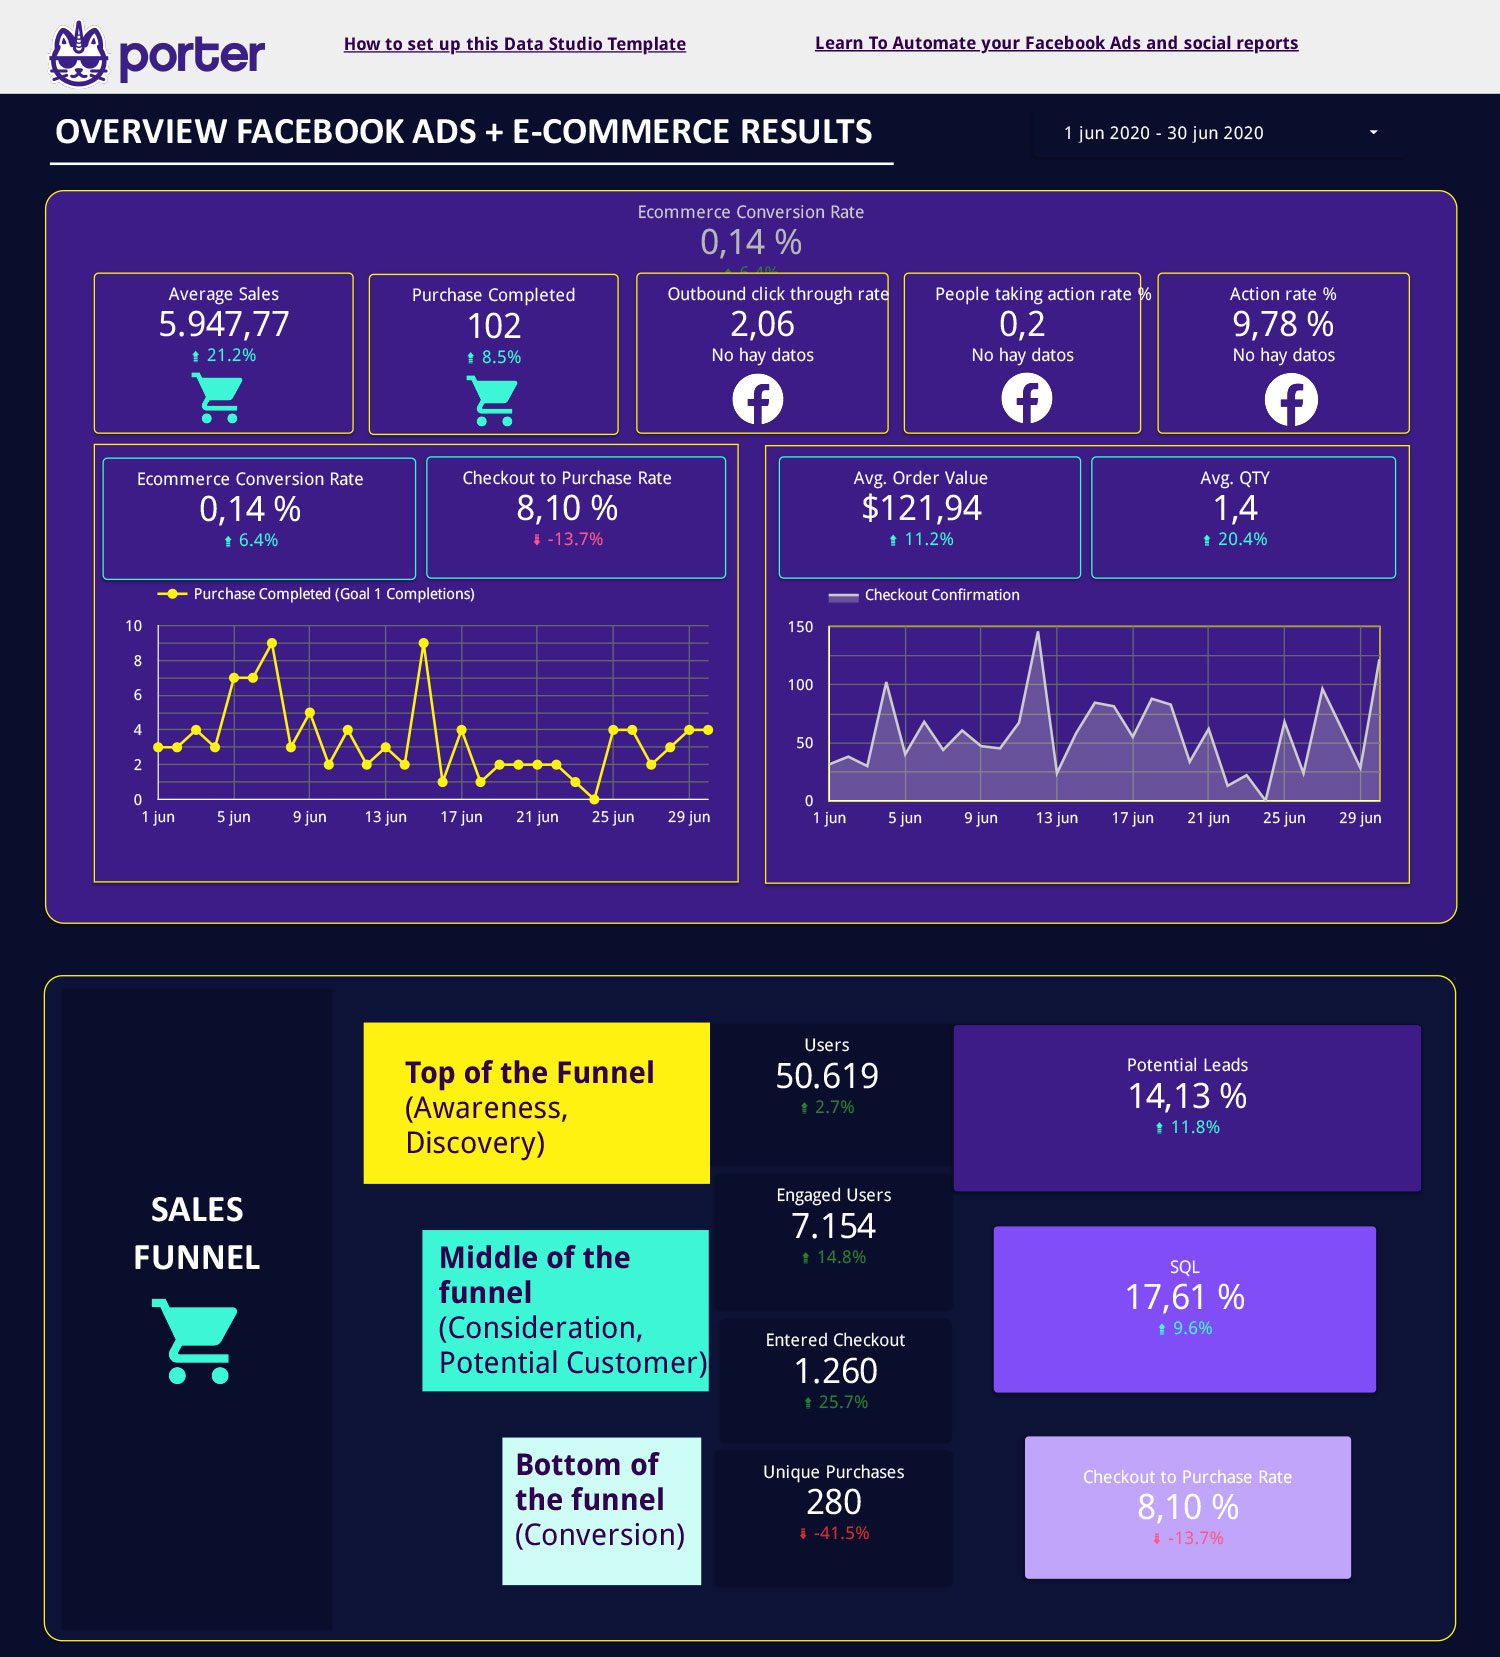
With this FREE template you have everything: your Google Analytics Data and your Facebook Ads performance. Now you can track your most important Business KPI’s in one place [Inspired in a real use case].
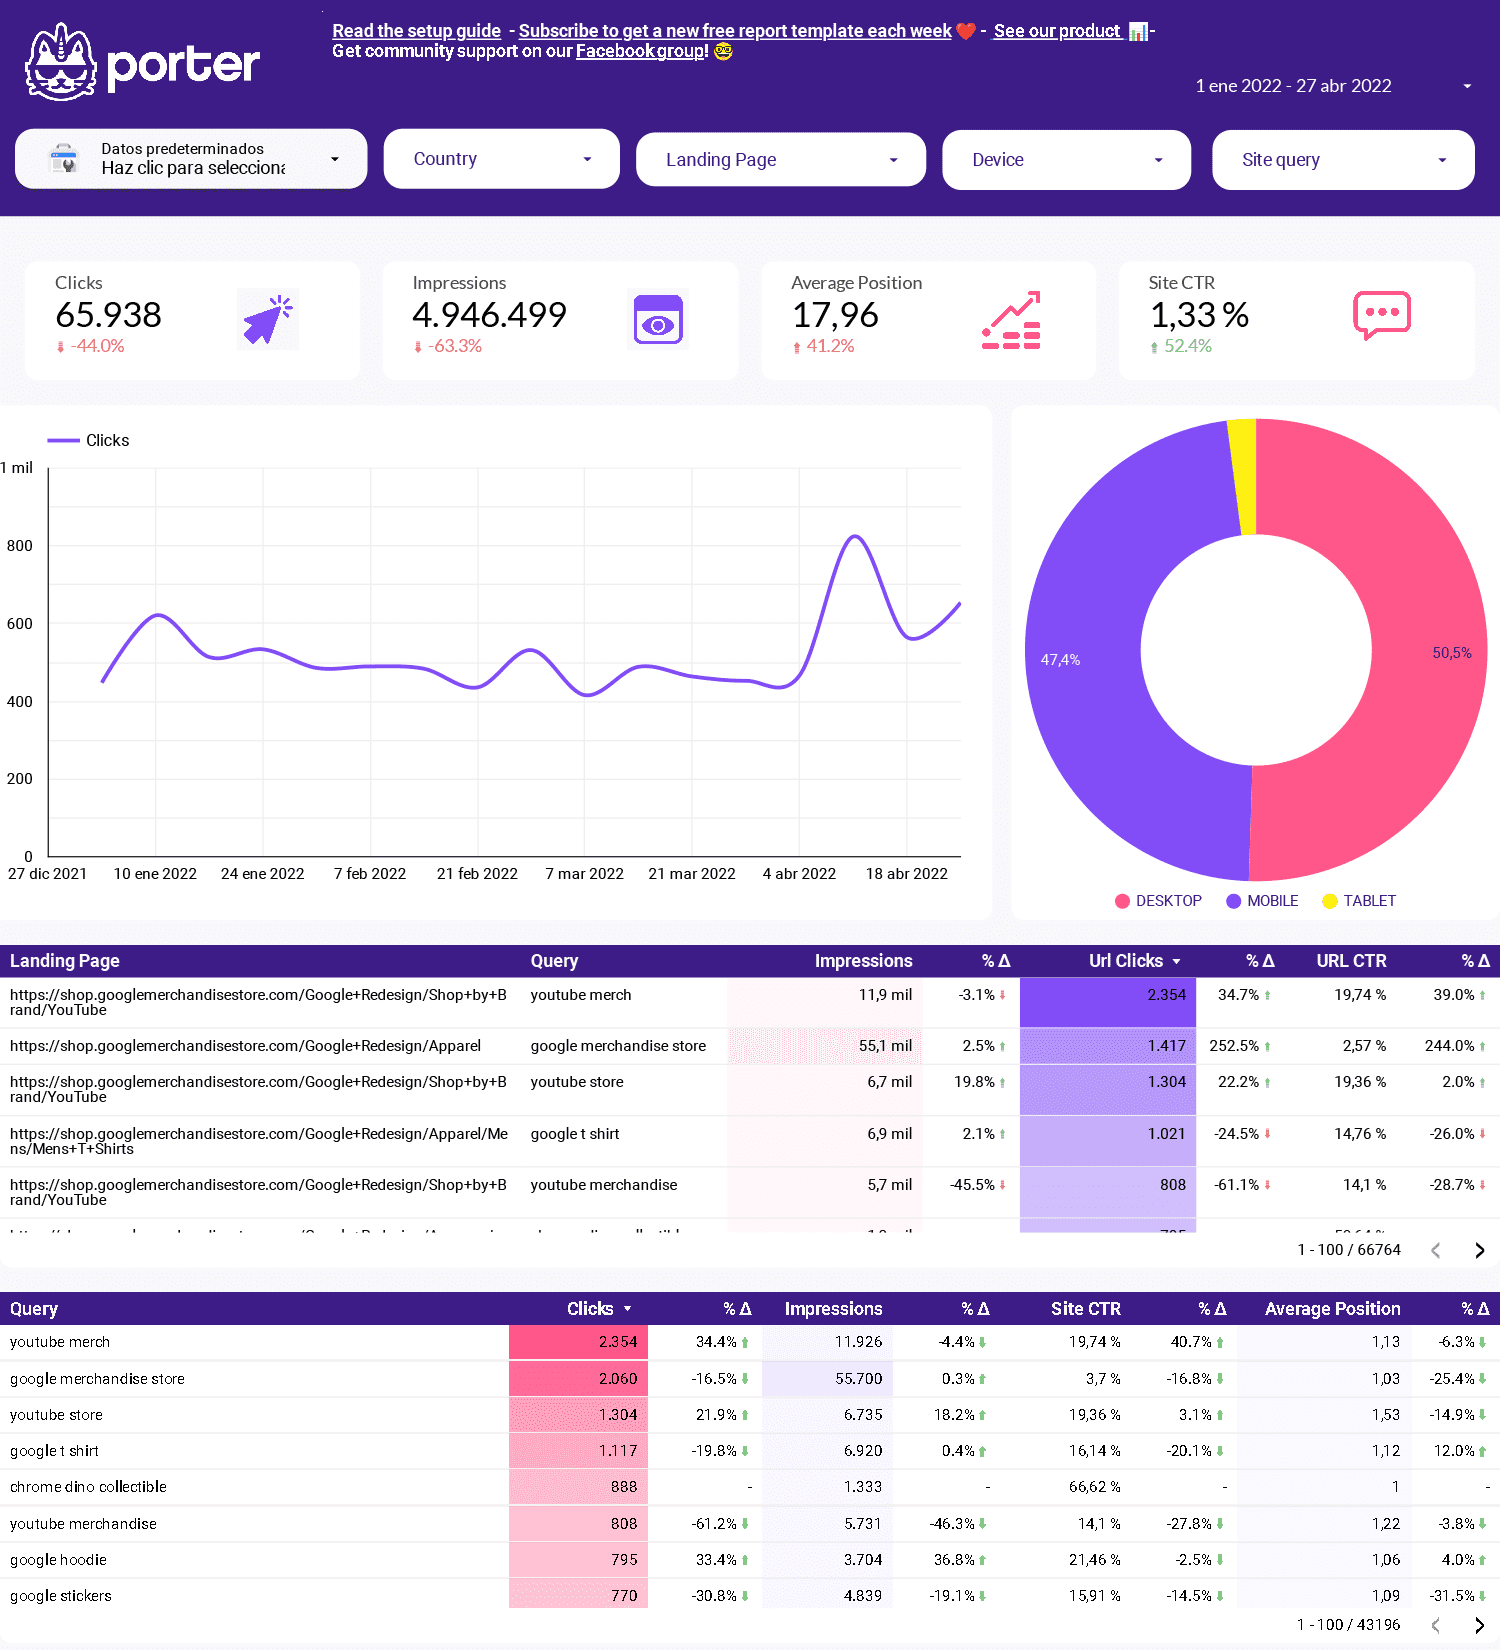
Visualize your SEO performance in a single view: how much organic traffic you get, what keywords you rank for, and what pages drive the most traffic—all with Search Console data.
Track your client’s KPI’s in a single Dashboard. The template includes a general overview of the most important results of Facebook and Instagram ADS and Specific information on your performance on every campaign.
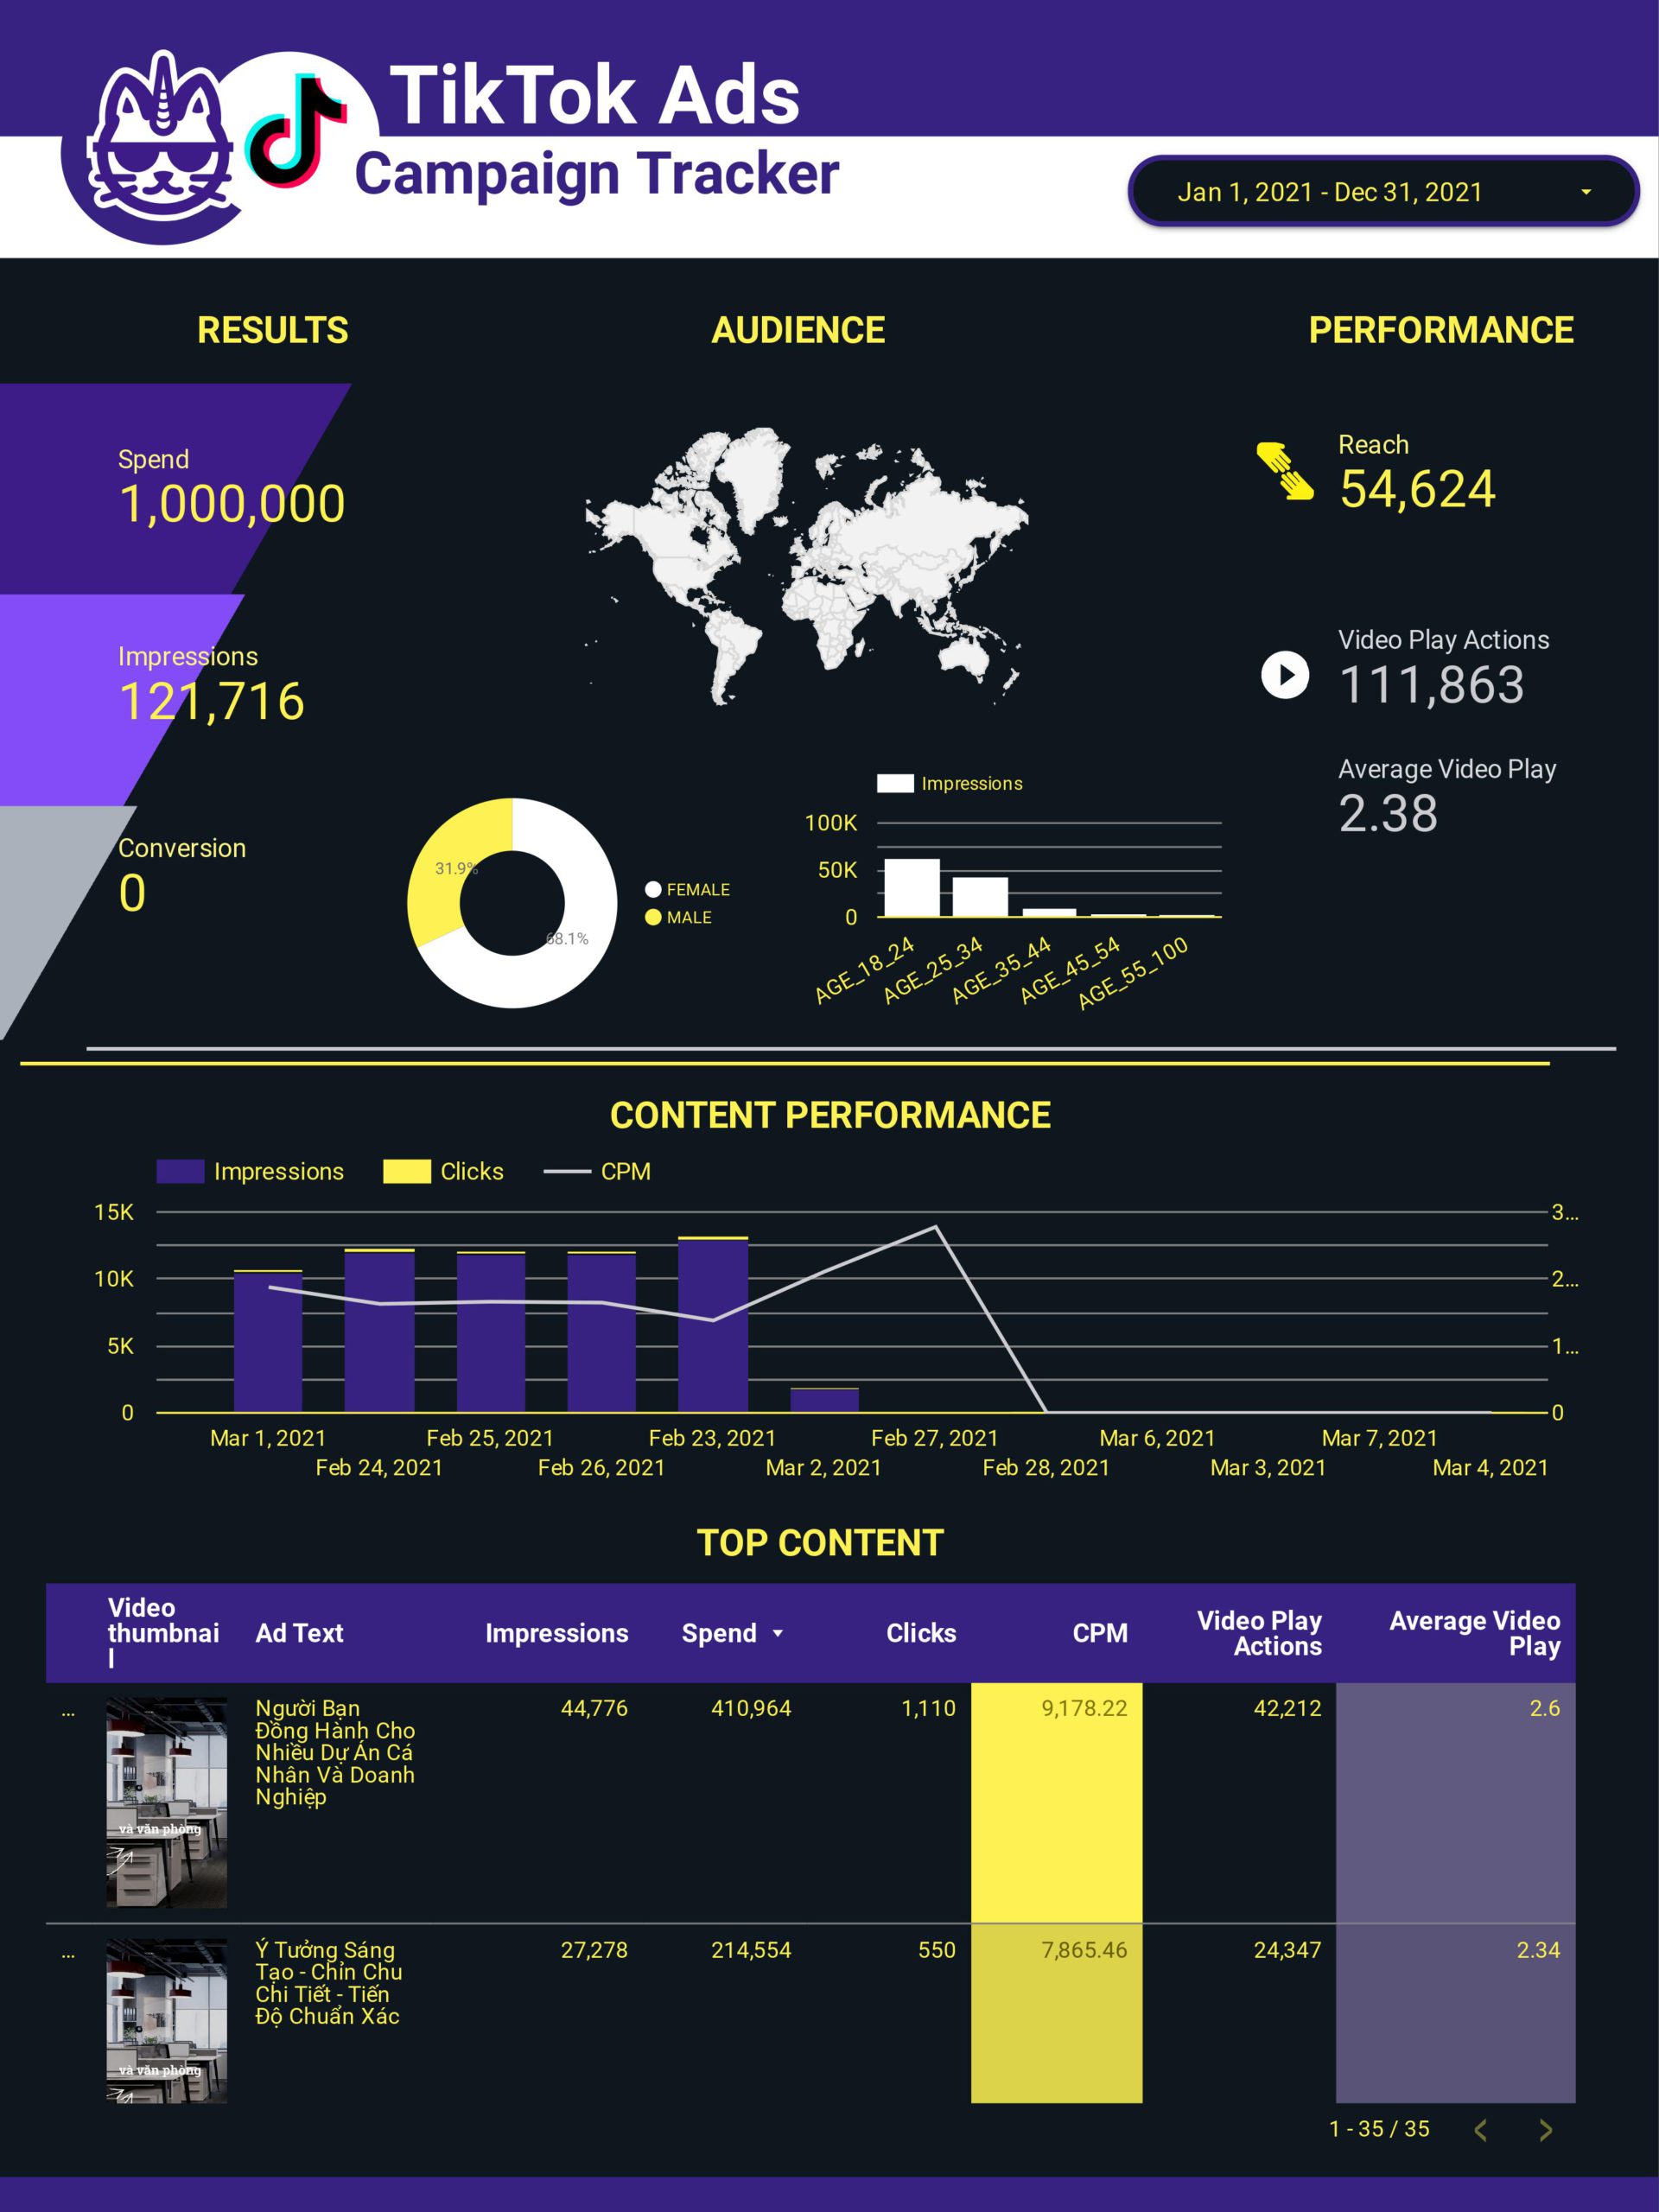
Visualize and customize your TikTok Ads performance data and get everything you need in one page (Mobile-friendly) Download it for FREE and start sharing the most relevant metrics with your teams.
Automate your marketing reporting with our free, white-label e-commerce report templates on Google Looker Studio. Used by +10,000 marketing teams and agencies in 60 countries.
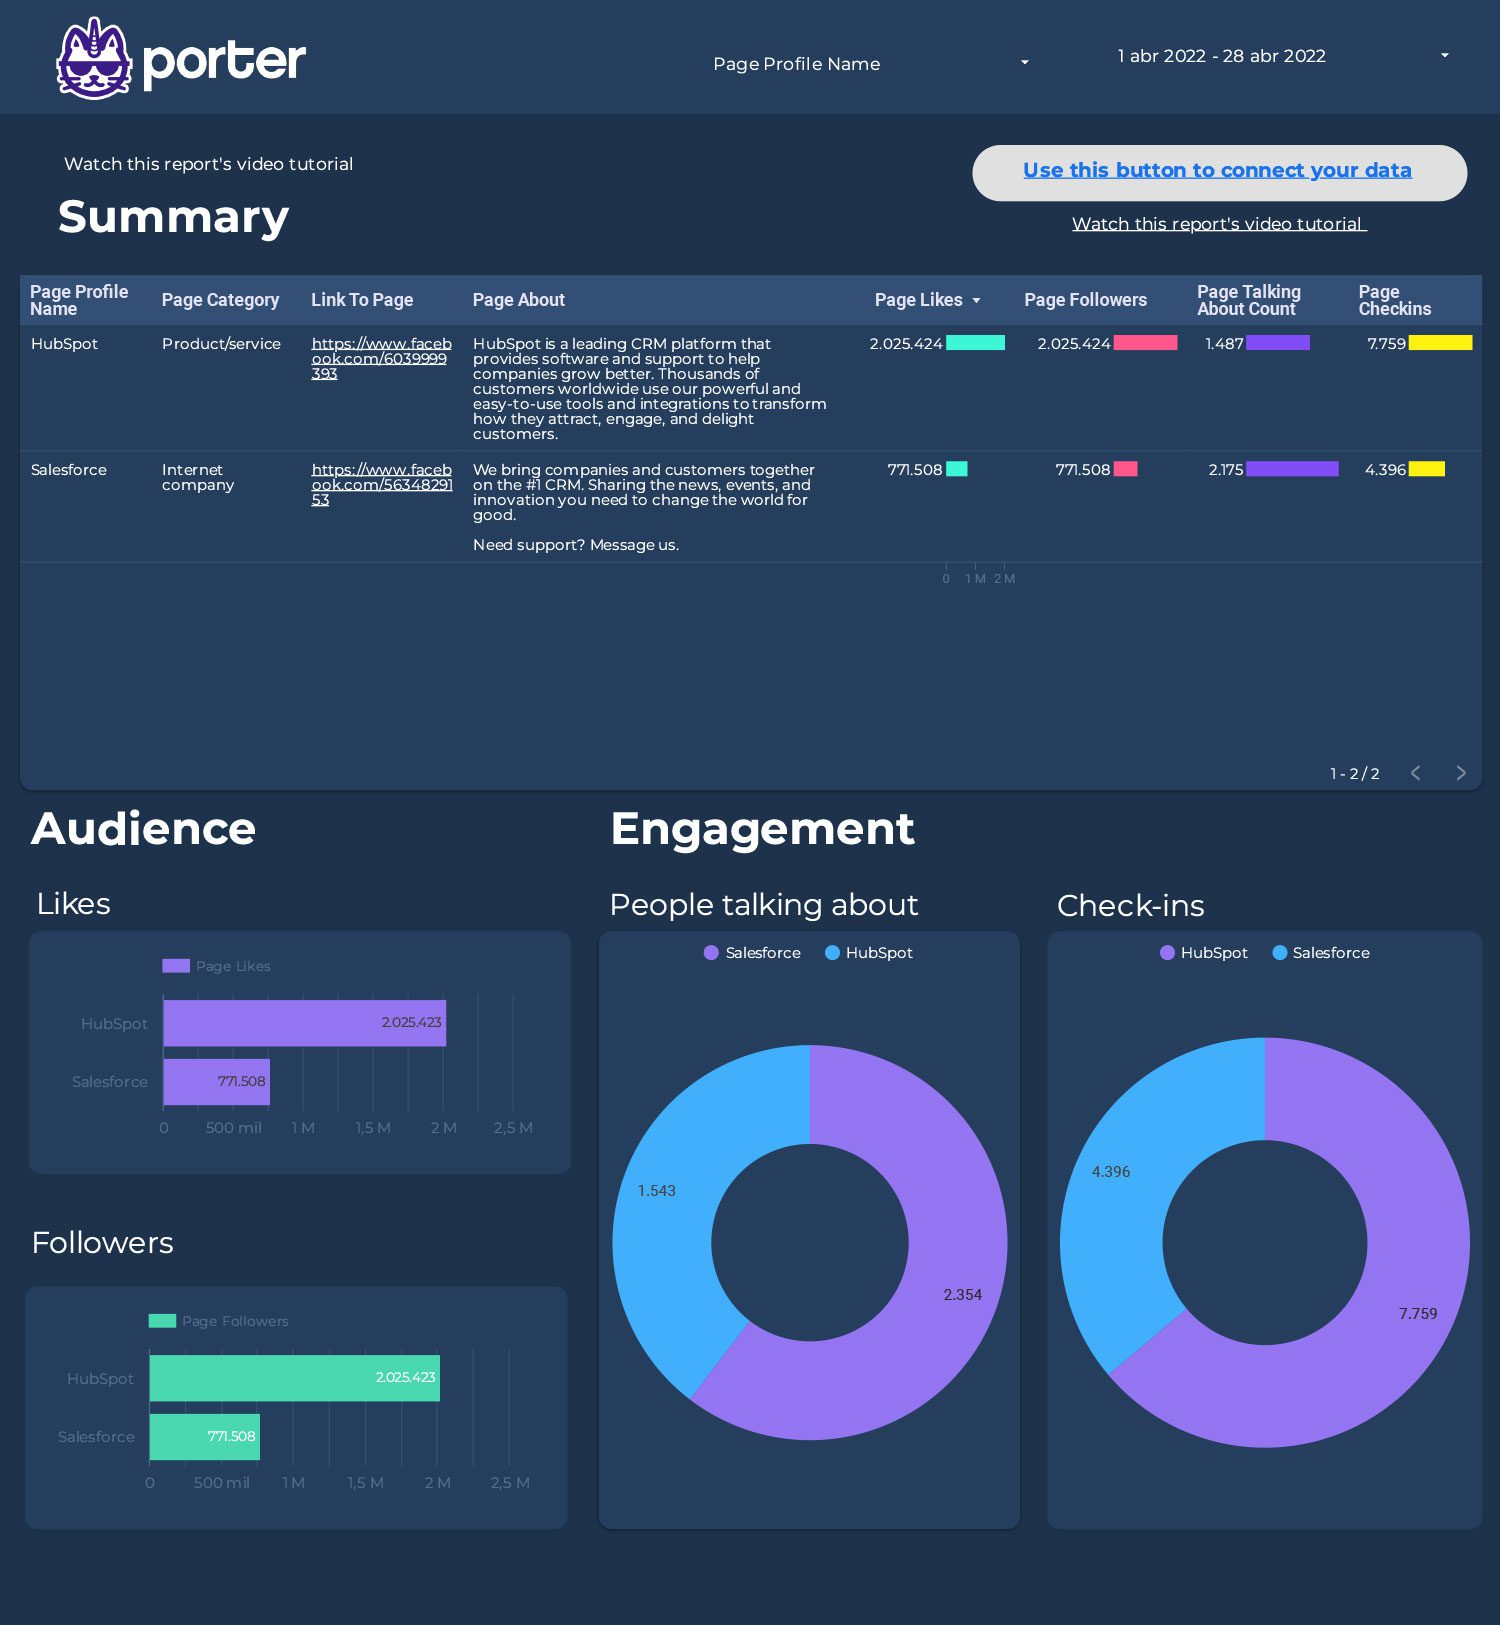
Download this visualization to track your competitors’ Facebook Pages. Pull and visualize data all for FREE with our Porter Facebook Competitors connector.
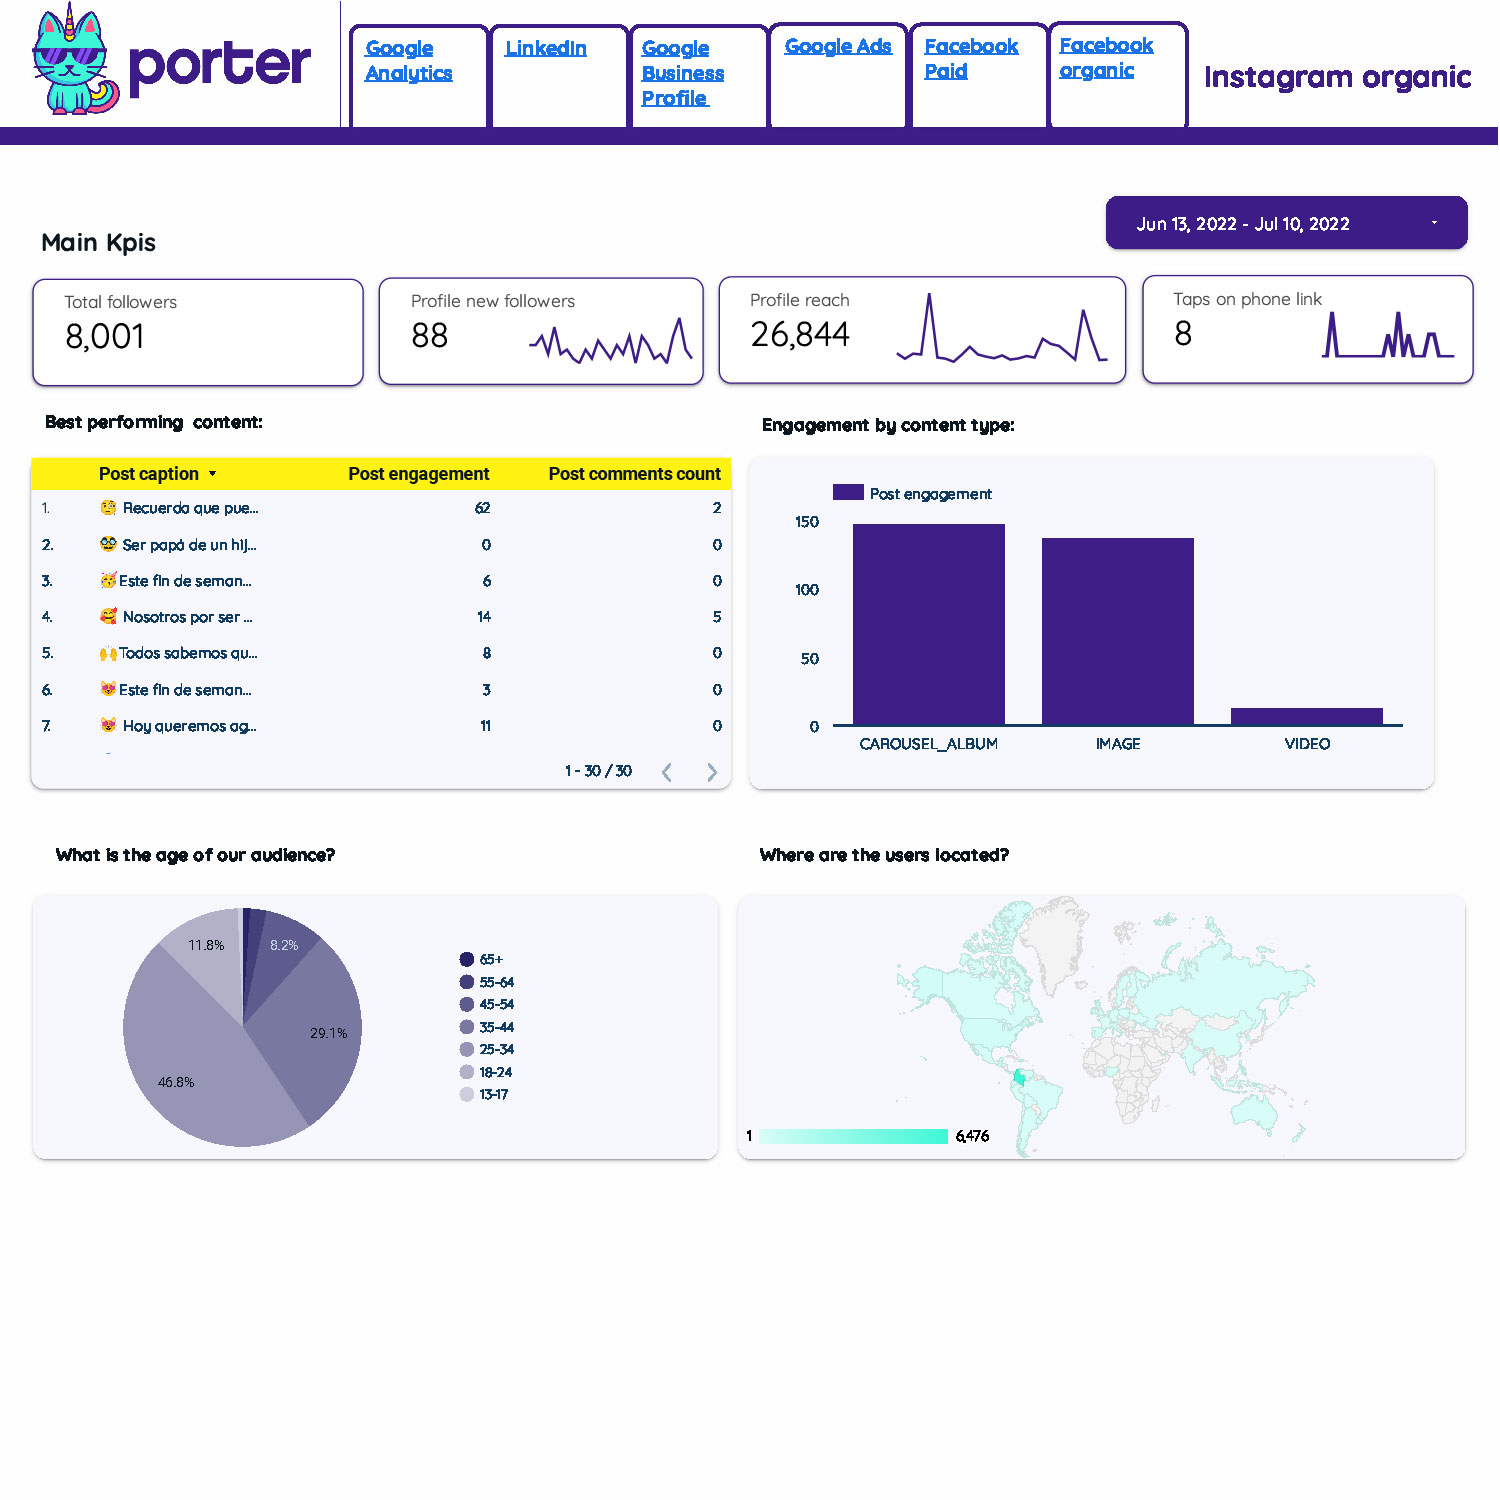
This Multi-platform report template automatically pulls data from Google Analytics, Google Ads, Google Business, FB Ads, and IG Insights. Deliver insightful client reports using our trusted Porter Metrics connectors.
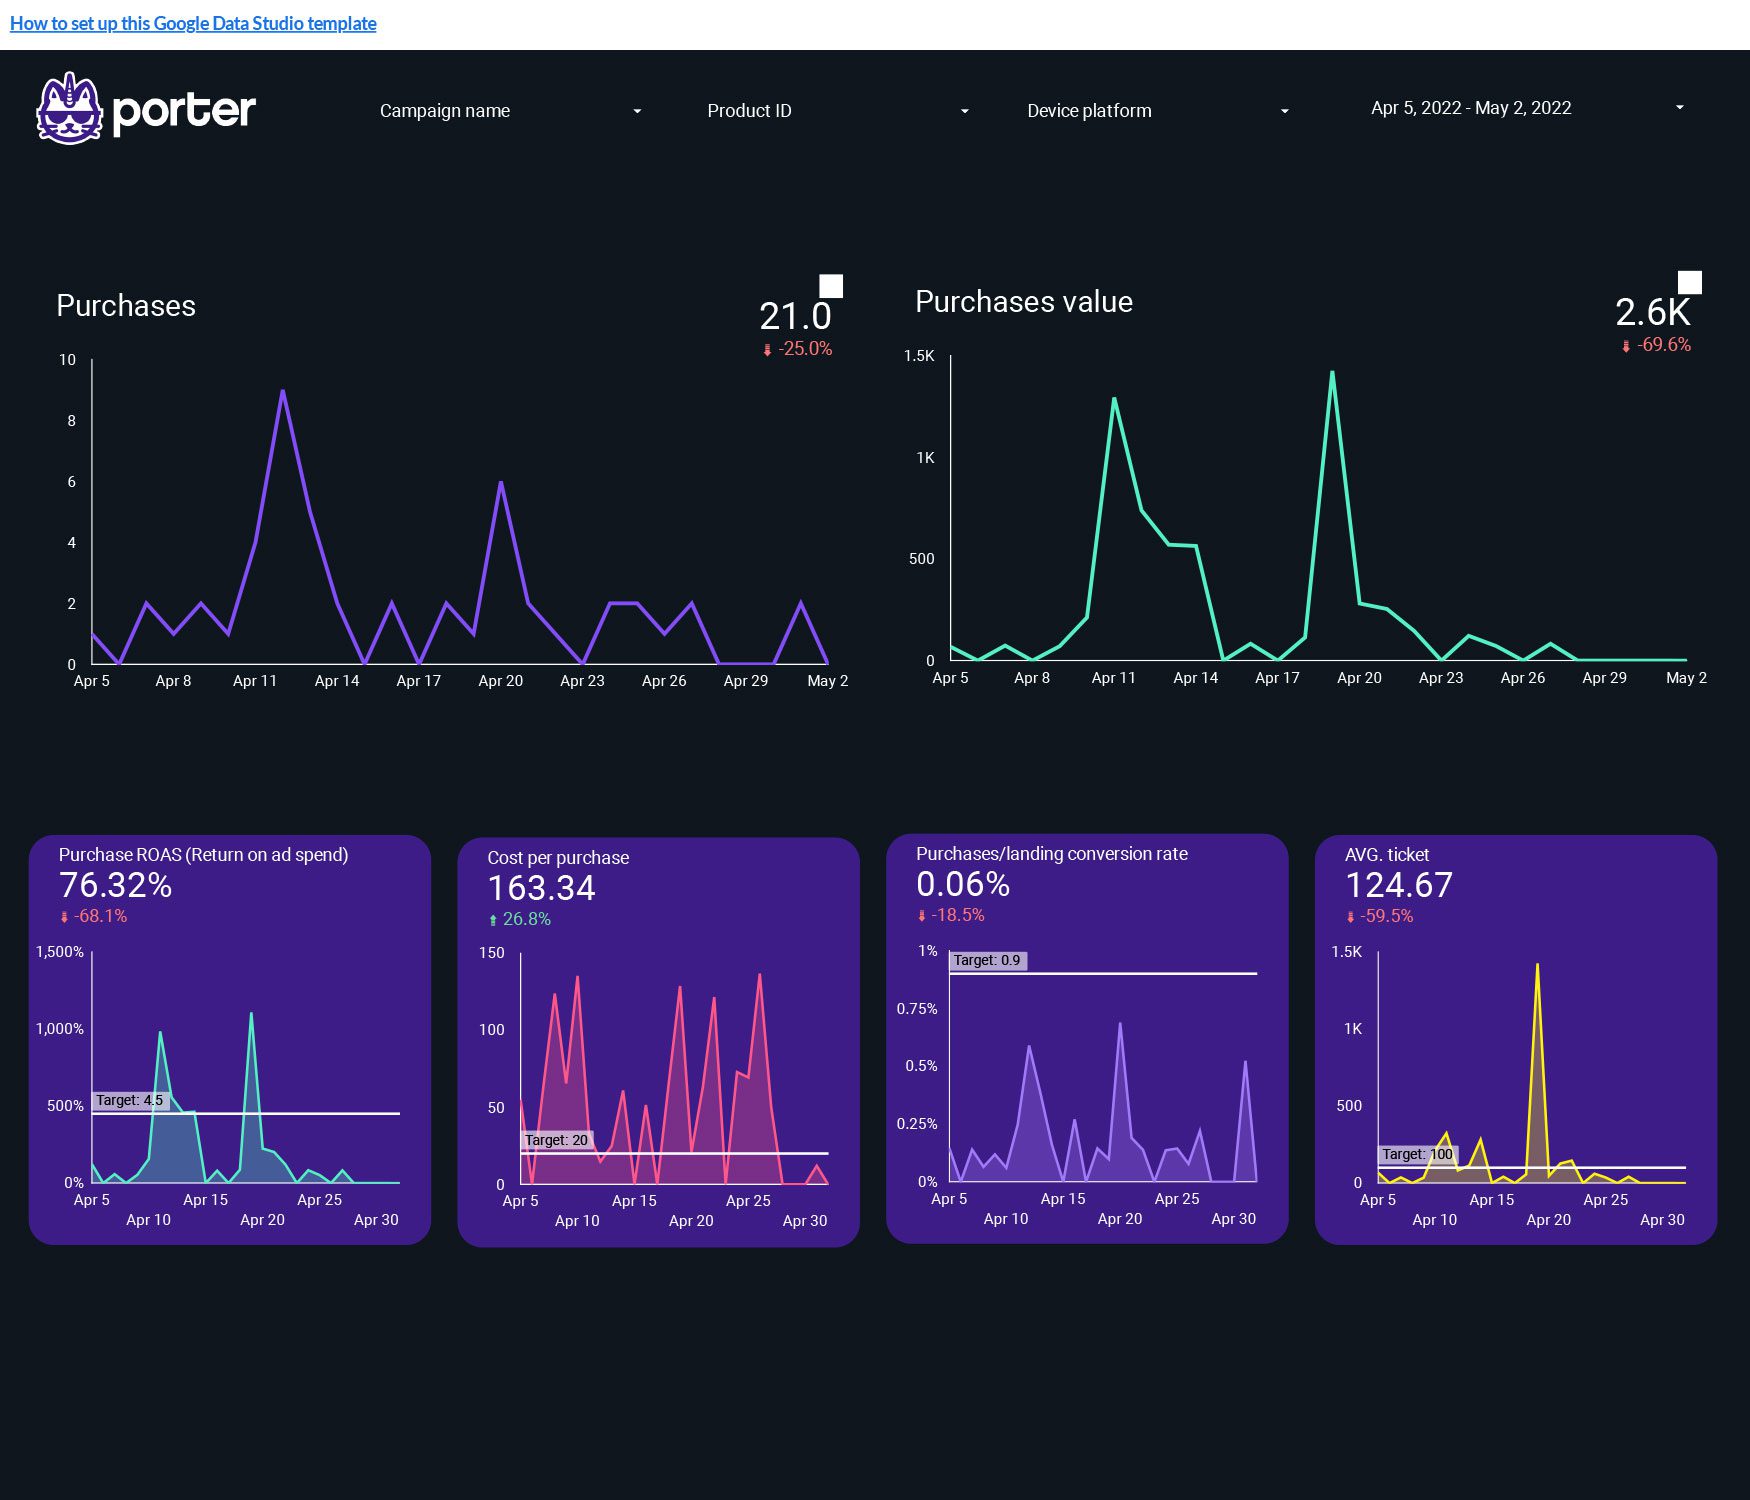
Track the main Facebook Ads e-commerce Key Performance Indicators.
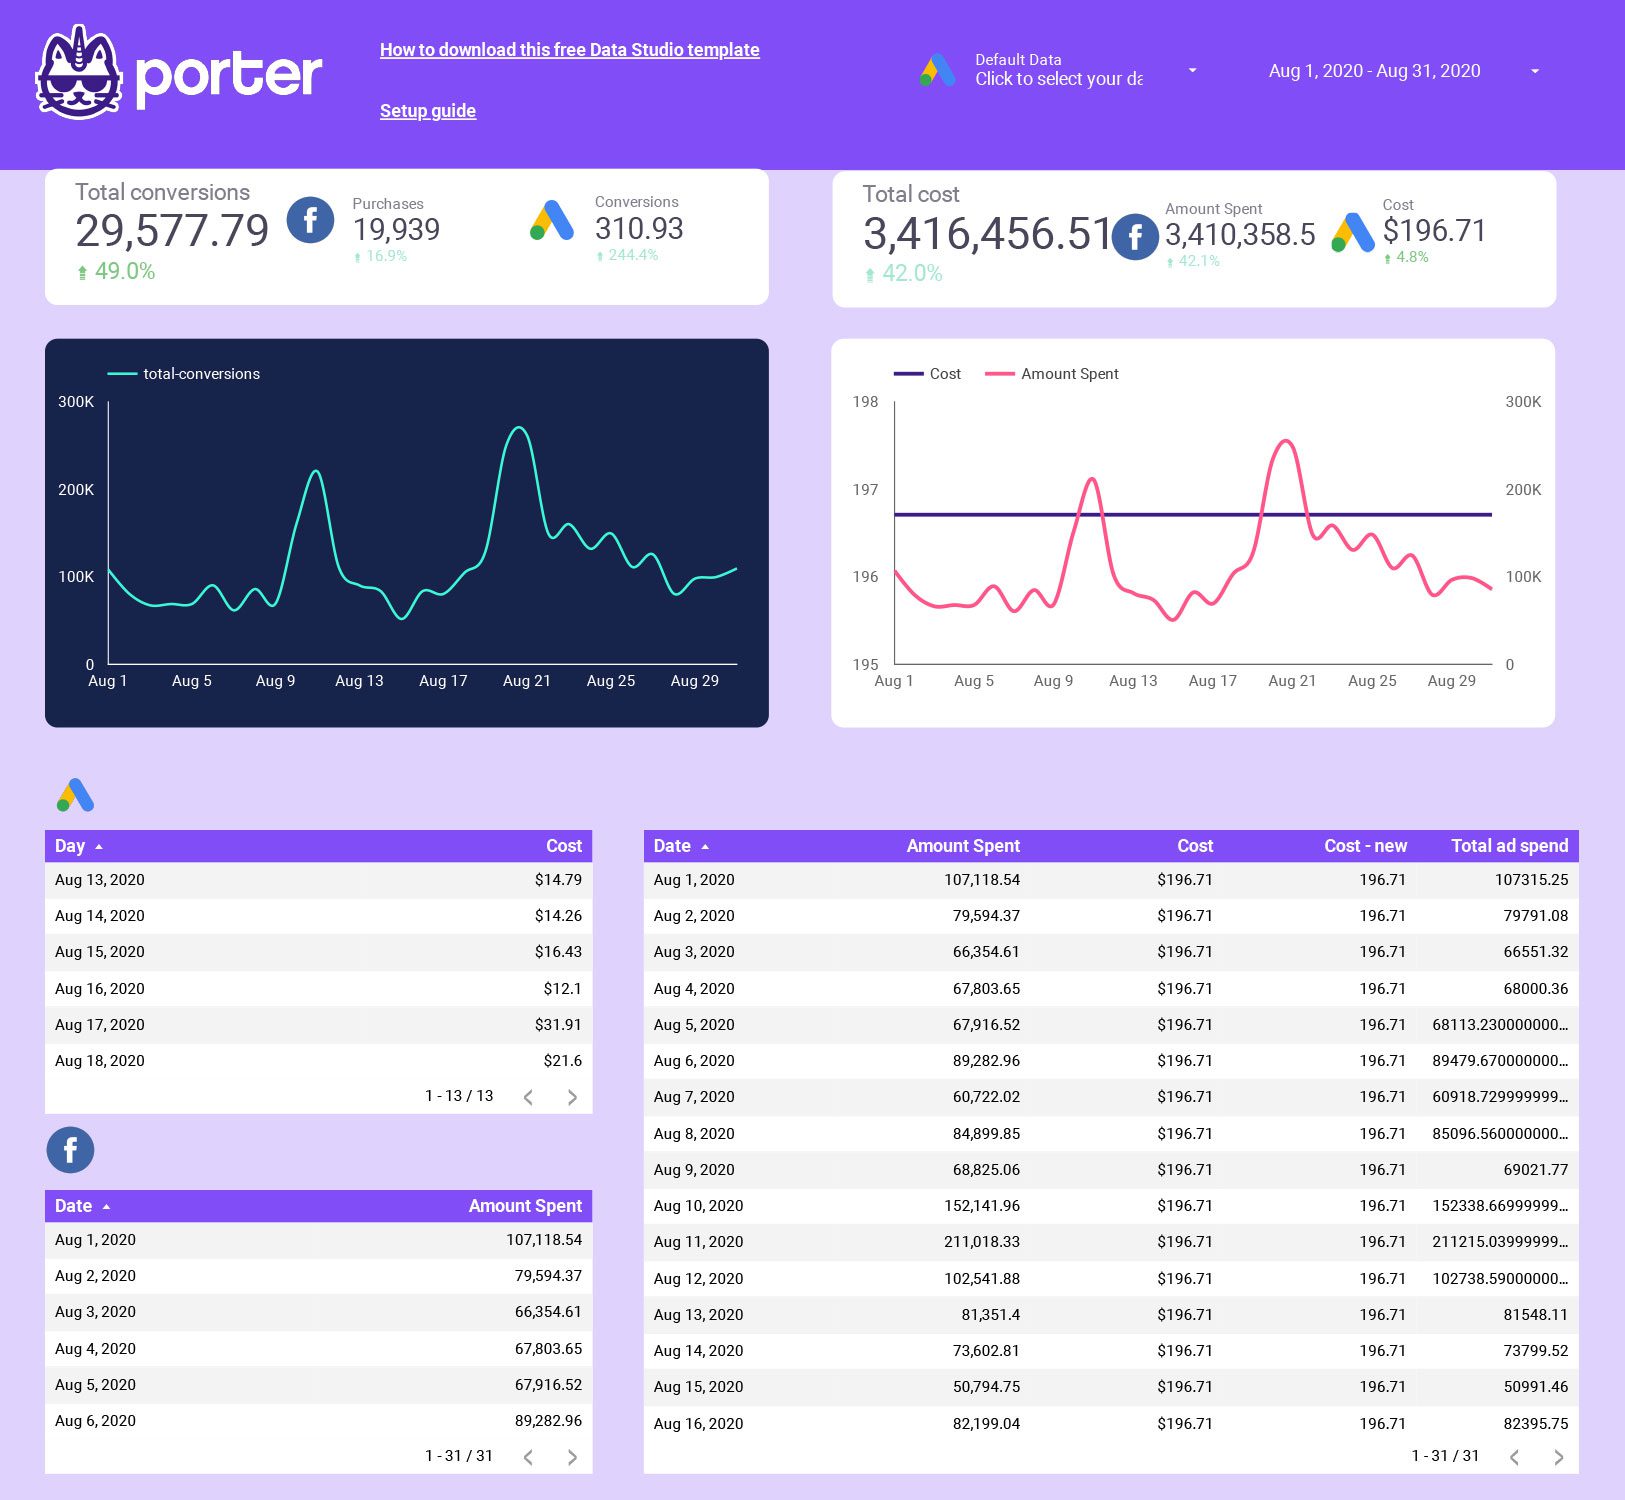
The value of Business Intelligence is gathering all your data in one place.
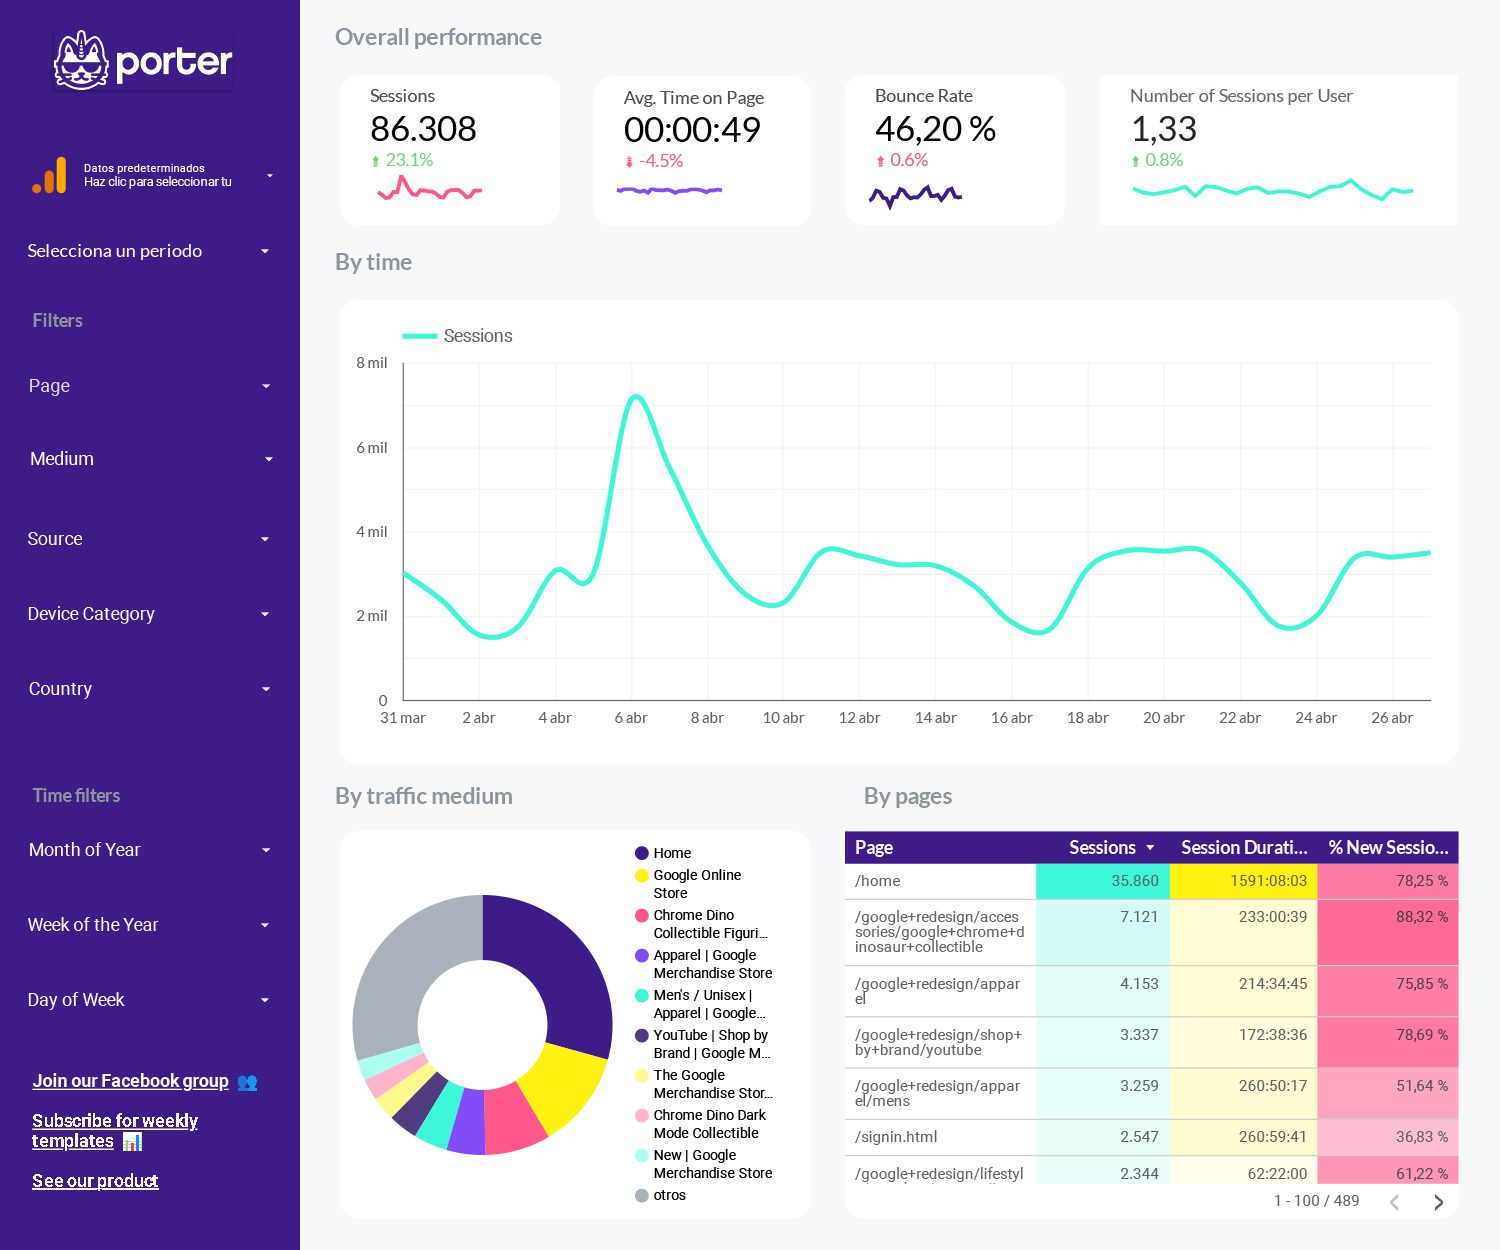
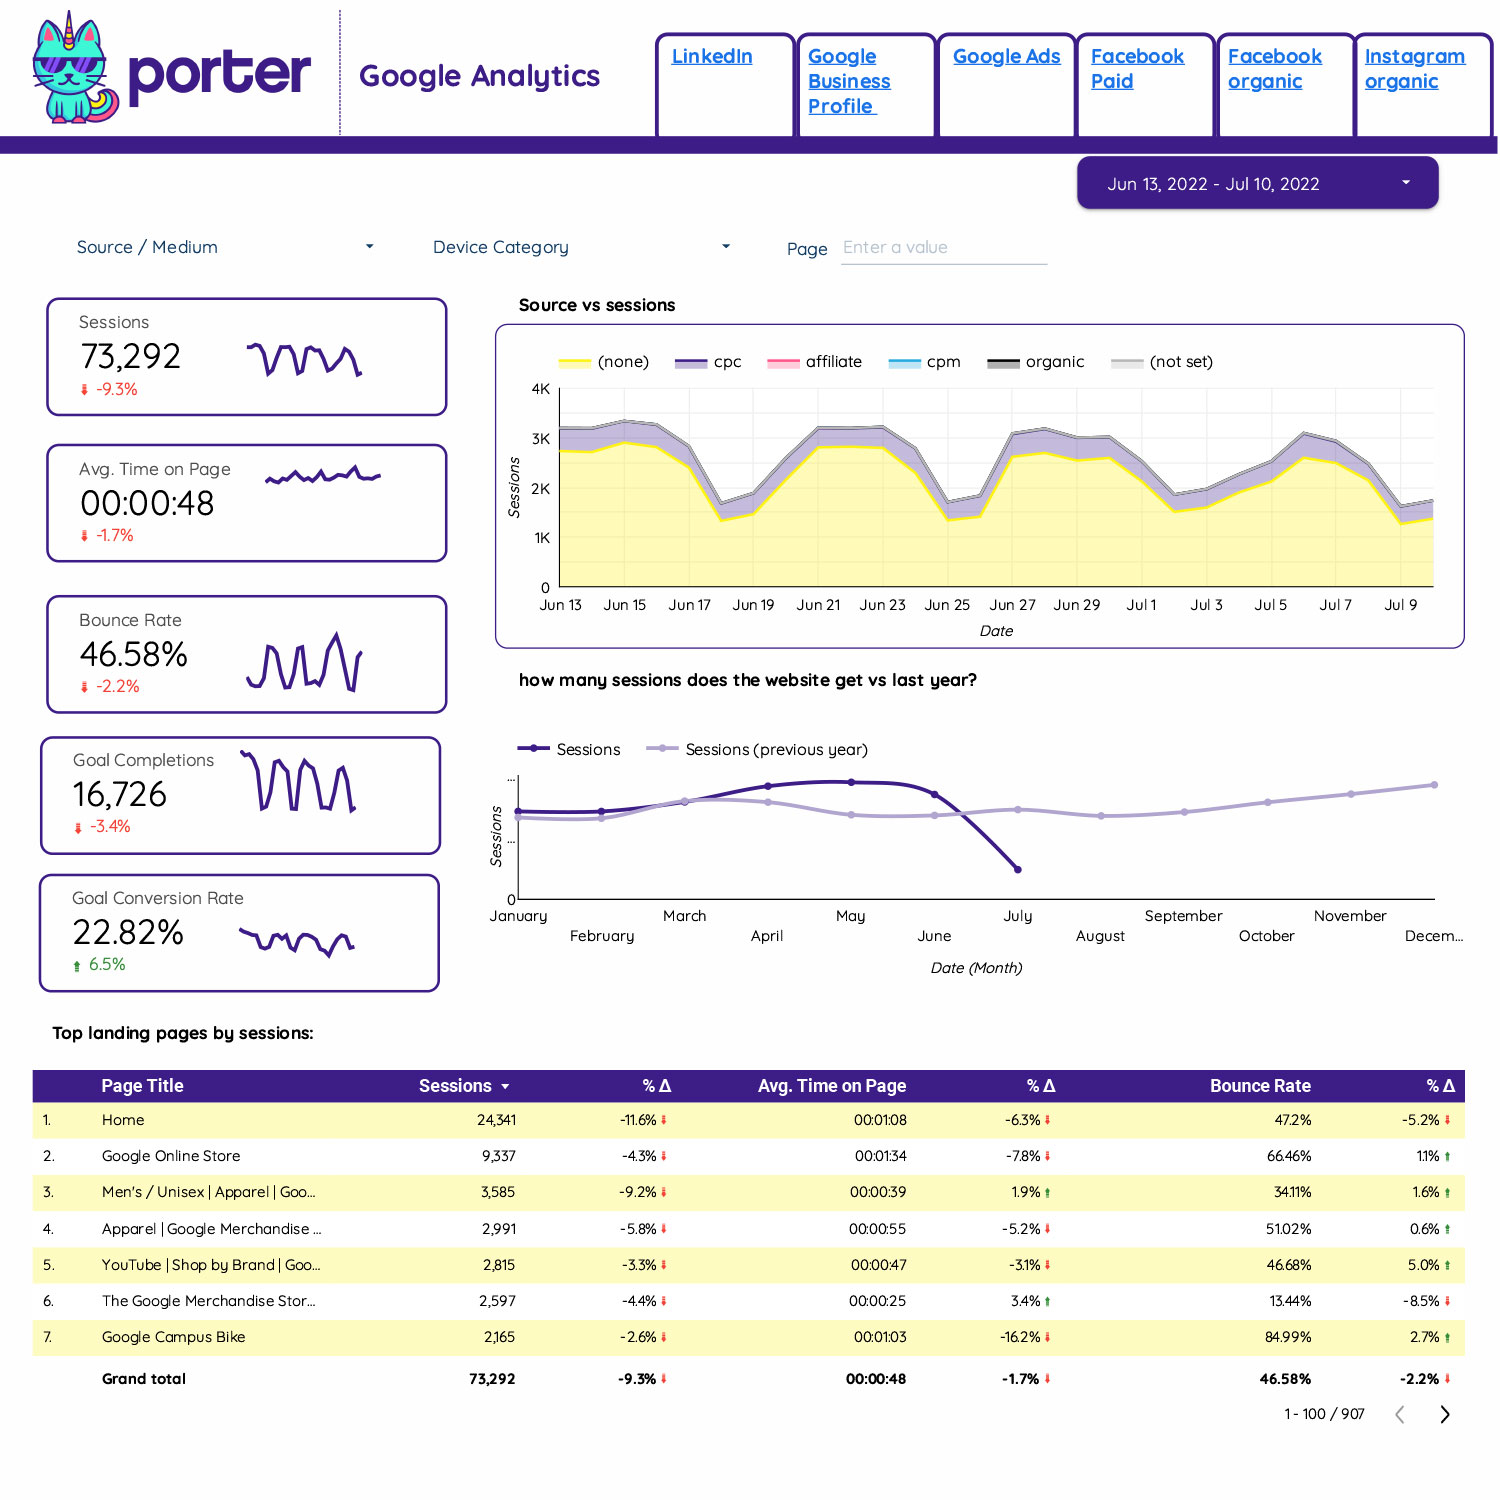
Measure your website content performance with Google Analytics behavior metrics.
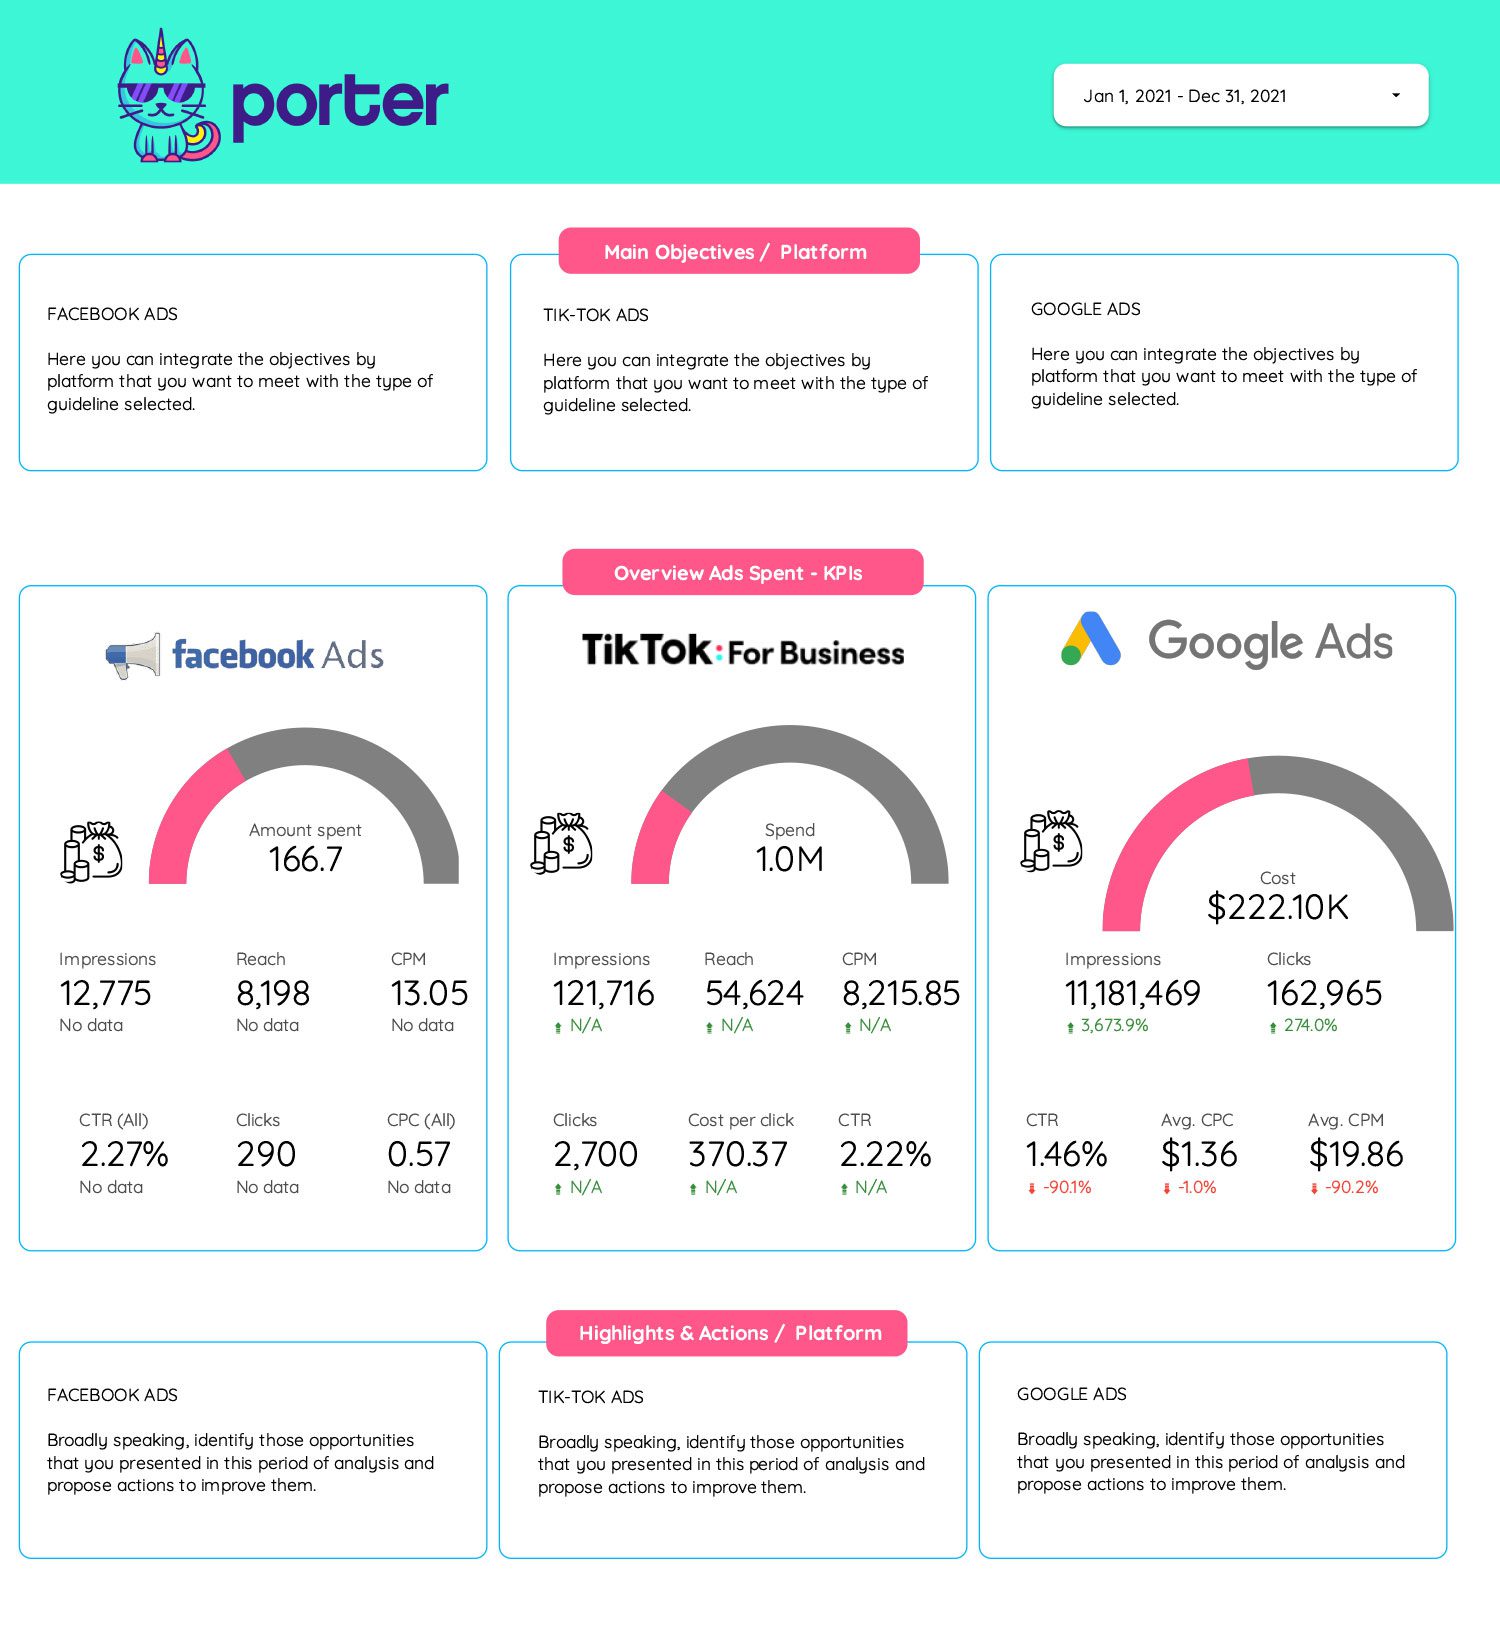
This integrated dashboard pulls your data from different paid media platforms such as Facebook Ads, Google Ads, Tiktok Ads, and Twitter ads. Track your website traffic performance and start distributing your budgets more efficiently.
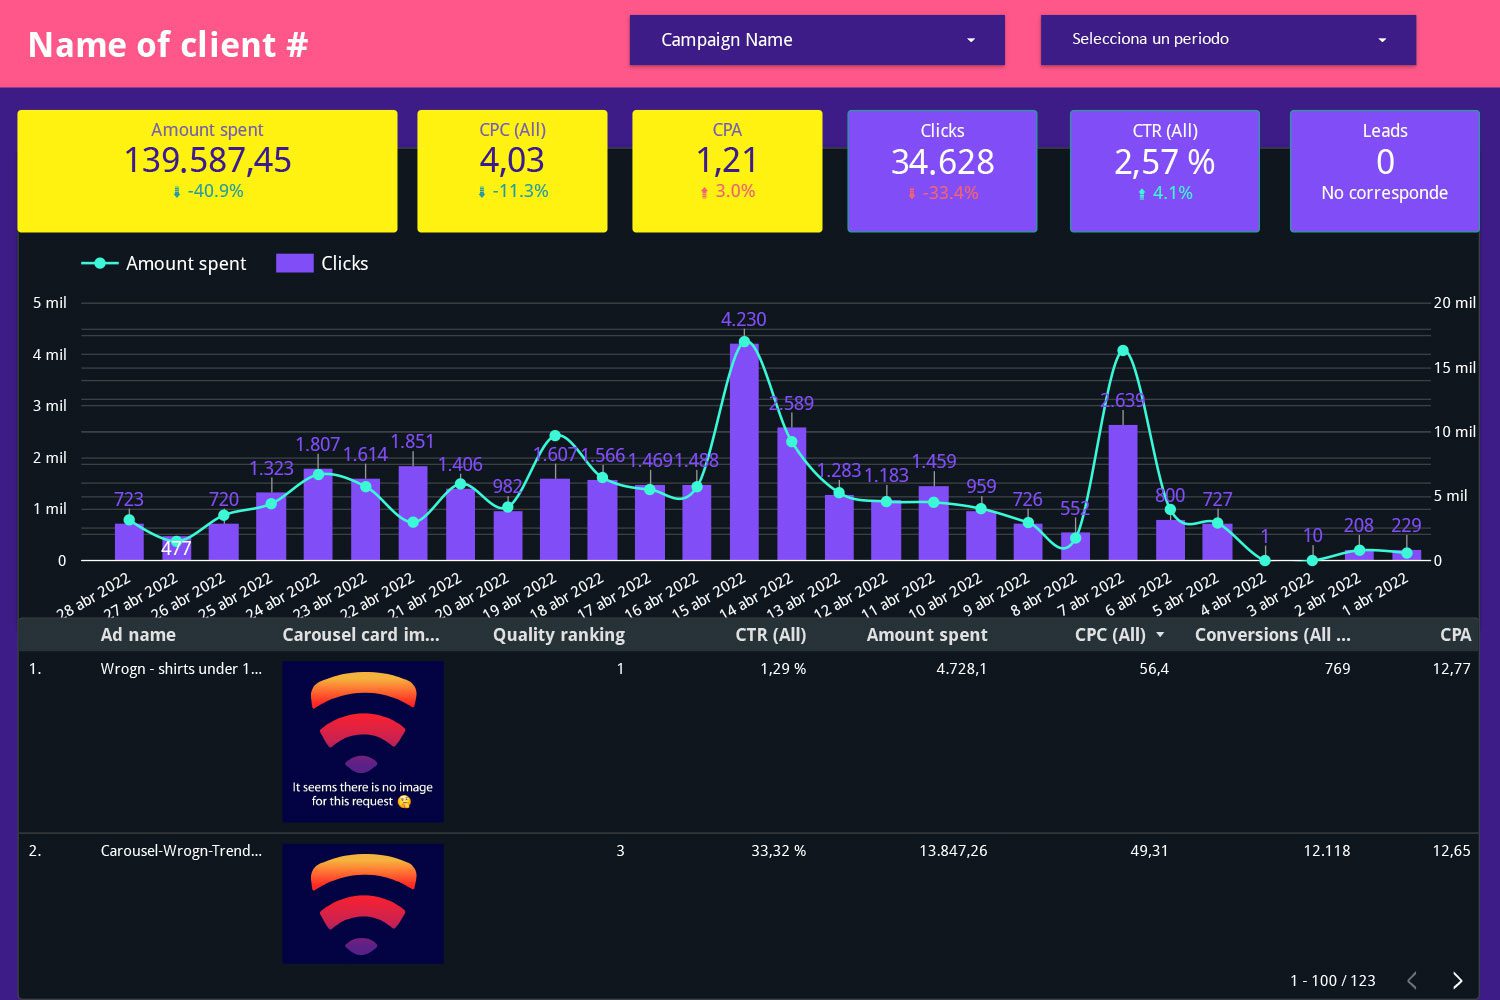
The PPC report will help marketers understand how Pay-Per-Click campaigns are performing. Download it for FREE.