A Facebook Ads Attribution report should include the following elements:
1. Campaign Name
2. Ad Set Name
3. Ad Name
4. Date
5. Impressions
6. Clicks
7. Ad Spend
8. Conversions
9. CTR (Click-Through Rate)
10. CPC (Cost Per Click)
11. CPM (Cost Per Thousand Impressions)
12. ROAS (Return on Ad Spend)
13. Reach
14. Frequency
15. Video Views
16. Page Likes
17. Post Engagement
18. Age
19. Gender
20. Location
These metrics and dimensions help in understanding the performance and effectiveness of Facebook Ads campaigns.
To analyze Facebook Ads Attribution data, follow these steps:
1. **Collect Data**: Gather data on key metrics such as Impressions, Clicks, Ad Spend, Conversions, CTR, CPC, CPM, ROAS, Reach, and Frequency.
2. **Segment Data**: Break down the data by Campaign Name, Ad Set Name, Ad Name, Date, Age, Gender, and Location to understand performance across different segments.
3. **Evaluate Performance**: Analyze metrics like CTR, CPC, and CPM to assess the efficiency of your ads. High CTR and low CPC/CPM indicate effective ads.
4. **Measure Conversions and ROAS**: Focus on Conversions and ROAS to determine the return on your ad spend. A high ROAS indicates a successful campaign.
5. **Identify Trends**: Look for patterns over time by analyzing data by Date. This helps in understanding seasonal trends or the impact of specific events.
6. **Optimize Campaigns**: Use insights from the analysis to optimize targeting, ad creatives, and budget allocation for better performance.
7. **Test and Iterate**: Continuously test different ad variations and strategies to improve results based on the data insights.
By systematically analyzing these aspects, you can make informed decisions to enhance the effectiveness of your Facebook Ads campaigns.
To build a Facebook Ads Attribution dashboard, follow these steps:
1. **Data Collection**: Gather data from Facebook Ads Manager, focusing on key metrics such as Impressions, Clicks, Ad Spend, Conversions, CTR, CPC, CPM, ROAS, Reach, Frequency, Video Views, Page Likes, and Post Engagement. Ensure you also collect data on Campaign Name, Ad Set Name, Ad Name, Date, Age, Gender, and Location.
2. **Data Integration**: Use a data integration tool or platform to import this data into a dashboard tool. Popular tools include Google Data Studio, Tableau, or Power BI.
3. **Data Visualization**: Create visualizations for each metric. For example, use line charts for trends over time, bar charts for comparisons, and pie charts for distribution analysis.
4. **Attribution Modeling**: Implement attribution models to understand the contribution of each ad to conversions. Common models include last-click, first-click, and linear attribution.
5. **Dashboard Design**: Organize the dashboard to provide a clear overview of performance. Include filters for date ranges, demographics, and locations to allow for detailed analysis.
6. **Testing and Iteration**: Test the dashboard with stakeholders to ensure it meets their needs and make adjustments based on feedback.
7. **Automation**: Set up automated data refreshes to keep the dashboard up-to-date with the latest data from Facebook Ads.
By following these steps, you can create a comprehensive Facebook Ads Attribution dashboard that provides valuable insights into your advertising performance.
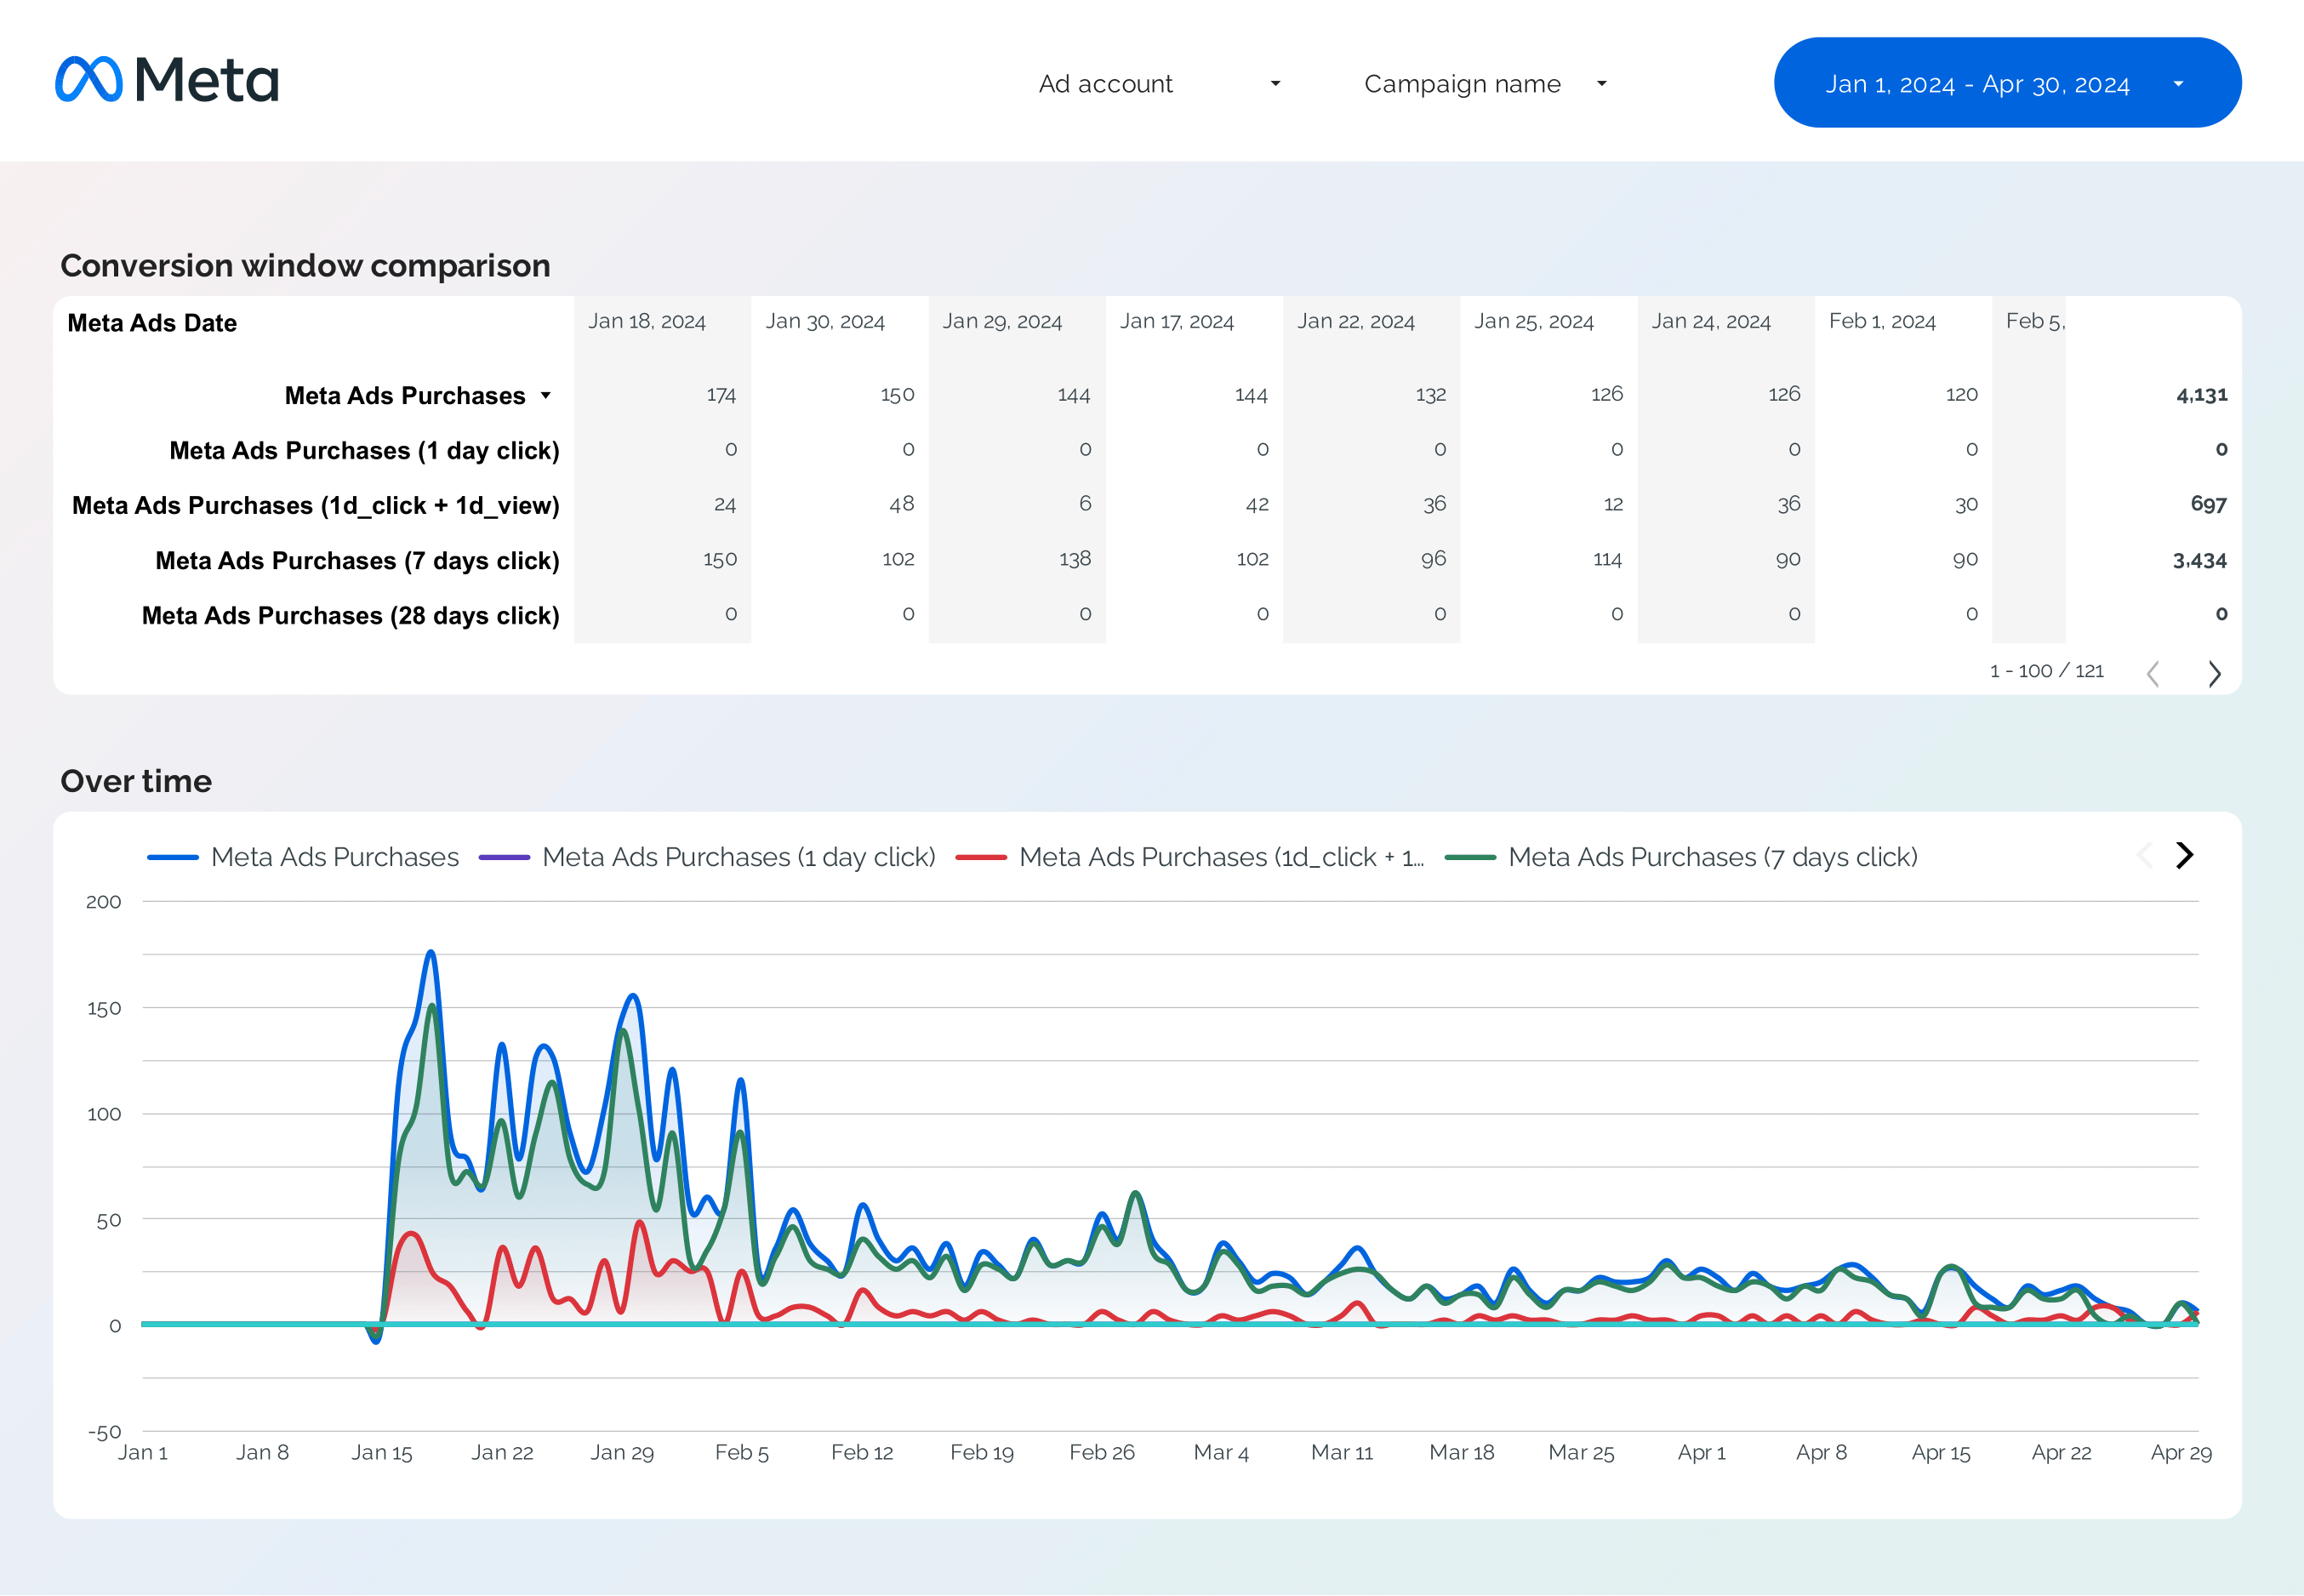
A Facebook Ads Attribution dashboard is a tool that helps advertisers track and analyze the performance of their Facebook ad campaigns. It provides insights into how different ads contribute to conversions and other key performance indicators (KPIs) such as impressions, clicks, ad spend, conversions, and return on ad spend (ROAS). The dashboard typically includes metrics like CTR (click-through rate), CPC (cost per click), CPM (cost per thousand impressions), reach, frequency, and engagement metrics like video views and page likes. It allows advertisers to understand the effectiveness of their campaigns and optimize their strategies for better results.
I don’t know if you can download the template in PDF format based on the provided context.
 Facebook Ads
 Impressions

