


A KPI helps you determine the success of your strategy based on the main objective.
A KPI is usually calculated with two or more metrics, such as costs or people reached, to measure effectiveness or determine your campaign performance in a specific timeframe.
After reading this article, you will master the art of KPIs visualization on Social Media and e-commerce reports.
You will be able to create a report integrating the more relevant metrics to determine the success of your strategy or even use a free template for Google Data Studio to simplify your reporting.
Check out our free templates gallery

What is a good KPI?
A KPI should be simple, and easy to measure. According to the Business Analytics: An Introduction book’s author, Jay Liebowitz, an effective KPI is one that “prompts decisions, not additional questions.” For example, “How many customers did we add this quarter?” is clear and simple. (2013)
How to set my strategy KPIs
- Identify your brand or company’s strategic objectives.
- Define the criteria for success and share it with your team
- Develop key performance questions.
Do you want to increase brand awareness? Drive more traffic to your website? Get more people to sign up for your newsletter.
These are called objectives, and the KPIs are just performance indicators that can be calculated with different metrics available on different platforms.
Then collect your data and determine the availability according to your tracking data sources.
You can prioritize your KPIs and the metrics close to your business goals, then cascade to the metrics that explain such performance.
Set goals for your KPIs
Before analyzing your data, it’s essential to set goals. What are you hoping to achieve with your Facebook Ads, TikTok Ads, and Twitter Ads?
Or even organic content on Facebook, LinkedIn, or Instagram, is helping you to get to your business’s primary objective achievement?
If you want to increase brand awareness, you might look at metrics like reach and impressions.
E.g., If your campaign aims to measure the success of your investment per audience reached, your KPI will be CPM.
Cost / 1000 Impressions =CPM
If your goal is to get more people to sign up for your newsletter, you may look at the conversion rate or CTR.
Total Clicks or Total Link clicks / People Reached *100 = CTR%
Determine what to measure and how frequently you should measure.
And then, develop your KPIs, keep an eye on them and notify your team when you identify a relevant insight that can be useful for the track of your strategy.
Social Media KPIs:
The Key Performance Indicators or KPIs are the DNA of your Social Media. The KPIs are trackable, achievable, and time-related. For that reason are also comparables.
As you define your social media strategy, you know the performance indicators you will track to determine your strategy’s success.
How to set Social Media KPIs
Once you have a goal in mind, you can start to look at relevant KPIs for your Social Media, Ecommerce, or Digital marketing strategy.
That will help you understand how your ads, pieces of content, or overall efforts are performing and whether or not they’re meeting your goals.
I like to understand KPIs divided into two categories. One is the industry-established KPIs and owned KPIs.
Industry established KPIs
The Industry established KPIs are those that you probably know and relate to your business to compare your revenues and benchmarks.
This category of KIPs is well known by marketers who need to have a readable report. Your team must be familiar with those calculations and what they tell us.
As a quick example, the Click-Through rate is “the number of clicks users made” on a post, but it can also be an indicator due to its combination with the metric Rech that determines the percentage of those users who saw the post.
Here you interpret how many users were interested in your content to give you a click.
So it is simple. We have two metrics (Clicks) and (Reach), but without any context, the easiest way to read them is when you can calculate something that indicates the performance of your piece of content.
Now you have a Consideration KPI.
Owned KPIs
On the other hand, you have calculated and owned KPIs more aligned with your own business goal.
For example, e-commerces tend to use their own calculations to determine an Average Ticket per customer (Total purchase or transaction cost * total customers/total sales in a determined time ) or even recurrent purchases per customer.
The calculations depend on what matters the most for a company or business.
Can a regular metric of the platform be a KPI itself?
Before answering this question, remember that every KPI is a metric, but not every metric is a KPI. Metrics without any context are probably the ones you should avoid when considering them as a KPI.
But what about when those metrics do have a context? It is the case of the metric: Reach as an indicator.
The indicator could be: reached users in a month or just the regular Page Reach when talking about Facebook.
As an example, the Page Reach for this page is 54M, but it was 44% lower compared to the previous month:
What can you say about this behavior? As an analyst is necessary you always interpret data and make your outcomes.
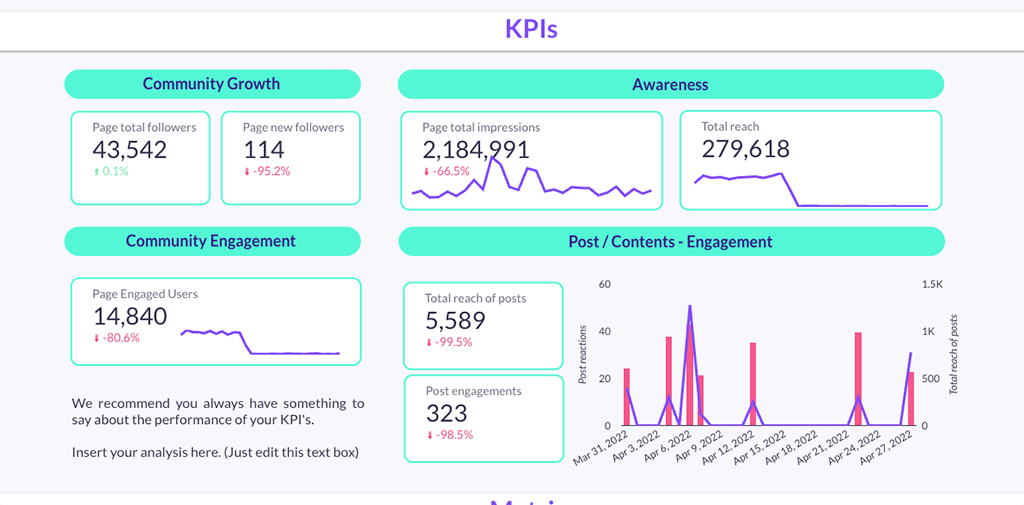
Some of the most common KPIs analysts track are:
- Community Growth:
Focusing on this number is ubiquitous because it can indicate changes in social media algorithms. - Reached audience:
This indicator is helpful when visualizing variation and differences considering time ranges. In addition, it is useful when you hypothesize about what type of content helps to achieve better your communication goals.
Now you see how a regular metric such as “Reach” or “Impressions” helped to write a story around the awareness of your content on a platform during a specific time?
How do you present KPI results?
The best way to present KPIs results is in a recurrent report. Whether you use an automated dashboard or present an executive report at a meeting, it is crucial to meet audience expectations.
I highly recommend you take the time to create a report request form AKA: brief, to simplify this process and be able to present the results your audience is looking for.
Take a piece of paper or a digital board and write down the metrics that matter the most for your business. If you have targets or goals, you can also jot them down.
Then when creating your report, you can compare your KPIs toward goals. If you’re not sure what metrics you need to include, don’t worry. Just think about what questions you would like your reports to answer.
Follow this article to understand more about the report creation process. Social Media Report on Google Data Studio.
Get 15 Days Porter Metrics Free Trial (worth $15)
Most common KPIs to include in your reports
Some of the KPIs you can use on your Social Media reports are:
- Conversion Rates
- Engagement Rates
- View-through rates
- Click-through rates
You determine the effectiveness of your content pieces or strategy by reading and tracking metrics that help you with some context.
Some important KPIs to look at when analyzing your Social Media Ads data include:
- Cost per click (CPC)
- Click-through rate (CTR)
- Conversion rate
- Cost per acquisition (CPA)
- ROAS
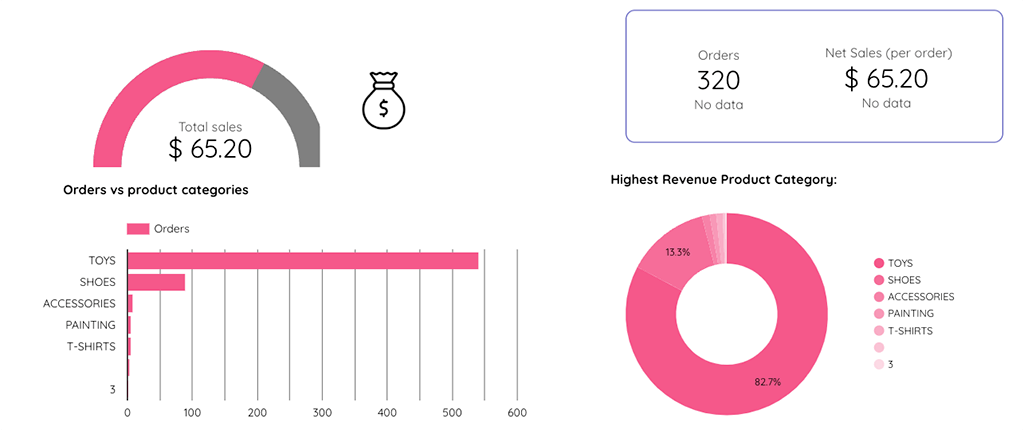
Some of the most common KPIs marketers include on Ecommerce reports are:
Conversion Rates
Net Sales
Net Profits
Customer Lifetime Value
Average Order Value (AOV)
As you can see, some of these are also metrics you can find on different platforms, especially if you measure conversions on Google Analytics or events on GA4.
Some of the KPIs you can track in platforms like Shopify or Woocommerce are:
- Total orders per day
- Average Order Value
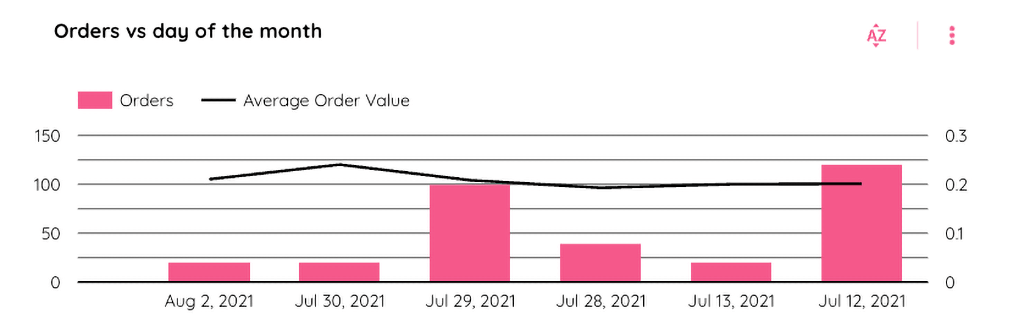
- Total Sales
- Net sales per order
Social Media KPIs report templates:
Once you understand how each KPI impacts your business goals, you can start developing hypotheses about what you need to do to improve your Social Media content and Ads performance.
For example, if you notice that your CPC is high, but your CTR is low. Then you may hypothesize that you need to create better ad copies or improve your images.
Download this free organic report template for Facebook Insights. With this executive report, you will give your audience a context of the metrics that are part of the main KPIs that helped to achieve a determined objective.
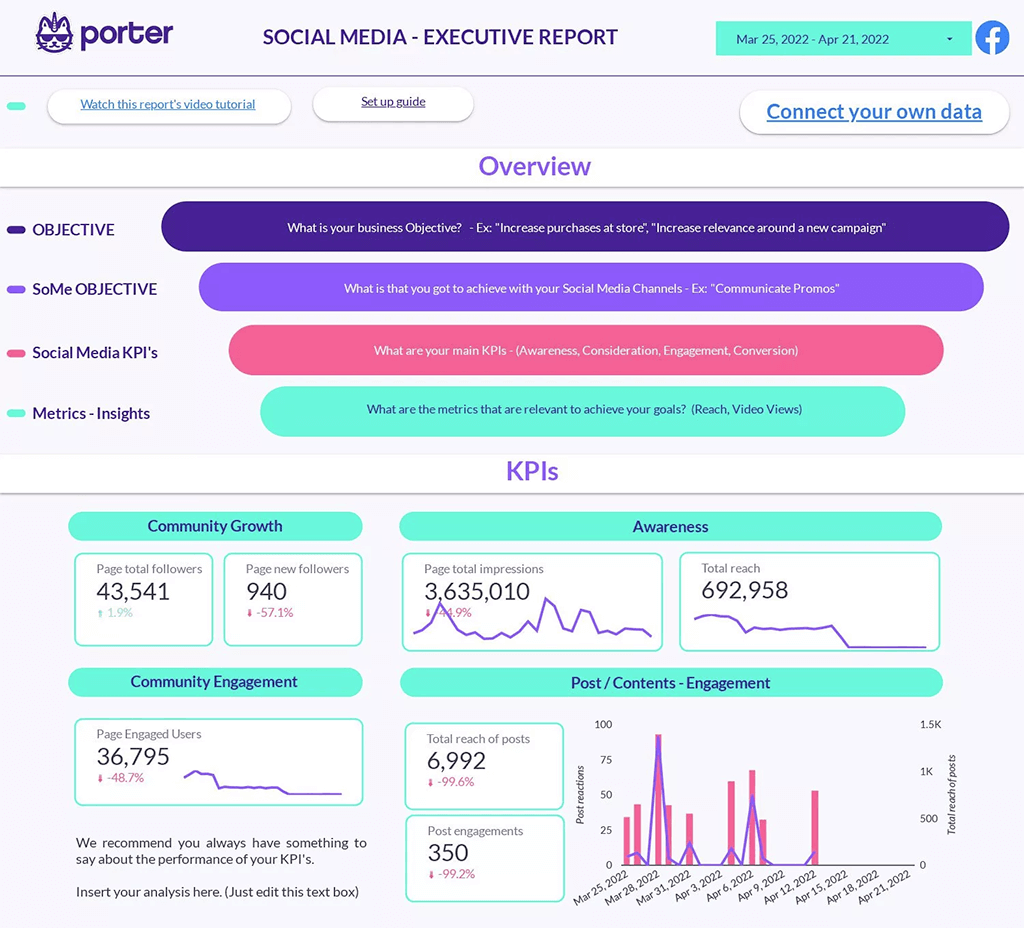
Get inspired with this video we’ve prepared for you to understand better how to visualize your KPIs where you have a paid or organic campaign.
Ecommerce KPIs report templates:
After you have identified the best KPIs to understand your marketing strategy, you will be able to visualize any analysis considering your main objective.
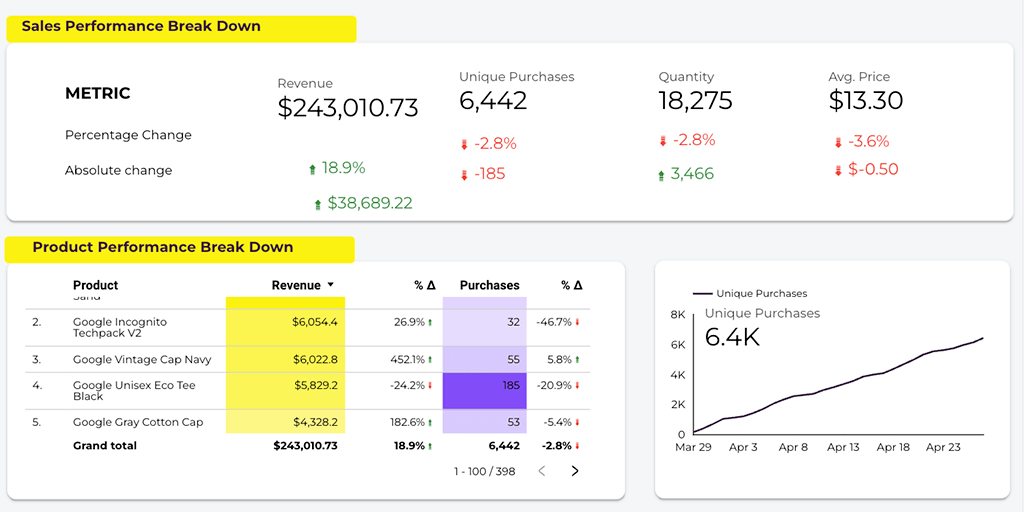
But if you need inspiration, you can find helpful the following template that integrates e-commerce, website, and social media KPIs in only one Data Studio Dashboard.
Agency complete Digital Marketing template (8 in 1) on Google Data Studio
Don’t forget to look at our Templates Gallery with more than 80 use cases to solve your reporting needs in less than a minute.
If you have any questions about how to visualize your KPIs in a Google Data Studio dashboard, feel free to contact us. We can set up your report for free!