


Free Google Data Studio report templates kit for agencies
Automate your client and agency reporting.
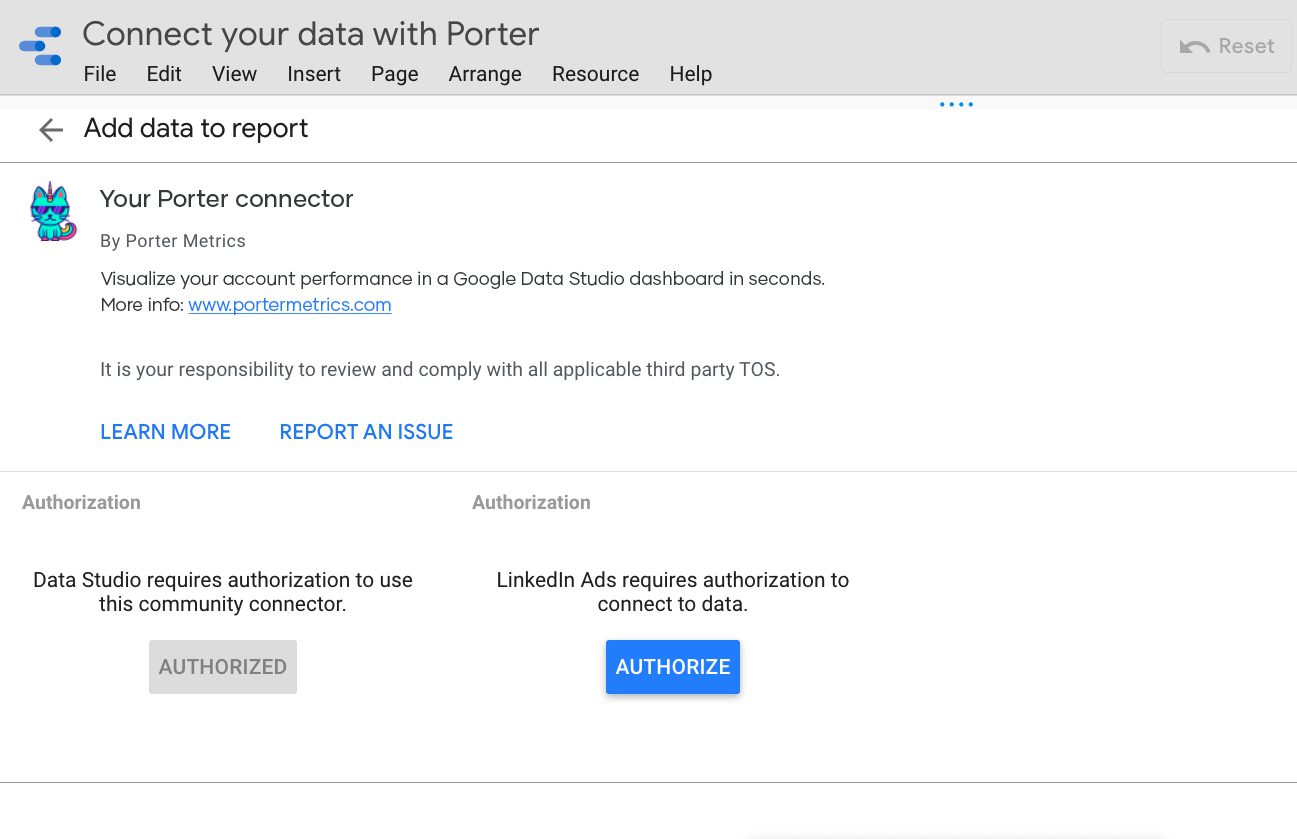
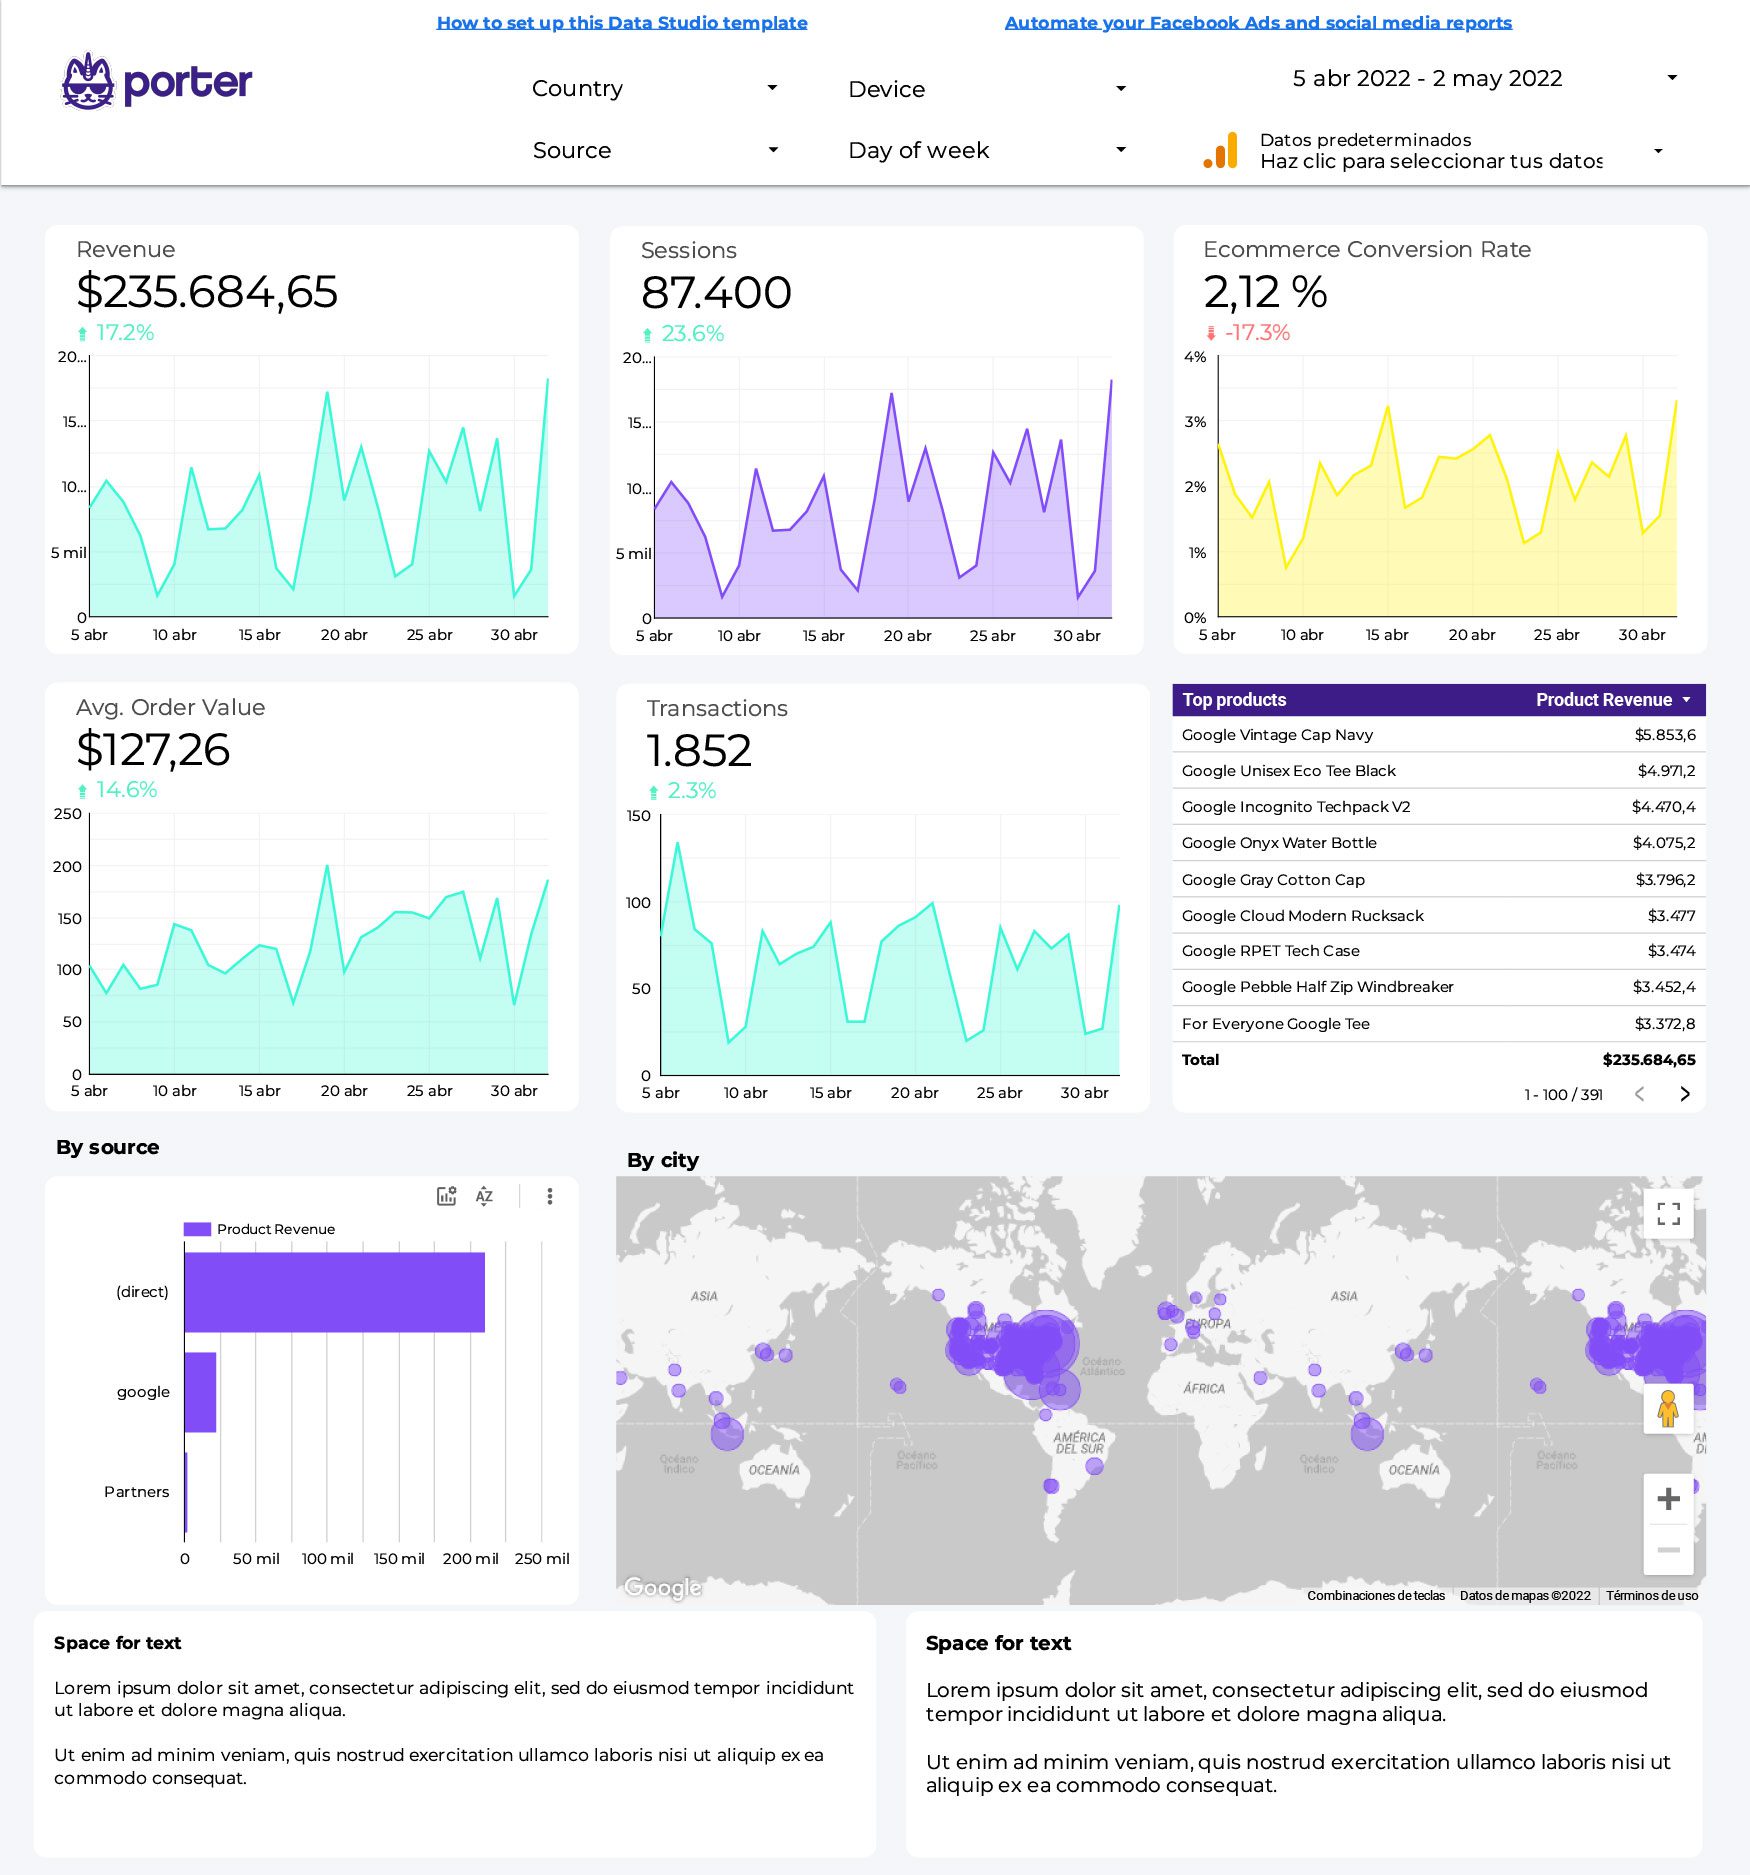
Google Analytics, Google Ads, Facebook Ads, Google Search Console, Instagram, and Youtube—all in a single report. It’s free

Automate your client and agency reporting.
Google Analytics, Google Ads, Facebook Ads, Google Search Console, Instagram, and Youtube—all in a single report. It’s free
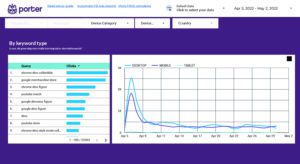
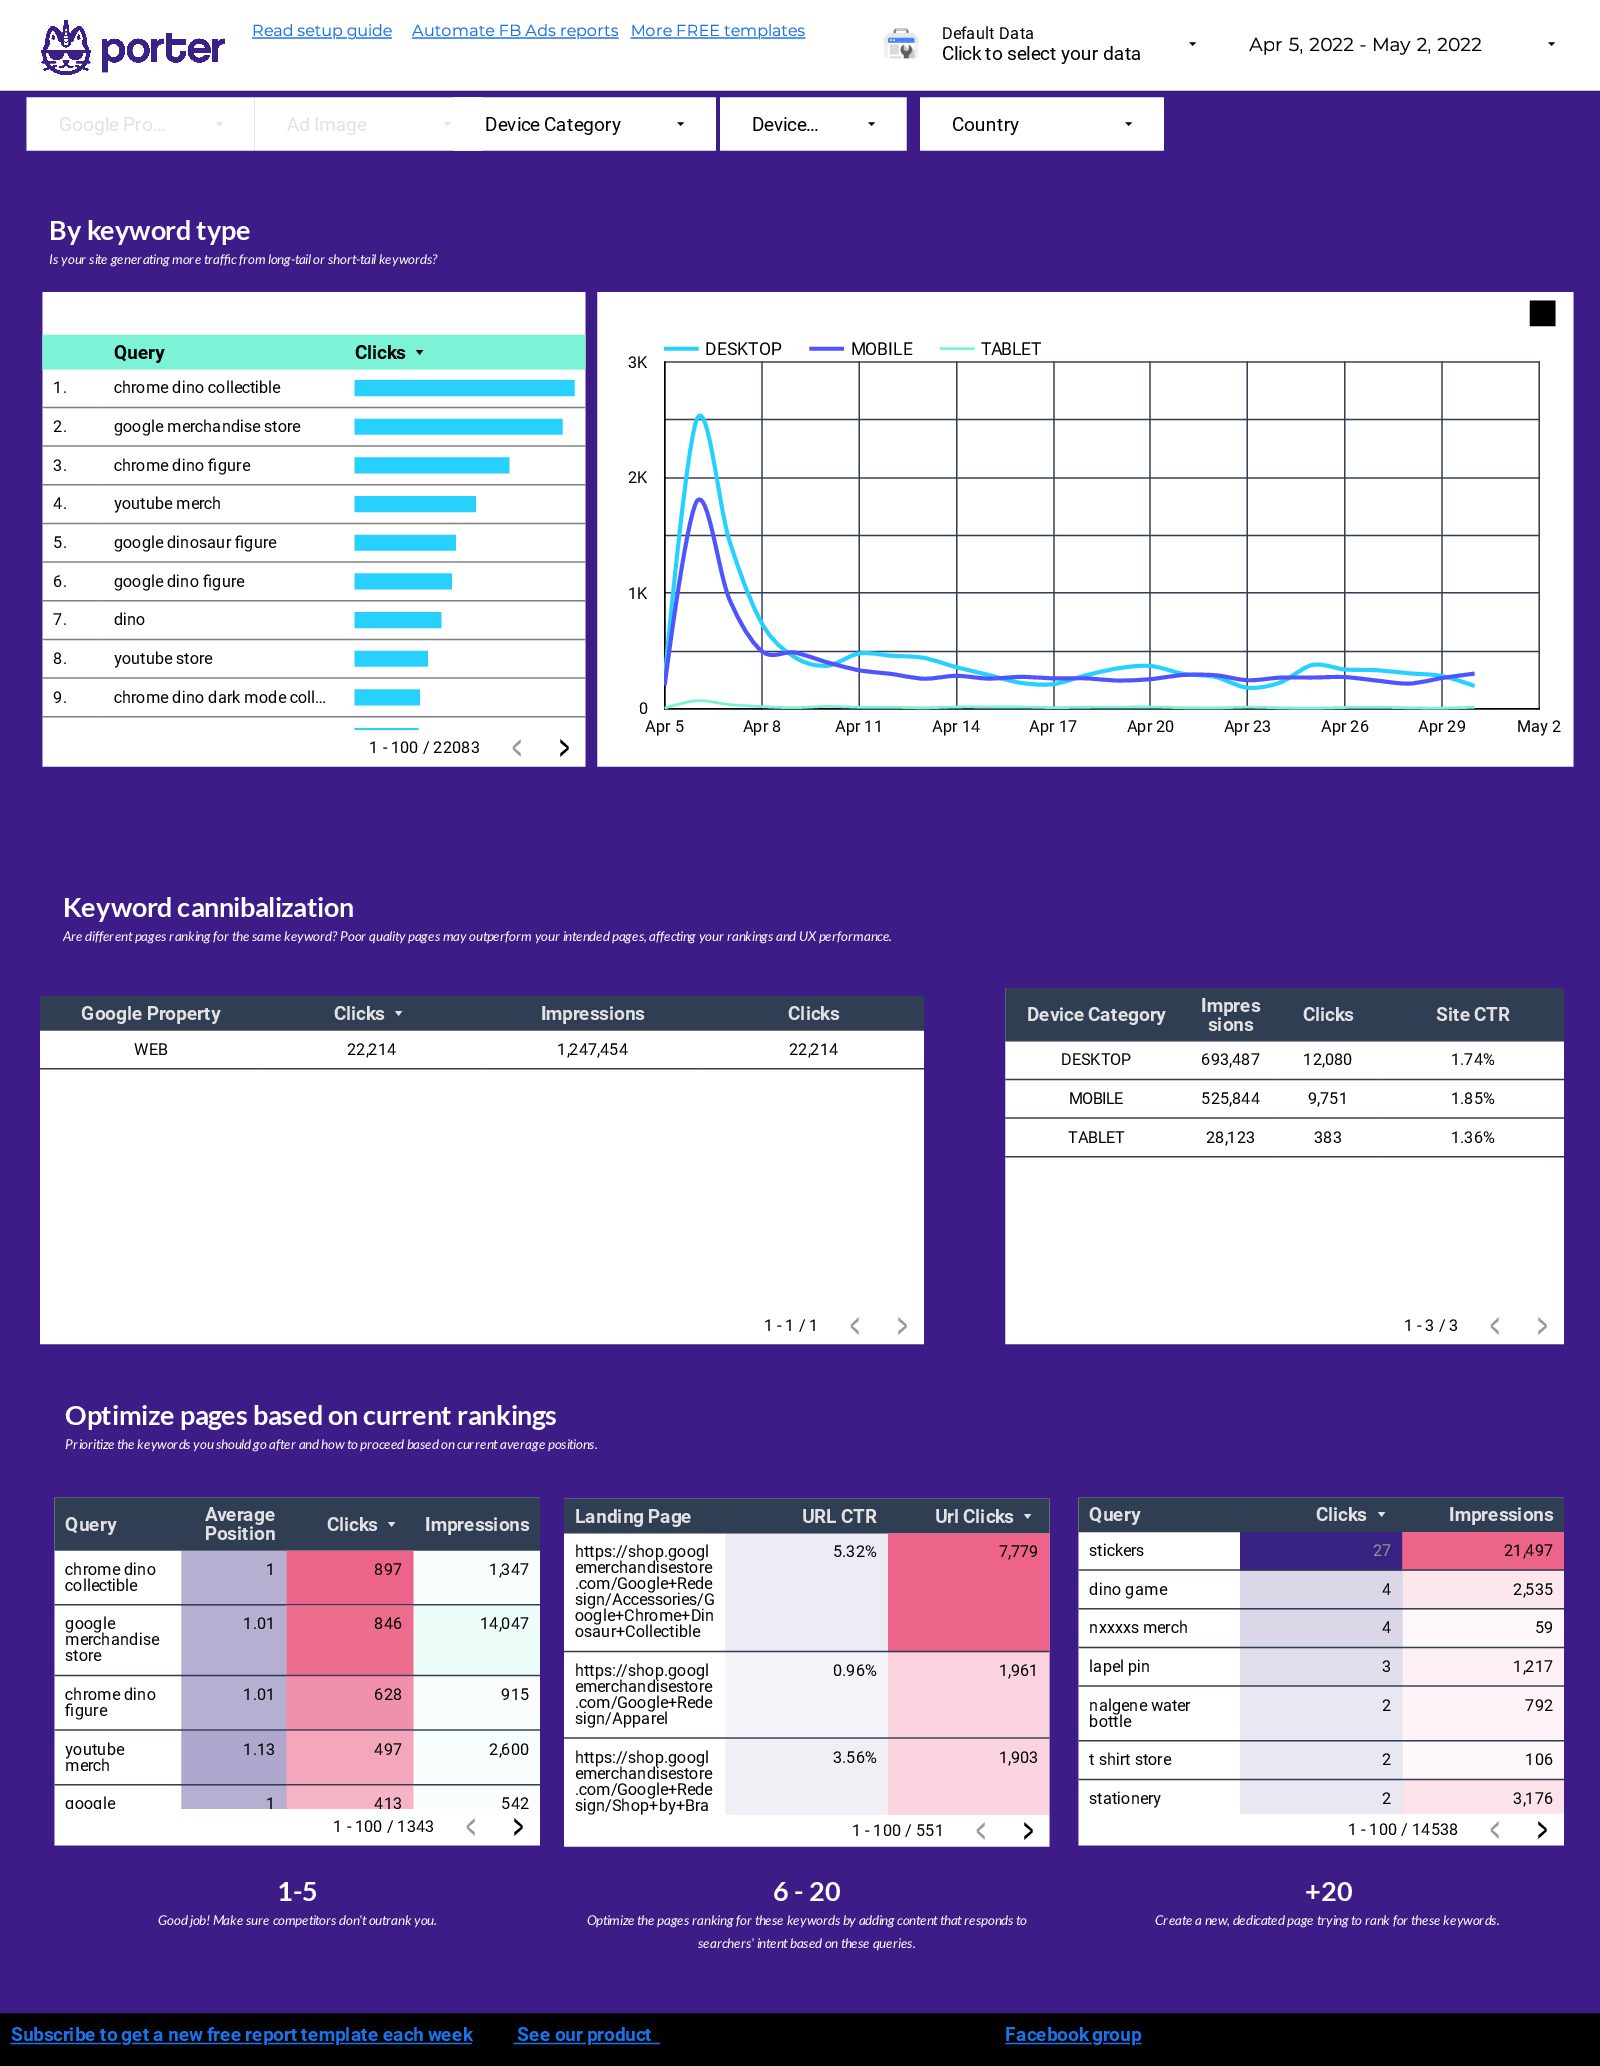
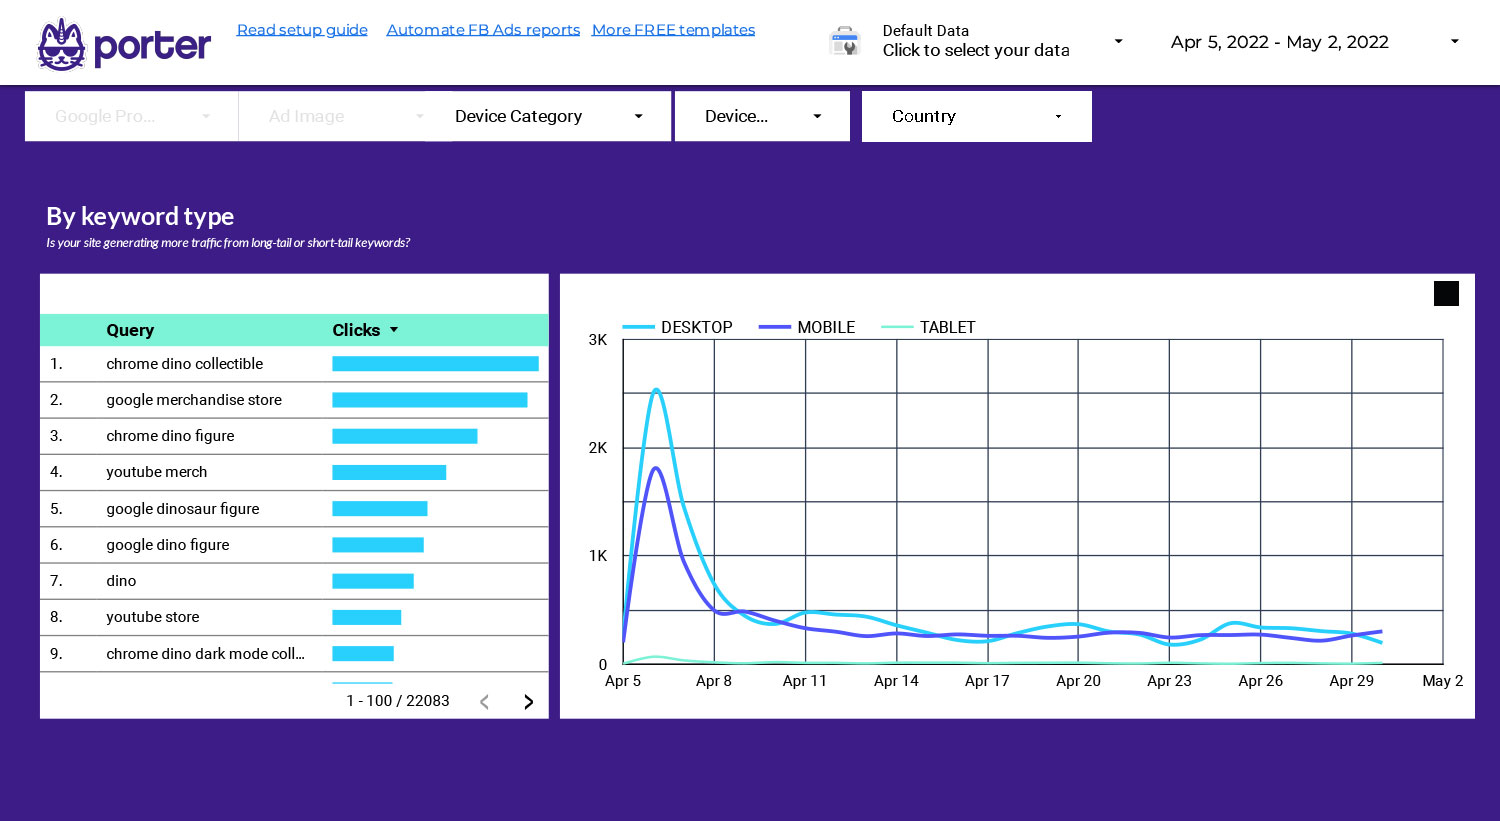
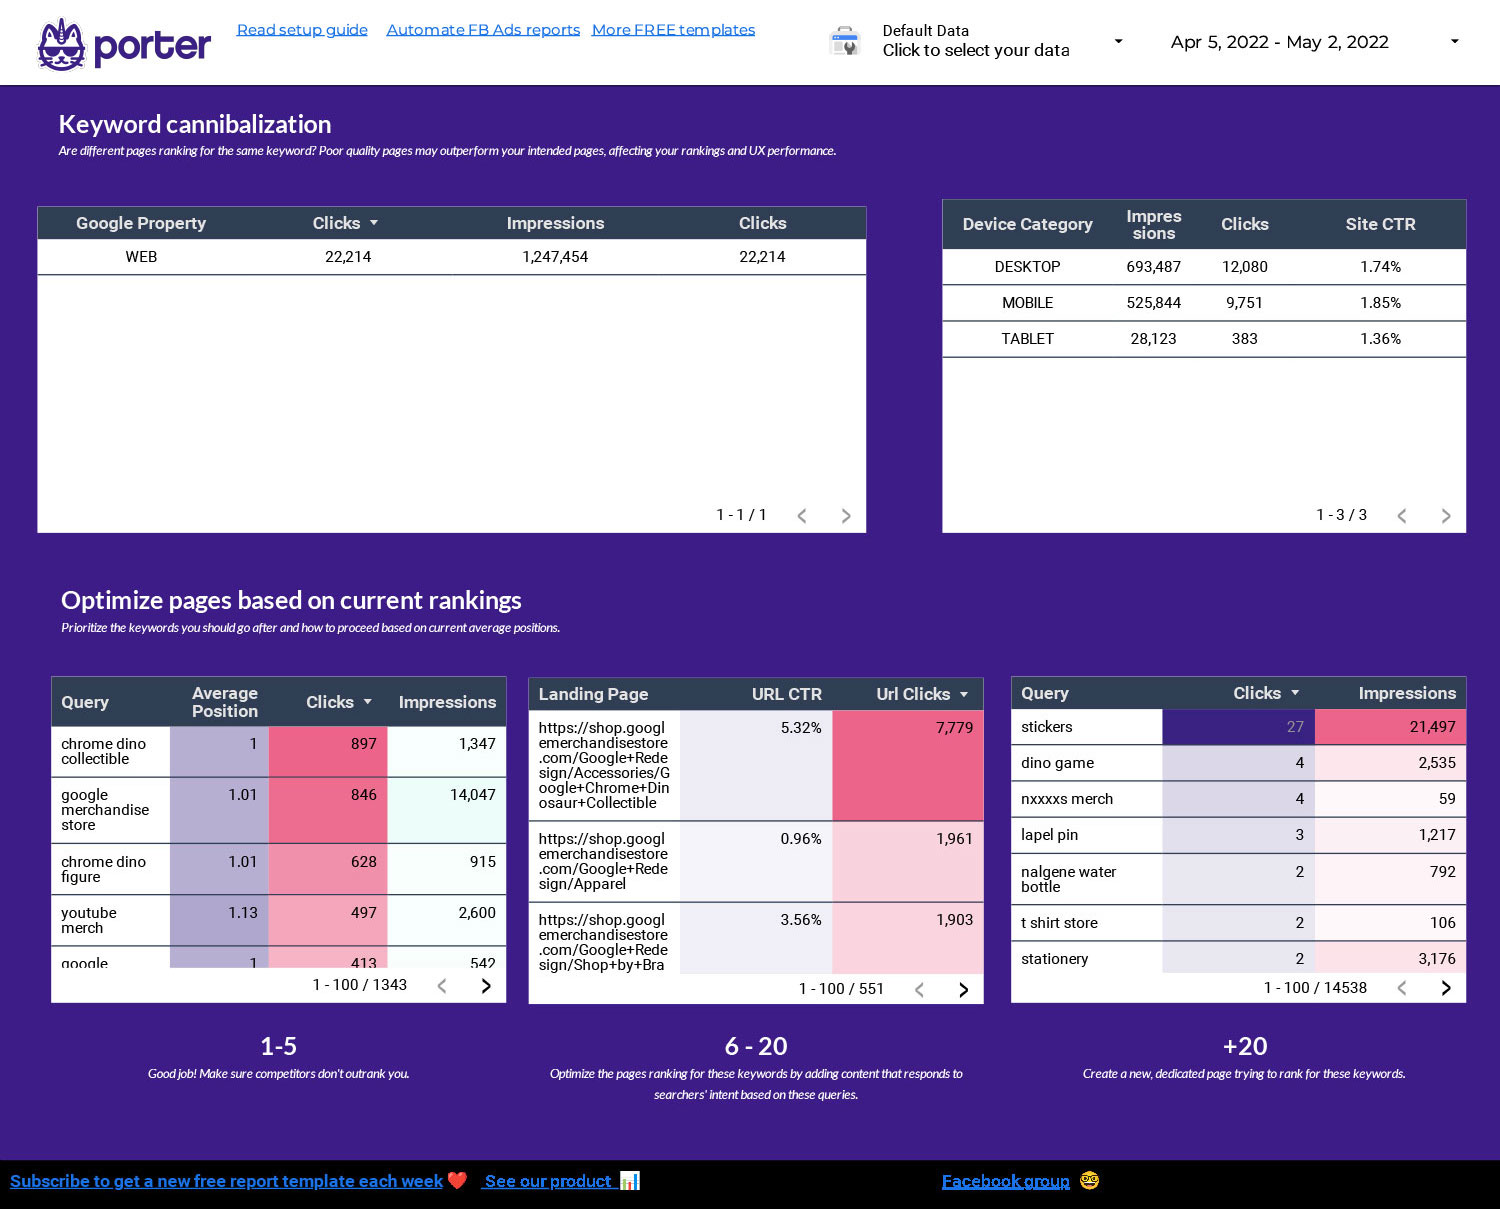
Identify SEO quick wins and ranking opportunities; spot keyword cannibalization; figure out if you’re ranking with short-tail or long-tail keywords. Free template. In just a few clicks.


Automate your client and agency reporting.
Google Analytics, Google Ads, Facebook Ads, Google Search Console, Instagram, and Youtube—all in a single report. It’s free
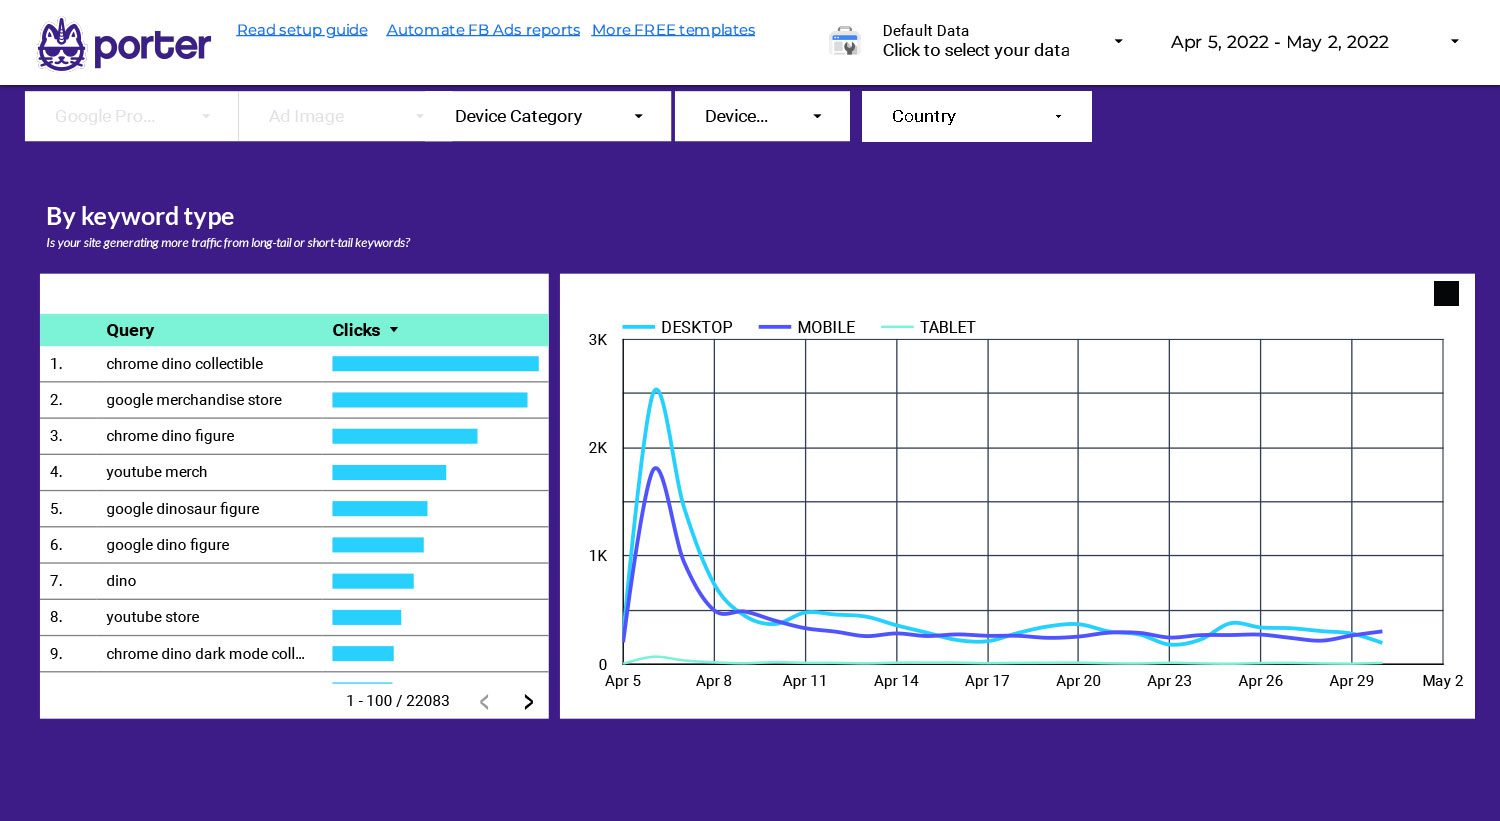
Identify SEO quick wins and ranking opportunities; spot keyword cannibalization; figure out if you’re ranking with short-tail or long-tail keywords. Free template. In just a few clicks.


