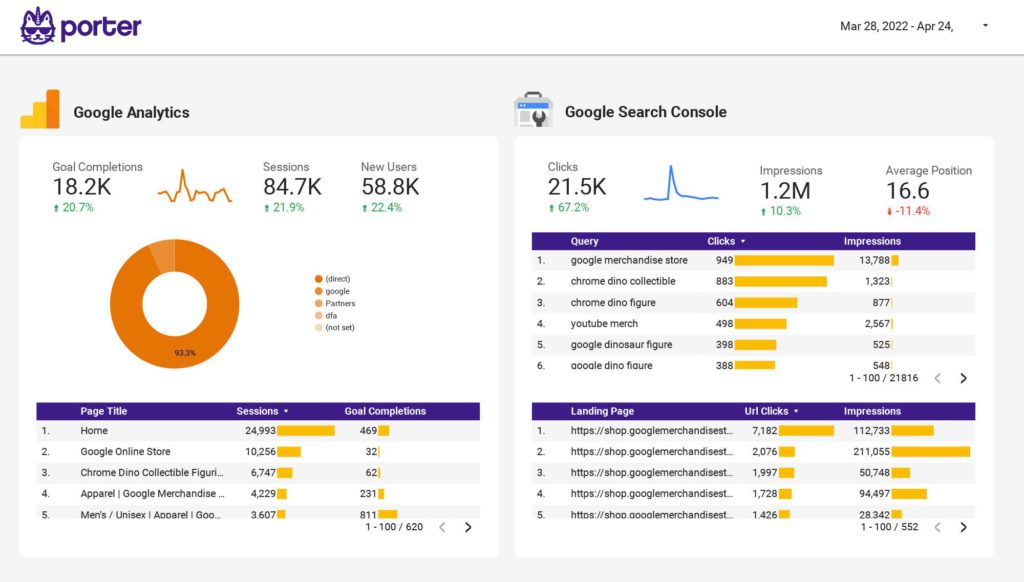
A weekly report should include visibility metrics such as impressions, reach, and website traffic. Engagement metrics like clicks, likes, shares, and comments should also be broken down. Conversion metrics such as conversions, sales, and return on investment should be included. Data segmentation should be done by campaign, channel (e.g., social media, email), audience demographics, content type (e.g., blog posts, videos), objective (e.g., brand awareness, lead generation), and date. For example, the report should show impressions and clicks for each social media campaign, website traffic for different content types, and conversions from various audience demographics.
To analyze the data for the weekly report, follow these steps:
1) Choose metrics: For visibility, track impressions and reach for each campaign, channel, and audience. For engagement, monitor click-through rates, likes, comments, and shares. For conversion, measure the number of leads generated, purchases made, or email sign-ups.
2) Add context: Compare the metrics against the set goals, cost, and previous date ranges. Calculate conversion rates and benchmark them against industry averages or previous campaigns. For example, if the goal is to increase reach by 10%, compare the current reach to the previous week and the benchmark.
3) Segment data: Break down the metrics by campaign, channel, audience, content, objective, and date. Provide specific examples like comparing the engagement metrics for a Facebook campaign targeting millennials to one targeting baby boomers. Show how different objectives, such as brand awareness versus lead generation, impact the metrics.
Remember to keep the paragraph within the maximum limit of 250 characters.
To build a weekly marketing dashboard, 1) connect your data and accounts such as Google Analytics, social media platforms, and CRM. 2) Select the metrics to monitor performance, for example, website traffic, conversion rates, and social media engagement. 3) Segment or break down data by campaign, channel, audience, product, customer content, objective, date, such as a specific product promotion on Facebook. 4) Add filters or buttons to make your report interactive, like a filter for specific date ranges. 5) Share your dashboard via PDF, scheduled emails, or links to relevant team members.
A weekly marketing dashboard is a visual tool that displays key marketing metrics and KPIs, providing businesses with insights to make informed decisions. It is significant as it allows real-time monitoring of data, enabling immediate response to market trends. Tools like Looker Studio are commonly used to create these dashboards, which typically include elements like traffic sources, conversion rates, and customer engagement metrics. Real-time data monitoring is crucial as it helps businesses stay agile and competitive. For a detailed guide on creating a marketing dashboard using Looker Studio, visit our YouTube channel: https://www.youtube.com/@porter.metrics.