


Do you manage Facebook ads for clients? If so, it’s important you know how to analyze performance and present the data in a way that is easy to understand.
In this guide, we will discuss some tips for Facebook ads reporting. We’ll also provide a few examples of reports you can use to show your clients how their ads perform. Let’s get started!
Pick a Facebook Ads reporting tool
First of all, you need to choose a Facebook Ads reporting tool. While there are many options available, we recommend using one that is focused on helping you achieve your specific objectives. Let’s check different alternatives.
Facebook Ads Manager reports
Facebook Ads Manager is one of your most important tools as an advertiser.
You can create ads for your Facebook page and use the reports provided by the Ads Manager to understand how well your ads are performing, who is seeing them, and where they’re being seen.
Additionally, the reports can help you determine what kind of ads to create and how much to spend on them.
Some of the benefits of using Facebook Ads Manager reports include:
- Knowing how many people saw your ad and have interacted with it
- Determining which ads are working best and optimizing them accordingly
- Figuring out who your target audience is and what demographics you should be targeting
You can read the next article to understand how to use Ads Manager and create your first report once you are ready.
Use a Facebook Ads reporting tool
Paid reporting tools can provide more valuable insights to help you move away from manual processes. You can set up reports in just minutes in one interactive dashboard and visualize all your metrics and KPIs.
Working with a reporting tool can help you easily measure campaigns performance for Facebook Ads. The tool will show you how many people saw your ad, how many clicked on it, and how much money you spent.
This information can help you measure the effectiveness of your ads and make necessary adjustments.
Many different Facebook Ads reporting tools are available, so be sure to choose one that best suits your needs.
You could try Porter Metrics, and also explore different alternatives in the following article: The best Facebook Ads reporting tools for marketers and agencies.
Whichever tool you choose, make sure you use it regularly to get the most accurate landscape of your ad’s performance.
Import Facebook Ads data to Google Sheets
A different option to analyze your Facebook Ads performance is to import the data to show it into Google Sheets and put it into Google Data Studio. In this way, you can build your custom report.
However, this is a manual process, and you will need to do it every time you want to update your report on Google Data Studio.
Facebook ads reporting API
Facebook Ads Reporting API allows developers to access and manage Facebook advertising data. The API enables users to view reports, create campaigns, get performance insights, and more.
To use the Facebook Ads Reporting API, you will need to first register for a Developer Account.
For more information on using the Facebook Ads Reporting API, please consult the official documentation.
Define the Facebook Ads metrics and KPIs to track
Once you have chosen a tool, it’s time to start to analyze your data.
There are a number of Facebook Ads metrics and KPIs that you can track to measure your campaigns’ success. However, not all of them will be relevant to every business.
Therefore, it’s important to define which metrics and KPIs are most important for your before you start analyzing your data.
Impressions vs Reach
Another thing to take into consideration when we are learning about Facebook Ads metrics is the difference between Impressions and Reach, these metrics can be similar, but they are not the same.
An impression is counted when your ad is displayed on Facebook, while reach is the number of people who have seen your ad (unique viewers).
If you want to know more about Facebook Ads metrics, don’t forget to visit the following article: Facebook Ads metrics list.
Performance:
Can show you how your ads are performing compared to your goals. You can use your Ads performance to determine which ads are working best.
These are some important metrics to take into consideration when you are tracking your performance:
- Frequency
- Impressions
- Social spend
- Website purchase
- ROAS percent
- Total action value
- Quality ranking
- Engagement rate ranking
- Action rate %
- People tracking action rate
You can read the following article to know all metrics you can include in your reports: Facebook Ads metrics list.
Clicks:
The number of times people have clicked on your ad. You can use this data to determine how effectively your ad drives traffic to your website or landing page. We have some metrics related to clicks:
- Outbound clicks
- Unique link clicks
- CTR (All)
- CTR
- Link clicks
- Unique clicks
- Unique CTR
- Unique inline link clicks CTR
- Outbound CTR
Engagement:
The total number of actions that people take when seeing your ads on Facebook. Engagement includes metrics such as reactions, likes, comments, shares, etc.
Post engagement breakdown metrics:
- Post Reactions
- Post Comments
- Post Saves
- Post Interactions
- Post Shares
- 3-Seconds Video Plays
- Click to Play (Video)
- Photo Views
- Link Clicks
- Cost per post engagement
- Page engagement
- Page Likes
Video:
Video metrics enable you to know how your videos are performing. According to Facebook, there are two ways to measure your video ads: duration and milestone metrics.
Duration metrics show how long people engage with a video, while milestone metrics show what parts of the video people got to.
You can check the complete Facebook Ads metrics list to know all the related metrics to media and videos.
Duration metrics:
- 2-Second Continuous Video Views
- 3-Second Video Views
- ThruPlays
- Video Average Watch Time
Milestone metric:
- Video Watches at 25%
- Video Watches at 50%
- Video Watches at 75%
- Video Watches at 95%
- Video Watches at 100%
App and Actions:
Tracks how many people have installed your app or completed an action, such as making a purchase. This metric can determine your ads’ effectiveness in driving customers to take a specific action.
Some metrics related to App and actions are:
- App installs
- Mobile app sessions
- Mobile app registration complete
- On-Facebook add to cart
Remember, you can always check the complete Facebook Ads metrics list for more details.
Messenger:
Messenger metrics can help you to deliver ads to people more likely to respond to your business in Messenger.
According to Facebook, Ads that click to Messenger work with three objectives: Messages, Traffic, and Conversions.
During ad creation, you’ll create both the ad and the welcome experience people see in Messenger after they click on your ad.
The following metrics are available in Ads Manager under the Messaging Engagement column for ads that click to Messenger and sponsored messages:
- Messaging Conversations Started: The number of times people started messaging your business after at least 7 days of inactivity, attributed to your ads.
- Messaging Connections: The number of people your Page can send messages to.
- New Messaging Connections: The number of people your business added as messaging connections, attributed to your ads.
- New Blocked Messaging Connections: The number of times that people blocked a messaging connection with your business, attributed to your ads.
- Cost Per Messaging Conversation Started: The average cost for each messaging conversation started. This metric is calculated as the total amount spent divided by the number of messaging conversations started.
Quality:
It can help you to measure the quality of your ad. Quality is based on a number of factors, such as engagement, relevance, and clicks.
Related to quality, we have “Quality ranking,” which is an ad’s perceived quality compared with ads competing for the same audience.
Cost:
The average cost you’ve paid when you are running a Facebook Ads campaign. Cost per impression (CPM), cost per click (CPC), and cost per 1000 impressions (CPM) are the most popular metrics related to cost.
These metrics can help you determine whether your ads are profitable and identify which ones are generating the most ROI.
Custom and standard conversions (conversion window):
Tracks how many conversions (or specific actions) your ads generate, regardless of when the customer actually completes the action.
This metric is useful for determining whether your ads effectively drive customers to take the desired action, such as making a purchase or signing up for a subscription.
Facebook Ads breakdowns and filters
When analyzing your Facebook Ads performance, it’s important to remember the different types of breakdowns and available filters. These include:
Campaigns, ad sets, and ad creatives:
It will show you how each campaign, ad set, and ad creative is performing. This can help you determine which ones are most effective so that you can focus your efforts on those.
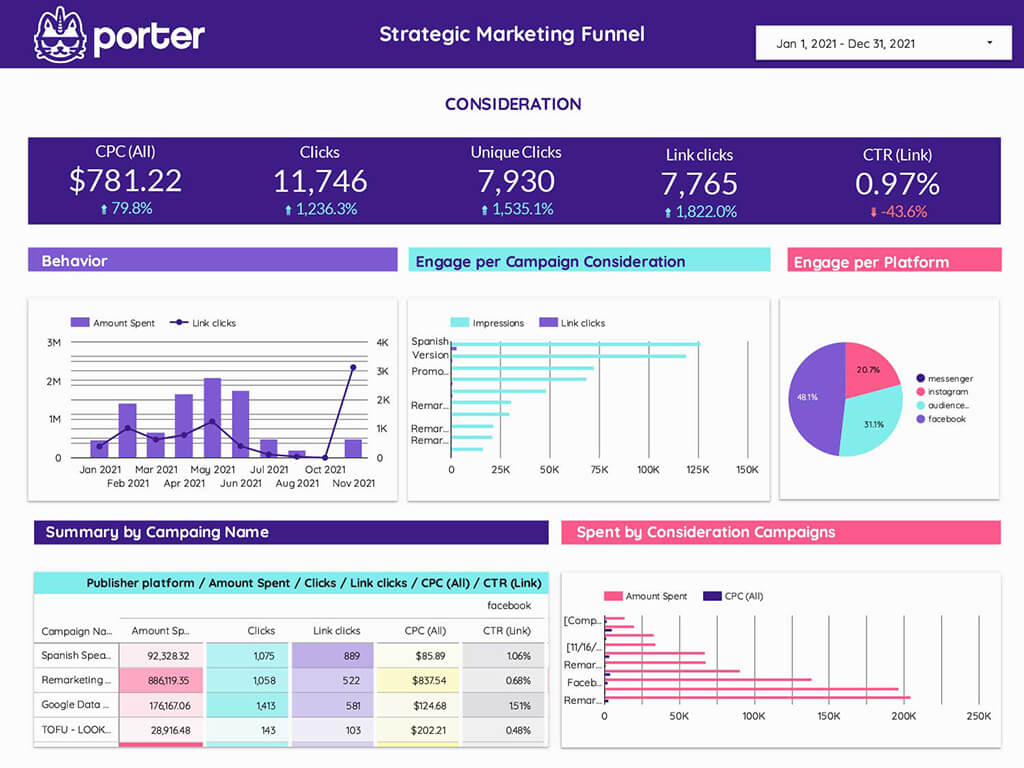
Check the template below, it’s for free and can help you to have a complete overview of your campaigns:
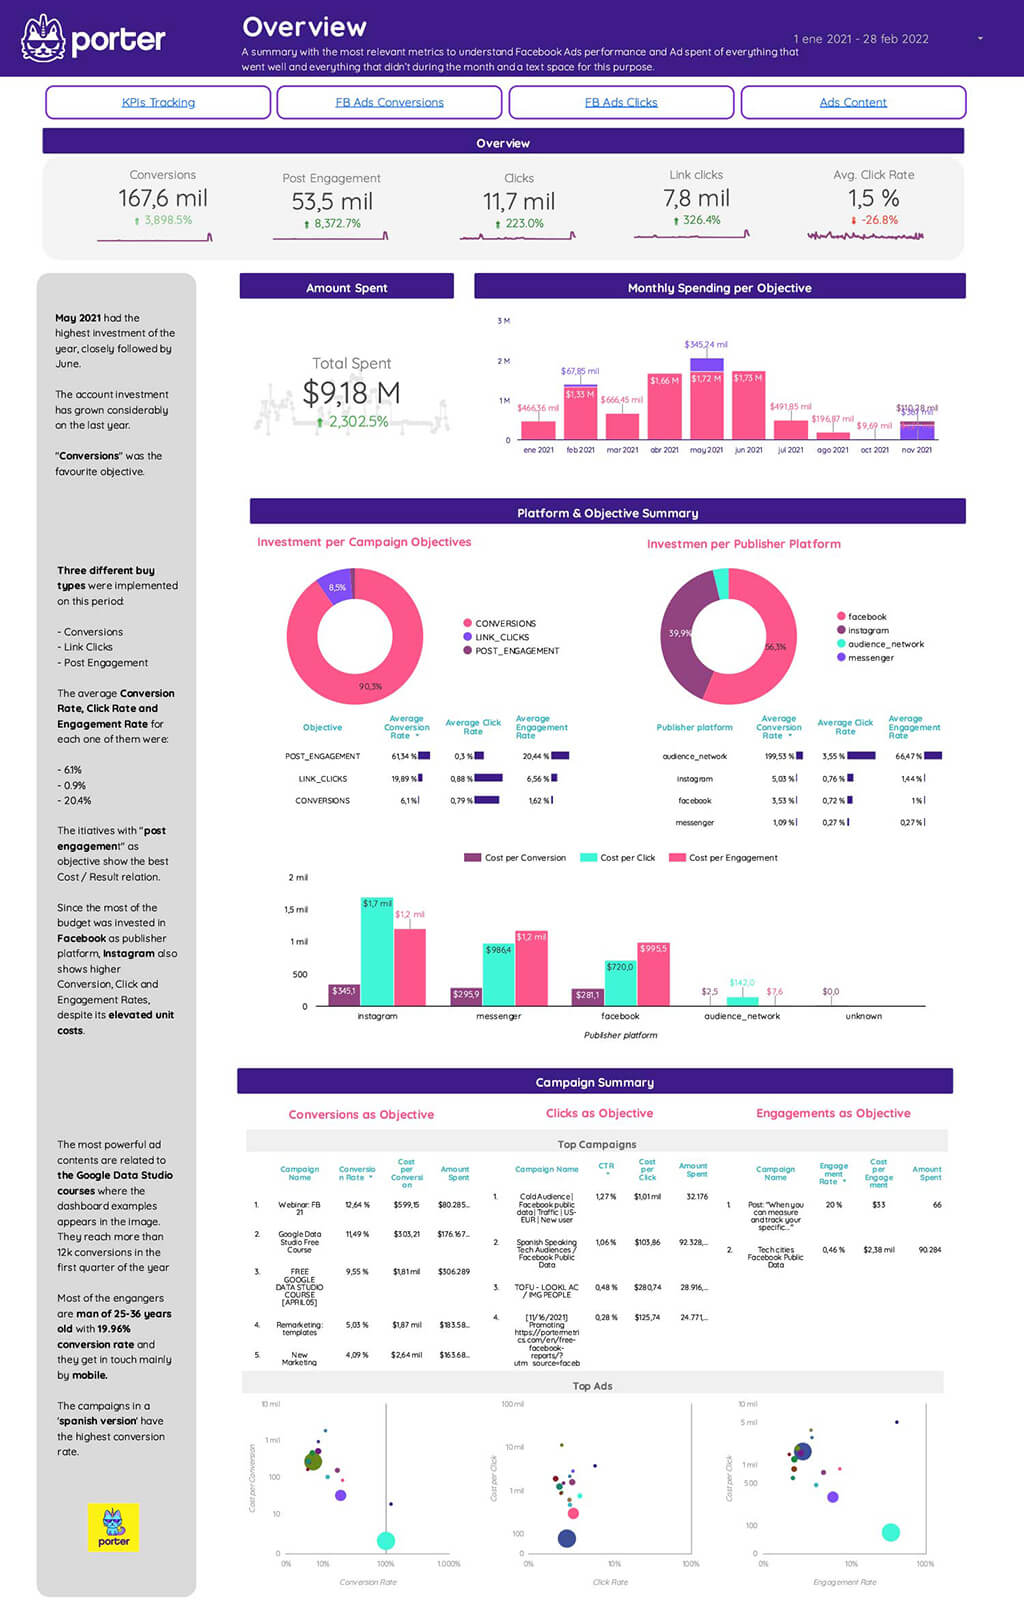
Check this Free Facebook Ads report template for marketers and agencies!
Time:
This filter lets you see how your ads perform at different times of day or week. This is useful for determining when your target audience is most active.
Device and placement:
This filter allows you to see how your ads are performing on different devices (phone, tablet, computer) and in different placements (newsfeed, sidebar, Instagram).
This is useful for determining where your ads are most effective.
Geographic and demographics
- Age
- Gender
- Country
- Region
- DMA
On Porter Metrics we have a great report template that breaks down your Facebook Ads data by device, placement, geography, and demographics. Take a look:
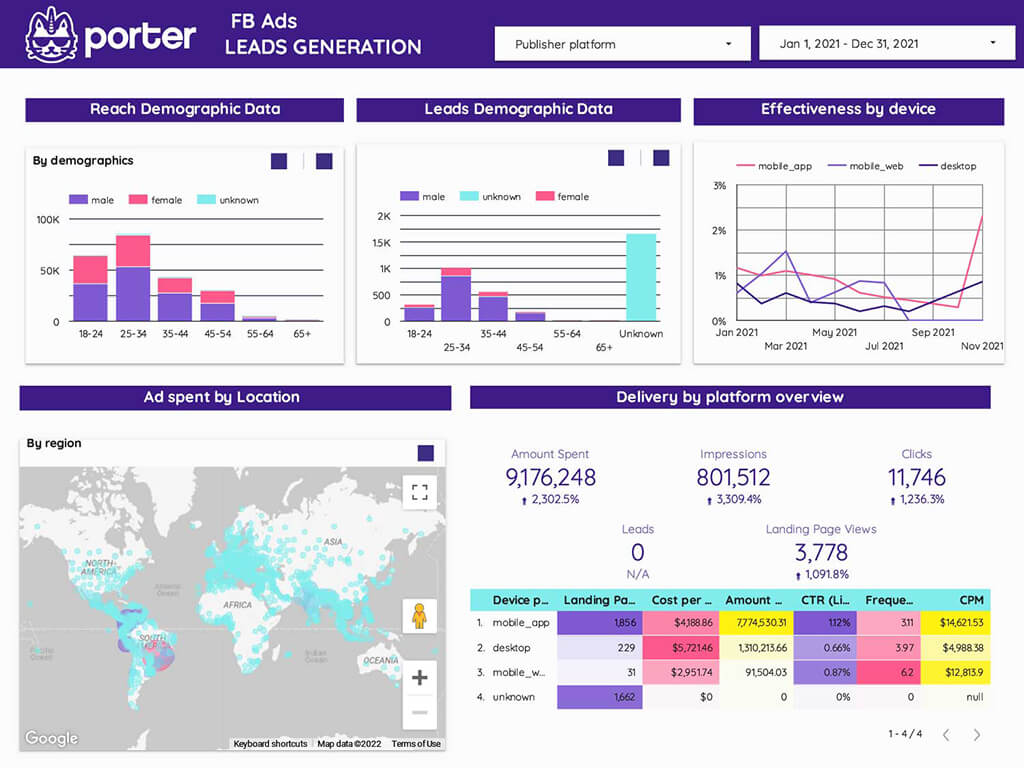
You can use this template for free. Make a copy of the report!
Steps to set up your Facebook Ads report
Creating a Facebook Ads report for your clients doesn’t have to be difficult.
By following these simple steps, you’ll be able to create a comprehensive report covering all of the important Metrics and KPIs we showed you before.
Connect your Facebook Ads data
As we showed you, to connect Facebook Ads to Google Data Studio, we have different options. However, for this guide, we will use The Porter Metrics connector for Facebook Ads.
There is a simple tutorial to show you how to connect your Facebook Ads account to Data Studio.
Create charts
Once you have connected your source, we can start to build your report, by creating charts, adding custom formulas, and customizing your report. However, remember you always have the option to use a Porter Metric template.
Also, we prepared a video tutorial to show you how to create your first charts and graphs on Google Data Studio in just a few clicks:
Follow these steps to create your first charts:
- Open the Google Data Studio report on the edit mode.
- Go to the menu and click on “Insert” or “Add a Chart”.
- Choose a chart type (scorecard, time series, tables, pie charts, and bar charts are the most common).
- Make sure the chart is linked to the Facebook Ads connector.
- Depending on the chart, you should choose a combination of metrics and dimensions. A good one could be visualizing Leads or Purchases as a scorecard and over time by choosing Date as the time dimension.
- Set to compare the data against the last period.
Use filters and controls
Filters and controls on Google Data Studio make your reports interactive and clean your data.
A good use case for filters and controls with Facebook Ads data may be filtering your campaign objectives or campaign names so you can analyze performance metrics for some of them, like excluding the campaigns meant for engagement rather than lead generation.
Multiple account breakdown: Another way to use filters is to look at data performance by account. This could be helpful if you’re working with a brand that has multiple Facebook Ads account.
We prepared this tutorial on how to create filters and controls on Google Data Studio.
Custom formulas
When it comes to formulas, think of Google Data Studio like Google Sheets: you can calculate any metrics with countless math functions.
With that in mind, you can use custom formulas to calculate important metric values for your business.
You can also calculate CPA (cost per acquisition) for each ad set by dividing the total spent by the number of leads generated.
If you want to track how your Facebook Ads are performing in different currencies, you can use this formula: =(Currency Conversion Rate/Ad Spend)*100.
This will give you a percentage showing how much more or less you’re making on ads when spent in other currencies.
Finally, another common calculation for agencies is to add a margin (or commission) on top of the (CPA). To do this, you can use this formula: =((CPA – Margin)/CPA)*100.
This will give you a percentage that shows how much more or less you’re making on ads when considering your commission.
Watch this tutorial to learn to create custom formulas on Data Studio.
Cross-channel reports
Cross-channel reports give you an overview of how your channels are performing in relation to each other. This can be helpful in a number of ways:
- Seeing which channels are working well together and which ones might need some improvement
- Identifying any potential areas of wasted spend
- Helping to inform your overall marketing strategy
As an example, you can combine Facebook Ads with another source such as Google Ads or Google Analytics to see how your channels are performing overall.
In the following article, we’ll show you how to set up a cross-channel report in Data Studio using Facebook Ads with Google Ads.
How to analyze your Facebook Ads data
Set goals for your KPIs
Before you start analyzing your data, setting some goals is important. What are you hoping to achieve with your Facebook Ads?
Do you want to increase brand awareness? Drive more traffic to your website? Get more people to sign up for your newsletter?
Once you have a goal in mind, you can start to look at relevant KPIs for Facebook advertising. This Will help you understand how well your ads are performing and whether or not they’re meeting your goals.
Some important KPIs to look at when analyzing your Facebook Ads data include:
- Cost per click (CPC)
- Click-through rate (CTR)
- Conversion rate
- Cost per acquisition (CPA)
- ROAS
You can prioritize your KPIs and the metrics close to your business goals, then cascade to the metrics that explain such performance.
If you want to increase brand awareness, you might look at metrics like reach and impressions. If your goal is to get more people to sign up for your newsletter, you may look at the conversion rate or CTR.
Once you understand how each KPI impacts your business goals, you can start developing hypotheses about what you need to do to improve your Facebook Ads performance.
For example, if you notice that your CPC is high but your CTR is low, then you may hypothesize that you need to create better ad copies or improve your images.
Use lifetime value to determine an ideal CPA for your business.
Another important metric to keep in mind when reporting on Facebook Ads performance is the lifetime value (LTV).
LTV measures how much revenue a customer generates throughout their relationship with your business. Also, you can determine your ideal CPA.
Create a Facebook Ads funnel
Another great option is to analyze your Facebook Ads with a Facebook Ads funnel and there are a few key reasons:
- It helps you identify where people are dropping off in your funnel so you can make changes to improve conversions
- It shows you which ads are performing best at each stage of the funnel
- Enables you to see the full picture of your Facebook Ads performance so you can present it to clients
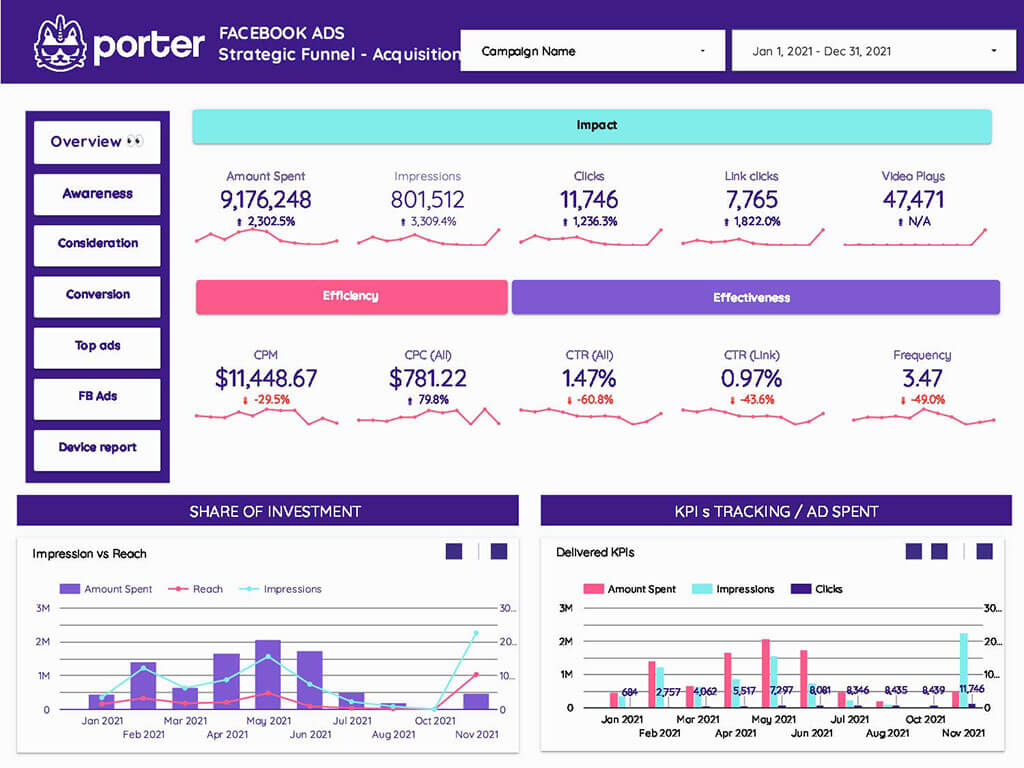
To create a Facebook Ads funnel in Google Data Studio, you can create a copy for this free Facebook Ads funnel template.
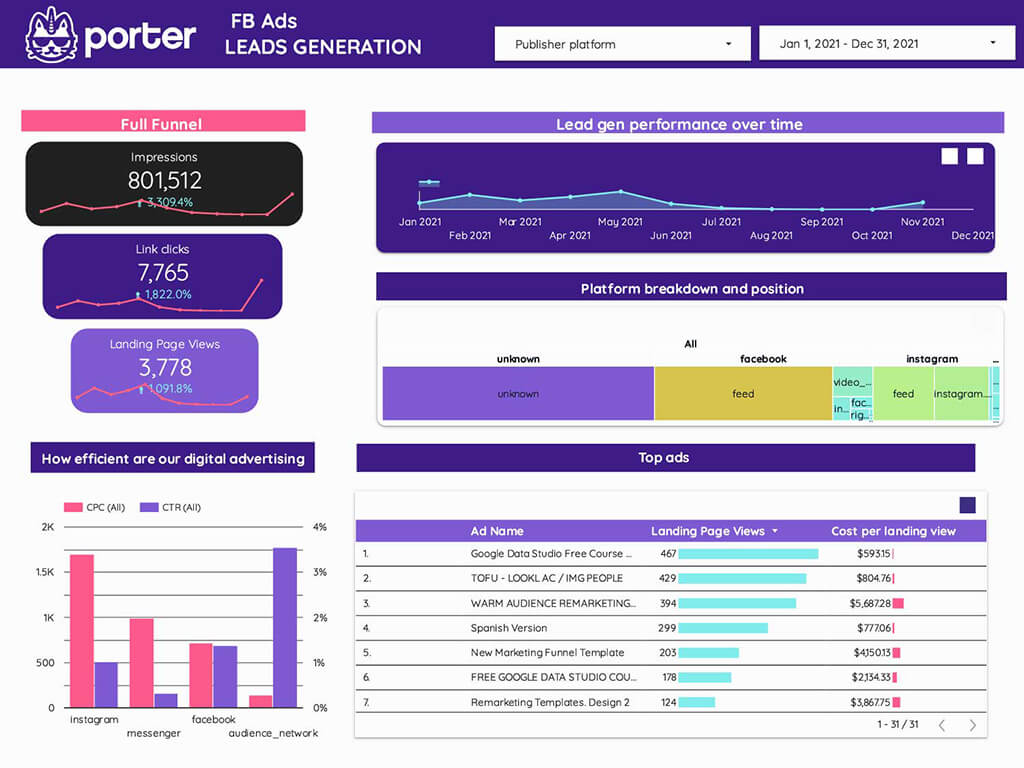
If you decide to use our template, you will be able to track your KPIs by stage of the Marketing Funnel through real-time charts.
This free funnel template consists of 7 pages of detailed performance data, and you will visualize metrics such as:
- Amount spent
- Impressions
- Clicks
- CTR
- CPM
- CPC
- ER
- Link clicks
- Landing page view and cost per landing view
- Post Engagements (likes, reactions, comments, shares, clicks)
- Reach
Get this template for FREE and start to analyze your Facebook Ads data
How to find best performing Facebook Ads campaigns and creatives
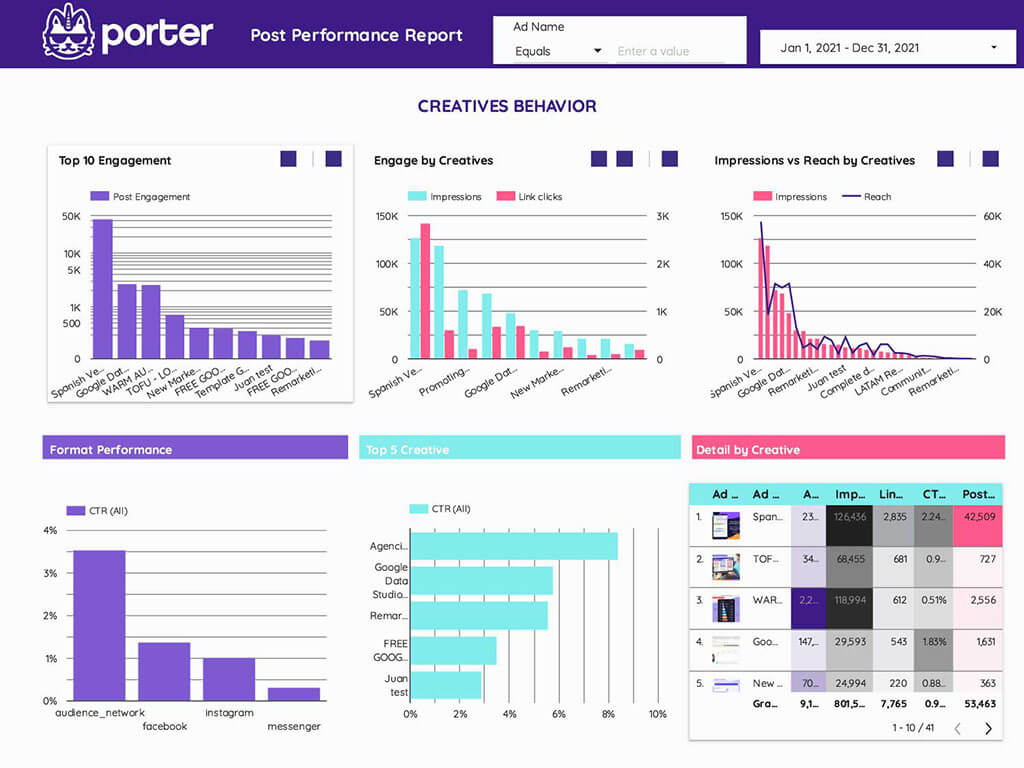
You can use Porters’ reports to check your top ads and creatives’ behavior.
This way, you will see your top 10 engagement posts and a full detailed view by creative that show you Ads images, names, and their respective metrics such as amount spent, impressions, link clicks, and CTRs.
Google Analytics reports to better track conversions and attribution
Another way to track your Facebook Ads performance is by looking at your Google Analytics account and setting up UTM parameters so you can have more detailed insights about how people interact with your website after viewing your Ads.
Check out this helpful guide for more information.
How to present your report to a client
When presenting your Facebook Ads reports to clients, it’s important to be clear, concise, and highlight the key points that will show them the return on their investment. Here are some tips for presenting Facebook ads reports:
Display ad creatives:
When presenting your ad creatives, be sure to show your clients the different versions of the ads and the corresponding results. This will help them understand which creative is performing better and why.
Use conditional formatting, comparisons, and reference lines:
Your report will be more readable and easier to analyze if you use conditional formatting, comparisons, and reference lines. This way, clients can quickly identify trends and problems.
Design your reports (white-label):
If you have experience with Google Data Studio or with any Facebook Ads reporting tool, you take advantage and build your report starting with a white label.
Make sure to design your reports in a way that is professional and branded. This will give you more credibility with clients.
Sharing your reports via links or PDF snapshots:
Once your reports are ready, you have a few options for sharing them with clients. You can share the report as a link, or if you want to send a PDF file, you can do that too.
Another great option is to schedule email deliveries with your reports. Let’s see how this works.
Schedule email deliveries:
if you use Google Data Studio, you can schedule your reports to be emailed to you or your client automatically on a regular basis.
This is a great way to stay on top of performance and keep your clients updated without having to remember to do it manually.
Google Data Studio: Share Your Reports [Automate it]
Finally, remember to be open to feedback and answer any questions your clients may have. By doing all of this, you can help ensure that they will be happy with the results of their campaign performance.
Facebook Ads report templates
Working with a Facebook Ads report template can make your life a lot easier. They can automate the process of gathering data and generating graphs and charts, so you can focus on analyzing the results.
When choosing a Facebook Ads report template, there are a few things to keep in mind. First, make sure that the template is customizable.
This way, you can tailor the report to your specific needs and goals. Second, look for a template that is easy to use and understand. Third, choose a template that offers support in case you have any questions.
There are a number of different templates to choose from, depending on your needs. You can find several good ones in the following article: 21 Facebook Ads report templates you should try.
Also, you can explore all the resources in our report templates gallery. All of them are for free and If you are interested, we will be more than happy to set up your first report for you, (also for free).
Once you’ve chosen a template, it’s easy to get started. Just enter the data from your campaign (the best way is using a connector) and let the template do its job.