


To Import Twitter Analytics data to Google Sheets, download the Twitter Analytics to Sheets add-on, connect your Twitter profiles, metrics, dimensions (or breakdowns), and date ranges, and schedule hourly, daily, or weekly data refreshes to monitor your Twitter Analytics campaigns performance and automate your Social media marketing reports.
By the end of the tutorial, you’ll know:
- 2 free and paid ways to connect Twitter Analytics to Google Sheets
- Schedule automatic data refreshes
- Free Twitter Analytics report templates for Sheets
- Customize your Twitter Analytics reports on Google Sheets
- Available Twitter Analytics metrics and dimensions
Free and paid ways to import Twitter Analytics to Google Sheets
Twitter Analytics add-on for Google Sheets
To import Twitter Analytics data to Google Sheets automatically, follow these steps:
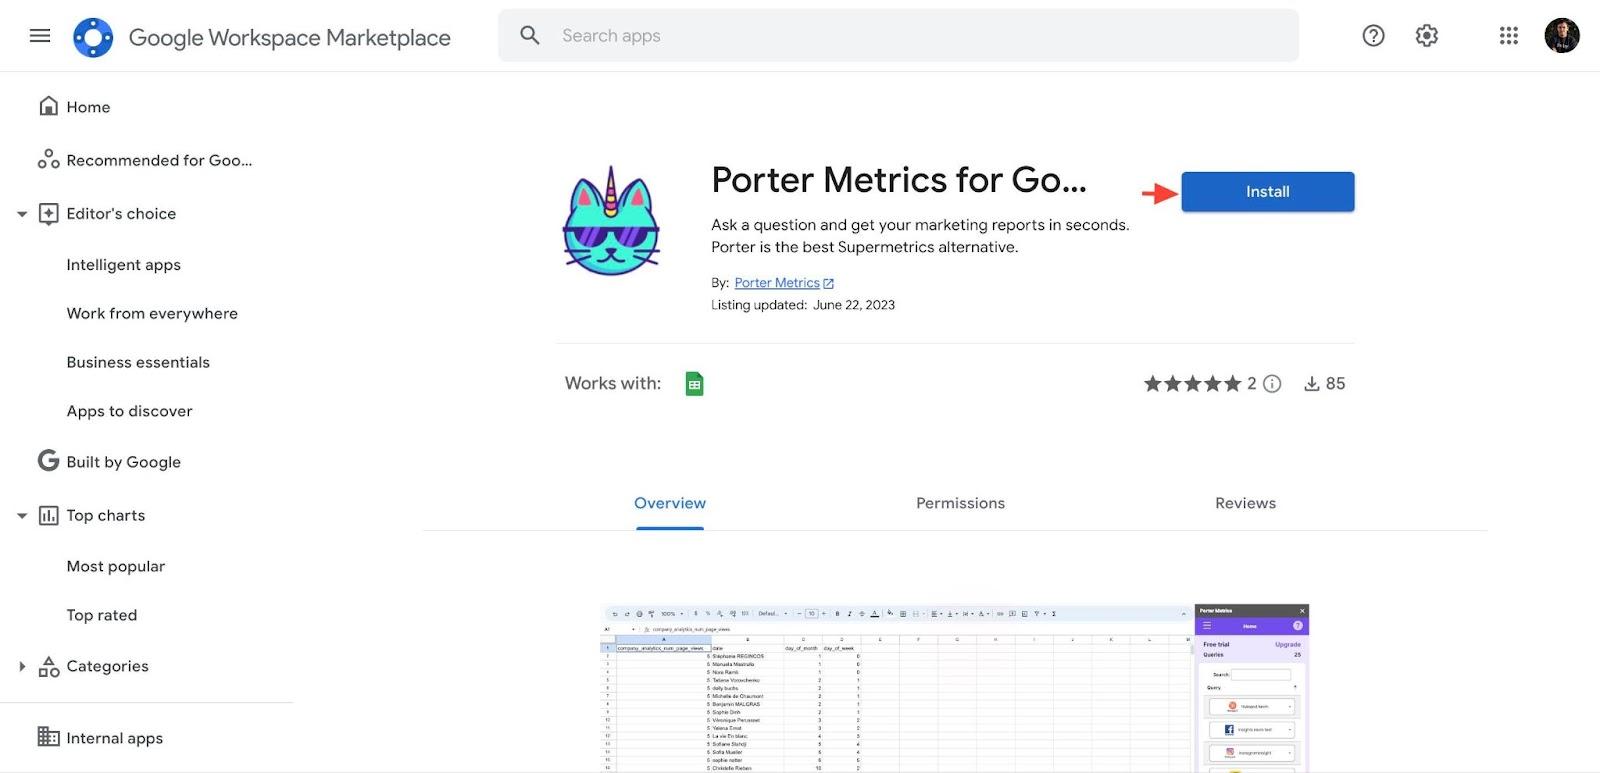
Step 1: Install the Twitter Analytics to Google Sheets add-on and open a new sheet.
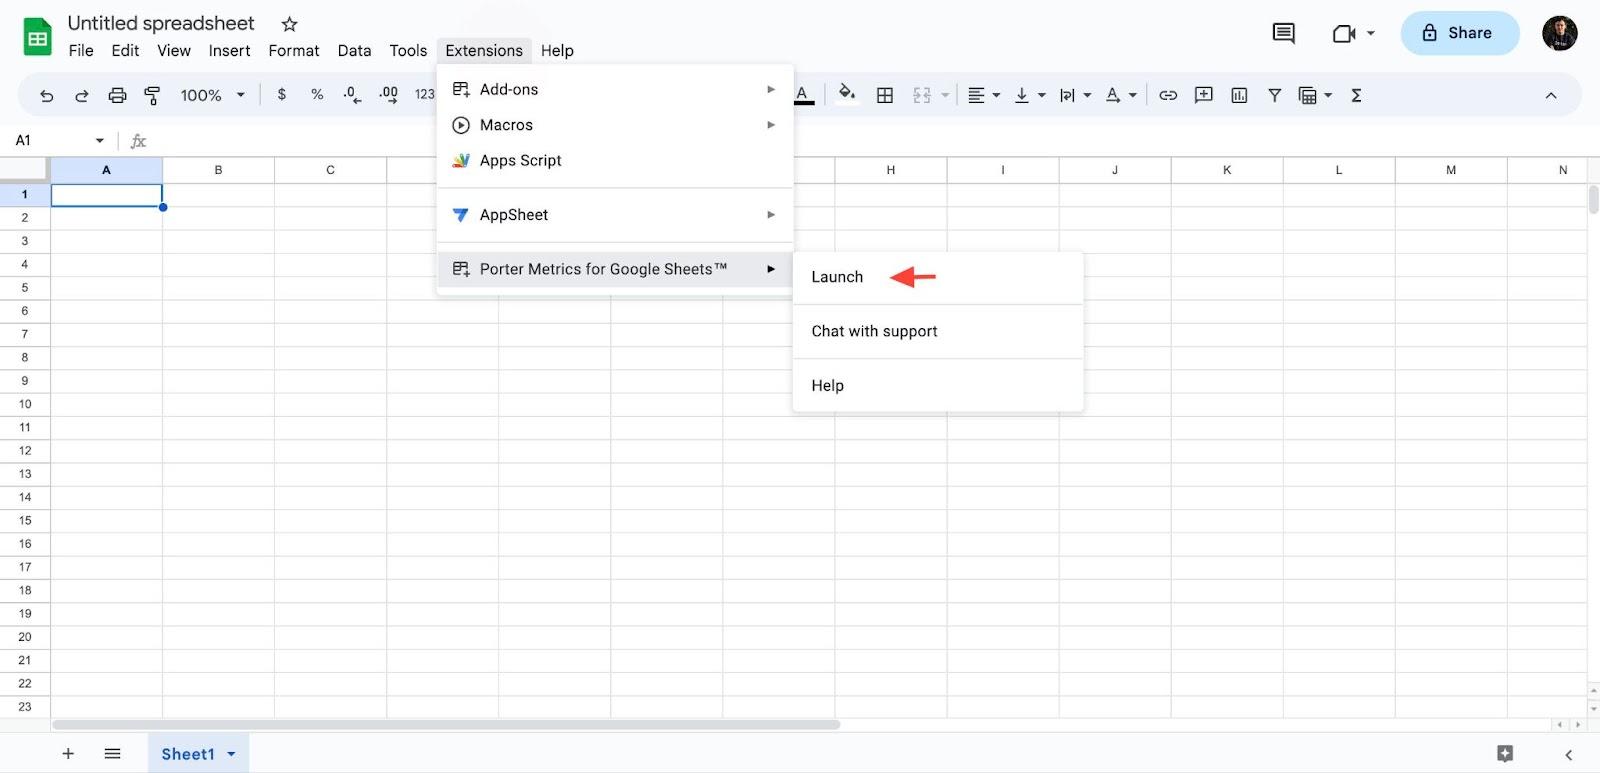
Step 2: Go to Extensions – Porter Metrics – Launch.
Step 3: Choose the Twitter Analytics integration and connect your Twitter profile. Porter will bring all the Twitter Analytic accounts associated to it.
Optionally, connect multiple Twitter personal profiles to retrieve other Twitter Analytics’ data yours doesn’t have access to.
Step 4: name your query so you can save it for later and schedule automatic data refreshes.
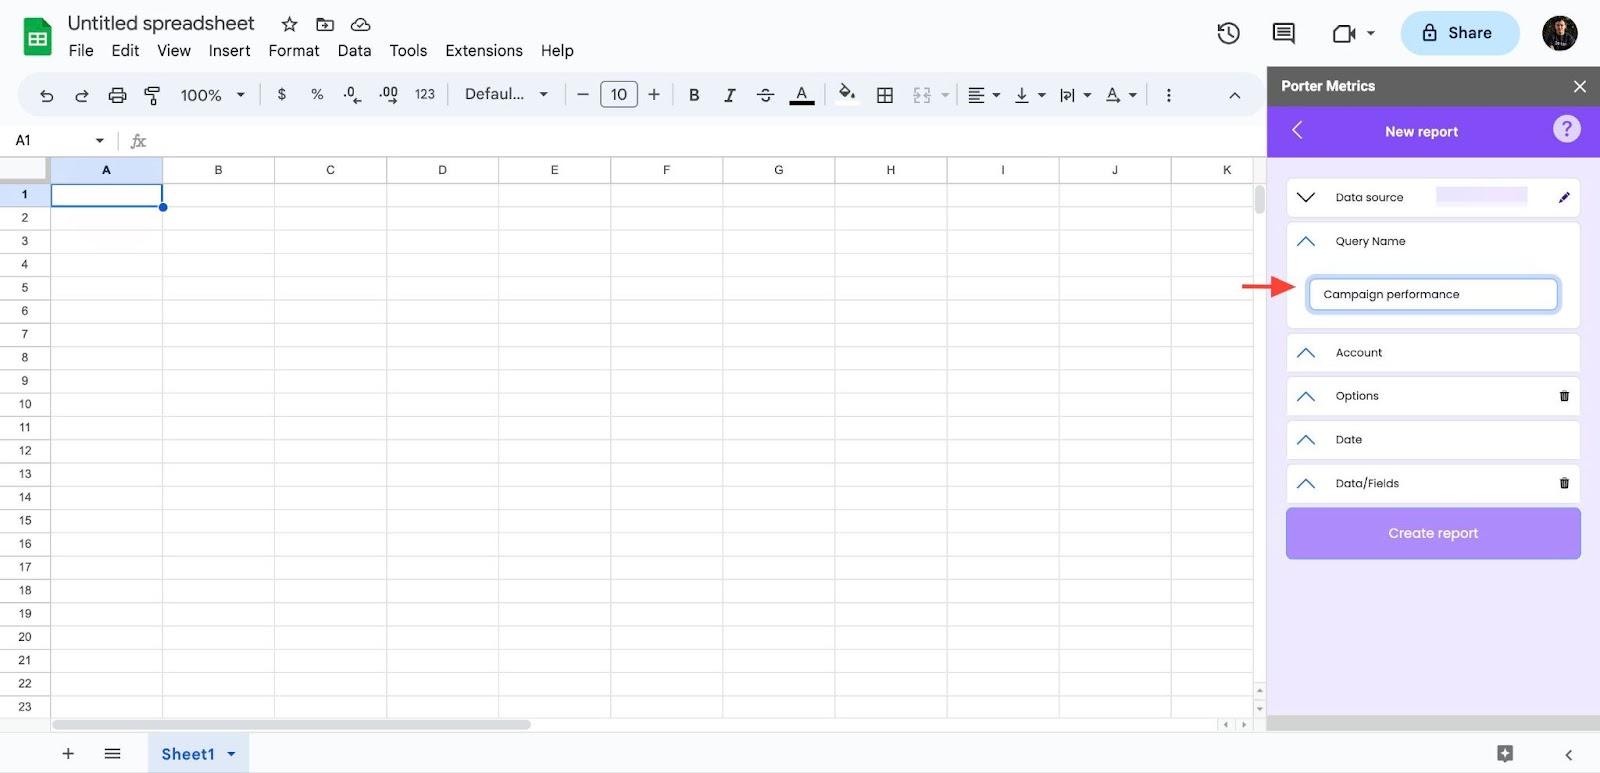
For this example, we’ll call the query “Campaign performance”.
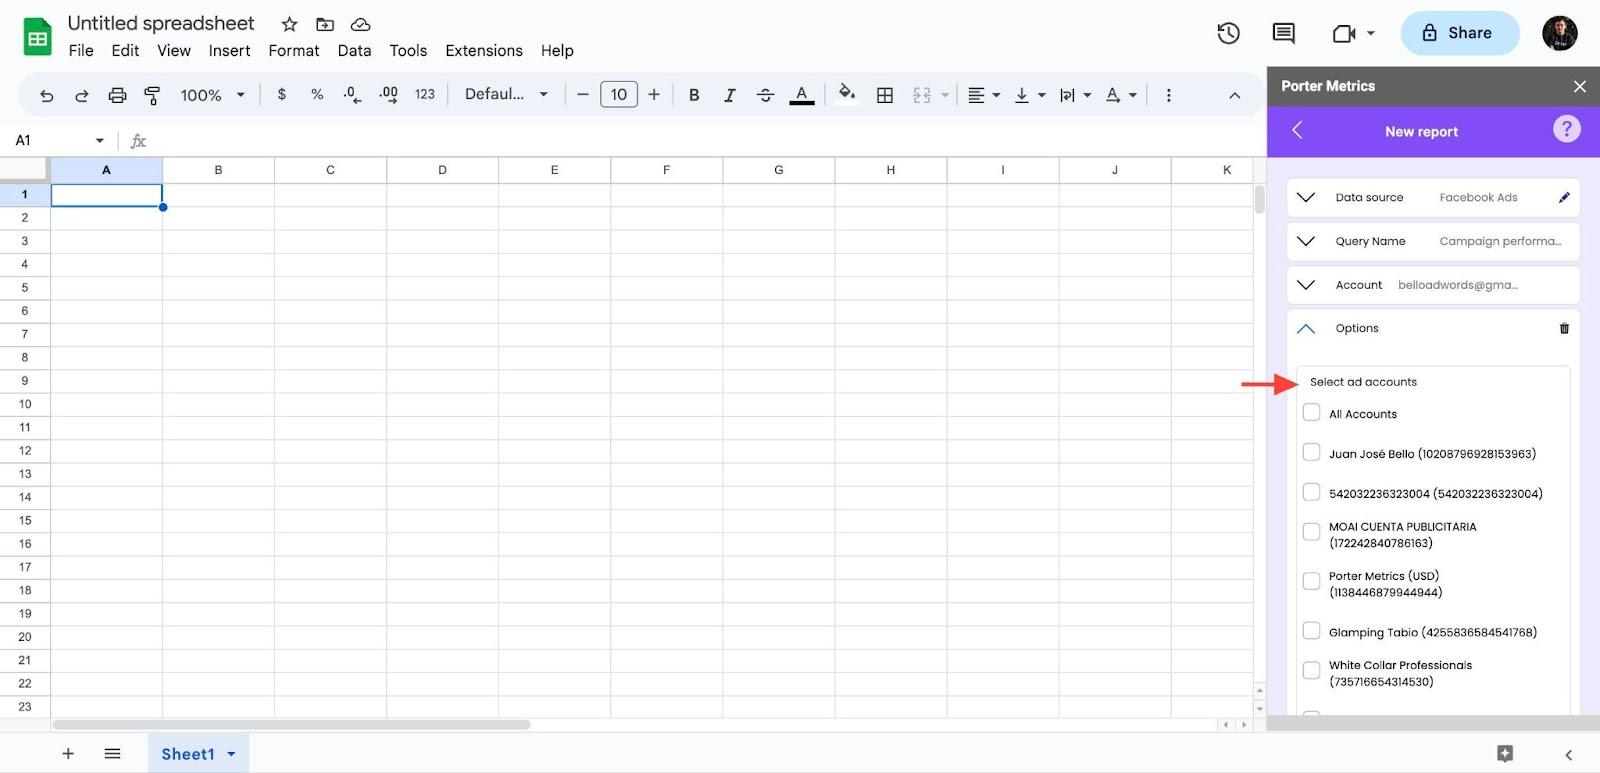
Step 5: Choose the Twitter Analytics you’ll import to your report.
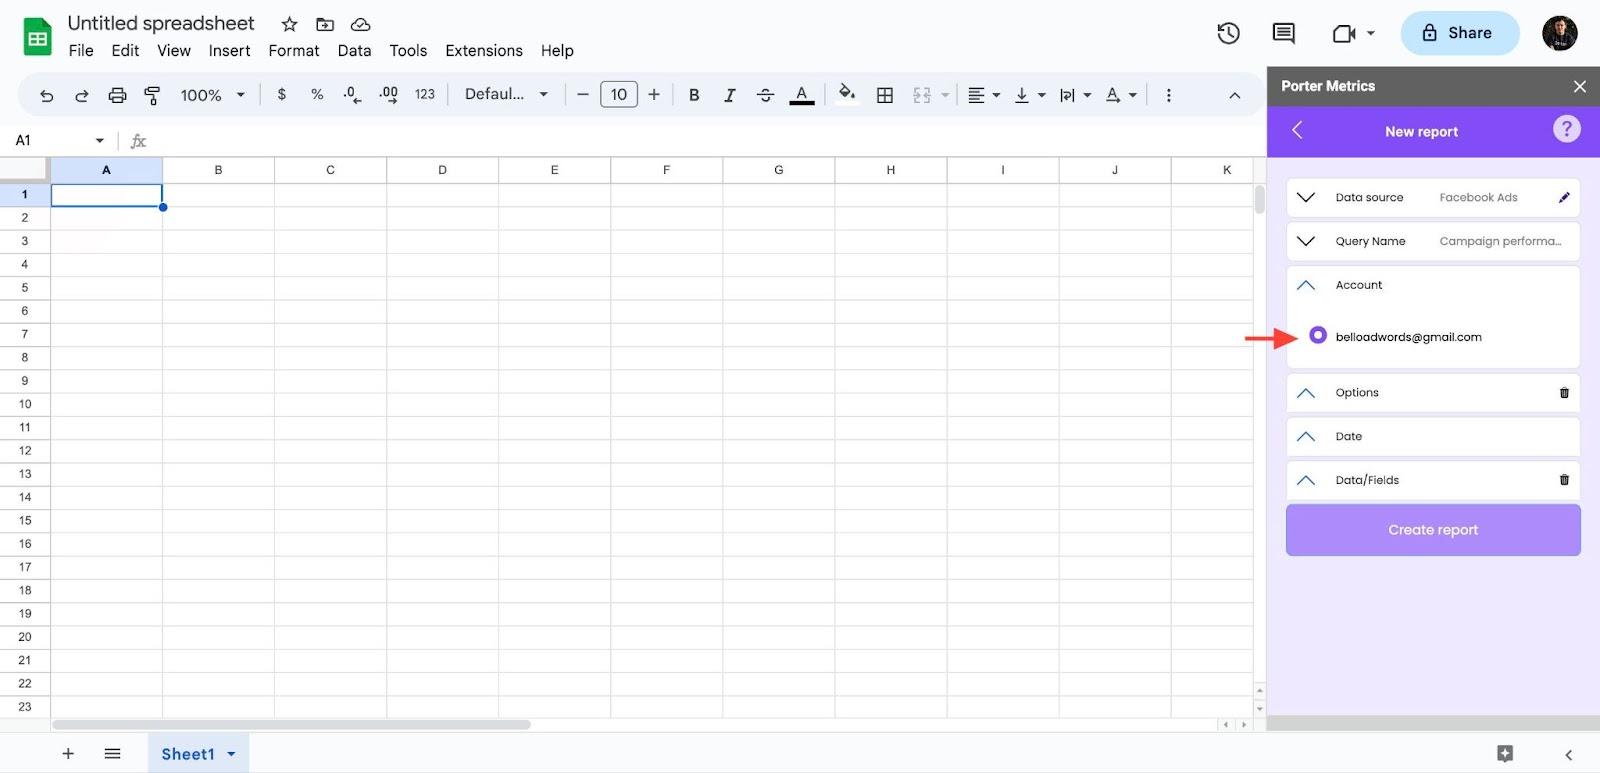
The Porter Metrics add-on lets you pull and combine data from multiple Twitter Analytics in a single query, quite useful for agency client monitoring or companies that manage multiple brands in different Twitter Analytics.
Step 6: set a dynamic or fixed date range for your report.
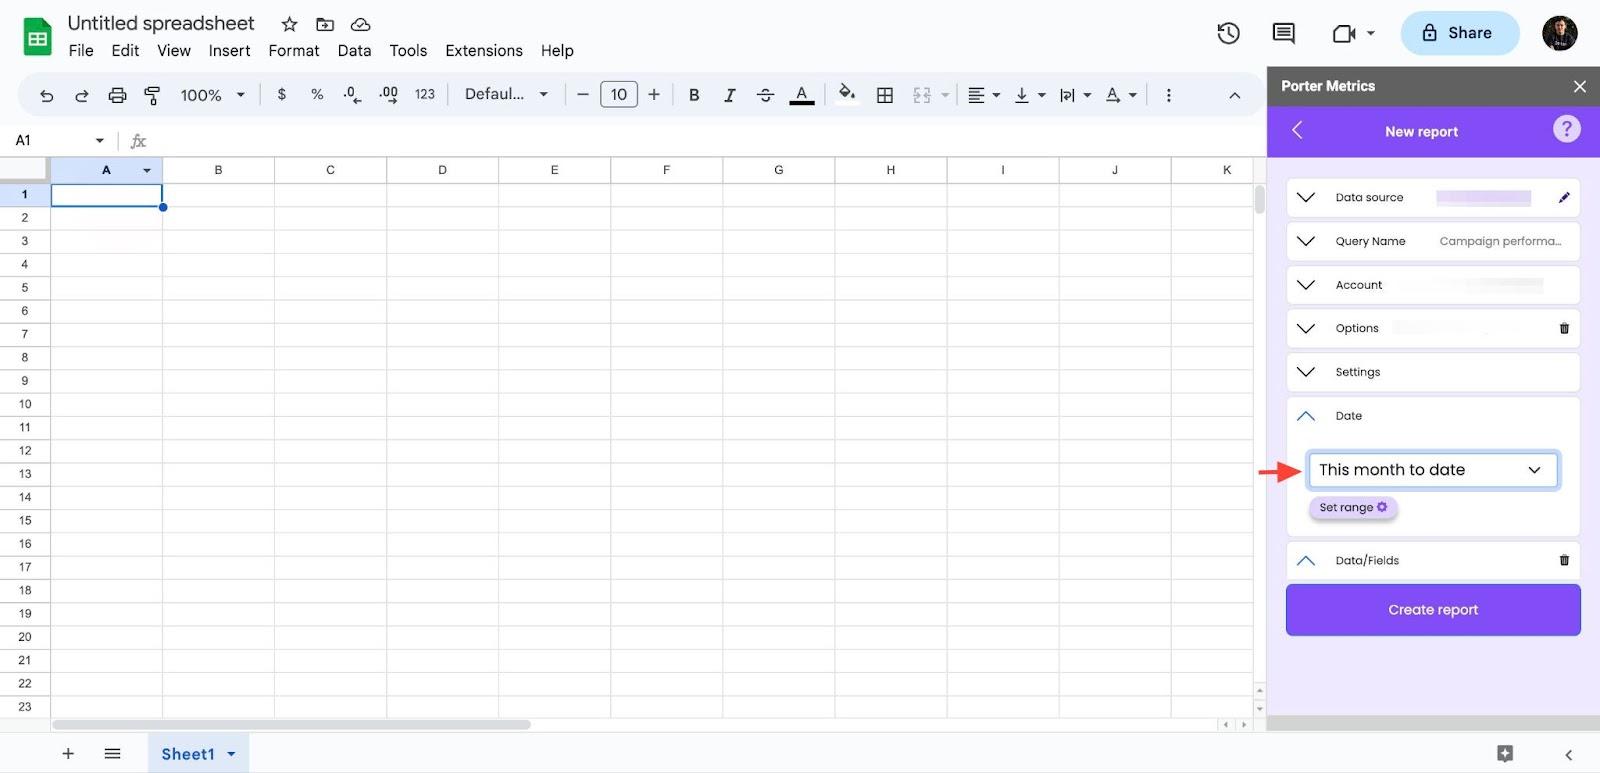
Dynamic date ranges refer to “Yesterday”, “Last month”, “This week” that will vary based on the current date; fixed date ranges are about defining a specific start and end date.
Step 7: Choose metrics and dimensions.
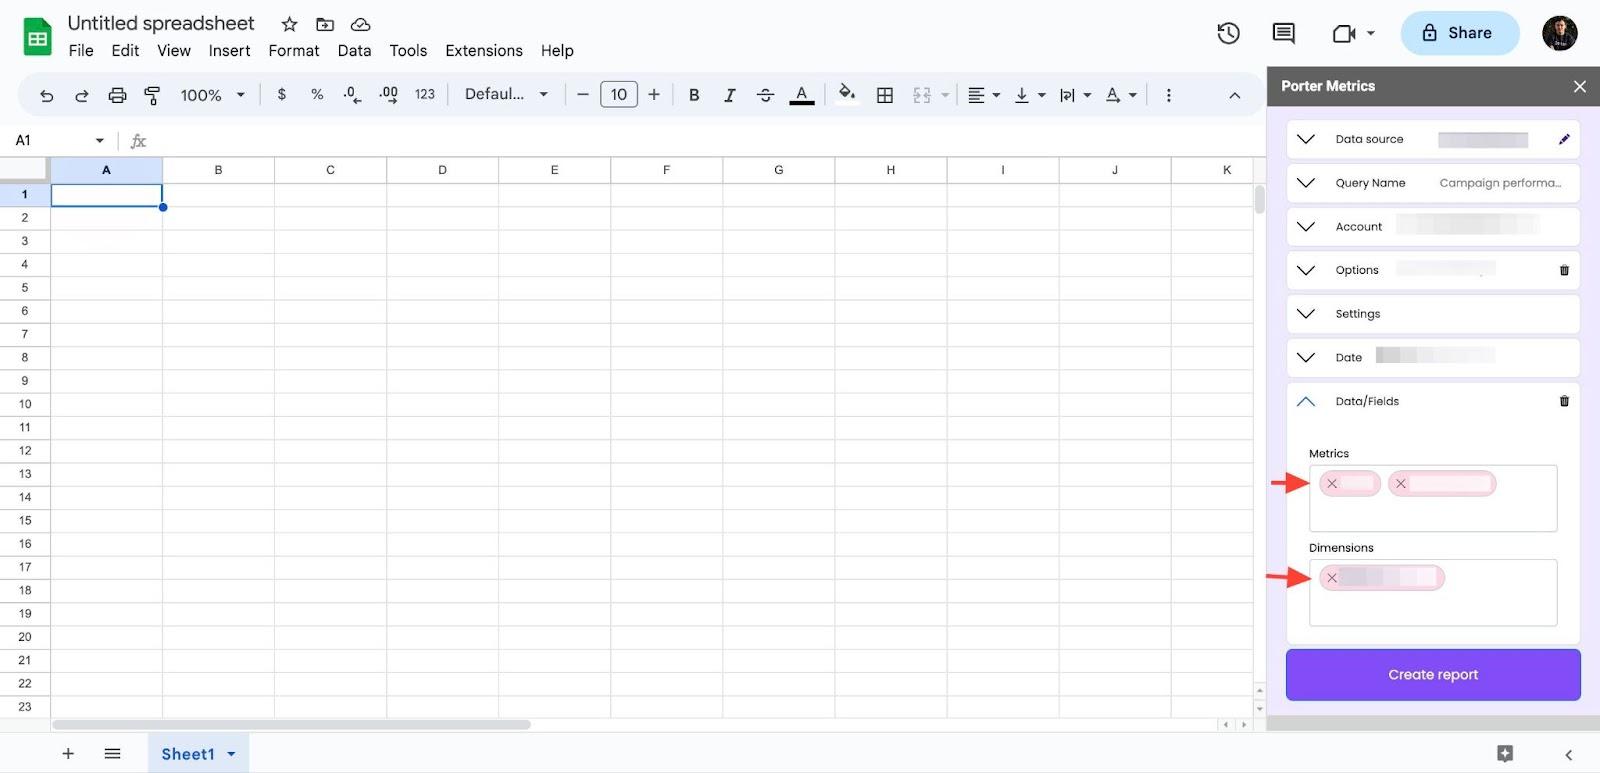
Metrics refer to the numbers. Dimensions are the way we can break down our data (by).
As metrics, select Tweets impressions or Teets replies
As a dimension, break down by Date.
Access all the Twitter Analytics metrics and dimensions available and suggested Twitter Analytics KPIs.
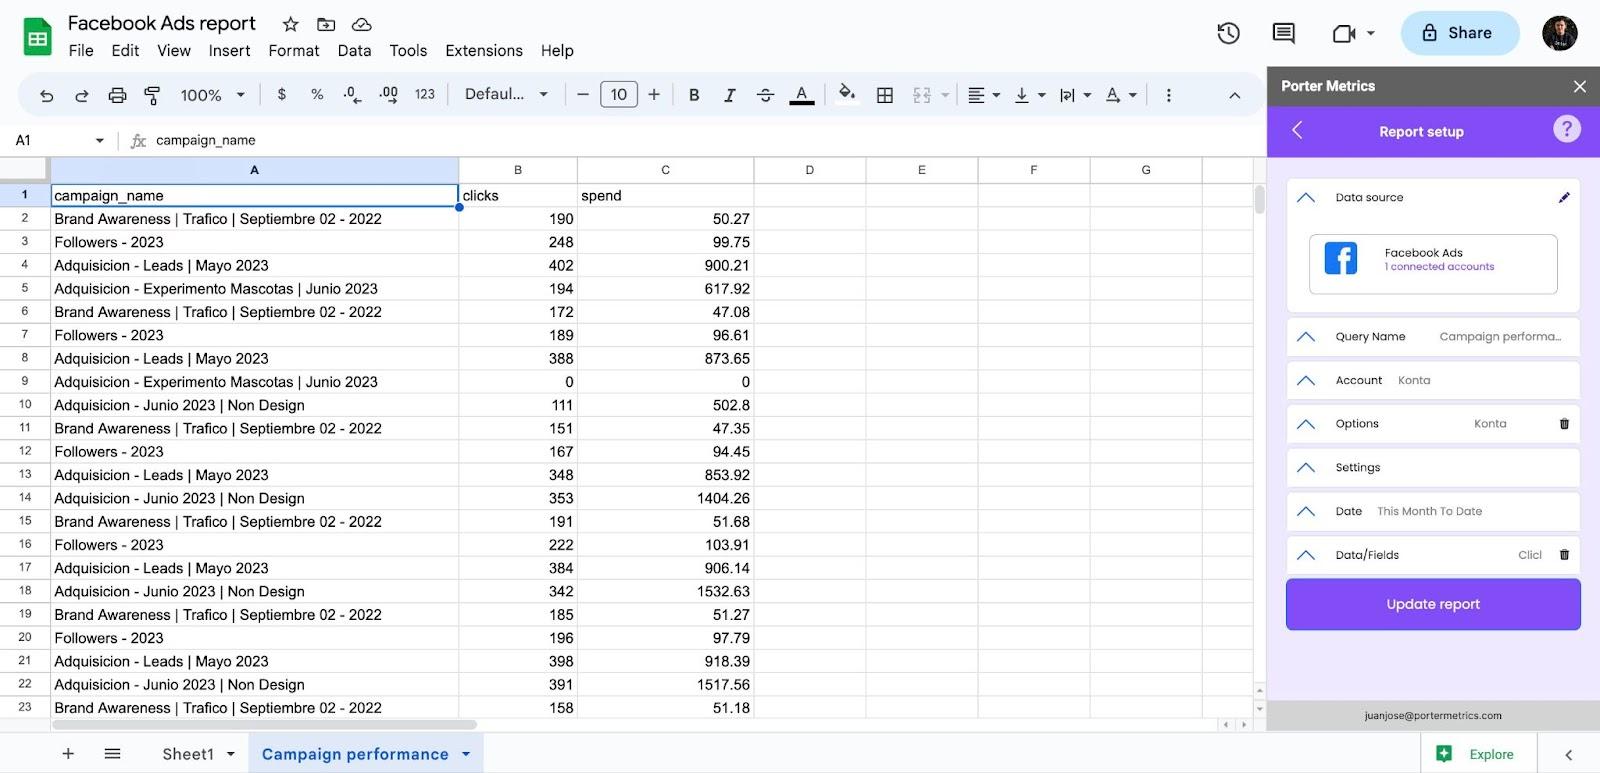
Click on Create report and wait some seconds to load your data on the selected cell.
Downloading CSV files from the Twitter Analytics manager
To import your Twitter Analytics data to Google Sheets (free forever), download your Twitter Analytics data as a CSV file from the Ads Manager and upload the CSV on Google Sheets.
However, this process is manual and you’ll need to repeat it every time you need a new query.
Schedule automatic data refreshes
Scheduling data refreshes on Google Sheets let you have your data automatically updated so you can monitor your Twitter Analytics data hourly, daily, weekly, and monthly.
Go to your saved queries and go to options – Schedule.
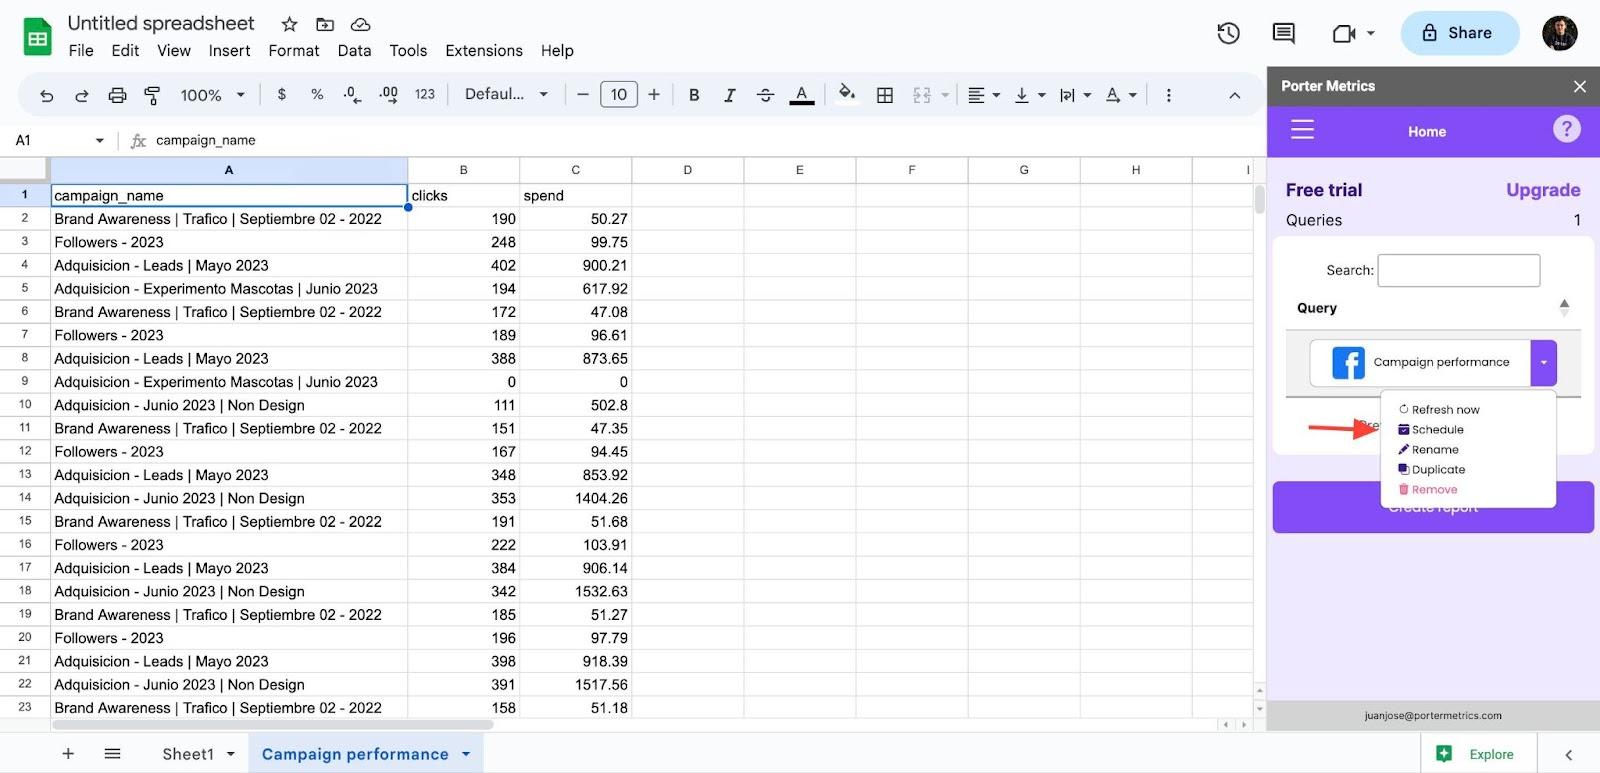
Enable or disable your schedule to turn on and off the automation.
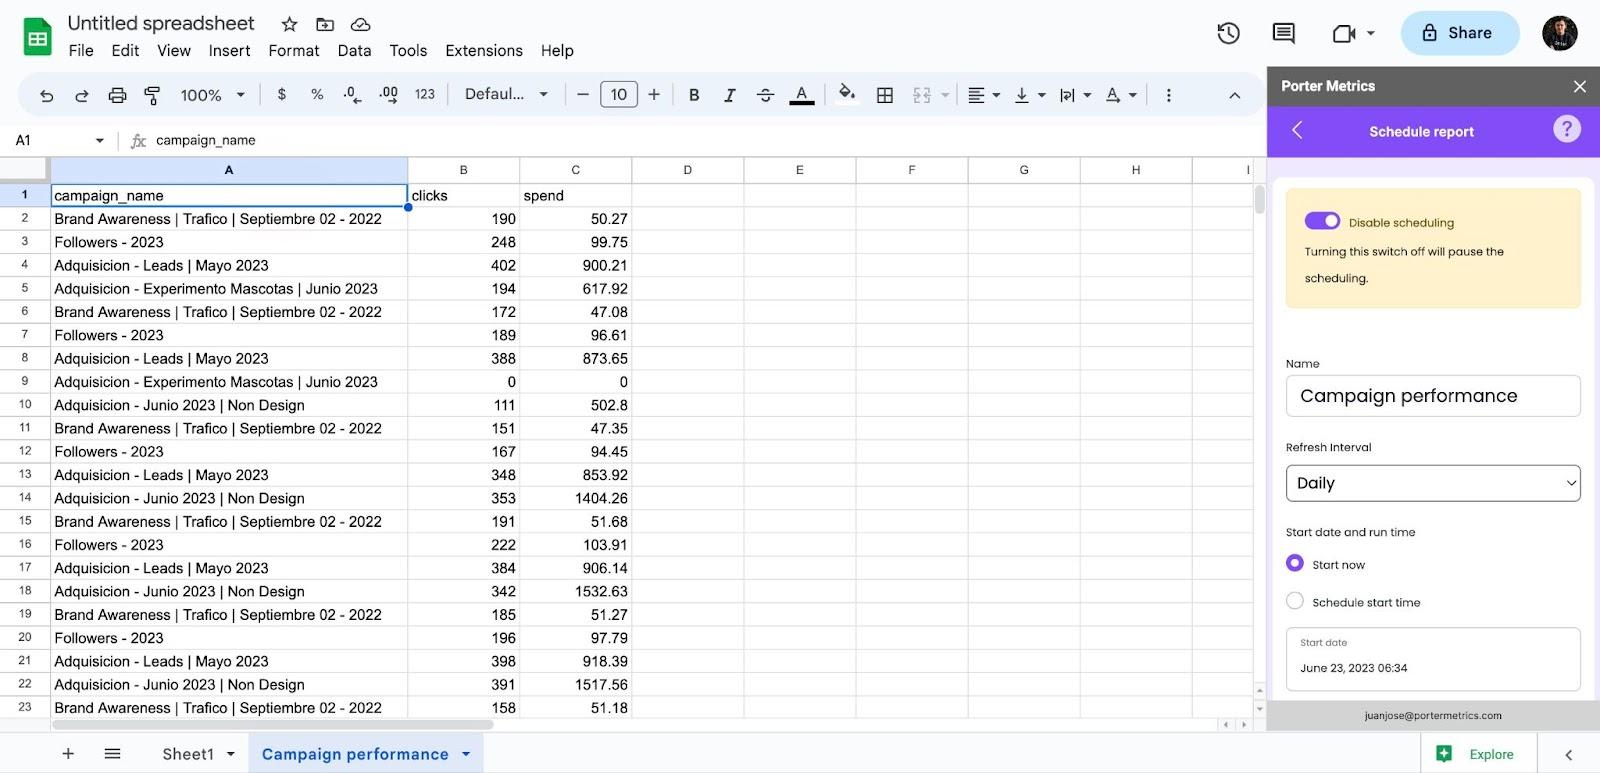
Set a refresh frequency (e.g. Daily).
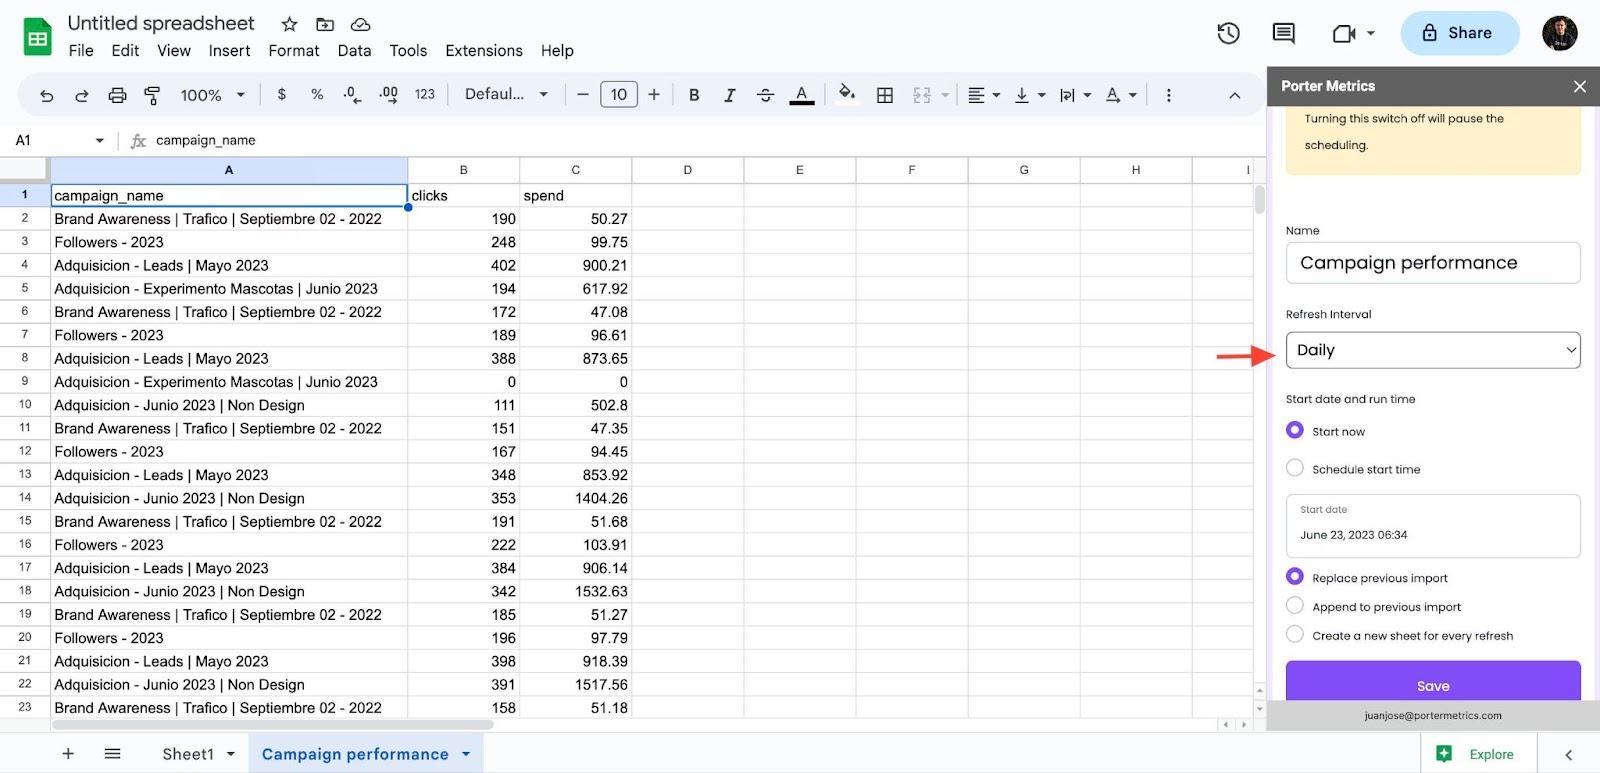
Set a start date (e.g. Now or Tomorrow at the same time).

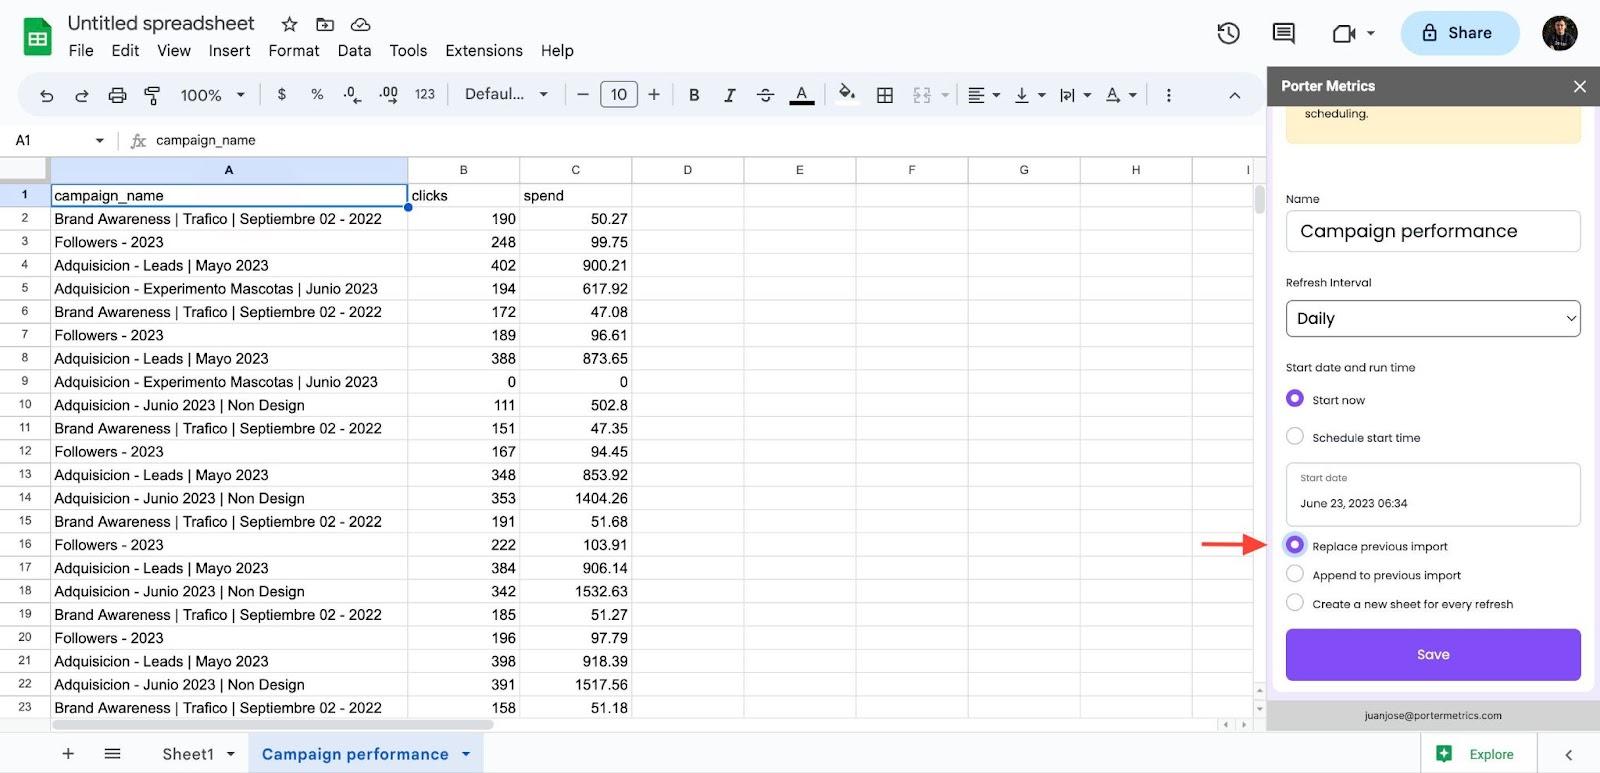
Choose an option to refresh your data.
- Replace previous import: new data overwrites old data.
- Append to import: new data will display in rows underneath the current data, useful to log and store historical data.
- Create a new sheet for every refresh: create a new Google Spreadsheet for every single query refreshed.
Free Twitter Analytics report templates for Sheets
Some Twitter Analytics templates for Google Sheets include:
- Twitter Analytics monthly report template (Soon)
- Social media tracking report template (Soon)
- Social media client monitoring report (Soon)
- Twitter Analytics KPIs tracker (Soon)
Google Sheets templates help you speed up your marketing reports setup.
To download a Google Sheet template, go to File – Marke a copy, and name the new copy.
To use them, notice first that the templates have two types of sheets: backend and frontend sheets.
Backend sheets contain the raw data that you can import and automatically refresh
with the Twitter Analytics to Sheets add-on. It’s like the database.
To sync your data correctly and keep consistency, make sure to create the query from the first cell (A1) that matches the metrics and dimensions suggested in the template.
Frontend sheets contain the user interface with the dashboards, charts, and text, meant to be accessed by your team or clients.
Just like in software, frontend sheets are fed by the backend sheets.
If you update your frontend sheets, make sure to keep the cells with the formulas calling up the backend sheets data to avoid breaking your report.
Customize your Twitter Analytics reports on Google Sheets
We’ll share some tips to make your Twitter Analytics data more useful for marketing data analysis.
Set alerts and notifications
Send notifications to your team via email or Slack when data updates for daily, weekly summaries.
With the refresh scheduling feature, you can automatically update your Google Sheets with your latest Twitter Analytics data.
Then, use Zapier or Make and trigger a new automation every time a Google Sheets row is updated or created, and send its data to Slack or via email.
Suggested tutorials:
- Automatically send a Slack message for new Google Sheets activity.
- How to send an email when updates are made to Google Sheets rows.
Visualize Google Sheets data on other tools
Once your data is on Google Sheets, you can quickly connect it to other tools for further analysis and better reporting and presentations:
Data Visualization and Business Intelligence:
- Connect Google Sheets to Google Data Studio (formerly Looker Studio)
- Connect Google Sheets to Microsoft Power BI
- Connect Twitter Analytics to Google Data Studio (directly)
Best for client and team dashboards and reports or performance monitoring.
Data presentations and slides:
Best for weekly/monthly team or client presentations.
Data warehouses (for dev teams):
Best for engineering teams to centralize companies’ data.
Track Twitter Analytics goals
Add context to your data by comparing it against goals or using conditional formats.
Suggested tutorials:
- How-To: Conditional Formatting Based on Another Cell in Google Sheets
- How to use conditional formatting in Google Sheets
Goals will help you add context to your data so your team and clients are aligned and they can tell if your marketing performance is good.
Twitter Analytics metrics and dimensions
As reference, see the Twitter Analytics fields list and suggestions for choosing Twitter Analytics KPIs.
The Twitter Analytics connector for Google Data Studio offers all the +100 metrics and dimensions available on the Twitter Analytics API.
Twitter Analytics mainly include fields about video, Tweets, and user profile data, including:
- Tweets: URLs, mentions, hashtags, replies, retweets, likes, and clicks for both promoted and organic tweets..
- Media: media views at 25%, 50%, 75%, and 100% for organic and promoted videos.
- Profile: username, followers, verification, profile image.
Custom Twitter Analytics metrics and dimensions
Often, you need to calculate your own metrics:
- You have a different way to calculate formulas
- Need to clean and filter data
- Need to combine from other data sources
To analyze Twitter Analytics data and get accurate marketing KPIs, customize metrics on your Data Studio reports.