Google Data Studio (formerly Looker Studio), which is now Data Studio, is one of the best and most effective tools for visualizing your Facebook Ads and Google Ads data.
You can add numerous sources in one report and blend them into a single stream for straightforward reporting. There are some questions that marketers ask often:
- What is our Customer Acquisition Cost?
- How is our paid advertising performing?
- How much budget are we spending on ads, and how many conversions do we get?
Answering these questions is fundamental, but answering is tricky. Most marketing blog posts talk about their relevance but a few talk about how you can do it automatically.
One of the main challenges is that to answer these questions, we need to bring multiple data sources together.
In this guide, I will show you how to blend your Google Ads and Facebook Ads data to know your overall digital ads performance.
You will understand how data blending and Google Data Studio work so you can replicate it with every data source. We will also solve some caveats of data preparation.
Blending Data on Data Studio
Using Data Studio can’t be overemphasized as a marketer, especially in today’s data-driven society.
As a digital marketer, Data Studio should be your best friend because, with it, you can use and blend data from different sources into a single dashboard.
And also efficiently manage the overall ad budget applied across various accounts and platforms. These can include data from Facebook, TikTok Ads, LinkedIn Ads, Google, and many other ad accounts.
And today, we will look at two ad platforms where we can blend their data for a harmonious report. Google Ads and Facebook Ads.
Google Ads is naturally integrated with Data Studio because it is a Google product.
But Facebook Ads would have to be connected using third-party connections; Portermetrics is the most well-liked (and reliable) of all third-party connectors, and you can easily add your Facebook ads to Data Studio.
This blog post will show you how to seamlessly blend Google Ads and Facebook Ads in Looker studio. We assume you already know how to add data to your data studio, so we will go into details here.
If you don’t know how to add data to your Looker data studio, please skim through this article to learn how to add data to Google Data Studio.
How To Blend Facebook Ads Data on Data Studio
We assume you already know how to add data to your data studio, so we will go into details here.
If you don’t know how to add data to your Looker data studio, please skim through this article to learn how to add data to Google Data Studio.
1. Setting up the Google Data Studio report
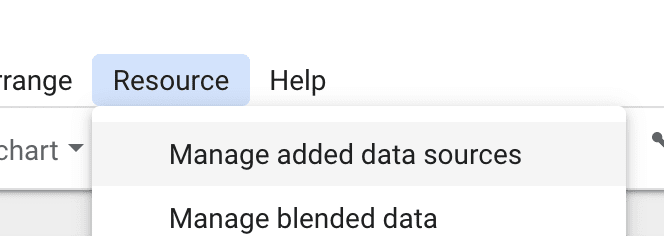
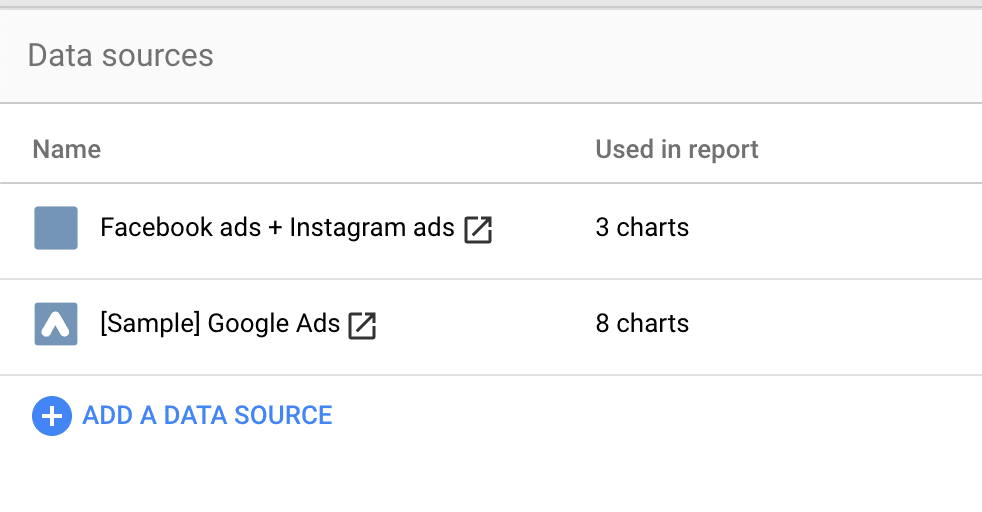
The first step is just about bringing both Facebook Ads and Google Ads data sources into a blank report. Go to Resources – Manage added data sources on your new Google Data Studio report.
Now, add the Google Ads and Facebook Ads accounts you want to combine.
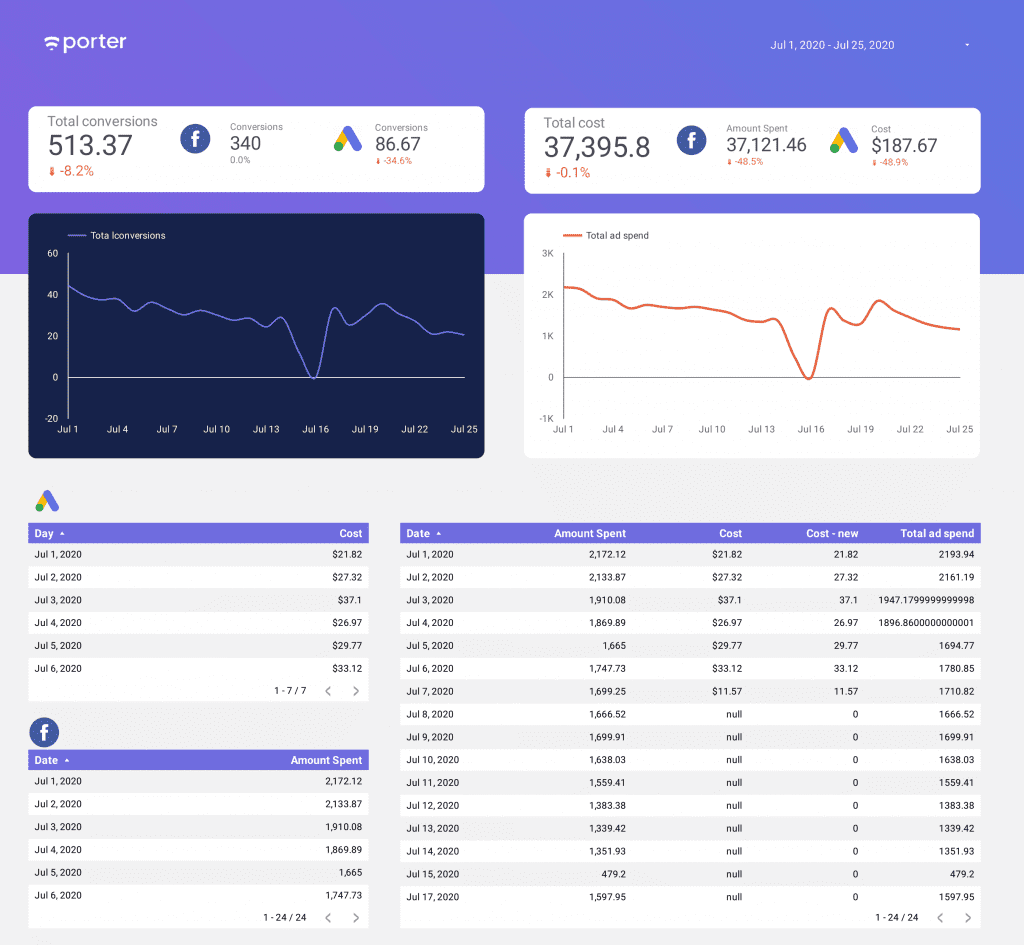
Close the data sources tab and let’s build our first visualizations. I recommend you to always use tables to validate how your data looks like and spot possible threats.
Create a table for each data source where the dimension is date, and the metric is the budget spent; on Google Ads it is Cost, and on Facebook Ads it is the Amount spent.
We will add more metrics like conversions once we test this connection. In this case, we have spent data on every single day for our Facebook Ads connector; we only have spent on Google Ads for 6 days during the chosen period.
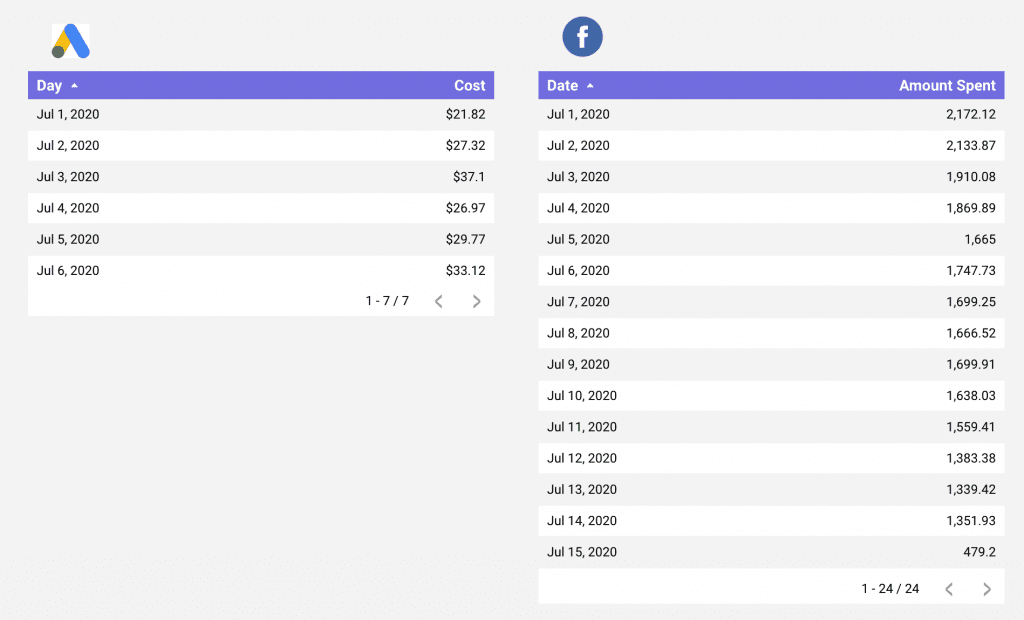
We want to combine each data source’s total daily spend when joining these tables. As such, most dates will remain the same, as there’s only spend from the Facebook Ads side.
2. Create a table with Facebook Ads data
Click “add a chart,” then select “table” and drop it into the dashboard. It loads up with a random metric and dimension, but you can change that in the setup panel on the right.
Now, this is a table with Facebook Ads data.

3. Create a table with Google Ads data.
Like with Facebook Ads data, click on “add a chart, ” select “table,” and drop it into the dashboard.
Automatically it loads up with a random metric and dimension, but you can change that in the setup panel on the right. Now, this is a table with Google Ads data.

4. Blend the data.
When we are joining two data sources, just like Facebook Ads and Google Ads, we need a common value to make sure such a union makes sense.
These values or fields are Join keys. Often, such join keys are IDs and dates. In this case, we will tell Google Data Studio that our join key is the date.
Click on “resources” followed by “manage blend data”

Click on “add a blend,” and then a window opens, and you can add more data sources.

Click “join another table,” and it will ask you to put in your data source. In our case, we choose Facebook ads. Then we put in the metrics and dimensions we want to see and track.

I chose this process because you get to see what you are doing, compared to just clicking on blend data in the setup panel.
Both processes do the same thing, but going through “resources” gives you a better and broader view of your data.
5. Choose a join (I’d recommend a left join).
You would see different types of ways you want your data to blend. We have Left Join, Right Join, Inner, Full, and Cross.
All present your data in different ways. But for this one, we are going to use the Left Join.

And also, when combining data from just two data sources, it’s advisable to use left join. Once we have a Join Key, we can add the metrics and dimensions that we want to combine.
You can customize this union at any time. In this case, we will only bring the respective spend metrics from both sources. Now, set up the table to display your data like this:
You can add filters to your blended data to only have exactly what you want. If you look down, you will see “Add a filter” click on it to filter your data and finetune your report.
6. Add filters.

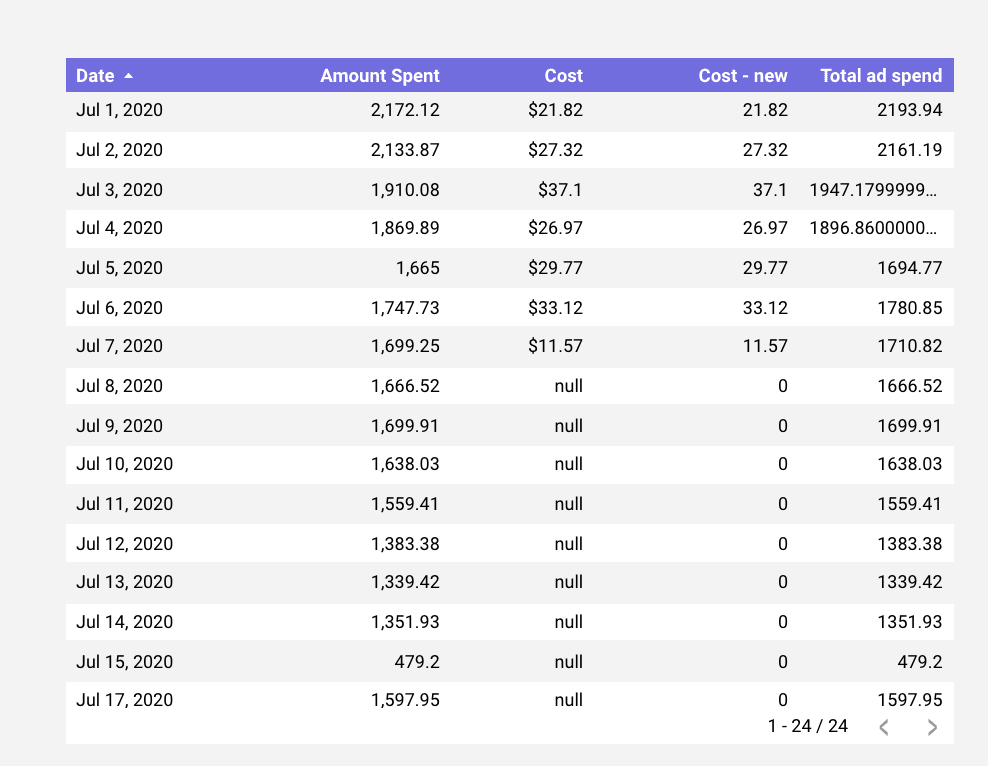
7. Troubleshooting null values on Data Studio with nary_max
This is for you if you struggle to blend data from two data sets. You encounter this problem when one of the data sets contains a NULL value, which causes the sum to be calculated incorrectly.
The solution to this issue is to use the NARY_MAX function. The goal is to transform these null values to 0, so there’s an actual number we can operate.
You can use the following formula to do so, copy and paste this formula: NARY_MAX([FIELD],0)
The new table will look like this! Once we tested this formula work, we will create a new custom field that combines Amount spent and the transformed Cost.
Copy and paste this formula: Amount Spent+ (NARY_MAX(Cost,0))
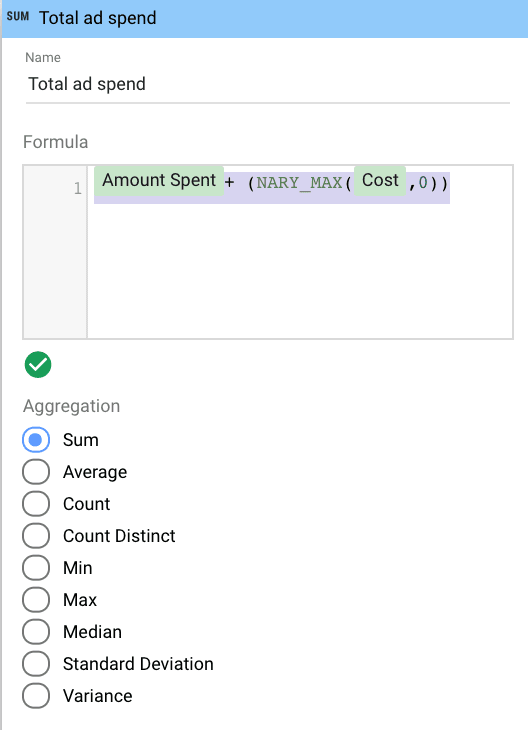
Our new Total ad spend is working perfectly!
8. Create custom metrics
You can create custom metrics that fit your goals. For example, you could want a metric that divides purchase history by clicks.
To create a custom metric, go to “resources” and click on “manage added data.” A window pops up with all your data in your report, which will be Facebook ads and Google Ads.

Click on edit in the data source you want a custom metric for. For us, Facebook ads. So we click edit on Facebook ads. Then click on “Add a Field,” which opens up a new window.

You can select the metric you want to work on and create a formula that makes that metric different. Click on “save” when done and “Finished” when done.

9. Download the Facebook Ads + Google Ads report template

Portermetrics has enough templates you can use to create a blended report. You don’t need to start from scratch when adding visuals to the chart.
All you have to do is add your data which is Facebook ads and Google ads and that’s it. All that’s left is just for you to modify the template with your actual data.
How To Blend Data Sources on Data Studio
1. Connecting The Data Sources
As stated earlier, add the two data sources you want to blend. There are multiple ways to do this.
You can click on “Add data” to add a data source or click on “resources” and “manage added data” and then click on “add a data.”
Basically, wherever you look on Data Studio, there are options for you to click and add a data source.

2. Choose your charts
Next is to choose how you want your data to be presented. Pick from the list of charts present in Data Studio for you to use in your report.

3. Blend data
Next is to blend your data. It’s exactly like what we did earlier. Click on “resources” followed by “manage blend data” click on “add a blend” then a window opens up, and you can add more data sources to it.
Click on “join another table” and it will pop up asking you to put in your data source. This is also where you can manage blended data.
4. Create a combined blended data chart
Now that you’ve blended your data, you can create a chart or charts that now has your combined data in it. As you can see, we can see blended data in the setup panel.

Pick any dimension or metric from there and drop it in the dashboard. Next is to select which chart you want to use to present the data. That’s all.
5. Checking & Fixing The Blend
You can check if your blended data is working fine. This is more of a quality check to ensure there are no issues with the data.
If there is, you can always go back to the “Field” and figure out what went wrong, or better still contact Portermetrics and we will guide you on the right thing to do.
7. Blending More Than Two Tables
You can blend more than two tables to a maximum of 5. So, if you need more data from other sources to correlate your data, you can always add it.
A blended can have data from Facebook Ads, Google Ads, Google analytics data, Twitter Ads, and YouTube Ads, giving you a broad and important view of your ad performance.

Tip: You should blend the data using the “manage blend data” located in the “resources tab”
Data Studio Data Blending Examples
These are some examples of two or more data blended together to provide a general detailed overview of preferred data.
To blend two or more data, follow the tips we’ve shared in this article. You can also use some of our templates, so you don’t have to start from scratch.
1. Blend Facebook Ads with Google Ads

2. Blend Google Search Console Data Sources
You can blend multiple websites’ data or the same data in two different tables. It all depends on what your goal is.

3. Blend Google Ads Conversions with Google Analytics Goals

4. Blend Google Search Console with Google Analytics
As stated earlier, go through “manage a blend” in the “resources” tab and add the data source and the dimensions and metrics you want in the report.

Steps to Data Blending With Multiple Data Sources
1. Establish Your Goals
What’s your reason for data blending in the first place? What do you hope to achieve?
Answering all these questions will help you know what data you want in your report and how to go about it. Establish the report’s reasons and goal before adding the data source.
2. Obtain All Relevant Data Sources
You now know what goal you are trying to achieve, next is to find the relevant data source with the KPIs you need.
Let’s say I run an Ad on Facebook and Twitter for my website but I want to know the clicks from Facebook.
That means I would use Facebook and my landing page as the two data sources. I don’t need to integrate Twitter unless I need a data source from Twitter.
3. Ensure All Data Is Clean
One of the most precious assets a company can have today is data. Data describes the market intelligence that both large and small companies can gather about their clients and their market.
It can therefore make or break your business. It should not be surprising that data tends to change with time. Addresses and phone numbers change as people age.
Your data will become old and useless as a result of all of these events, so you have to clean it adequately and update it regularly with the right information.
While properly cleaned data is extremely valuable to your company, unclean data might cause you a wide range of consequences and complications.
Make sure you are not just using data but you are using the right data.
4. Join Your Data
Join as much data as you needed for your report. Only data that will help your report should be added so as to make it easier to understand.
5. Generate Visualizations/Reports
Lastly, generate the necessary visualization to make your report stunning with charts, tables, geo maps, themes, etc.
The end goal of your report should be to make it stunning with all the necessary data (no fluff or technical jargon) and at the same time, easy to comprehend.
Connecting Facebook Ads to Google Data Studio
If you haven’t try our Facebook Ads connector for Google Data Studio. We also have a full setup guide to report Facebook Ads on Data Studio.
Connecting Google Ads to Google Data Studio
Google Data Studio has a free connector for Google Ads. You only need to the Google Data Studio connector gallery and connect from there. Also read: Installing Google Data Studio templates: Google Ads
Google Ads + Facebook Ads Google Data Studio report template
We built a free Google Data Studio template that combines Facebook Ads and Google Ads data. With this tutorial, you can create your custom formulas to combine the metrics that you set as conversions in both platforms.
Conclusion
We’ve just shown you how to blend Google Ads and Facebook Ads data in Data Studio.
As you can see, the article was straight to the point, so you can always use it as a reference when data blending from two or more data sources.
The same principle applies when blending data from other sources too.
This post is informative enough, but if you still need help with data blending, you can always reach out to us any time, any day. We are always available 24/7 to answer your needs.
Frequently Asked Questions
How many data sources can you blend in Data Studio?
Five. You can use up to a max of 5 data sources.
What is a joining key?
A join key is a group of fields that specify which records should be included in a blended data source. Each component data source in a blended data source must share one or more dimensions, known as a joining key.
How many join keys does Looker studio have?
Five. We have Left outer join, Right outer join, Inner join, Full outer join, and Cross join.
Are there templates for blended data?
Yes. Porter Metrics has more than enough templates for all your data blending.
What are the dimensions and metrics in Data Studio?
Dimensions group data, and each dimension in a chart provides increasingly intricate details. Metrics in charts are always total numbers, and the extent of totaling depends on whether or not there are any dimensions.