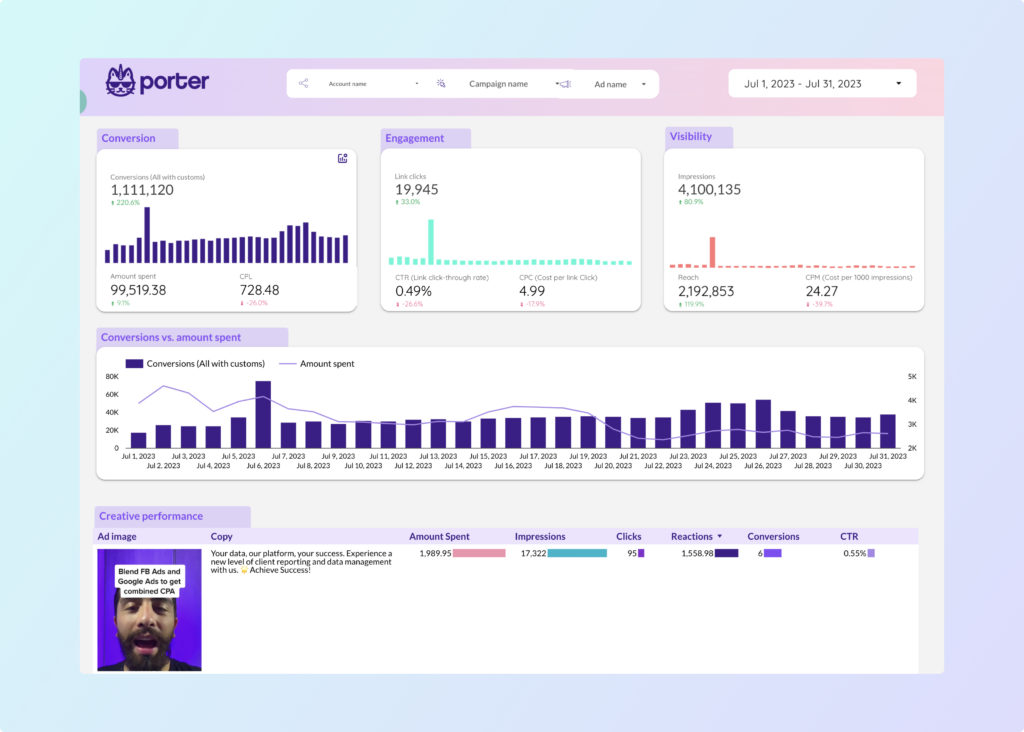
Impressions, reach, CPM
CTR, Clicks, CPC, Video Play Through Rate
Custom, Leads, CPA, ROAS
Ad image, name, and copy
Campaign Name, Ad Name, Objective, Type
Placement, Device, Region
Includes custom fields
Set up once, and let your data be refreshed everyday
To create a Facebook Ads report, follow these steps:
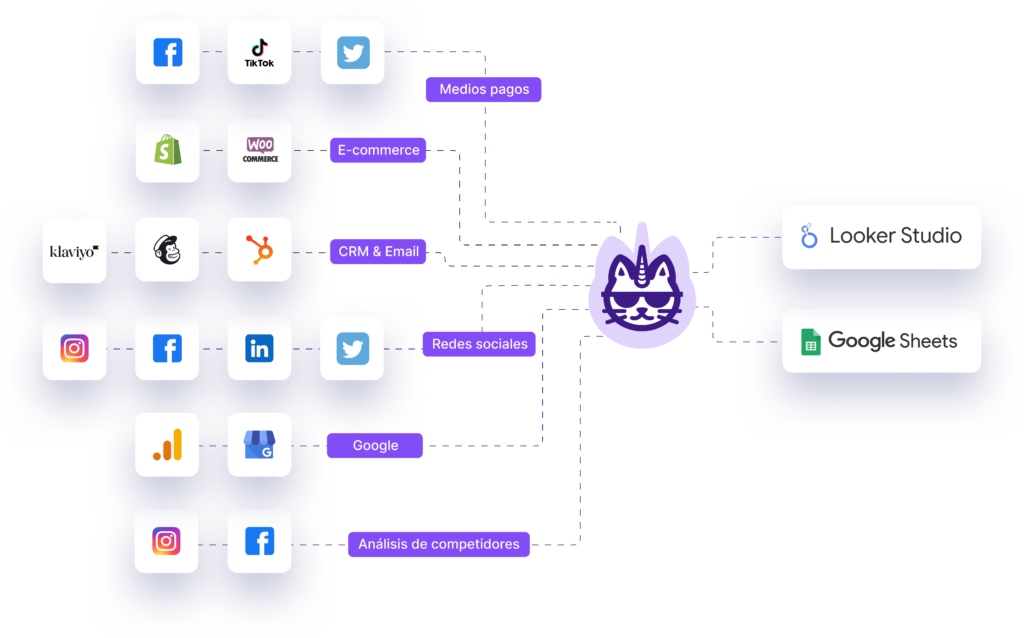
Connect all your marketing data once and let it refresh everyday on the tools you already know
Integrations and storage without an engineer.
To get actual total conversions, ad spend, engagement rates, CPC, ROAS, CPA.
With brand colors, logo, icons, and text
Choose from a dozen of chart types in a single view, or a menu with multiple pages
Segment by campaign name, objective, type, conversion name, creatives, audience.
To get accurate marketing KPIs and a single source of truth.
Blend Facebook Ads + Google Ads with GA4
Combine traffic data from GA4 with Facebook Ads to fully map your funnel from ads to actual conversions
Blend with other ad platforms
Blend UTMs from Facebook Ads and your CRM or E-commerce to know the actual conversions and revenue generated from ads
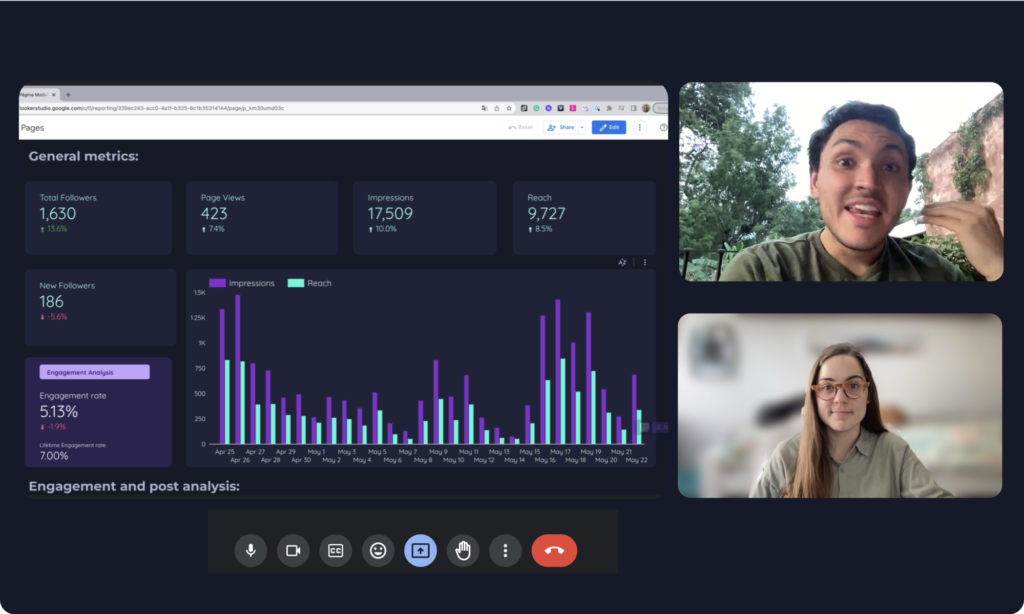
Share and present your Ads reports with your team and clients
Schedule email deliveries
Send daily, weekly, or monthly snapshots on a
Share links with view or editor access to collaborate faster
Download a PDF version of your reports for clients who are not familiar with Looker Studio or Sheets
Unlimited, free support via chat, email, and calls
We hire marketers to do customer support or book calls with our founders to personally:
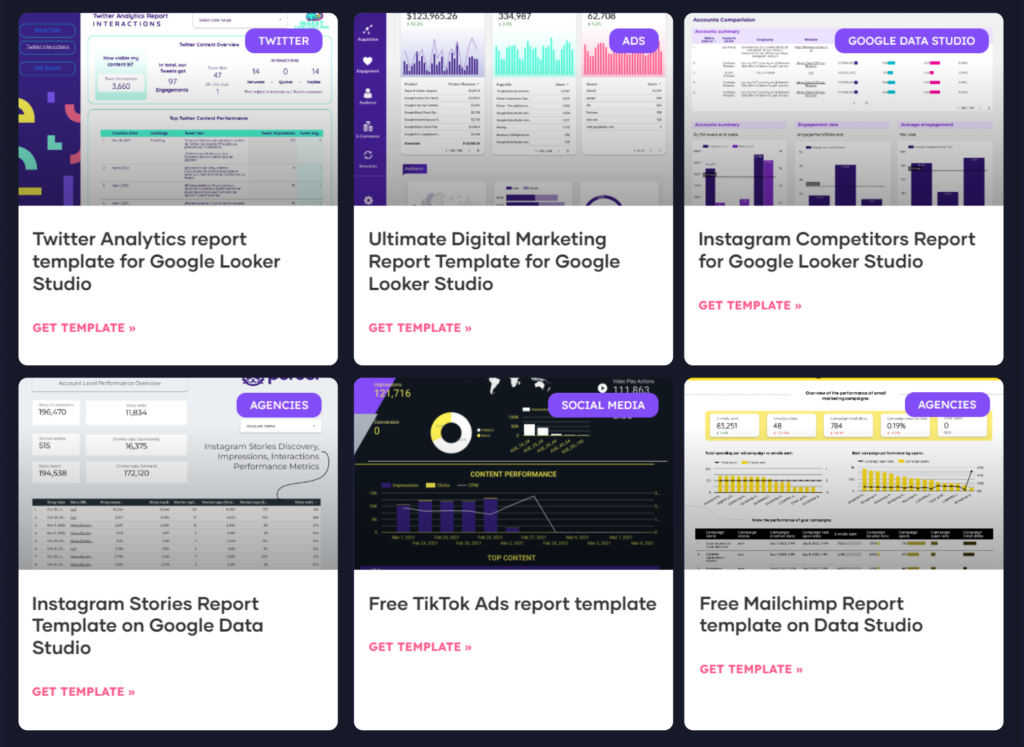
+100 free templates and tutorials
Simple, fair pricing
Speed is doing the right things fast. Make it your competitive advantage with no-code data.