In the previous lesson, we talked about Google Data Studio dashboards examples for marketers.
In this lesson, you will learn about the Google Data Studio connectors and data sources, or how to import data into Google Data Studio.
There are some nuances that will put you ahead of people with basic knowledge of Google Data Studio. These are the topics we will review:
- What is a Google Data Studio connector?
- How to import data into Google Data Studio
- Google Data Studio connectors gallery
- Setting up Google Data Studio connectors
What is a connector on Google Data Studio?
There is no obvious standard name for some concepts within the Business Intelligence ecosystem.
A connector, on Google Data Studio, is the app that lets you connect a data source to be visualized on a dashboard. Some people call them taps; some others call them plugins or data sources.
So, instead of asking how to import data into Google Data Studio—like your CRM or email marketing data—, you can ask, instead, if there’s a connector for it.
How to import data into Google Data Studio?
Let’s see how you can connect your data on Google Data Studio. You can bring virtually any data to Google Data Studio. The question may be the cost, the complexity, or the availability of such data.
You should first know that Google Data Studio—and visualization tools like Tableau or Power BI—don’t store data. As their name suggests, they’re meant exclusively to visualize it.
To connect your data to Google Data Studio you have three options (or three types of connectors):
- Developing or using a direct connector
- Migrating your data to a sheet or CVS
- Migrating your data into a database or data warehouse
Direct connectors
I think that the best way to import any data to Google Data Studio is by using a direct connector.
Data Studio doesn’t refer to them as “direct” but I find it useful to distinguish them like that.
A direct connector is what lets you bring the data directly from an app like Facebook, Asana, Hubspot, and so on to be reported on Data Studio.
There’s no intermediary here. The data goes from these apps directly to the data visualization tool. But how is it possible?
You can connect to these apps through their API.
An API is a service that lets you interact with an app to extend its functionalities. If you’re familiar with Zapier, they connect to all apps APIs so they can enable integrations and automation.
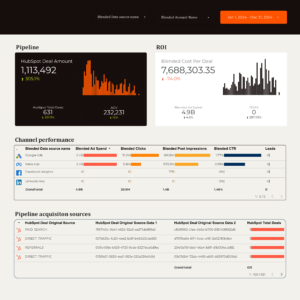
For instance, if you use the Porter Metrics Facebook Ads connector for Google Data Studio and create a report, every time you create a chart like an ad spend by day, the connector interprets it as a query that requests to the Facebook API.
The Facebook API, like most APIs, returns such a query as a JSON format that Porter will translate in a way that Google Data Studio understands to retrieve a visualization.
So, there’s no need to store data when you only need to communicate directly with an app to request a specific set of data when you need it.
If you’re not familiar with web jargon or technology it may sound complex at first.
You don’t need to worry though about those technical aspects. Providers like Porter build these connectors so you can send your data in a few clicks.
Some of the cons of direct connectors is the fact that someone has to build them, and most apps don’t offer such connections. That’s the problem we’re solving at Porter.
Migrating your data into a sheet or a CSV
Google Data Studio offers a free connector for Google Sheets, so if you have any data there you can visualize it. Just as Data Studio offers a connection to Google Sheets, Microsoft Power BI offers a connection to Excel.
So a quick turnaround to report any data is that you can export it from an app into a CSV or Google Sheet that you can connect on Google Data Studio.
This method is “fast” and easy to implement.
The only con is that it’s a manual, repetitive process; if you want to update the data you need to repeat the process of exporting the data and updating the worksheet you have connected to Data Studio.
In further lessons, we will see how you can connect a Sheet on Google Data Studio. Our CRM dashboard template is an example of a Data Studio report built with Google Sheets.
Migrating your data into a data warehouse or database
The third option is more suited for developers and companies with an stablished BI or IT department.
In this case, you should migrate your data into a database like PostgreSQL or MySQL, or a data warehouse like BigQuery, to then create tables that you can connect on Google Data Studio.
Having said that, this is the strongest reason I believe Google Data Studio is free: Google encourages larger companies to use and pay for BigQuery.
In this course, we will also review the basics of BigQuery; if you’re a marketer, it will help you level up your skills in data analysis.
Exploring the Google Data Studio connectors library
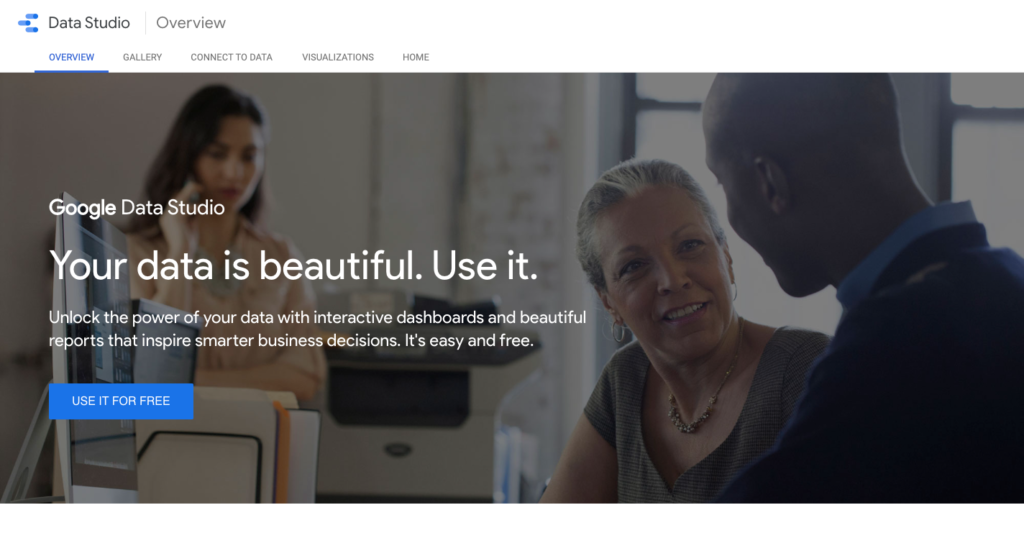
If you’re already wondering how to access all these connectors, you can do it on the Google Data Studio, just visit the connectors library.
To help you go through it, I made this video for you, browsing the library.
You may be wondering how these connectors work, and they’re straightforward.
When using a connector you first need to authenticate your account from that app connector.
If you want, for instance, to link your Facebook Ads account, you need to signup with Facebook so Google Data Studio can retrieve the ad accounts associated to your personal profile.
If you have a Shopify account it’s the same. You first need to associate your Shopify account so you can continue with the setup.
Once you connect your accounts, you will be able to bring the data from those apps to Google Data Studio.
Types Of Connectors
Data Studio offers two types of connectors:
- Google connectors
- Partner connectors
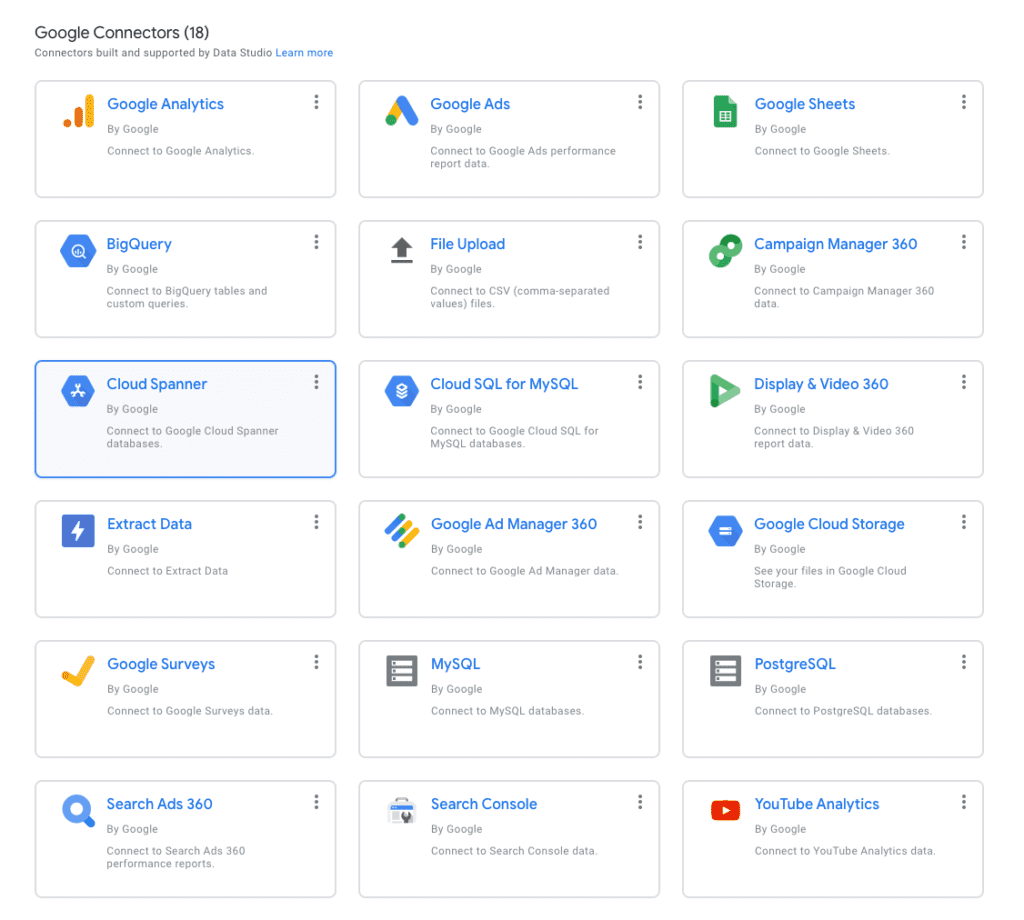
Google connectors
Google offers native connectors to its core products. You can connect for free to services like:
- Google Sheets
- Google Analytics
- Google Ads
- Google Search Console
- Youtube
- Google Campaign Manager
- BigQuery
- MySQL
- CSV
- Extract data (here’s an awesome tutorial about this one)
- Google Surveys
And more.
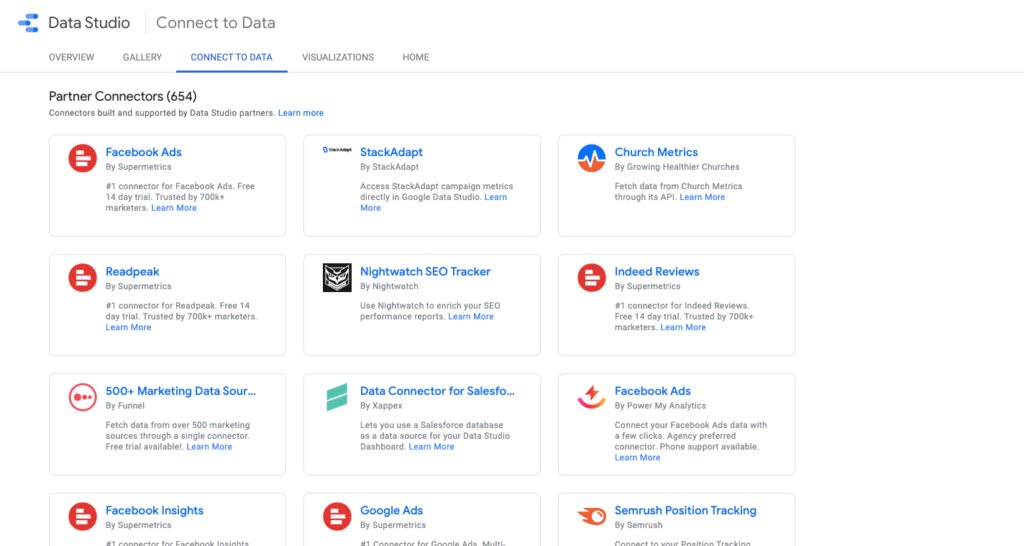
Partner connectors
Partner connectors are generally paid as most of them are built by companies like Porter that connect to data sources that Google doesn’t offer by default.
At this time there are +300 partner connectors, including some like:
- Porter Metrics, which offers connections for Facebook Ads, Facebook Insights, and Instagram Insights. You can find our upcoming connectors on our product roadmap.
- Jepto, a PPC budget software that offers free connections for Google My Business.
- Supermetrics and Funnel.io, offers dozens of connections for multiple marketing data sources.
- Cooper, a CRM that offers a native connection to let users create reports with customer data on Google Data Studio.
- Data.world, which unlocks public datasets on current societal affairs.
- DeepCrawl, which lets you analyze your technical SEO data.
Setting up a connector on Google Data Studio
Connecting to any data source works pretty much the same.
You may go to Google Data Studio and click on create. You can choose between adding a new data source or a new report. In both cases, you will go to the connectors gallery.
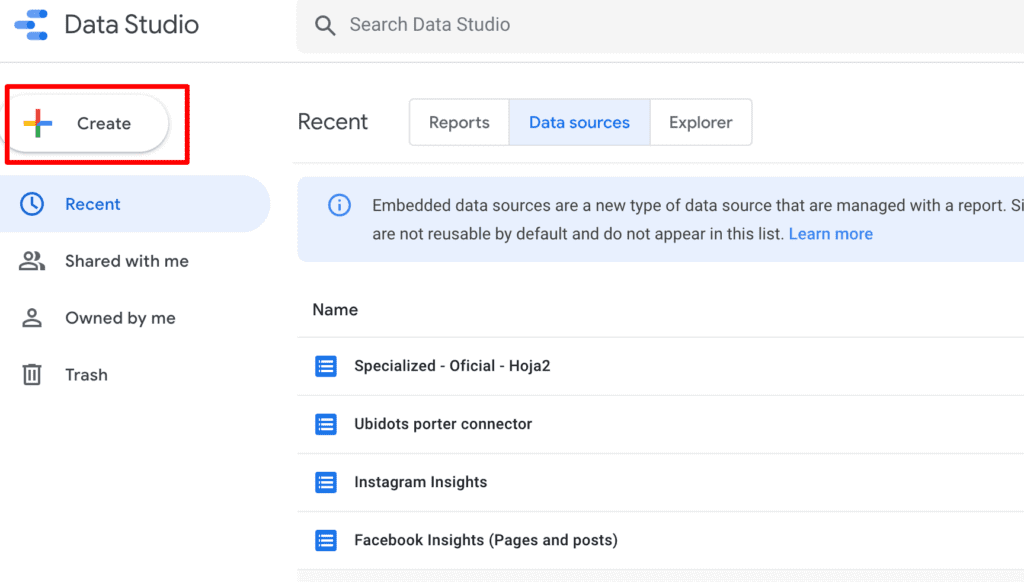
In this case, I will choose a new report so we can visualize data right away.
You will find the Google Data Studio connectors gallery.
Most people ignore this but you will see two options: connecting to a new data source from scratch or add a data source that you have connected before by choosing Connect to data or My data sources, respectively.
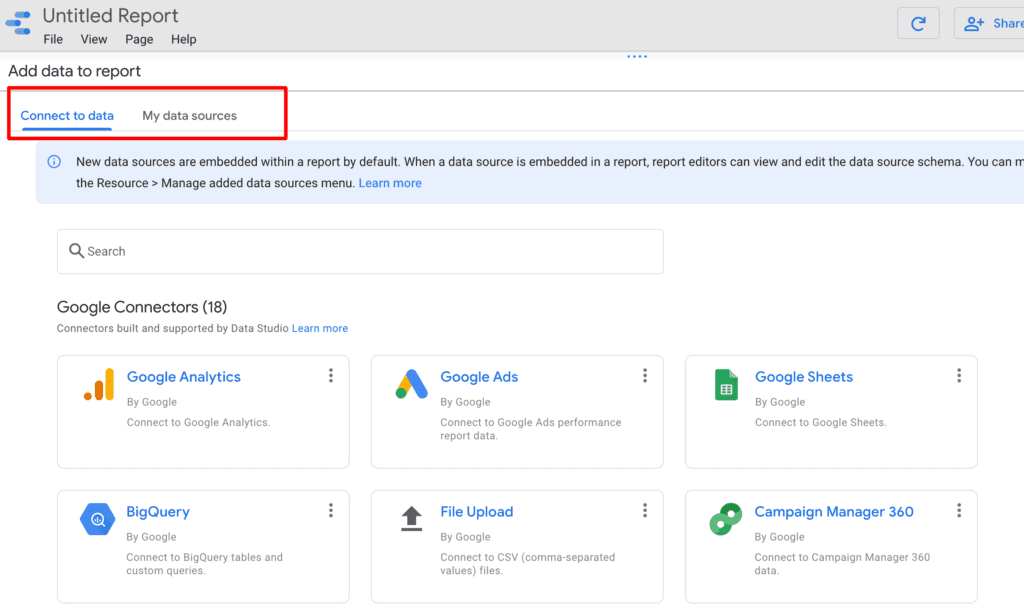
For the sake of exploring I will start with My data sources.
You will find the data you have connected before with the same setups.
But I want to show you a quick trick if you don’t have data to visualize but want to build dashboards mockups:
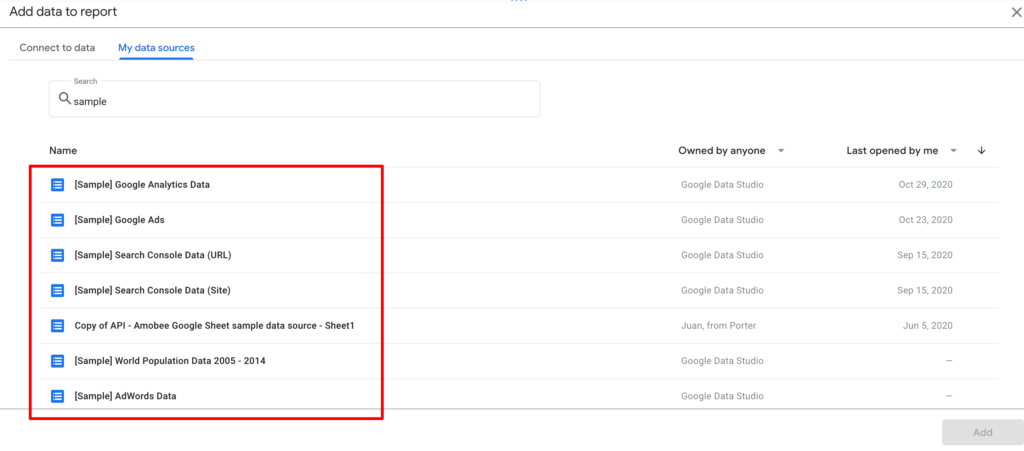
Type on the search bar “Sample” to see all the sample data sources, such as Google Analytics, Google Ads, and Google Search Console demo accounts.
If it’s your very fist time on Data Studio or you don’t have accounts for those apps, I suggest you to start with those sample accounts.
However, I will show you to connect to a data source from scratch. So go to the Connect to data tab.
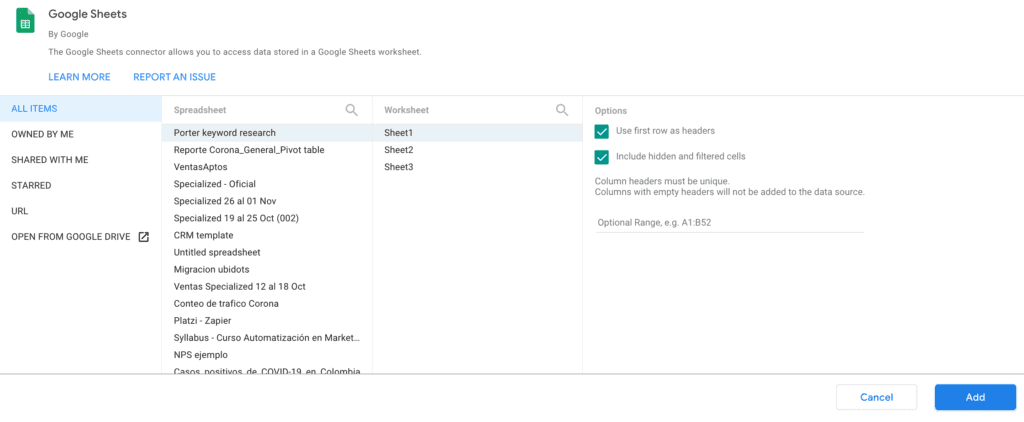
You need to sign up with Google to access every connector. For this example, I encourage you to use Google Sheets.
With all connectors, the first step is authorizing Google Data Studio to connect to a data source.
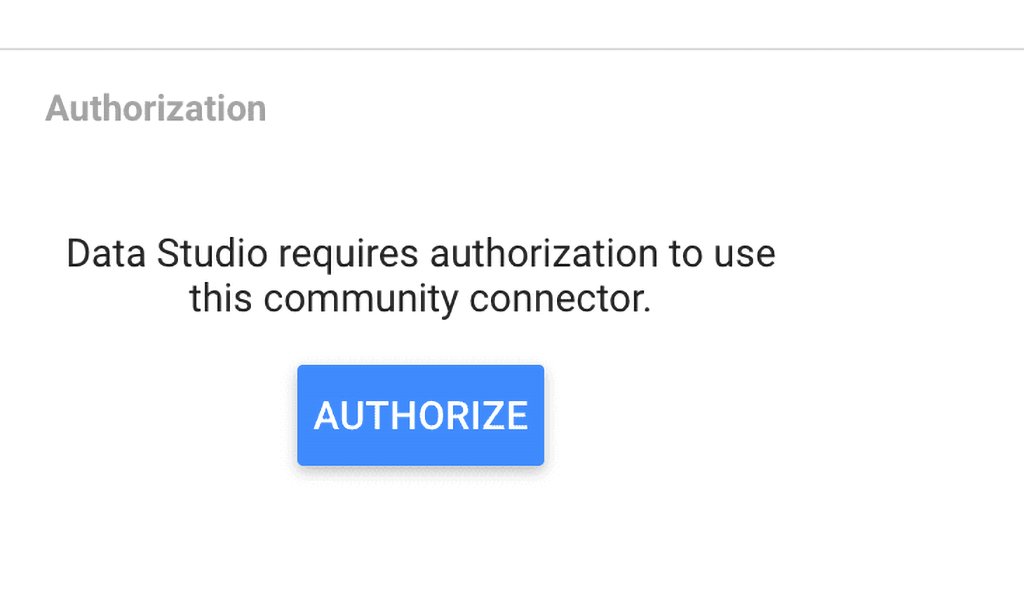
The following steps vary by each connector, so I’ll share with you some guides to set up different connectors:
In further lessons, we will create reports with all of these data sources. For this case, I will choose Google Sheets and pick any sheet. I want to show you the standard configurations you have for every connector.
Once you connect a sheet, you will see the data schema.
The data schema represents how Google Data Studio understands the type of data we’re bringing from a data source.
It also shows the possible configurations you can set up on a connector.
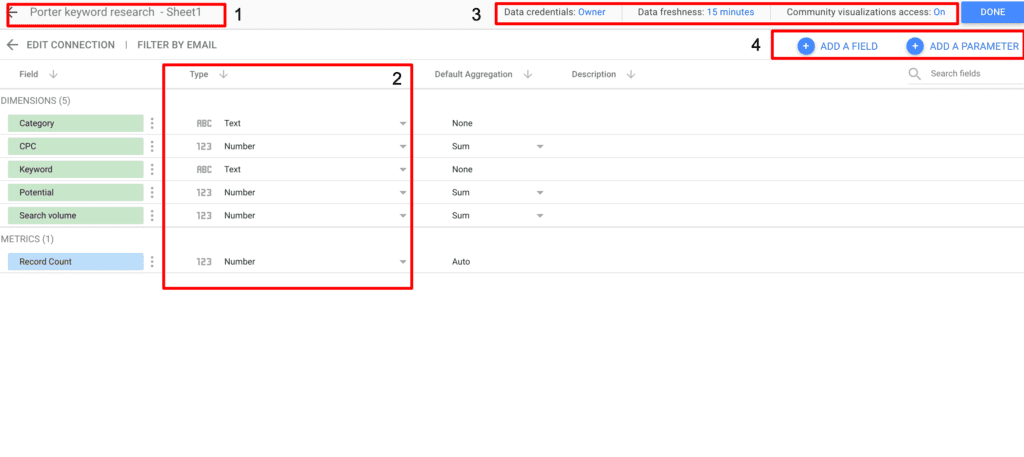
- you can click on the connector name to change it.
- You can choose the data type of each field. In this case, I may change CPC from a number to a currency, for instance.
- You can set up the permissions level, data freshness interval, and if you use community visualizations.
- You can create new formulas and parameters with your existing data, which we will cover in another lesson.
You will see all the data sources associated with one report if you click Done.
It means that you can connect and visualize multiple apps—say Facebook, Google Analytics, and Instagram—in the same report and pages.
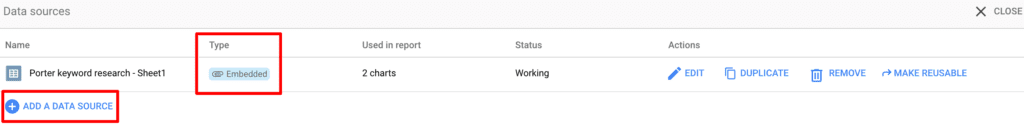
You will also see that your data sources can be embedded or reusable.
Reusable data sources, which are set by default once you connect your first data source, meaning that you can use them in other reports. So, if you do changes, create custom formulas, or add parameters, these changes will be applied if you add those sources in new reports.
With embedded data sources, on the other hand, changes are only applied to the current report. However, it allows other users to access the data schema to set up custom formulas, giving more flexibility and permissions.
Next lesson
In the next lesson, we will create our Google Data Studio account and will create our first report with Google Sheets! With it, you will understand the foundations of Google Data Studio and notice endless possibilities.
If you’re looking for a simple and efficient way to automate your marketing reporting, try Porter. We offer a 14-days free trial — no credit card needed.