
Marketing reporting made easy: Automated, code-free, and visually intuitive.

14-day free trial
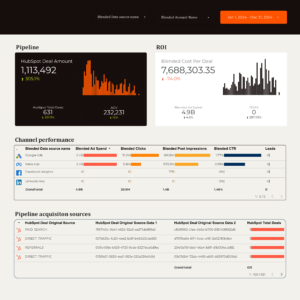
This guide will help you to set up Google Data Studio SEO report templates with Google Search Console data (like this one).
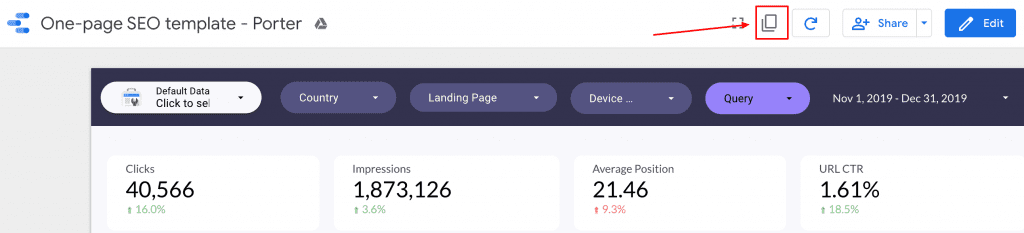
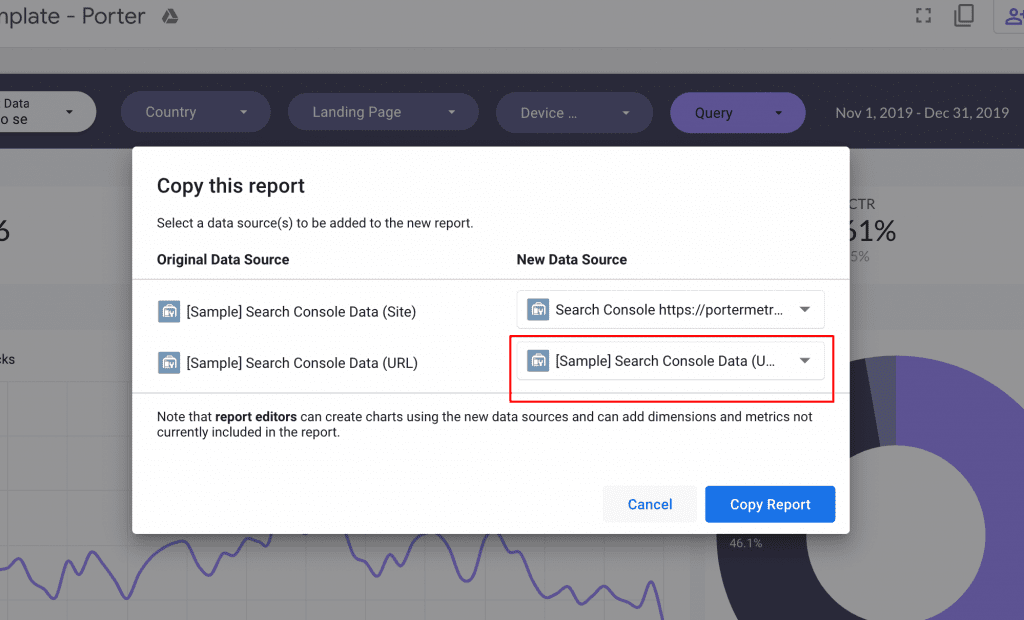
When accessing one of our Google Data Studio templates, click the copy icon located in the top-right corner of the page.
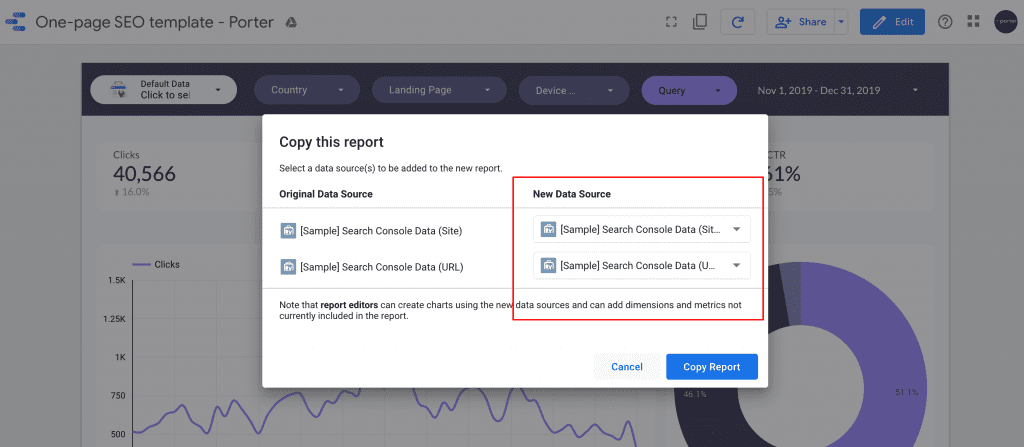
The modal shows you the original data sources of the template and the new ones that will be added.
In this case, this report requires two data sources.
Google Search Console connector has two instances: URL and Site.
We will explain their difference later.
Click the dropdown menu of the first data source.
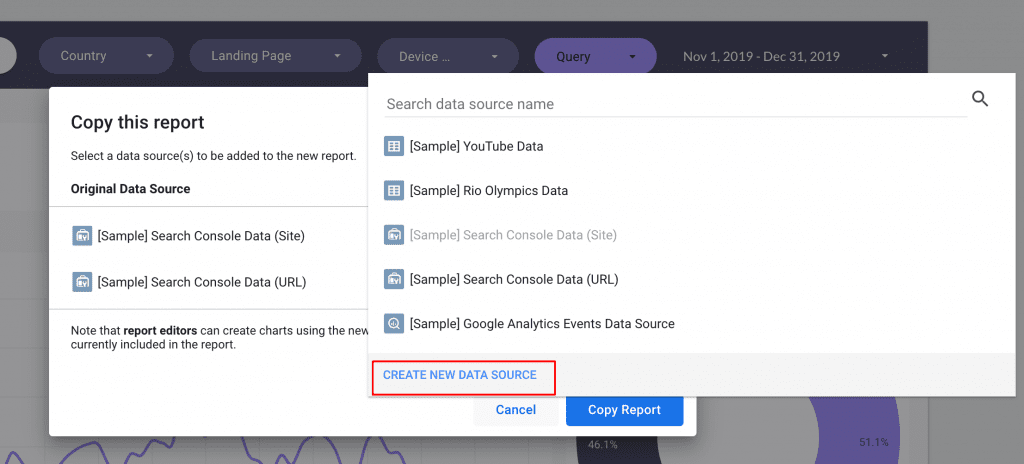
You will see a list of options you can connect to.
If you haven’t added the Google Search Console connector before, you should click “Create new data source.”
If it’s the first time you use Google Data Studio, you may need to sign up with a Gmail or Gsuite account.
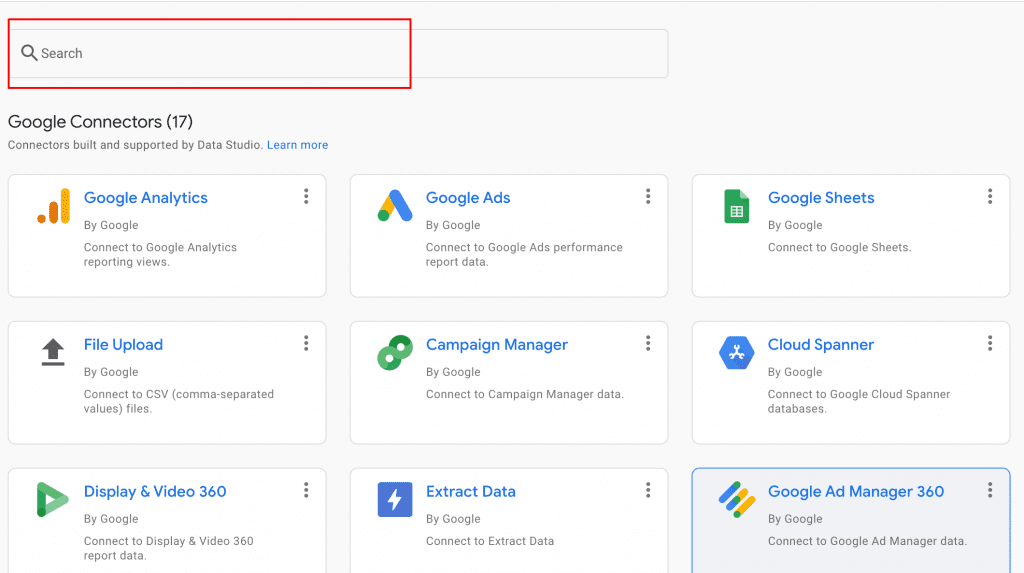
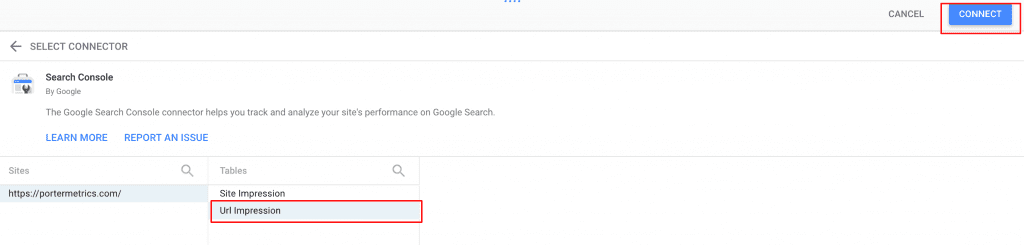
You will be re-directed to the Google Data Studio connectors library.
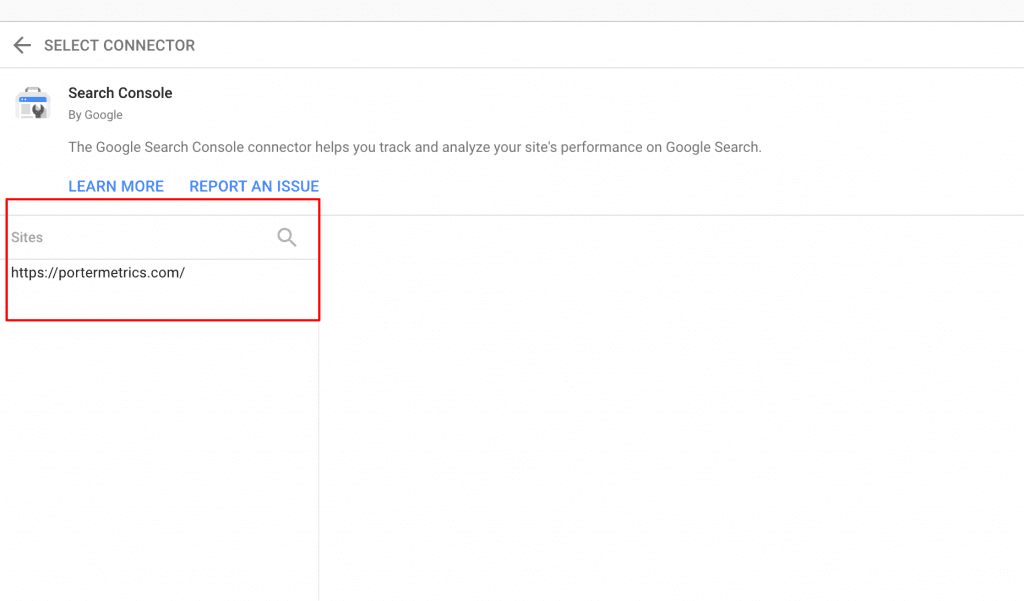
Look for Google Search Console and choose it.
If you don’t see any website, the email account you chose is not linked to any Google Search Console property or domain.
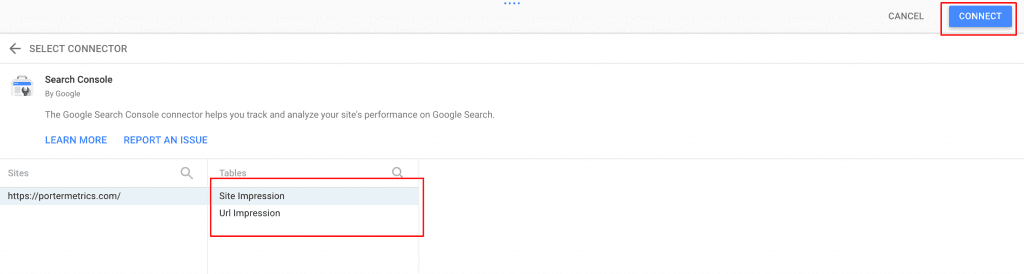
After choosing a website, pick “Site impression.”
We will pick “URL impression later.”
You might be wondering what makes them different.
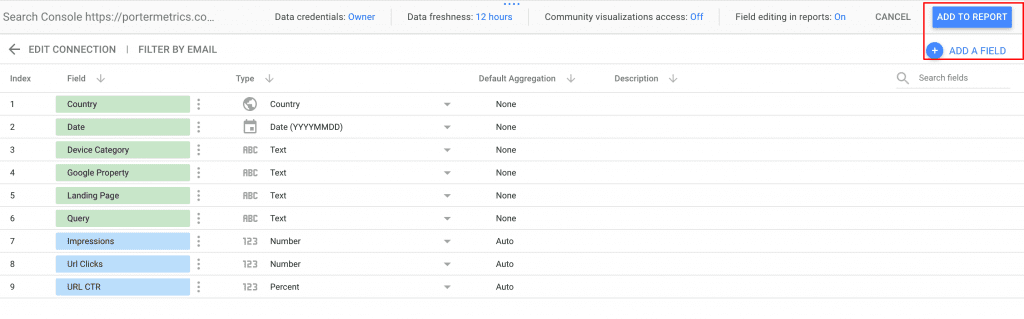
They offer different metrics; one is for site level, and the other one presents URL data.
The site table will show the overall site’s average position for a specific keyword; the URL table will show clicks and impressions broken down by webpages URLs.
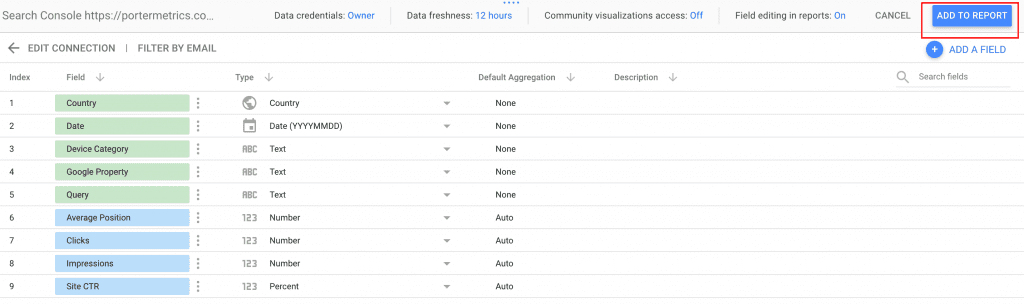
We don’t need to change anything here to set up the template – click “Add to report” on the top-right corner.
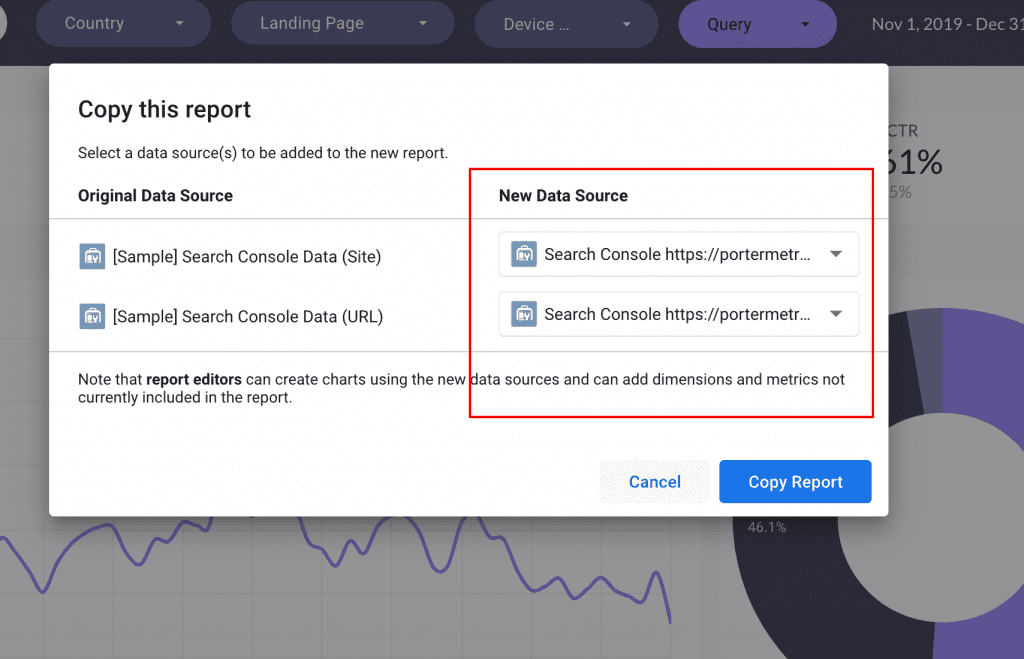
You will follow the same process to connect the second table (URL impression).
Again, choose Google Search Console, pick the same website and, this time, pick the “URL impression” table.
You will notice that the metrics offered by both tables are slightly different.
Once both new data sources tie the original ones, click “Copy report.”
Your template is almost done.
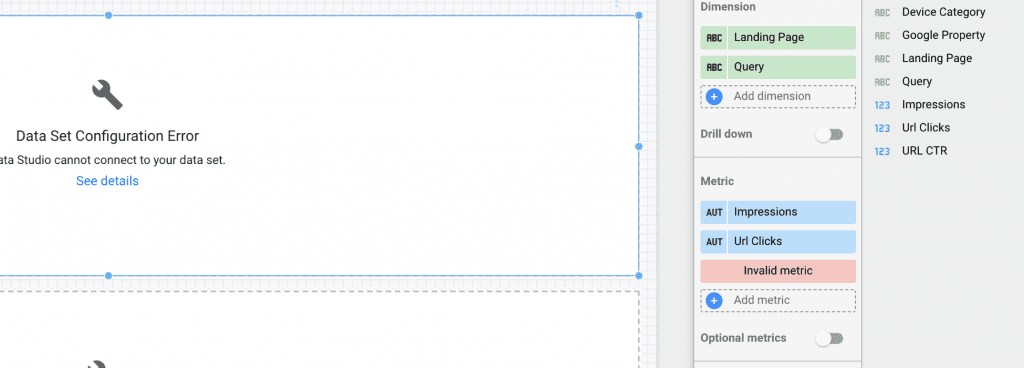
Now you should see your website data on the report, but some visualizations are missing.
We will fix this.
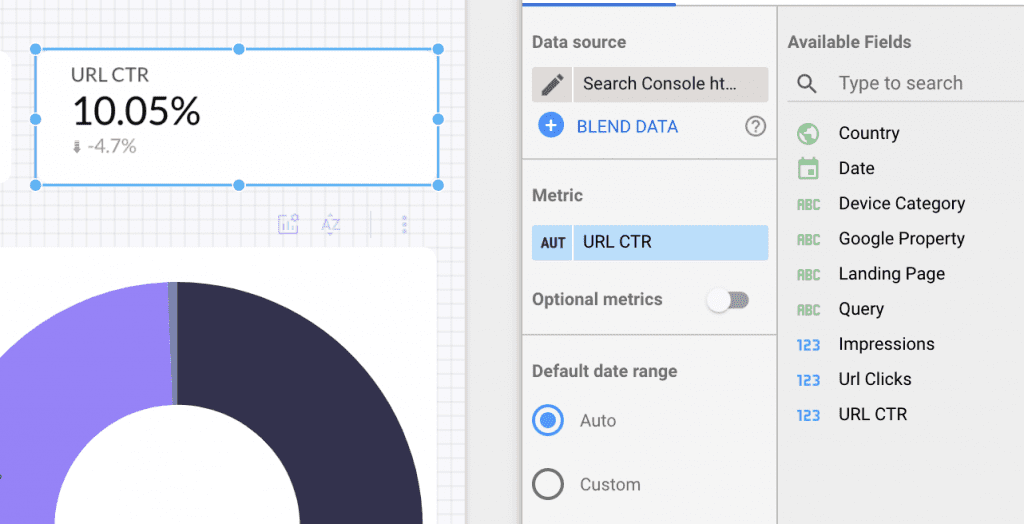
When clicking each defective visualization, you will see a panel on the right side displaying an “Invalid metric.”
Just hover it and remove it.
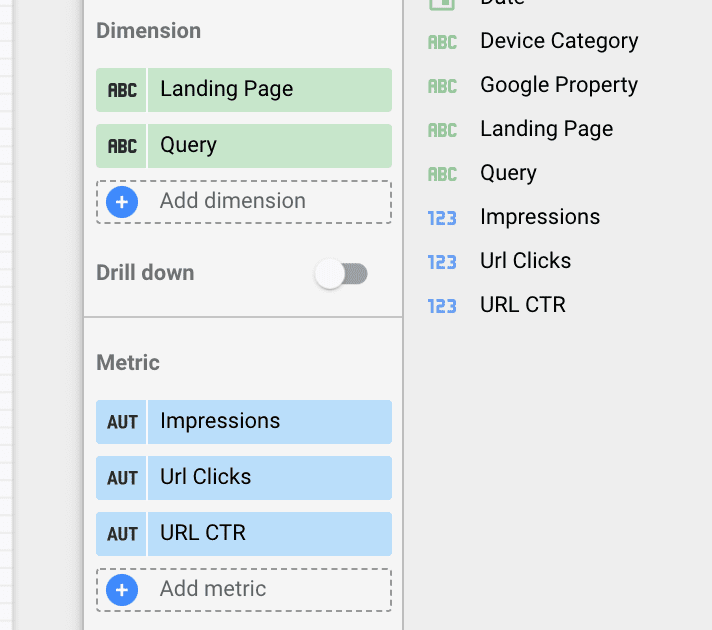
Now drag and drop the metric you want to visualize. For this template, you should choose URL CTR.
Repeat the same process with the following defective visualizations.
Remove the invalid metrics and drag and drop the ones you want to visualize.
And we’re done. 😊
We encourage you to subscribe to our spam-free newsletter to get our latest templates.
We’d love you apply as a beta tester for our Google Data Studio connectors.
Keep reporting,