


Save this guide on your email
We don’t spam.
Build a CRM dashboard with Google Data Studio and Google Sheets (for free)
If you don’t use your CRM (or you use one, but you hate its reports), this Google Data Studio + Sheets template is for you.
I promise this tutorial is super simple.
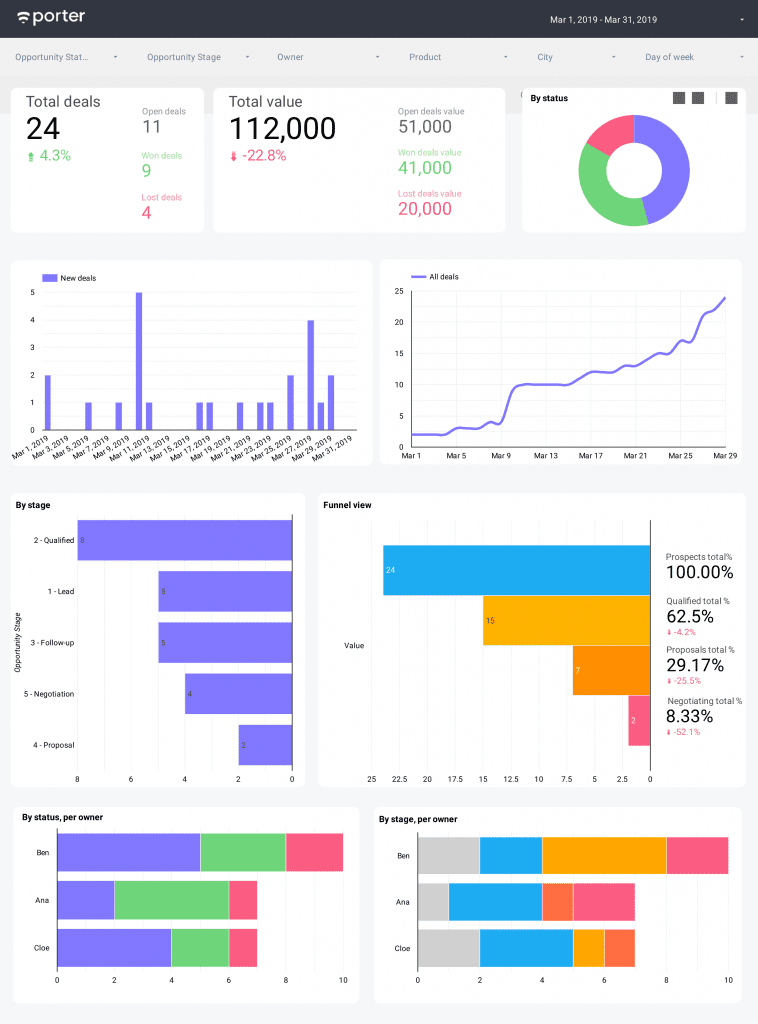
In a few minutes, you will have a CRM dashboard to track your business sales performance, just like this one below.
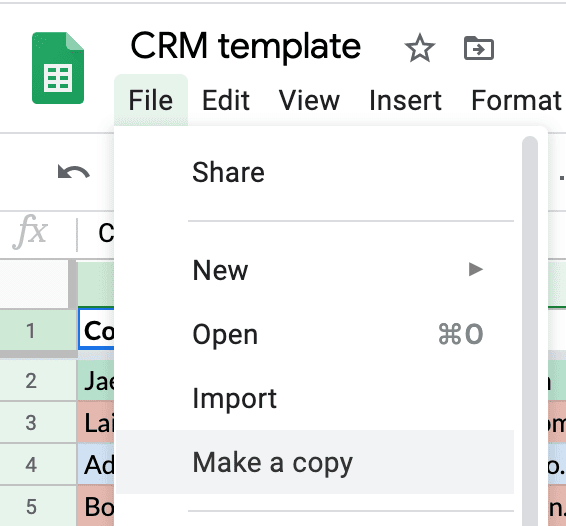
First, you will create a copy of this Google Sheet template.
Do not request access – create a copy.
Just go to File, select Make a copy, and name the new sheet however you like!
Perfect, we will go back to the Google Sheet in a moment to explain to you how it works, but first, we will create a copy of the Google Data Studio dashboard.
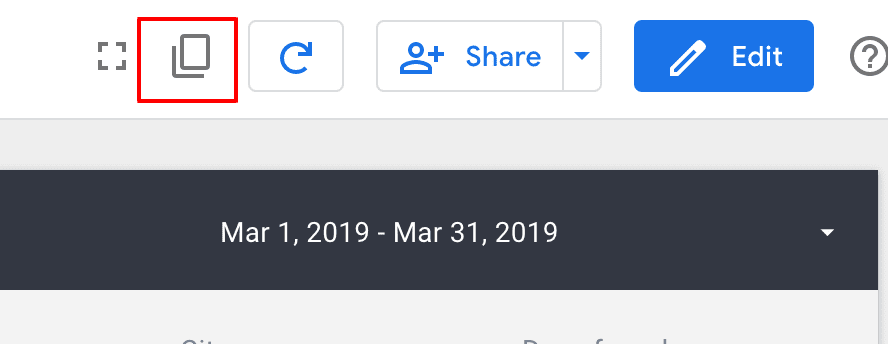
Now, open the Google Data Studio CRM template.
Click on the copy icon in the top-right corner of the Google Data Studio report template.
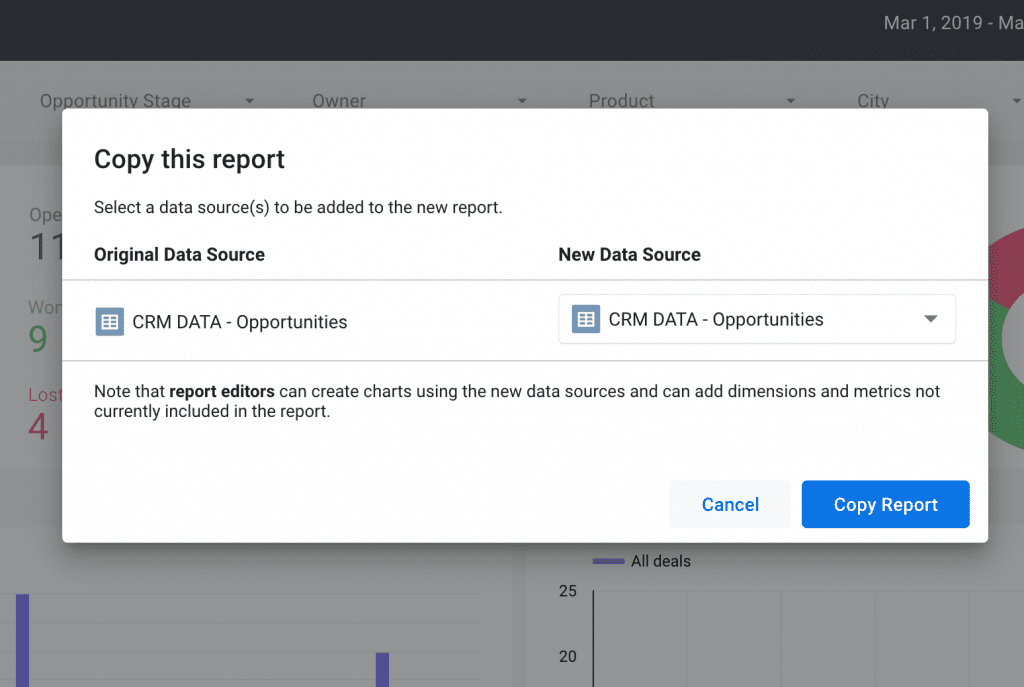
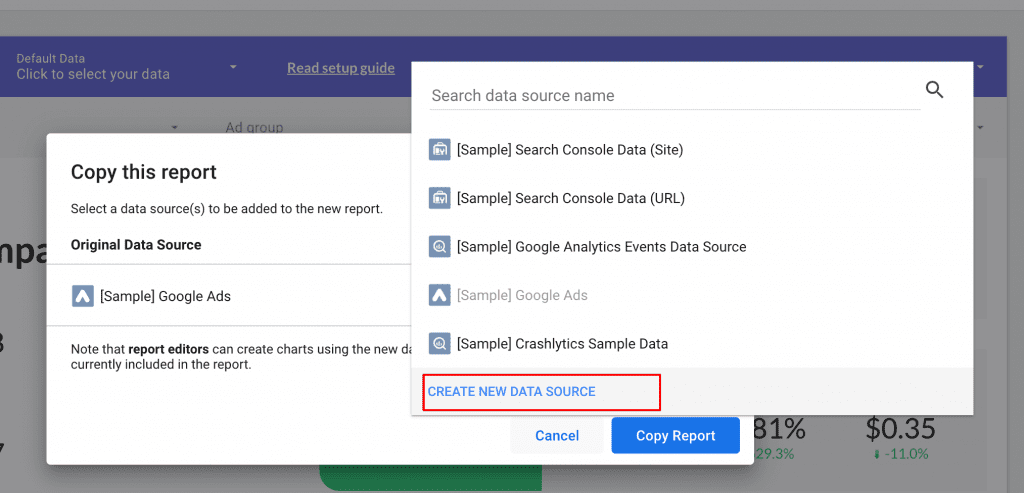
You will see a popup where you will connect the data source that will feed this dashboard.
Such a data source is the Google Sheet you’ve just copied.
To do so, click the dropdown menu below “New Data Source. “
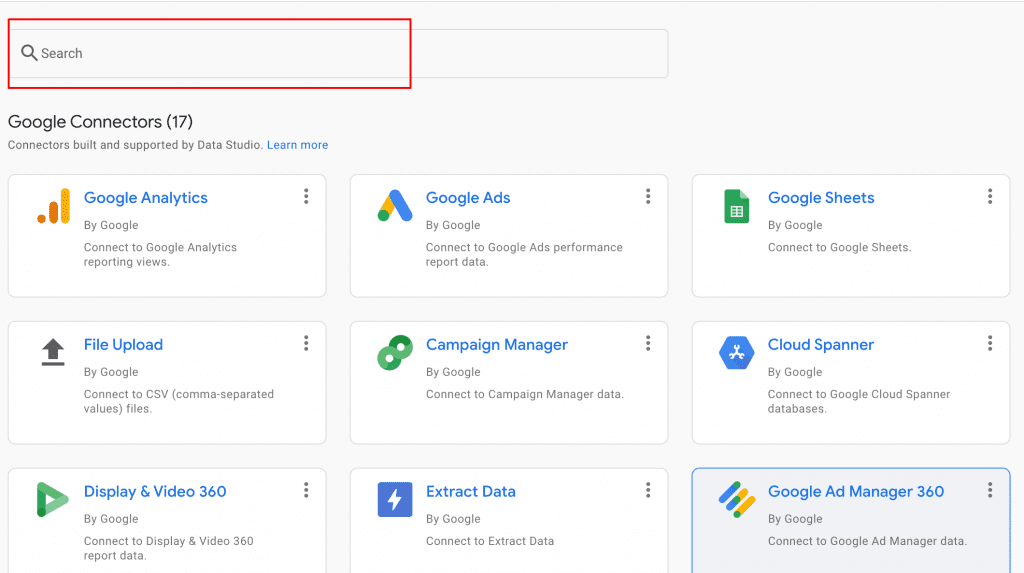
Now choose to Create New Data Source.
If it’s your first time using Google Data Studio, you will be asked to sign up first.
You will be asked to grant access to Google Data Studio to Google Sheets.
Once done, GDS will show all the belonging sheets to your Gmail or Gsuite account.
You should see the “CRM template” or “Copy of CRM template” on the top (that’s the copy you just created).
You will be asked to grant access Google Data Studio to Google Sheets.
Once done, GDS will show all the belonging sheets to your Gmail or Gsuite account.
You should see “CRM template” or “Copy of CRM template” on the top (that’s the copy you just created).
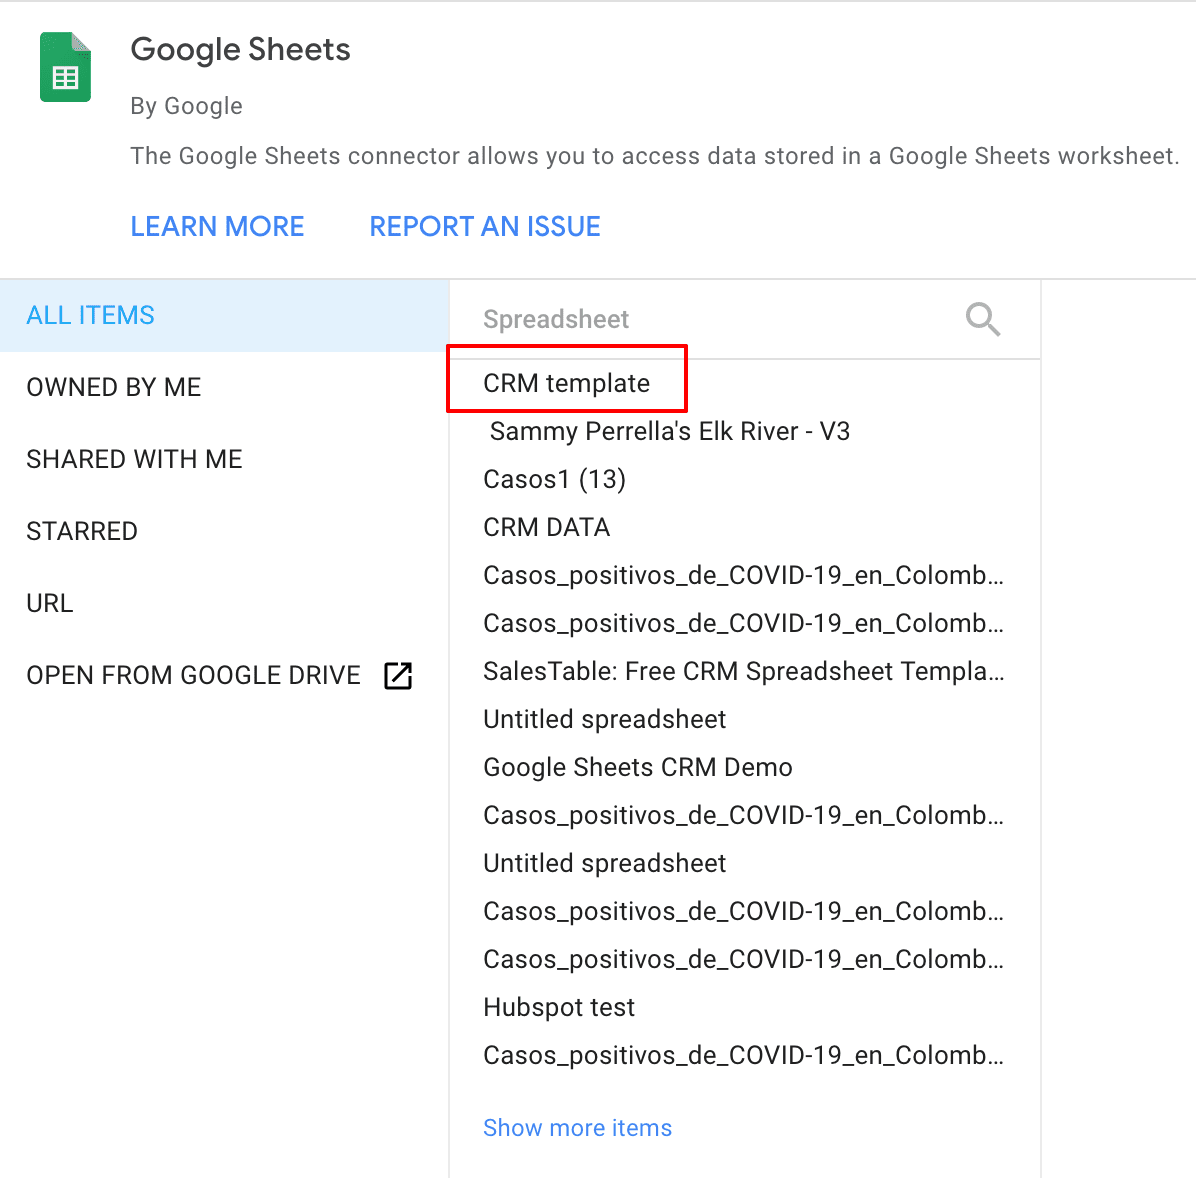
Click on that document and then choose the 1st worksheet (Deals).
Keep the default settings.
Now, click the Add button.
You will see a list of fields. Those fields are the metrics and dimensions that show as headers in the Google Sheets.
You may want to check that such fields have the correct type of data.
For instance, you may change $ Value from a number to the desired currency; also, you could shift City to a geographical type of data.
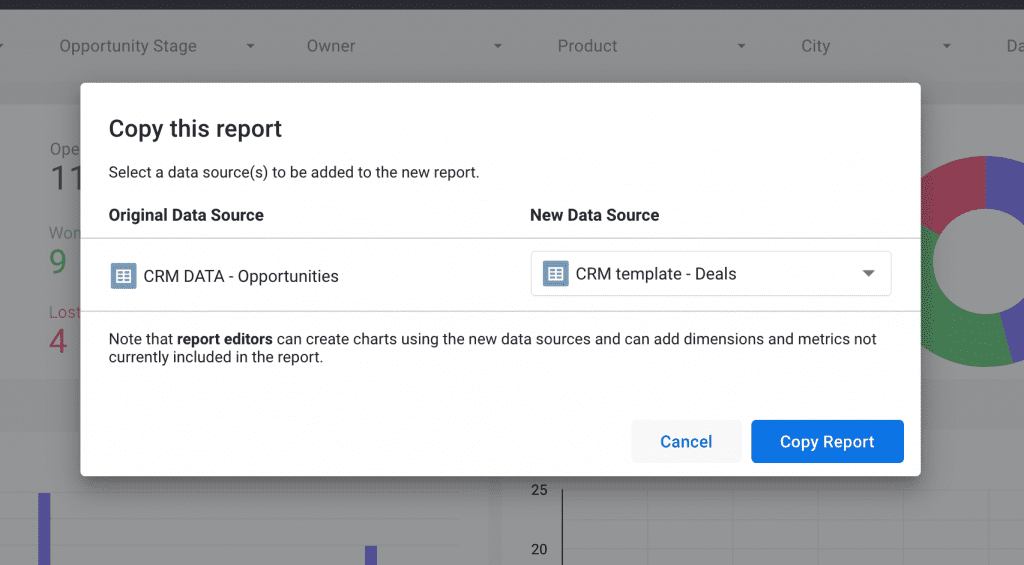
Finally, click “Add to report,” and you will see a popup showing you that the Google Sheet template is successfully connected.
Finally, click Copy report, and you’re done – you just created a copy of our template.
Now, you will learn how to use the Google Sheet to fill your leads and clients’ data.
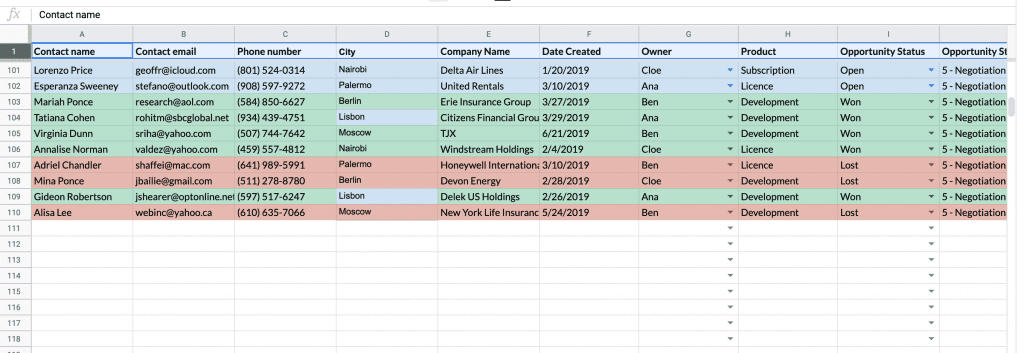
You need to remove the sample data.
We kept it there to let you see how it displays data in the dashboard.
You may want to change the opportunity stage because sales pipelines are different for every company.
That column has a dropdown menu to let you choose the opportunity stage.
You can change the options in the “Fields settings” tabs.
And we’re done. 😊
You need to manually add each deal in a new row and start tracking your sales performance in the Google Data Studio dashboard.
Since you're here
Now that we got your attention, here are some things that may interest you.
If you use a CRM like Hubspot, Pipedrive, Intercom (or any cloud CRM), we can help you automate your reporting on Google Data Studio.
I encourage you to check out our free Data Studio templates and our custom dashboard development services.
Thanks for visiting our site, we’re publishing a free template each week.